Assessment of Business ideas for the productive use of RE in Botswana
←
→
Page content transcription
If your browser does not render page correctly, please read the page content below
Integrated Southern Africa Business Advisory
(INSABA)

Assessment of Business ideas for
the productive use of RE in Botswana
Report for Deliverable 3.2 and 3.3

Prepared by BOTEC and Gerrit Jacobs, Solar International Botswana

Disclaimer:
The sole responsibility for the content of this report lies with the authors. It does not necessarily
reflect the opinion of the European Communities. The European Commission is not responsible
for any use that may be made of the information contained therein.
The authors endeavour to supply reliable analysis and believe that the material it presents is
accurate, however, they will not be liable for any claim by any party acting on such information.
Business ideas for productive use of RE in Botswana
Table of Contents
Table of Contents ........................................................................................................1
1. Identifying Business ideas for productive use of RE in Botswana ....................2
1.1 Process of identifying project ideas:..............................................................2
1.2 Development of business plans ....................................................................2
1.3 Financing of business ideas..........................................................................3
1.4 Implementation of business plans .................................................................3
1.5 RE Technologies in business ideas ..............................................................4
1.6 Replication ....................................................................................................4
2. Business Plans
2.1 Mobile photo & printing shop
- 2.2 Payphone charging
- 2.3 Vegetable farm with irrigation
- 2.4 Barber shop
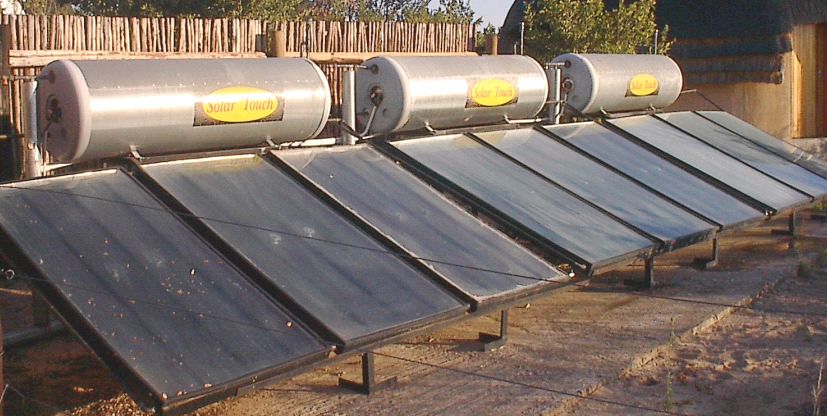
- 2.5 Khutse lodge with SWH
- 2.6 Mobile fruit juice vendor
INSABA Business ideas 1
Business ideas for productive use of RE in Botswana

1. Identifying Business ideas for productive use of RE in
   Botswana

1.1 Process of identifying project ideas:
Some of the initial business ideas had to be abandoned because they did reveal not
to be financially or technically feasible. For example the possibility of installing a solar
water pump in a horticulture project operated by a women’s group was considered.
Unfortunately this was not pursued further as CEDA, the then the only financing
partner in the project (as a member of IAT), does not finance projects owned by
cooperative organizations.

Another ideas followed was an Ostrich farm in Molepolole. However, it has been
established that the energy demand for this project is beyond the capability of solar
energy. The farm uses an incubator for hatching eggs. The farm has no electricity (it
would cost about 375K to connect to the grid) and as a result the incubator is kept in
the nearest village, Molepolole which is about 5km away.

It has been noted that INSABA services need to be marketed rigorously in the
country for entrepreneurs to consider RETs as useful alternatives to conventional
power. Although INSABA-BOTSWANA was advertised in both the media, responses
received were quite low. New partners like the Board of Trade and other vocational
training institutions should be involved.

1.2 Development of business plans
After some of the initial business ideas had to be abandoned for reasons as those
mentioned above, business plans have been developed with support if the IA Gerrit
Jacobs from Solar International Botswana. In order to systematically assess the
potential of business ideas, BOTEC developed project descriptions on business
ideas like barber shop, pay-phone charging, vegetable farm with irrigation, tourist
lodge with SWH, battery charging station, chicken farm lighting and PV pumping for
cattle farm. These business ideas were then discussed with potential SME-GS and
data were collected from existing businesses such as horticulture, barber shop, pay
phone. From this information complete business plans have been prepared for the
productive use of renewable energy in:

INSABA Business ideas                                                                    2
Business ideas for productive use of RE in Botswana

-        Mobile photo & printing shop

-        barber shop

-        payphone charging

-        vegetable farm with irrigation

-        Khutse lodge with SWH

-        Mobile fruit juice vendor

The development of business plans was considered a breakthrough. The plans
indeed support the concept of productive use of RETs.

1.3 Financing of business ideas
Many of the potential businesses assessed during the project would have been
involved in INSABA related projects if funding to purchase RETs systems was readily
available, particularly for very small businesses that require loans less than €1000.

It is understood that financial support is vital for any economic activity and that is why
there are banks and other financial institutions in place. This is mainly true, however,
for small and even medium enterprises because most of them start economic
activities for the first time (Start ups). Generally in most developing countries no
financial institutions are ready to give loans to small and medium sized start-up
enterprises. That is why financial considerations are generally part of RE-strategies.

1.4 Implementation of business plans
From all the INSABA-Botswana accepted business, only one i.e. the “Photoshop”
was realized in time e.g. before the official end of the INSABA-projects. The mobile
photo business, which is operating from the bus rank, has been Botswana’s INSABA
success story. The entrepreneur has now started to pay back the loan he acquired to
purchase the photo and solar PV equipment.

It can be stated however, that all projects are very likely to be put in action still 2008
or latest 2009.

The irrigation project could not be realized, because solar pumping presented
physical barriers to the project, but this, by no means, does not mean that Solar

INSABA Business ideas                                                                   3

Business ideas for productive use of RE in Botswana

Irrigation will not applied when better conditions are present e.g. a ground-water table
below 100 m.

The INSABA Fresh Fruit Juice Business was stopped by municipal authorities, as
sale of fresh food produced in the street for public consumption is not allowed for
health reasons. Though that type of business is quite frequent in other countries, it
can not be realized in Botswana for the time being.

1.5 RE Technologies in business ideas
One can observe a certain concentration by INSABA-Botswana on Solar-Energy
applications. This can be explained by the fact that solar applications are currently
the most supported and mature renewable energy applications in Botswana. From
the group of IATs, INSABA-Botswana worked closely together with the enterprise
Solar International Botswana (SIB) (Pty.) Ltd.

The circumstances are relatively obvious because Botswana is a relatively dry
country where Solar Energy applications have a fair chance in the local energy
market. Furthermore SIB advised INSABA-Zambia as consultant. This intervention is
understood by InWEnt as one of the INSABA success-stories. Additionally a very
fruitful cooperation between Botswana and Namibia started on the Solar-Energy field
as one further positive element in the South-South Cooperation.

Botswana has started investigations in the Biomass-sector1. Jatropha is a topic, but
might have few chances due to high water demand. Probably other autochthones oil-
containing plants may have a better chance to be used as bio-fuel.

1.6 Replication
Replication is important for INSABA type of projects. This could be possible if there
are several businesses that are running that other entrepreneurs can copy from.
Entrepreneurs should be encouraged to advise other entrepreneurs. It is very difficult
for individuals and organisations that do not, for instance, have vested interest such
as suppliers or manufacturers, to mentor entrepreneurs.

1
    The Feasibility study for the production and use of Biofuels in Botswana, EECG, Box 402339, Gabarone,
Botswana, E-Mail: pzha@global.bw

INSABA Business ideas                                                                                 4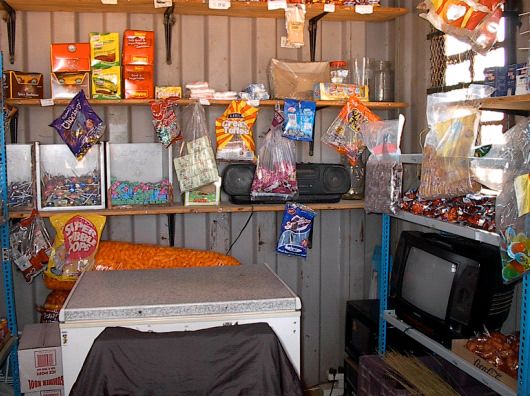
Business ideas for productive use of RE in Botswana

Organisations such as the Local Enterprise Authority should be lobbied to integrate
INSABAs way of business analysis in their functions. This would go a long way in
marketing the use of Renewable in businesses. BOTEC and Solar International
Botswana could lead this task.

BOTEC will also lead production of a manual with tools, who entrepreneurs can
contact for advice and where the advisors can be located. This will require advising
institutions to commit themselves that they will be available to assist entrepreneurs.

INSABA Business ideas                                                                    5
Mobile Photo Shop Business Proposal

 Business Description                                                      Draft: 31 August 2007
 Mobile Photo Shop business
 Proponent
 Arnold Tshwaranang Moleofi is a young motivated entrepreneur who is interested in running a
 mobile photo shop business. He has undergone a Business Studies course and has started a
 car wash financed through own resources, which is run by family members. He does not have a
 bank account but is considering opening one. Mr. Moleofi has no experience with formal loans
 but is well acquainted with cost calculations and marketing since this was part of his
 professional training.
 Location
 The photo shop business is mobile and can be located at shopping malls, bus ranks, train
 stations, public and sporting events and other locations where there is a likely market for selling
 photos.

Business Factors
In Botswana there are no mobile photo shops. Photo           Mobile photo shop services
shops operate from fixed locations in town centres.               Taking photos
However, there are people with instant cameras that               Printing photos A4, A5 and A6 size
mainly take passport photograph size photos.                      Laminating photos
                                                                  Making copies
The proposed mobile photo shop consists of a digital              Scanning documents
camera and a printer/copier/scanner, which are
located in a mobile stall. Photos are taken and are printed at the spot. The camera connects
directly to the printer, so there is no need for a computer. Other services that are provided are
indicated in the box on the right.

Since the business operation is entirely mobile, it can be
situated at a location where the market potential is highest. The
equipment is powered from a solar panel and battery.
Measurements of the printer show that the power consumption
when printing is approximately 300W and when on standby it is
approximately 25W. One 50Wp panel and one 100Ah battery
are sufficient to power the printer. The photos are laminated
using plastic foil, rather than a thermal process because of the
limited energy that is available from the solar system.

The primary business activity is taking photos. However, the
printer has copying and scanning capabilities, therefore these
services are also offered.

The photographer will offer different backgrounds for photos
such as the Eiffel Tower and Statue of Liberty when taking
photos. There will also be life size cut-out pictures of popular
soccer and movie stars.

                                                                                                        1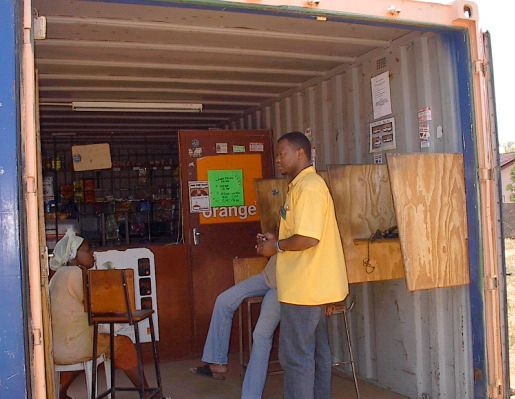
Pre-Assessment
The general feasibility of the business idea is established in a pre-feasibility assessment. An
estimation of business requirements and costs is given in the following sections.

 Inventory:         P1,310     Stall on wheels, chair, umbrella, stand, studio curtains, life size
                               cut-outs
 Equipment:         P2,770     Camera and printer/copier, memory card, camera stand
 Solar system:      P3,660     1x 50Wp solar panel, 1x100Ah battery, Regulator, AA Battery
                               charger, Inverter
 Advertising        P1,200     Advertising display, price list, business cards
 material:
Total equipment cost is P8,940. Furthermore, there are variable costs such photo paper,
photocopying paper, laminating foil, and printing ink.

Production:
A quick estimation of the required number of photos is based on the following parameters.

Operator income                 1,000 P/month
Payback                           750 P/month
Income to be generated          1,750 P/month

Days working per month             25 Days/month
Profit to be made per day          70 P/day

Selling price per photo            15 P/photo
Expenses per photo                 10 P/photo
Profit per photo                    5 P/photo

Photos to be made                  14 Photos/day

The highlighted parameters are variables. The expense per photo is an estimate. Based on the
above figures, the operator has to sell 14 photos per day (300 days per year) to cover expenses
and pay back the investment.

Operational expenses:
 Variable costs that are accounted for in the unit cost.
 Storage space is rented for the equipment. Estimated costs P50/month.
 The salary of the operator is P1000/month.
 Insurance of equipment is P110/month.

Investment live span is taken as 5 years. The solar panels have an estimated life span of 20
years but the other equipment such as the camera and printer have a life span which is
considerably less.

Table1 (pre-assessment) contains all above data. Sensitivity analysis using data in Table 1
shows the impact of the various cost factors. Most sensitive elements are price per unit and cost
per unit. A sensitivity analysis has been carried out using the goal seek function in Excel. When
selling 10 photos per day, the payback period is 1 year with ROI of 80%, whereas selling 15
photos per day gives a payback period of ½ year and ROI of 180%. However, selling 9 photos
per day gives a ROI of 30% and a payback period of 2 years. It can be concluded that the
proposed business has the potential of being profitable.

                                                                                                     2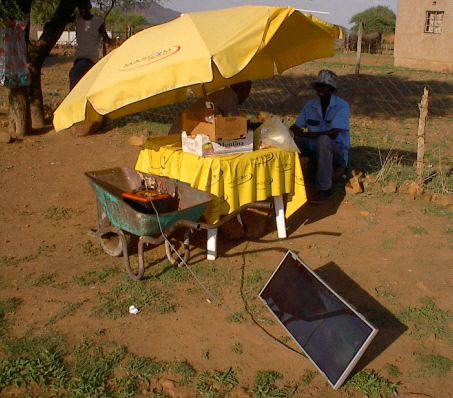
Market Assessment
There are currently no mobile photo shops operating in the country. Having a mobile photo shop
has a great advantage over a shop that has a fixed location since a market can be established
at a place where it has the highest potential for success e.g. near the National Stadium during
popular football matches.

The entrepreneur has interviewed owners of photo shops to obtain an idea of possible turnover
and selling prices of photos. He has also interviewed persons that take photos with instant
cameras and it appears that producing 10 photos per day with an average selling price of P15
per photo is achievable.

Apart from being mobile, it is believed that this business format has another positive edge
compared to a business at a fixed location. Taking photos of people next to a life size cut-out of a
movie star or soccer player will attract the attention of people and form a crowd, boosting the
number of photos that are taken.

Table 2 shows a comparison between the photo business using a solar system and the same
business recharging the battery from grid electricity through a commercial operator. In this
situation there is a reduced investment capital since there is no solar equipment required. Also
there is less equipment to insure and therefore the insurance cost goes down (P600/year).
However, due to the deeper discharge of the battery and the higher boost charge from grid
electricity, the battery lifetime is reduced. This has been accounted for (annual replacement cost
P500, instead of P350). The cost of charging the battery, including transportation is estimated at
P20 per charge. The comparison shows that it is more cost effective to charge the battery from
grid electricity through a commercial operator. The higher ROI is caused by the reduced cost of
charging the battery. The cost of the solar technology is much higher compared to the recurrent
cost of charging the battery and therefore has a negative impact on the ROI. However, it should
be noted that charging the battery every two days is very cumbersome since the battery has to
be dropped off in the evening and collected in the morning. If not, two batteries are required. Also
there are few places where batteries can be charged and transportation costs will be high and
there is an opportunity cost associated with the time that it takes to charge the batteries.

Operational Plan
The business strategy relies on the mobility of the business and the ability of printing photos
instantly. The business should be run in a professional manner in order to succeed. The operator
should wear a branded uniform and the stall should look neat.

Table 3 gives the cash flow during the first three years of operation. The cash flow analysis
indicates clearly, how much financing would be required. Under the prevalent conditions, capital
infusion of P8,940 would be sufficient. The graphs visualize this business development for the
first year, and for three years, respectively.

Note that making copies has been added as a second income stream.

Finally, Table 4 gives the profitability forecast and balance for the business start-up.

                                                                                                   3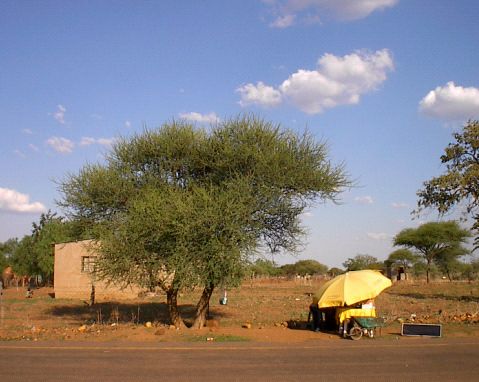
From the Sensitivity Analysis below it becomes clear that the average selling price of a photo,
number of photos sold, as well as the variable cost, being the cost of photo paper, photocopy
paper, laminating foil, and printing ink, are the most critical success/failure factors.

                                           Sensitivity Analysis
                            150%
                                                                          Capital Investment
                            100%
 percentage change of ROI

                                                                          Investment Lifespan

                             50%                                          Units/annum

                              0%                                          Price/unit
                                    -20%   -10%     0%      10%     20%
                                                                          Variable cost of sale/unit
                            -50%

                                                                          Cost of energy/unit
                            -100%
                                                                          total fixed costs
                            -150%
                                       percentage change of parameter

                                                                                                       4
Table 1: Pre-Assessment of the Mobile Photo Shop business described above
INSABA Preassessment of Project Proposals
Country: Botswana
Pilot Region: Gaborone / Main Mall
RE Technology: Solar PV Electricity
Mobile photo, copying and laminating
Business Idea: busines
Proponent name, contact Mr. Arnold Tshwaranang Moleofi
Years of experience as owner of business 1
Number of employees w/contract 1
Proponent uses bank acount (yes=5, No=0) 0
Experience with formal loan (received=5, applied=3, no=0) 0
(no=0, several=5)
Experience in cost calculations, business plans 5
Practice in maintaining/operating equipment (RET) (none yet=0, regularly=5) 3
Total 10
Calculation of ROI
Photo Shop BWP Determination of parameters Definitions
Stall on wheels, chair, umbrella, stand, studio
Investment Capital 1,310.00 Inventory
curtains, life size cut-outs
Camera and printer/copier, memory card, camera
Investment Capital 2,768.90 Equipment
stand
1x 50Wp solar panel, 1x100Ah battery, Regulator,
Investment Capital 3,659.95 PV solar system
AA Battery charger, Inverter
Investment Capital 1,200.00 Advertising material Advertising display, price list, business cards
Investment Capital 8,938.85 Total of stall, inventory, equipment and PV Total cost of investment
Investment Life of the investment - i.e. period before it must
5 Conservative average life
Lifespan be replaced
Photos 10 Photos per day
Production 3000 Photos per year Operational 300 days per year
Price/unit 15.00 Average sales price per photo
Revenue 45,000 BWP This is net revenue
Cost per unit produced e.g. material, processing
Variable cost/unit 7.20 Average cost per photo
packaging
Cost of energy/unit 0 No other energy Costs of power, fuel added to variable cost
Rent for storage space to store the table, chair
Fixed cost 600 Rent
and umbrella
1320 Insurance of equipment
Fixed cost 350.00 Battery replacement Battery replaced once every 2 years
0.00 Salary for employee Wages
Fixed cost 12,000.00 Salary for owner/operator Wages
Annual indirect costs such as rent, telephones,
Total fixed costs 14,270.00
salaries
Amount needed per unit to cover investment in
Amortization/unit: 0.60 1,788
lifetime
Direct costs per Variable costs plus amortization plus cost of
7.79 23,376
unit: energy
Gross Margin/unit 7.21 Sales price per unit less the direct costs per unit
Total fixed costs divided by the number of units
Fixed costs/unit 4.76
produced
Total costs 12.55 37,646 Direct costs plus fixed costs
Net Margin 2.45 7,354 Revenue less total costs
Return on Investment = net margin divided by
ROI 82%
capital investment
Payback period capital investment divided by cash flow until intial
0.98
years expenses are compensated by the net margin
5Table 2: Competitive Analysis: Comparison between the mobile photo shop business using solar
PV electricity and the same business recharging the battery from grid electricity
INSABA Verification & Market-Assessment of Project Proposals
Country: Botswana
Pilot Region: Gaborone
RE Technology: Solar PV Electricity
Business Idea: Mobile photo, copying and laminating business
Market Context : describe
Market Size & Potential There are no mobile photo shops in Gaborone. Due to the mobility of the shop the
entrepreneur can go to places where the likelyhood of a sufficient market is highest.
This model can be replicated for any locations in Botswana, where there is sufficient
market. If more photos per day are required, an additional solar panel may be added to
supply the energy.
Market Need, Risk There is a risk that the Town Council will not allow the photo shop to operate at plublic
places.
Competitor There are a number of people operating with instant cameras. There is also cometition
from people working from fixed locations.
Competing Technology See above
Appropriateness of RET
Because the photo shop is powered by solar energy, it makes it mobile. Shop can
operate in villages where there is no grid electricity.
Market Segment
Photo shops with grid electricity may operate cheaper. Risk of RE system being stolen.
Main Differentiator Ease of operation since there is no need for recharging the battery using grid electricity.
The shop is mobile.
Sustainable Production Battery needs recycling but this also applies to system that does not use RE.
Photo shop charging on grid electricity
Calculation of Competitiveness Compared to photo shop with solar
Photo shop Alternative: no solar Description of Alternative
Investment Capital 8,939 5,279 Photo shop charging battery with grid electricity
Investment
Lifespan
5 5 Lifespan of equipment
Production 3,000 3,000 Production is not effected by energy source
Price/unit 15.00 15.00
Revenue 45,000 45,000 BWP
Variable cost/unit 7.20 7.20
Cost of energy/unit 0 1.00 Battery is charged once every 2 days at a cost
of P20 per charge, including transportation
Wages, rent and replacement costs are not
Fixed costs 13,700 13,700 effected by how the battery is charged
Total fixed costs 13,700 13,700 Total fixed costs
Amortization/unit: 0.60 1,788 0.35 1,056
The higher ROI is caused by the reduced cost
Direct costs per of charging the battery. The cost of the solar
7.79 23,376 8.55 25,644 technology is much higher compared to the
unit:
recurrent cost of charging the battery and
Gross Margin/unit 7.21 6.45 therefor has a negative impact on the ROI.
However, it should be noted that charging the
Fixed costs/unit 4.57 4.57 battery every two days is very cumbersome
since the battery has to be dropped off in the
Total costs 12.36 37,076 13.11 39,344
evening and collected in the morning. If not,
Net Margin 2.64 7,924 1.89 5,656 two batteries are required. Also there are few
89% 107% places where batteries can be charged and
ROI
transportation costs will be high and there is an
opportunity cost associated with the time that it
Payback period
0.92 0.79 takes to charge the batteries.
years
6Table 3: Cash Flow Analysis
Month-1 Month-2 Month-3 Month-4 Month-5 Month-6 Month-7 Month-8 Month-9 Month-10 Month-11 Month-12
Cash Flow Analysis Year 1 Year 1 Year 1 Year 1 Year 1 Year 1 Year 1 Year 1 Year 1 Year 1 Year 1 Year 1
Products Sales
Photos 3000 250 250 250 250 250 250 250 250 250 250 250 250
Copies 1500 125 125 125 125 125 125 125 125 125 125 125 125
Product 3 0 0 0 0 0 0 0 0 0 0 0 0
Cash Inflow
Turnover Price
Photos 15.00 3,750 3,750 3,750 3,750 3,750 3,750 3,750 3,750 3,750 3,750 3,750 3,750
Copies 2.00 250 250 250 250 250 250 250 250 250 250 250 250
Product 3 0 0 0 0 0 0 0 0 0 0 0 0
TOTAL Turnover 4,000 4,000 4,000 4,000 4,000 4,000 4,000 4,000 4,000 4,000 4,000 4,000
TOTAL Cash Inflow 4,000 4,000 4,000 4,000 4,000 4,000 4,000 4,000 4,000 4,000 4,000 4,000
Cash Outflow
Material Cost
Photos 7.20 1,799 1,799 1,799 1,799 1,799 1,799 1,799 1,799 1,799 1,799 1,799 1,799
Copies 1.00 125 125 125 125 125 125 125 125 125 125 125 125
Product 3 0 0 0 0 0 0 0 0 0 0 0 0
TOTAL Material 1,924 1,924 1,924 1,924 1,924 1,924 1,924 1,924 1,924 1,924 1,924 1,924
Overhead Cost
Staff A share 12,000.00 1,000 1,000 1,000 1,000 1,000 1,000 1,000 1,000 1,000 1,000 1,000 1,000
Staff B share 0.00 0 0 0 0 0 0 0 0 0 0 0 0
Storage rent 50.00 50.00 50.00 50.00 50.00 50.00 50.00 50.00 50.00 50.00 50.00 50.00 50.00
Repairs&replacement 350.00 29.17 29.17 29.17 29.17 29.17 29.17 29.17 29.17 29.17 29.17 29.17 29.17
Insurance 1320 110.00 110.00 110.00 110.00 110.00 110.00 110.00 110.00 110.00 110.00 110.00 110.00
Marketing 0 0 0 0 0 0 0 0 0 0 0 0
Investment 8,939 0
Investment Lifespan 5
TOTAL Overhead 10,128 1,189 1,189 1,189 1,189 1,189 1,189 1,189 1,189 1,189 1,189 1,189
Capital cost
interest, redemption 16% 310 310 310 310 310 310 310 310 310 310 310 310
TOTAL capital 310 310 310 310 310 310 310 310 310 310 310 310
TOTAL Cash Ouflow 12,362 3,423 3,423 3,423 3,423 3,423 3,423 3,423 3,423 3,423 3,423 3,423
Operating Result -8,362 577 577 577 577 577 577 577 577 577 577 577
/accumulated -8,362 -7,785 -7,209 -6,632 -6,055 -5,479 -4,902 -4,325 -3,749 -3,172 -2,595 -2,018
Capital input 8,939
Cash Flow 577 1,153 1,730 2,307 2,884 3,460 4,037 4,614 5,190 5,767 6,344 6,920
7Cash Flow Analysis: First Year
60,000 8,000
6,000
50,000
4,000
40,000 2,000
0
30,000
-2,000
20,000 -4,000
-6,000
10,000
-8,000
0 -10,000
Month-1 Month-2 Month-3 Month-4 Month-5 Month-6 Month-7 Month-8 Month-9 Month-10 Month-11 Month-12
TOTAL Cash Inflow, acc TOTAL Cash Outflow, acc Operating Result Operating Result, acc Cash Flow
8Cash Flow Analysis: 1st - 3rd Year
60,000 25,000
50,000 20,000
40,000 15,000
30,000 10,000
20,000 5,000
10,000 0
0 -5,000
Year 1 Year 2 Year 3
TOTAL Cash Inflow TOTAL Cash Outflow Operating Result Operating Result, acc Cash Flow
9Table 4: Profitability and Balance Forecast
Profitability Preview Balance
Year 1 Year 2 Year 3 Year 1
Sales 48,000 48,000 48,000 Assets Liabilities
Cost of Sales 23,088 23,088 23,088 fixed assets 7,151 shareholders equity 8,112
Gross profit 24,912 24,912 24,912 current assets 6,920 liabilities 5,959
other operating income 0 0 0 S 14,072 S 14,072
personnel costs 12,000 12,000 12,000
hire charges 0 0 0 Year 2
communication 350 350 350 Assets Liabilities
vehicle 1,320 1,320 1,320 fixed assets 5,363 shareholders equity 16,225
marketing 0 0 0 current assets 13,841 liabilities 2,980
office 600 600 600 S 19,204 S 19,204
interest 742 742 742
depreciation 1,788 1,788 1,788 Year 3
other expenses 0 0 0 Assets Liabilities
TOTAL Expenses 16,800 16,800 16,800 fixed assets 3,576 shareholders equity 24,337
annual surplus/deficit 8,112 8,112 8,112 current assets 20,761 liabilities 0
/accumulated 8112.31 16224.61 24336.92 S 24,337 S 24,337
10Business Proposal Barber Shop
Business Description
Payphone Business Draft: 1 April 2007
Proponent
Mr. Moshe Makhweni has two years experience as the owner of the payphone business. He
operates as the proprietor/operator and works part-time in the business. He has one employee
who works most of his time in the business. The business has a hawker’s license from the
Gaborone City Council. As such, the business obtained a free space that is registered with the
Council. Mr. Makhweni has completed form five at Masunga Senior Secondary School. He
does not hold a bank or savings account and does not have experience in obtaining loans.
Location
The payphone business is locates at the Main Mall in front of the Lewis store, in the centre of
Gaborone. There is no mains electrical connection.
Business Factors
The payphone business provides national and international phone services to the general public.
A payphone is a telephone that operates on the cellular network and of which the operating cost
is monitored on a digital display.
The customer that makes the
phone call is charged per unit. The
payphone operator buys the units
from a representative of the
cellular network provider. Since
there are two cellular network
providers in Botswana (Mascom
and Orange), the operator has two
different sets of payphones. This
is necessary since phoning from
one network to the other is more
costly than phoning within the
same network. Modern payphones
have Mascom, as well as Orange
simcards incorporated that are
accessed automatically,
depending on which network is
dialed.
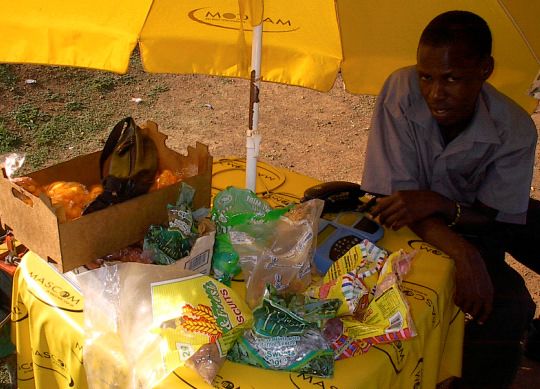
The business is strategically located with high exposure to people shopping at the Main Mall. The
business is situated under an umbrella that is provided by Masom. Apart from providing shade, it
advertises the business, since Mascom is a strong brand in Botswana.
The system uses a 45Ah car battery to supply power to the two
payphones. Large crocodile clips are used to connect the payphones to
the battery, which allows for reversing of the polarity. The uncovered
battery is potentially dangerous and should be placed in an appropriate
box. The battery is very much oversized for the system and is old and
badly maintained. The battery is charged once every two weeks at a
230VAC mains battery charging station, at a cost of P5.- (approx.
US$0.90) per charge. The business does not have lights or a radio
connected to the battery, although this may attract additional customers.
1Sales of Mascom and Orange scratch cards, and selling sweets and cigarettes generate
additional income.
The business is open 6 days per week from approximately 9am to 18.00am
Pre-Assessment
The payphone business is an existing and operational business. It has proven to be feasible and
sustainable. This exercise serves as an assessment to determine if similar payphone businesses
may be feasible in other areas and to determine what the most important success and failure
factors may be.
From the operational experience, the following facts are known:
Cost of:
Inventory: P600 Chairs, table, umbrella with stand
Equipment: P3,500 Payphone systems
Solar system: P530 7Wp solar panel and battery
Production:
The average number of phone calls per day is estimated by the operator to be 50.
Price per phone call national: P1.- per unit, international P3.50 per unit.
No detailed records are kept of units sold and bought. However, it is known that the average
profit on the sale of units is P78 per day. Working backwards this gives an average income
per phone call of P3.56.
Operational expenses:
The average cost per phone call is P2.-.
Storage space is rented for the chairs, table and umbrella. This costs P50/month.
The cost for repairs of the payphone system, handset, and bi-annual replacement of the
battery is estimated at P550 per year.
The salary of the employee is P750/month.
The owner does not work fulltime in the business. His salary is determined using the goal
seek function. His salary can be P950 per month for a ROI of 30%. However, this amount
generates a negative cash flow in tool 3 since the cost of interest and redemption is taken
into account in this tool. Therefor the salary of the owner is taken as P750/month in tool 3.
The pre-assessment table1 contains all above data. Sensitivity analysis with table 1 shows the
impact of the various cost factors. Most sensitive elements are the cost per unit for the telephone
calls and the number of phone calls per annum.
Market Assessment
The payphone business is operated in a sustainable way, since it has been in operation for two
years. However, over the last years there has been a considerable increase in similar businesses
and competition is fierce. About six more payphone businesses operate at the vicinity, over a
stretch of 500 meters at the Main Mall. It appears that the market in villages is under served.
While most villages in Botswana have cellular network reception, there are not many payphones
operational. The reason could be the lack of charging facilities for the battery. This is easily
overcome by using a small solar panel. Operating in villages has two benefits: due to less
competition there are more clients per payphone operator and the charges for the phone calls
can be higher. From the financial analysis it can be observed that profitability is highly sensitive
to these factors. Since the payphone business if very mobile, operators can easily move to
places where there is a better market potential. The payphone operator also sells for
approximately P400 scratch cards per day. The profit is 10% per card, which results in an
additional income of P40.- per day. Profit on the sales of sweets and cigarettes is approximately
P10.- per day. Additional income may be generated by charging cellphones and small
rechargeable NiMeH batteries.
2Table 2 shows a comparison between the payphone business using an RE system and the same
business recharging the battery from 230VAC mains electricity. The higher ROI for the latter is
caused by the reduced cost of charging the battery. The cost of the RE technology is much
higher compared to the recurrent cost of charging the battery and therefor has a negative impact
on the ROI.
Operational Plan
It appears that awareness regarding the possibility of charging batteries using a solar panel is
lacking with many payphone operators. Most entrepreneurs use a car battery that they charge
every number of days. What is required is a product package that offers a the payphone system
together with one or two 12VDC lights, a 10Wp solar panel and a 20Ah battery with regulator,
that can be offered to the potential users. Therefor what is necessary is:
awareness creation
technology package
Table 3 gives the cash flow during the first three years of operation. The cash flow analysis at the
bottom of the table indicates clearly, how much financing would be required. Under the prevalent
conditions, capital infusion of US$1000 would be sufficient. The graphs 4a and 4b visualize this
business development for the first year, and for three years, respectively.
Table 4 finally, gives the profitability forecast and balance for the business start-up.
Photos of Payphone Businesses
Payphone business operating between Mogoditshane and Gaborone
Note that this business is connected to the electric grid but could equally well operate from solar
power.
3Payphone business operating in Mogonye village
4Table 1: Pre-Assessment of the existing payphone business described above
INSABA Preassessment of Project Proposals
Country: Botswana
Pilot Region: Gaborone / Main Mall
RE Technology: Solar PV Electricity
Payphone shop shop using Solar
Business Idea: Energy
Proponent name, contact Mr. Moshe Makhweni tel: 71241813 / 71451105
Years of experience as owner of business 2
Number of employees w/contract 0
Proponent uses bank acount (yes=5, No=0) 0
Experience with formal loan (received=5, applied=3, no=0) 0
Experience in cost calculations, business p(no=0, several=5) 2
Practice in maintaining/operating equipment (RET) (none yet=0, regularly=5) 2
Total 6
ROE BW Pula to US$ 6
Calculation of ROI
Payphone Shop US$ Determination of parameters Definitions
The payphone shop operates from under a shade,
Investment Capital 100.00 Inventory
2 chairs, table
Investment Capital 583.33 Equipment Payphone system
1x 7Wp solar panel, solar panel stand, 1x50Ah
Investment Capital 88.33 PV solar system
battery
Investment Capital 771.67 Total of shop, inventory, equipment and PV Total cost of investment
Investment Life of the investment - i.e. period before it must
10 Conservative average life
Lifespan be replaced
Phonecalls 50 Phonecalls per day
Production 15000 Phonecalls per year
Price/unit 0.59 Average sales price per phonecall
Revenue 8,900 US$ This is net revenue
Cost per unit produced e.g. material, processing
Variable cost/unit 0.33 Average cost per phonecall
packaging
Cost of energy/unit 0 no other energy costs of power, fuel added to variable cost
Rent for storage space to staore the table,
Fixed cost 100 Rent
chairs and umbrella
Repairs of system, handset, replacement of the
Fixed cost 91.67 Repairs and replacements of the battery
battery
1500.00 Salary for employee Wages
Fixed cost 1899.67 Salary for owner/operator Wages
Annual indirect costs such as rent, telephones,
Total fixed costs 3,591.33
salaries
Amount needed per unit to cover investment in
Amortization/unit: 0.01 77
lifetime
Direct costs per Variable costs plus amortization plus cost of
0.34 5,077
unit: energy
The salary of the operator was obtained by
Gross Margin/unit 0.25 using the goalseek function for a ROI of 30% Sales price per unit less the direct costs per unit
However, when adding interest and redemption
Total fixed costs divided by the number of units
Fixed costs/unit 0.24 in Tool 3, this will lead to a negative cashflow.
produced
Therefore monthly salary for the
Total costs 0.58 8,669 owner/operator in Tool 3 is taken as Direct costs plus fixed costs
Net Margin 0.02 232 US$1500/yr. Note that the owner only operates Revenue less total costs
the business part-time. Return on Investment = net margin divided by
ROI 30%
capital investment
Payback period capital investment divided by cash flow until intial
2.50
years expenses are compensated by the net margin
5Table 2: Competitive Analysis: Comparison between the payphone business using a RE system and
the same business recharging the battery from 230V mains electricity
INSABA Verification & Market-Assessment of Project Proposals
Country: Botswana
Pilot Region: Gaborone
RE Technology: Solar PV Electricity
Business Idea: Payphone business using Solar Energy
Market Context : describe
Payphone businesses operate at almost every streetcorner in the centre of Gaborone.
Most often they use a car battery that is charged from the grid. Often operators are not
connected to the grid and charge the battery at a charging station. Competition in the
main centres is high. Large market available in villages. The same business model is
replicable for different parts of the country.
Market Size & Potential
There is a risk that more and more people well own cellphones, reducinng the market
Market Need, Risk for payphone operators.
See above
Competitor
Competing Technology See above
A smaller battery can be used, which is easier transportable. Also using RE a radio can
be operated and light, so that working hours are extended.
Appropriateness of RET
Payphone operators without RE system may operate cheaper, although the difference
Market Segment is marginal. Risk of RE system being stolen
Main Differentiator Better end result, faster, more comfort due to ventilation
Sustainable Production Battery needs recycling but thsi also applies to system that does not use RE
Payphone charging on grid electricity
Calculation of Competitiveness Compared to payphone with solar
Payphone Alternative: no solar Description of Alternative
Investment Capital 772 683 Simple barber shop with hand clipper
Investment
Lifespan
10 10 equipment
Haircuts per year is reduced because hair
Production 15,000 15,000 cutting is manual > slower and less service
Price/unit 0.59 0.59 Cheaper rates for hair cutting
Revenue 8,900 8,900 US$
Variable cost/unit 0.33 0.33
Battery is charged once every 2 weeks at a
Cost of energy/unit 0 0.0017 cost of P5 per charge
Wages, rent and replacement costs are not
Fixed costs 3,591 3,591 effected by how the battery is charged
Total fixed costs 3,591 3,591 Total fixed costs
Amortization/unit: 0.01 77 0.00 68
Direct costs per
0.34 5,077 0.34 5,093
unit:
Gross Margin/unit 0.25 0.25
The higher ROI is caused by the reduced cost
of charging the battery. The cost of the RE
Fixed costs/unit 0.24 0.24
technology is much higher compared to the
Total costs 0.58 8,669 0.58 8,685 recurrent cost of charging the battery and
therefor has a negative impact on the ROI
Net Margin 0.02 232 0.01 215
ROI 30% 32%
Payback period
2.50 2.41
years
6Table 3: Cash Flow Analysis
Month-1 Month-2 Month-3 Month-4 Month-5 Month-6 Month-7 Month-8 Month-9 Month-10 Month-11 Month-12 Total Total Total
Cash Flow Analysis Year 1 Year 1 Year 1 Year 1 Year 1 Year 1 Year 1 Year 1 Year 1 Year 1 Year 1 Year 1 Year 1 Year 2 Year 3
Products Sales
Phonecalls 15000 1,250 1,250 1,250 1,250 1,250 1,250 1,250 1,250 1,250 1,250 1,250 1,250 15,000 15,000 15,000
Product 2 0 0 0 0 0 0 0 0 0 0 0 0 0 0 0
Product 3 0 0 0 0 0 0 0 0 0 0 0 0 0 0 0
Cash Inflow
Turnover Price
Phonecalls 0.59 742 742 742 742 742 742 742 742 742 742 742 742 8,900 8,900 8,900
Product 2 0.00 0 0 0 0 0 0 0 0 0 0 0 0 0 0 0
Product 3 0 0 0 0 0 0 0 0 0 0 0 0 0 0 0
TOTAL Turnover 742 742 742 742 742 742 742 742 742 742 742 742 8,900 8,900 8,900
TOTAL Cash Inflow 742 742 742 742 742 742 742 742 742 742 742 742 8,900 8,900 8,900
Cash Outflow
Material Cost
Phonecalls 0.33 417 417 417 417 417 417 417 417 417 417 417 417 5,000 5,000 5,000
Product 2 0 0 0 0 0 0 0 0 0 0 0 0 0 0 0
Product 3 0 0 0 0 0 0 0 0 0 0 0 0 0 0 0
TOTAL Material 417 417 417 417 417 417 417 417 417 417 417 417 5,000 5,000 5,000
Overhead Cost
Staff A share 125.00 125 125 125 125 125 125 125 125 125 125 125 125 1,500 1,500 1,500
Staff B share 125.00 125 125 125 125 125 125 125 125 125 125 125 125 1,500 1,500 1,500
Storage rent 8.33 8.33 8.33 8.33 8.33 8.33 8.33 8.33 8.33 8.33 8.33 8.33 8.33 100 100 100
Repairs&replacement 7.64 7.64 7.64 7.64 7.64 7.64 7.64 7.64 7.64 7.64 7.64 7.64 7.64 92 92 92
Vehicle 0 0 0 0 0 0 0 0 0 0 0 0 0 0 0
Marketing 0 0 0 0 0 0 0 0 0 0 0 0 0 0 0
Investment 917 0 0 917 0 0
Investment Lifespan 10 6
TOTAL Overhead 1,183 266 266 266 266 266 266 266 266 266 266 266 4,108 3,192 3,192
Capital cost
interest, redemption 16% 35 35 35 35 35 35 35 35 35 35 35 35 416 416 416
TOTAL capital 35 35 35 35 35 35 35 35 35 35 35 35 416 416 416
TOTAL Cash Ouflow 1,634 717 717 717 717 717 717 717 717 717 717 717 9,525 8,608 8,608
Operating Result -892 24 24 24 24 24 24 24 24 24 24 24 -625 292 292
/accumulated -892 -868 -844 -819 -795 -771 -746 -722 -698 -673 -649 -625 -625 -333 -41
Capital input 1,000 1,000
Cash Flow 108 132 156 181 205 229 254 278 302 327 351 375 375 667 959
7Cash Flow Analysis: First Year
12,000 600
400
10,000
200
8,000
0
6,000 -200
-400
4,000
-600
2,000
-800
0 -1,000
Month-1 Month-2 Month-3 Month-4 Month-5 Month-6 Month-7 Month-8 Month-9 Month-10 Month-11 Month-12
TOTAL Cash Inflow, acc TOTAL Cash Outflow, acc Operating Result Operating Result, acc Cash Flow
8Cash Flow Analysis: 1st - 3rd Year
9,600 1,200
1,000
9,400
800
9,200
600
9,000
400
8,800 200
0
8,600
-200
8,400
-400
8,200
-600
8,000 -800
Year 1 Year 2 Year 3
TOTAL Cash Inflow TOTAL Cash Outflow Operating Result Operating Result, acc Cash Flow
9Table 4: Profitability and Balance Forecast
Profitability Preview Balance
Year 1 Year 2 Year 3 Year 1
Sales 8,900 8,900 8,900 Assets Liabilities
Cost of Sales 5,000 5,000 5,000 fixed assets 825 shareholders equity 534
Gross profit 3,900 3,900 3,900 current assets 375 liabilities 667
other operating income 0 0 0 S 1,200 S 1,200
personnel costs 3,000 3,000 3,000
hire charges 0 0 0 Year 2
communication 92 92 92 Assets Liabilities
vehicle 0 0 0 fixed assets 733 shareholders equity 1,067
marketing 0 0 0 current assets 667 liabilities 333
office 100 100 100 S 1,401 S 1,401
interest 83 83 83
depreciation 92 92 92 Year 3
other expenses 0 0 0 Assets Liabilities
TOTAL Expenses 3,366 3,366 3,366 fixed assets 642 shareholders equity 1,601
annual surplus/deficit 534 534 534 current assets 959 liabilities 0
/accumulated 533.67 1067.33 1601.00 S 1,601 S 1,601
10Vegetable Farm using Drip Irrigation Business Proposal
Business Description Draft: 6 August 2007
Vegetable farm using drip irrigation
Proponent
Mrs. Sibanda has only one year experience as the owner of the vegetable farm named “Khoda
Agencies”. She is assisted by a team from the National Masterplan for the Arable Agriculture
and Dairy (Nampaad), who also developed the business plan for the vegetable farm. Mrs.
Sibanda is chairlady of the Glenvaley farmers association. She managed to develop the farm
and turn it into a profitable business within one year. She was a paid employee before she
started the vegetable farm and has a diploma in marketing. The farm is financed through the
Citizen Entrepreneurial Development Agency (CEDA) and has 6 employees.
Location
The vegetable farm is located on the outskirts of Otse (55km from Gaborone), South-East of
the village centre.
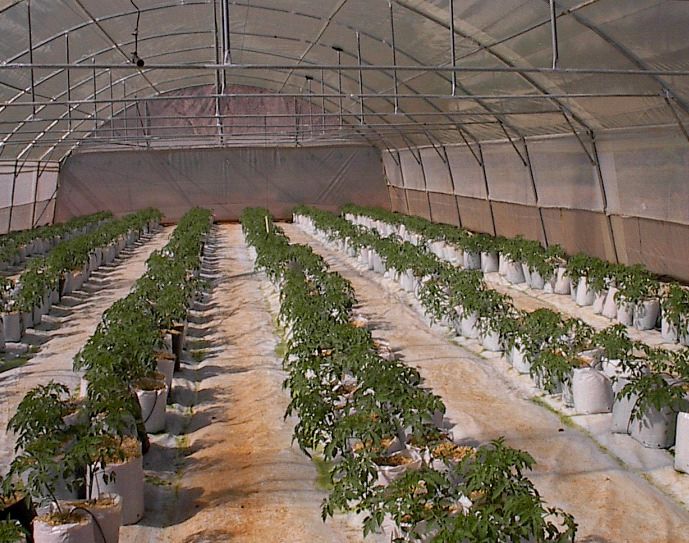
Business Factors
The vegetable farm consists of three
distinct areas:
Open field with drip irrigation
Net house with drip irrigation
Covered area with hydroponics
The open field (see photo on the right)
consists of 3 hectares and different crops
are grown such as onion and cabbage.
There are two boreholes at the farm
which are approximately 160m deep.
The water is pumped into a reservoir
(see photo on the right).
The net house has an area of 1 hectare.
A wide range of vegetables are grown in At the left of the field are onions, at the
back are cabbages and the drip irrigation
the net house such as bell peppers,
system can be seen at the right
lettuce, spinach, broccoli, beetroot,
eggplant and cauliflower.
The covered area totals 0.5 hectare,
where tomatoes are grown using
hydroponics. Most hydroponics systems
comprise of beds or pots that are filled
with an inert substrate, or growing
medium such as vermiculite or sawdust,
which replaces soil to hold plant roots
and moisture. A liquid nutrient solution
runs through the beds to feed the roots.
The roots are always kept moist, but are
aired periodically so they do not rot.
Water is circulated and nutrient levels
are closely monitored and added as
required for optimum plant growth.
Water storage of 185.000 litres
1Mrs. Sibanda, the owner of the vegetable farm inside the net house
The farm is connected to the mains electric grid and uses electricity for pumping water into a
storage tank, operating booster pumps for drip irrigation and pressure pumps for the hydroponics
system and for lighting. This case study compares the use of grid electricity with solar PV
electricity for pumping water using drip irrigation to grow cabbage in the open field. Calculations
for other vegetables are similar. Growing of vegetables in the net house and hydroponically were
not considered due to lack of information regarding some of the parameters that are required for
the calculations. These farming techniques are also not as easy to replicate due to the larger
capital investment and complexity of operation, such as in the case of hydroponics.
Pre-Assessment
The vegetable farm is an existing and operating business. It has proven to be feasible. This
exercise serves as an assessment to determine if similar vegetable farms may be feasible using
solar PV for water pumping and to determine the most important success and failure factors.
Only growing cabbage in open field using drip irrigation is considered for the case study. The
growing season for cabbage is 3 months and 4 crops can be harvested during the year. For ease
of comparison, calculations are carried out for one hectare. From working experience and
records that were kept, the following parameters are known:
Cost of equipping the borehole and irrigation system per hectare: P88,714
Cold room, office and office equipment: P14,250
Drilling of the borehole and pump: P49,120
Storage tank (370.000 litres). This is double the size compared to P42,500
pumping with grid electricity to cover for cloudy days:
3
Cost of solar PV array for solar pump with head of 50m, 90m /day P121,092
and P35/Wp:
Small truck: P200,000
Average kg cabbages per year (20% production losses): 224,000 kg
Average price of cabbage per kg: P1.62
Wages labourers and manager: P11,700
Insurance per year: P800
Ploughing per ha per year: P1,200
Vehicle maintenance cost per year: P10,000
2Covered areas where tomatoes are grown using hydroponics
Based on these figures a Pre-Assessment of the vegetable farm using drip irrigation with solar
PV was carried out. Results are shown in Table 1. Also calculations were carried out comparing
grid electricity with PV solar electricity. Results of this assessment are shown in Table 2.
Table 3 below shows a comparison between the two sources of energy.
Solar PV Electricity Grid
Electricity
ROI 44% 63%
Payback
period (yrs) 1.81 1.35
It can be observed that growing vegetables in both cases is highly profitable. The large
investment for the solar panels has a limited impact on the ROI. The reason for this can be
observed from the sensitivity analysis below Table 3. The cost of energy/unit has only a limited
influence on the change of ROI.
Market Assessment
Most of the vegetables are sold to the supermarket
chains in Gaborone. Limited amounts are sold from the
farm to local customers. The vegetables are
transported in a small truck (bakkie). Since Mrs.
Sibanda resides in Gaborone, she drives backward and
forward between Otse and Gaborone and takes loads
of vegetables with her. There is not a planned
marketing strategy and marketing is mostly done
through word-of-mouth. The demand is currently higher
than supply therefore there are no problems selling the
vegetables the market. Late payments for the sales of
vegetables sometimes cause problems.
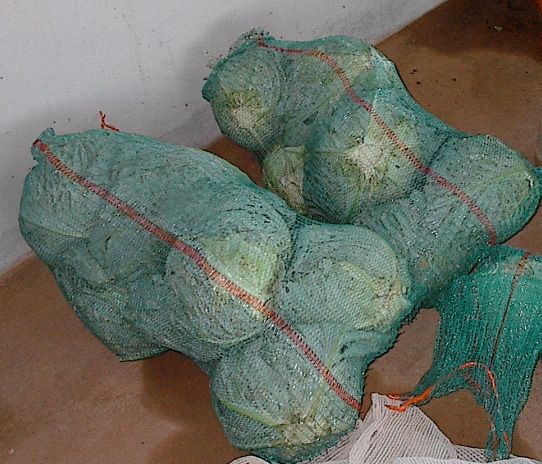
Seedlings are bought and readily available. To reduce
costs, the farm will grow their own seedlings from seeds Harvested and packed cabbages
for most vegetables in the future. ready to be marketed
The cost of chemicals and fertilisers is perceived as very high and it was expressed that
government should subsidise these items to help farmers.
3Operational Plan
The vegetable farm managed to develop into a successful business within a year, mainly due the
energetic input from Mrs. Sibanda. Although she did not have any prior farming experience, she
started the business, and through her background in marketing and good communication skills,
she managed to access the market easily and obtain information from experts as required.
Strategic choices have been made to spread risk. Farming is carried out using different
technologies, e.g. open field with drip irrigation, net house with drip irrigation and covered area
with hydroponics. Risk is further spread through growing different type of crops.
With the feasibility and viability firmly established in Tables 1 to 3, table 4 gives the dynamic
development of income and cost during the first three years of operation. The cash flow analysis
shows how much financing is required, which is P511,000. The graphs visualize this business
development for the first year and the first 3 years. Finally, Table 5 gives the profitability forecast
and balance for the business.
4Table 1: Pre-Assessment of vegetable farm using drip irrigation with solar PV electricity
INSABA Preassessment of Project Proposals
Country: Botswana
Pilot Region: South East district, Otse
RE Technology: Solar PV pump
Business Idea: Vegetable Farm with drip irrigation
Proponent name, contact Mrs Sibanda
Years of experience as owner of business 1
Number of employees w/contract 6
Proponent uses bank acount (yes=5, No=0) 5
Experience with formal loan (received=5, applied=3, no=0) 5
Experience in cost calculations, business plans
(no=0, several=5) 3
Practice in maintaining/operating equipment (RET) (none yet=0, regularly=5) 0
Total 20
Calculation of ROI
BWP Determination of parameters Definitions
Cost of equipping the borehole and irrigation
Investment Capital 88,714
system per hectare
Investment Capital 14,250 Cold room, office and office equipment
Investment Capital 49,120 Drilling of the borehole and pump Depth of b.h. is 162 m
Storage tank (370.000 litres). This is double the
Investment Capital 42,500 size compared to pumping with grid electricity
to cover for cloudy days.
Cost of solar PV array for solar pump with head
Investment Capital 121,092
of 50m, 90m3/day and P35/Wp
Investment Capital 200,000 Small truck
Total Investment
515,676 Total cost of investment
Capital
Investment 7 year loan period plus 2 years grace period for Life of the investment - i.e. period before it must
9
Lifespan CEDA loan be replaced
Average kg cabbages per year (20%
Production 224000 Units produced per year
production losses)
Price/unit 1.62 Average price of cabbage per kg Sales price per unit produced and sold
Revenue 362,880 Pula/year Sales price multiplied by number of units sold
Variable cost/unit 0.1714 Cabbage seedlings
Variable cost/unit 0.0301 Fertiliser
Variable cost/unit 0.0536 Pest control
Variable cost/unit 0.0354 Transport cost
Total Variable Cost per unit produced e.g. material, processing
0.29
cost/unit packaging
Costs solar PV averaged over 20 yr, fuel for car
Cost of energy/unit 0.00 Cost of electricity per kg produced
added to variable cost
Fixed costs 11,700 Wages labourers and manager Annnual
Fixed costs 800 Insurance per year Annnual
Fixed costs 1,200 Ploughing per ha per year Annnual
Fixed costs 10,000 Vehicle maintenance Annnual
Annual indirect costs such as rent, telephones,
Total fixed costs 23,700 Total fixed costs per year
salaries
Amount needed per unit to cover investment in
Amortization/unit: 0.26 57,297
lifetime
Direct costs per Variable costs plus amortization plus cost of
0.55 122,349
unit: energy
Gross Margin/unit 1.07 Sales price per unit less the direct costs per unit
Note that all calculations are per hectare Total fixed costs divided by the number of units
Fixed costs/unit 0.11
with the exception of the drilling and produced
Total costs 0.65 146,049 equiping of the borehole Direct costs plus fixed costs
Net Margin 0.97 216,831 Revenue less total costs
5Table 2: Pre-Assessment of vegetable farm using drip irrigation with grid electricity
INSABA Preassessment of Project Proposals
Country: Botswana
Pilot Region: South East district, Otse
RE Technology: Grid Electricity
Business Idea: Vegetable Farm with drip irrigation
Proponent name, contact Mrs Sibanda
Years of experience as owner of business 1
Number of employees w/contract 6
Proponent uses bank acount (yes=5, No=0) 5
Experience with formal loan (received=5, applied=3, no=0) 5
Experience in cost calculations, business plans
(no=0, several=5) 3
Practice in maintaining/operating equipment (RET) (none yet=0, regularly=5) 0
Total 20
Calculation of ROI for Grid Electricity
BWP Determination of parameters Definitions
Cost of equipping the borehole and irrigation
Investment Capital 88,714
system per hectare
Investment Capital 14,250 Cold room, office and office equipment
Investment Capital 49,120 Drilling of the borehole and pump Depth of b.h. is 162 m
Investment Capital 21,250 Storage tank (185.000 litres)
Total Investment
200,000 Small truck
Capital
Total Investment
373,334 Total cost of investment
Capital
Investment 7 year loan period plus 2 years grace period for Life of the investment - i.e. period before it must
9
Lifespan CEDA loan be replaced
Average kg cabbages per year (20%
Production 224000 Units produced per year
production losses)
Price/unit 1.62 Average price of cabbage per kg Sales price per unit produced and sold
Revenue 362,880 Pula/year Sales price multiplied by number of units sold
Variable cost/unit 0.1714 Cabbage seedlings
Variable cost/unit 0.0301 Fertiliser
Variable cost/unit 0.0536 Pest control
Variable cost/unit 0.0354 Transport cost
Total Variable Cost per unit produced e.g. material, processing
0.29
cost/unit packaging
Costs of electric energy, fuel for car added to
Cost of energy/unit 0.0321 Cost of electricity per kg produced
variable cost
Fixed costs 11,700 Wages labourers and manager Annnual
Fixed costs 800 Insurance per year Annnual
Fixed costs 1,200 Ploughing per ha per year Annnual
Fixed costs 10,000 Vehicle maintenance Annnual
Annual indirect costs such as rent, telephones,
Total fixed costs 23,700 Total fixed costs per year
salaries
Amount needed per unit to cover investment in
Amortization/unit: 0.19 41,482
lifetime
Direct costs per Variable costs plus amortization plus cost of
0.51 113,734
unit: energy
Gross Margin/unit 1.11 Sales price per unit less the direct costs per unit
Note that all calculations are per hectare Total fixed costs divided by the number of units
Fixed costs/unit 0.11
with the exception of the drilling and produced
Total costs 0.61 137,434 equiping of the borehole Direct costs plus fixed costs
Net Margin 1.01 225,446 Revenue less total costs
Return on Investment = net margin divided by
ROI 60%
capital investment
6Table 3: Competitive Analysis
INSABA Verification & Market-Assessment of Project Proposals
Country: Botswana
Pilot Region: South East district, Otse
RE Technology: Mains Electricity
Business Idea: Vegetable Farm with drip irrigation
Market Context : describe
Market Size & Potential There appears sufficient potential for vegatable gardening using drip irrigation. The
business is scalable to a certain degree. When more energy is required due to an
increase of cultivated land area, solar panels may be added as long as the pump can
handle the increased power, provided this has been considered when purchasing the
pump. The same business model is replicable for different parts of the country.
However, pumping head is an important parameter deteriming the Wp of solar panels
required.
Market Need, Risk The demand for fresh vegetables overrides the supply in Botswana and there is a large
market for fresh vegetables. Presently fresh vegetables are imported from South
Africa, where the conditions of growing vegetables may be better, due to better climatic
and topographic conditions.
Competitor There is competition from vegetable farms that are connedted to the mains electric
grid. Also competition from imports from South Africa.
Competing Technology Mains electricity (subsidized) and diesel/petrol pumping.
Appropriateness of RET The water requirement matches the availability of solar energy. In Botswana irrigation is
required almost throughout the year since rainfall is erratic. There is a limitation to the
quantity and head that a solar pump is able to handle.
Market Segment Pumping with grid electricity and diesel/petrol pump is on demand and therefore less
storage of water is required.
Main Differentiator Compared to diesel/petrol pump easier to operate since operation is automatic and no
need for hauling fuel.
Sustainable Production n.a.
Irrigation with solar PV pump
Calculation of Competitiveness Compared to irrigation with grid el.
Solar PV Electricity Grid Electricity Description of Alternative
Investment Capital 515,676 373,334 Pump that operates on grid electricity
Investment 7 year loan period plus 2 years grace period for
Lifespan
9 9 CEDA loan
Average kg cabbages per year (20%
Production 224000 224000 production losses)
Price/unit 1.62 1.62 Average price of cabbage per kg
Revenue 362,880 362,880 BWP
Variable cost/unit 0.29 0.29
Cost of energy/unit 0.000 0.032 Cost of grid electricity per cabbage produced
Fixed costs 11,700 11,700 Wages labourers and manager
Fixed costs 800 800 Insurance per year
Fixed costs 1,200 1,200 Ploughing per ha per year
Total fixed costs 13,700 13,700 Total fixed costs
Amortization/unit: 0.26 57,297 0.19 41,482
Direct costs per
0.55 122,349 0.51 113,734
unit:
Gross Margin/unit 1.07 1.11
Due to the high cost of the solar panels the ROI
Fixed costs/unit 0.06 0.06 is less compared to using grid electricity for
water pumping. However, in both cases the
Total costs 0.61 136,049 0.57 127,434 farming of vegetables is very profitable.
Net Margin 1.01 226,831 1.05 235,446
ROI 44% 63%
7You can also read