PEOPLE DROWNED IN AUSTRALIAN WATERWAYS - ROYAL LIFE SAVING NATIONAL DROWNING REPORT 2018 RESEARCH AND POLICY HIGHLIGHTS

Page created by Matthew Brooks
 
CONTINUE READING
PEOPLE DROWNED IN AUSTRALIAN WATERWAYS - ROYAL LIFE SAVING NATIONAL DROWNING REPORT 2018 RESEARCH AND POLICY HIGHLIGHTS
PEOPLE DROWNED
IN AUSTRALIAN WATERWAYS

ROYAL LIFE SAVING
NATIONAL DROWNING
REPORT 2018
                          SUPPORTED BY

RESEARCH AND
POLICY HIGHLIGHTS
PEOPLE DROWNED IN AUSTRALIAN WATERWAYS - ROYAL LIFE SAVING NATIONAL DROWNING REPORT 2018 RESEARCH AND POLICY HIGHLIGHTS
NATIONAL DROWNING REPORT 2018

                                                                              72%
             249
                                                                              28%
                 PEOPLE DROWNED IN
                AUSTRALIAN WATERWAYS

                                                       7

                     27                                                   60

                                                           15
                                                                         87

                                                                               3
                                                                         40

                                                                               10
    Note: Arrows reflect 2017/18 progress against the 10 year average.

2
PEOPLE DROWNED IN AUSTRALIAN WATERWAYS - ROYAL LIFE SAVING NATIONAL DROWNING REPORT 2018 RESEARCH AND POLICY HIGHLIGHTS
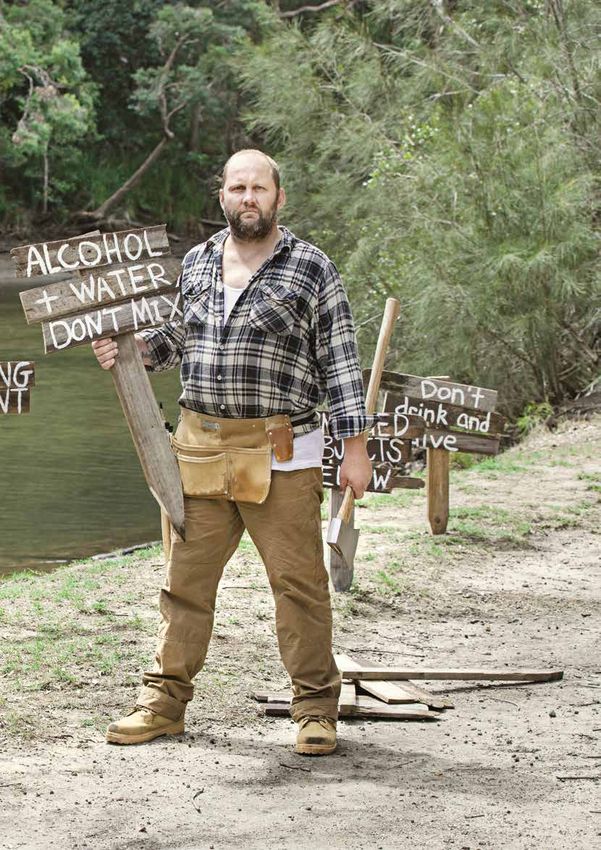
TOP 3 LOCATIONS                CONTENTS

                               06 Fatal and Non-Fatal Drowning in Australia
          25%
          RIVER/CREEK/STREAM   08 Who Drowns?

                               10   When Do These Drowning Deaths Occur?

                               12   Where and How Do These
          19% BEACH                 Drowning Deaths Occur?

                               13   Drowning Deaths by Location

                               23 Drowning Deaths by Life Stages

          16% OCEAN/HARBOUR    36 Fatal Drowning Risk Factors

                               39 State and Territory
                                  Fatal Drowning Analysis

                               56 Methods
TOP 3 ACTIVITIES
                               58 2017/18 Research and Policy Highlights

          26% SWIMMING
          & RECREATING

          15% BOATING

          14% FALLS

                               THIS REPORT SERVES AS
                               AN IMPORTANT REMINDER
                               TO ALL AUSTRALIANS OF
                               THE RISKS ASSOCIATED
                               WITH EXPOSURE TO OUR
                               BEAUTIFUL WATERWAYS”

                                                                              3
PEOPLE DROWNED IN AUSTRALIAN WATERWAYS - ROYAL LIFE SAVING NATIONAL DROWNING REPORT 2018 RESEARCH AND POLICY HIGHLIGHTS
FOREWORD

    We are pleased to present the Royal Life Saving National
    Drowning Report 2018. We urge you to study this report
    and to take action to reduce drowning.”

    People, and Families not Cases or Data                        Swimming and Water Safety Skills
    We must always be mindful that this is a report filled        We are absolutely committed to the notion that all
    with the stories of real people impacted in a most tragic     Australian children have the right to a comprehensive
    way by drowning. It includes people who lost their            swimming and water safety education. The skills of
    lives to drowning, the families they left behind, the         swimming, survival swimming, and basic rescue are all
    rescuers who made valiant efforts to save their life, and     lifesavers, yet we know that there are many barriers;
    the communities that are reminded as they pass the            including cost, distance, awareness, and access in
    causeway, swimming pool, rock platform, beach or river        communities most at risk of drowning. In May 2018, we
    swimming holes.                                               convened the second National Swimming and Water
                                                                  Safety Symposium, bringing together policy makers,
                                                                  water safety organisations and academics from across
    Non-fatal Drowning                                            Australia. Our focus continues to be on relaunching the
                                                                  National Swimming and Water Safety Framework.
    We continue to grow our understandings of the impacts
    of both fatal and non-fatal drowning. Those who survive
    a drowning incident, often do so while suffering from
    an array of lifelong health impacts. In some cases these      Strengthening Partnerships
    impacts lead to premature death.                              This year’s Royal Life Saving National Drowning
                                                                  Report is the 24th iteration. It is our most rigorous and
                                                                  comprehensive analysis to date. The Royal Life Saving
    Young lives saved                                             National Fatal Drowning Database now stretches back 16
                                                                  years, and almost 5,000 cases. Partnerships with others
    The most pleasing item to report this year relates to the
                                                                  are critical to its value in prevention terms. Coroners,
    reduction in drowning of children under the age of five.
                                                                  Federal, State and Local Governments, Institutions and
    A 38% reduction when compared to last year, and 36%
                                                                  other industry bodies have used the dataset to inform
    against the 10 year average is very positive. Parents must
                                                                  the development of drowning prevention policy.
    continually be reminded to Keep Watch, and ensure that
    their pool fence and gate are in good working order.

                                                                  Water Safety Funding
    Australians take note and Respect the River                   We are pleased to continue our partnership with the
                                                                  Australian Government that is aimed at reducing
    Drowning in inland waterways have reduced for
                                                                  drowning and promoting water safety to the
    the third year running. A reduction of 16% when
                                                                  Australian community. This supports our leadership and
    compared to the ten year average builds upon
                                                                  collaboration, our research and campaigns, and the many
    the progress in this area. We are pleased to be
                                                                  programs that we deliver to communities across Australia.
    implementing campaigns including Respect the River,
    and Don’t Let Your Mates Drink and Drown. We are
    grateful that Federal Government funding for these
    programs has been extended.                                   This Report serves as an important reminder to all
                                                                  Australians of the risks associated with exposure
                                                                  to our beautiful waterways, rivers, beaches, and
    Australian Water Safety Strategy                              community and backyard swimming pools. I urge
    Royal Life Saving analysis of the Australian Water Safety
                                                                  you to share the messages of the Report, the
    Strategy targets shows that progress is being made in         infographics, prevention tips and other supporting
    reducing drowning in children 0-4 years (47%) when            resources provided by Royal Life Saving, to help us
    measured as a rate per 100,000 population. Advances in        reduce drowning in Australia.
    swimming fencing legislation and enforcement, and the
    promotion of the messages of supervision, pool fencing,       Justin Scarr
    water familiarisation and resuscitation, are clearly having   Chief Executive Officer,
    some long term impact.                                        Royal Life Saving Society - Australia

4
PEOPLE DROWNED IN AUSTRALIAN WATERWAYS - ROYAL LIFE SAVING NATIONAL DROWNING REPORT 2018 RESEARCH AND POLICY HIGHLIGHTS
NATIONAL DROWNING REPORT 2018   5
PEOPLE DROWNED IN AUSTRALIAN WATERWAYS - ROYAL LIFE SAVING NATIONAL DROWNING REPORT 2018 RESEARCH AND POLICY HIGHLIGHTS
FATAL AND NON-FATAL DROWNING IN AUSTRALIA

    There were 249 drowning

                                             1.63
    deaths in aquatic locations

                                                       1.48

                                                                             1.42

                                                                                                           1.38

                                                                                                                     1.38
                                                                 1.36

                                                                                       1.33
    across Australia between

                                                                                                                                                       1.27
                                                                                                 1.23

                                                                                                                                                                                                                                  1.22
                                                                                                                                1.22

                                                                                                                                            1.18
    1 July 2017 and 30 June 2018.

                                                                                                                                                                                                        1.17
                                                                                                                                                                                           1.16
                                                                                                                                                                               1.09
                                                                                                                                                                   1.12

                                                                                                                                                                                                                     1.01
    This is a 14% reduction on 2016/17

                                             322
    and an 11% reduction on the ten

                                                                                                                     303
                                                                                                           300
                                                       295

                                                                                                                                                       293
                                                                             291

                                                                                                                                                                                                        288
                                                                                                                                                                                           280

                                                                                                                                                                                                                                  279
    year average.

                                                                                       277
                                                                 275

                                                                                                                                273

                                                                                                                                            269

                                                                                                                                                                   264
                                                                                                 261

                                                                                                                                                                               259

                                                                                                                                                                                                                     249
    The crude drowning rate is 1.01
    drowning deaths per 100,000
    population, compared to a 10 year
    average rate of 1.22.

    Based on statistical modelling of
                                             2002/03

                                                       2003/04

                                                                 2004/05

                                                                             2005/06

                                                                                       2006/07

                                                                                                 2007/08

                                                                                                           2008/09

                                                                                                                     2009/10

                                                                                                                                2010/11

                                                                                                                                            2011/12

                                                                                                                                                       2012/13

                                                                                                                                                                   2013/14

                                                                                                                                                                               2014/15

                                                                                                                                                                                           2015/16

                                                                                                                                                                                                        2016/17

                                                                                                                                                                                                                     2017/18

                                                                                                                                                                                                                                  10 Yr Avg
    the relationship between numbers
    of fatal and non-fatal incidents for
    each age group between 2002/03
    and 2014/15, we estimate there were                                    Number of Deaths/Year                                           Number of Deaths/100,000 Population
    551 non-fatal drowning incidents
    requiring hospitalisation in 2017/18,   Figure 1:              Unintentional Drowning Deaths and Death Rates,
    assuming the historical ratios                                 Australia 2002/03 to 2017/18, 10 Year Average
    between the number of fatal and
    non-fatal incidents held constant.

    When fatal and non-fatal incidents
    are combined, there were a total of
                                                       4.88

                                                                                                                      4.83

    800 drowning incidents in Australia
                                                                             4.78

                                                                                                                                                         4.72

                                                                                                                                                                     4.66
                                                                                       4.62
                                            4.59

                                                                                                                                                                                 4.57
                                                                                                           4.52
                                                                 4.49

    in 2017/18, representing a crude
                                                                                                                                 4.40

                                                                                                                                                                                                                                  4.38
    rate of 3.23 drowning incidents per
                                                                                                 4.21

                                                                                                                                             4.17

                                                                                                                                                                                                           4.01
    100,000 population.

                                                                                                                                                                                              3.75
                                                                                                                                                                     823
                                                                                                                                                         791

                                                                                                                                                                                 822

                                                                                                                                                                                                                        3.23
                                                                                                                      752

                                                                                                                                                                                                                                  717
                                                                                                                                 703

                                                                                                                                                                                                           689
                                                                                                           671
                                                       672

                                                                                       677

                                                                                                                                             671
                                            578

                                                                 625

                                                                                                                                                                                              619
                                                                             679

                                                                                                 624

                                                                                                                                                                                                                        551
                                            322

                                                                                                                      303
                                                                                                           300
                                                                             291
                                                       295

                                                                                                                                                         293

                                                                                                                                                                                                           288
                                                                                                                                                                                              280

                                                                                                                                                                                                                                  279
                                                                 275

                                                                                       277

                                                                                                                                 273

                                                                                                                                             269

                                                                                                                                                                     264
                                                                                                 261

                                                                                                                                                                                 259

                                                                                                                                                                                                                        249

      REDUCTION IN DROWNING
                                            2002/03

                                                       2003/04

                                                                 2004/05

                                                                             2005/06

                                                                                       2006/07

                                                                                                 2007/08

                                                                                                           2008/09

                                                                                                                      2009/10

                                                                                                                                 2010/11

                                                                                                                                             2011/12

                                                                                                                                                         2012/13

                                                                                                                                                                     2013/14

                                                                                                                                                                                 2014/15

                                                                                                                                                                                              2015/16

                                                                                                                                                                                                           2016/17

                                                                                                                                                                                                                        2017/18

                                                                                                                                                                                                                                  10 Yr Avg

      DEATHS ON 2016/17

                                                                           Fatal                     Non-fatal                              Number of Deaths/100,000 Population

                                            Figure 2: Comparison of fatal and non-fatal incidents, based on historical
                                                      data (2002/03-2014/15) and projected figures (2015/16-2017/18) and
                                                      crude rate of drowning incidents, Australia, 10 Year Average

      DROWNING INCIDENTS IN
      AUSTRALIA IN 2017/18

6
PEOPLE DROWNED IN AUSTRALIAN WATERWAYS - ROYAL LIFE SAVING NATIONAL DROWNING REPORT 2018 RESEARCH AND POLICY HIGHLIGHTS
CASE STUDY

 HOW ARE WE TRACKING AGAINST THE GOAL OF A
 50% REDUCTION IN DROWNING BY THE YEAR 2020?
 In 2008, the Australian Water Safety Council set an           The reduction in drowning rates achieved so far is shown
 ambitious goal of reducing drowning by 50% by 2020.           in each graphic as a percentage. This interim analysis
 This target has served as a focus for drowning prevention     shows an overall 26% reduction in fatal drowning since
 efforts and driver for collaboration between different        2002/03. This reduction equates to approximately 102
 drowning prevention organisations across Australia.           fatal drownings averted per year.

 With 2020 only two years away, we have begun to track         This population-based approach takes into account
 our progress against the goal of reducing drowning            changes in the size of the population being protected,
 by 50%, to identify areas where interventions have            and is consistent with how we monitor most other public
 been successful and those where additional effort is          health outcomes.
 urgently required. A range of factors have impacted the
 achievability of the 50% reduction target. These include
 changes in the size and make-up of the Australian
 population, which is increasingly older and features
 larger numbers of tourists and overseas born residents        Factors impacting achievement
 (see Factors impacting achievement).                          Since 2002/03 there has been a:
 In order to partially adjust for the changes in our target    • 28% population increase
 population, the graphics below show progress in the rate
 of drowning per 100,000 people. To avoid overstating          • 55% population increase in people aged 65+
 the effects of one year peaks and troughs, these figures
                                                               • 71% increase in people born overseas
 compare 3 year averages from the start (2002/03–
 2004/05) to our most recent data (2015/16-2017/18) for        • 71% increase in overseas inbound tourism
 the four key life stages outlined in the Australian Water
 Safety Strategy 2016-2020.                                    • 100% increase in international students
fatal drowning rate/100,000 pop
   3 year average age-specific

       2002/03 to 2004/05

                                  1.23       1.23                     2.49                         1.96
                                     -41%                   -26%                    -25%                        -18%
fatal drowning rate/100,000 pop
   3 year average age-specific

        2015/16 to 2017/18

                                  0.73         0.91                      1.87                        1.60

                                                                                         NATIONAL DROWNING REPORT 2018    7
PEOPLE DROWNED IN AUSTRALIAN WATERWAYS - ROYAL LIFE SAVING NATIONAL DROWNING REPORT 2018 RESEARCH AND POLICY HIGHLIGHTS
WHO DROWNS?

    Of the 249 drowning deaths                                    98
    in Australia in 2017/18, 72%                             87
    were male.
                                                                                                  68
    New South Wales recorded the                                                        60
    largest number of drowning deaths
    with 87, followed by Queensland                                                                                              40 40
    with 60 drowning deaths.                                                                                                                              36
                                                                                                                                                27
    As a rate per 100,000 population,                                      7        9
                                          3          2                                                   15 15
    Tasmania recorded the highest                                                                                      10 11
    drowning rate, with 1.91
                                               ACT             NSW             NT            QLD               SA        TAS         VIC            WA
    drowning deaths per 100,000 head
    of population. Victoria recorded                                               2017/18          10 year average
    the lowest fatal drowning rate
    with 0.63 drowning deaths per        Figure 3: Drowning Deaths by State and Territory, 2017/18, 10 Year Average
    100,000 population.

    The largest number of drowning
    deaths last year occurred in the

                                                                                                                         1.91
    35-44 years age group. The 18

                                                                           1.62
    drowning deaths this year of
    young children under five years of
    age, represents a 36% reduction

                                                                                             1.21
    on the 10 year average of 28
                                                               1.10

                                                                                                                                                    1.04
    drowning deaths.

                                                                                                              0.87
                                               0.72

                                                                                                                                     0.63
                                                               22
                                                               65                            16                                       11
                                                                                                               6          3                          9
                                               0                               3             44
                                                                                                               9          7          29
                                               3                               4
                                                                                                                                                    18
                                               ACT            NSW              NT            QLD               SA        TAS         VIC            WA

                                                         Male          Female                     Number of Deaths/100,000 population

                                         Figure 4: Drowning Deaths by Sex and State and Territory, Drowning Death Rates

      NEW SOUTH WALES
      RECORDED THE LARGEST
      NUMBER OF DROWNING                                                                                 42
      DEATHS WITH 87                                                                                           39
                                                                                                    37               36 35 36        36

                                                                                                                                            31 30
                                                28                                           28                                 29
                                                                                        26                                                                 27

                                                                                                                                                     21
                                          18

                                                         2   7    7
                                                                       5            5
                                                                               3

                                           0-4           5-9      10-14    15-17        18-24 25-34 35-44 45-54 55-64 65-74                          75+
      DROWNING DEATHS                                                               2017/18         10 year average
      AMONG CHILDREN UNDER
      FIVE DOWN BY 36% ON                Figure 5: Drowning Deaths by Age Group, 2017/18, 10 Year Average
      THE 10 YEAR AVERAGE                Please note: There was one drowning death in Queensland where age was unknown.

8
PEOPLE DROWNED IN AUSTRALIAN WATERWAYS - ROYAL LIFE SAVING NATIONAL DROWNING REPORT 2018 RESEARCH AND POLICY HIGHLIGHTS
CASE STUDY

COSTS OF DROWNING IN 2017/18
Research conducted by Royal Life Saving                       What these numbers mean
estimates that the combined effects of fatal and              Fatal drowning
non-fatal drowning in 2017/18 cost Australia $1.47            Information on the number and age at death of those
billion. These costs combine the health system,               who die from drowning has been sourced from the Royal
emergency services, coronial and productivity                 Life Saving National Fatal Drowning Database as part of
                                                              the preparation of this report.
effects of an average of the 249 fatal and 551
non-fatal incidents outlined in this report.                  The cost associated with each fatal drowning is calculated
                                                              based on an updated Value of a Statistical Life Year
On average, each fatal drowning cost Australian society       provided by the Commonwealth Office of Best Practice
$4.56 million, while each non-fatal drowning cost us          Regulation and the victim’s projected remaining life
$610 thousand. Most of the costs of non-fatal drowning        years. Estimates from literature were used to determine
come from the 7.4% of victims who go on to experience         the costs of emergency services and search and rescue
long term complications as a result of their experience.      response, hospitalisation in cases of delayed mortality,
                                                              foregone economic productivity and coronial enquiry costs.
The largest share of costs from drowning, for both fatal
and non-fatal incidents, come from the value of years         Non-fatal drowning
of life lost to death and disability. We calculate that, in   Since hospital data showing non-fatal drowning
2017/18, fatal drowning led to the loss of 10,335 years       admissions is not currently available, the number of
of life over a 15 year period, while last year’s non-fatal    non-fatal incidents in 2017/18 was estimated based on
drowning will ultimately lead to complications and            the past ratio of non-fatal to fatal incidents in each age
disability equivalent to 1,326 years of life lost.            group and on the number of fatal incidents each age
                                                              group experienced in 2017/18. An adjustment was made
                                                              to capture non-fatal drowning which is not captured in
                                                              standard hospital admissions data.

                                                              The cost associated with each non-fatal incident is
                                                              calculated based on rates of complications in survivors,
      $1.47           DROWNING COST TO                        the degree of disability associated with each level
                                                              of injury, and the costs from hospitalisation, loss of
       BILLION        AUSTRALIA LAST YEAR                     productivity and emergency response. These figures
                                                              update the cost estimates provided in earlier Royal Life
                                                              Saving publications based on additional research into
                                                              rates and consequences of brain injury among victims.

                                                              Why these numbers matter
       $1.13          FOR FATAL INCIDENTS                     We calculate that drowning costs Australian society
       BILLION                                                nearly $1.5 billion last financial year, and that each
                                                              fatal drowning we could have prevented would have
                                                              been worth, on average, $4.56 million. These figures
                                                              help to put the costs of potential drowning prevention
                                                              strategies into perspective and help to quantify the gains
                      AVERAGE FATAL                           from reductions in Australia’s drowning toll. Every time
      $4.56           DROWNING COST TO                        a quick response helps to turn a fatal drowning into a
       MILLION                                                non-fatal one, Australian society benefits to the tune of
                      AUSTRALIAN SOCIETY                      nearly $4 million.

                                                              Obviously, dollars and cents aren’t the only way, or even
                                                              the most useful way to talk about how much drowning
                      AVERAGE NON-FATAL                       costs us as a society. But sometimes policy decisions do
      $339            DROWNING COST TO                        come down to dollar and cents, and at those times
                                                              it’s important to be able to talk about what a costly
       MILLION
                      AUSTRALIAN SOCIETY                      tragedy every drowning, fatal or non-fatal, really is.

                      YEARS OF LIFE
      10,335          LOST DUE TO
                      FATAL DROWNING

                                                                                         NATIONAL DROWNING REPORT 2018     9
PEOPLE DROWNED IN AUSTRALIAN WATERWAYS - ROYAL LIFE SAVING NATIONAL DROWNING REPORT 2018 RESEARCH AND POLICY HIGHLIGHTS
WHEN DO THESE DROWNING DEATHS OCCUR?

     Drowning deaths occur

                                                                                                       40
     throughout the year with the

                                                                                                                             38
     largest proportion taking place
     in Summer (42%).

                                                                             27

                                                                                                                                       25
     Fatal drowning peaked in December

                                                                                                                                                     21
     with 40 deaths, followed by January

                                                                                           17
     with 38 deaths.

                                                                16
                                            15

                                                       14

                                                                                                                                                              13

                                                                                                                                                                         12

                                                                                                                                                                                 11
     Sunday was the most common day
     for fatal drowning, accounting for
     23% of all deaths.

                                            July

                                                       August

                                                                 September

                                                                             October

                                                                                            November

                                                                                                       December

                                                                                                                             January

                                                                                                                                       February

                                                                                                                                                     March

                                                                                                                                                              April

                                                                                                                                                                         May

                                                                                                                                                                                  June
     51% of all drowning deaths
     in 2017/18 occurred in the
     afternoon hours.

                                           Figure 6: Drowning Deaths by Month of Drowning Incident, 2017/18

                                                                                                                                                                               57
                                                                                                                                                              42
                                                                                       39

                                                                                                                                           34
                                             31

                                                                                                                  25
                                                                21
                                              Monday

                                                                Tuesday

                                                                                       Wednesday

                                                                                                                  Thursday

                                                                                                                                           Friday

                                                                                                                                                              Saturday

                                                                                                                                                                               Sunday

                                           Figure 7: Drowning Deaths by Day of Week of Incident, 2017/18
                                                                                                                    127

       TWO IN FIVE DROWNING
       DEATHS OCCUR IN SUMMER
                                                                                                                                                     50
                                                                                49
                                                       14

                                                                                                                                                                               9

                                            Early Morning                    Morning                      Afternoon                                 Evening              Unknown
                                            (12:01am to 6am) (6:01am to 12pm) (12:01pm to 6pm) (6:01pm to 12am)
       DROWNING DEATHS OCCUR
       DURING WINTER & AUTUMN              Figure 8: Drowning Deaths by Time of Incident, 2017/18

10
CASE STUDY

A 10 YEAR ANALYSIS OF DROWNING IN AQUATIC FACILITIES:
COMMUNAL, PUBLIC AND COMMERCIAL SWIMMING POOLS
Between 1 July 2005 and 30 June 2015, 78 people drowned in Communal, and Public and Commercial
swimming pools. Of these, 42 drowning deaths occurred in Communal pools and 36 occurred in Public
and Commercial pools.

Communal swimming pools                                       Public and commercial swimming pools
(e.g. hotel/motel pools, apartment complex pools              (e.g. public pools, aquatic centres, school pools
and retirement village pools)                                 and fitness centre pools)
Fatal drowning                                                Fatal Drowning
• Males accounted for 79% of deaths, with adults 25-34        • Males accounted for 81% of drowning deaths, with
  years the leading age group (19%)                             children aged 5-9 years the leading age group (19%)
• Among deaths involving children 0-14 years, there was       • Among deaths involving children 0-14 years, there was
  no parental or carer supervision in 75% of cases              no parental or carer supervision in 78% of cases
• Those who drowned were most commonly first                  • Those who drowned were most commonly first
  observed by a resident or guest (24%), or a family            observed by an adult bystander or witness (39%) but
  member or friend (24%) but often retrieved from the           often retrieved from the pool by staff (44%), including
  pool by hospitality staff (29%)                               lifeguards
• In almost all cases emergency services were contacted       • In two thirds of drowning cases at least one lifeguard
  (95%), most commonly by hospitality staff (33%) and           was present (67%), while other pools were either not
  treatment was administered in almost three quarters of        required to have one or did not have one due to the
  drowning cases (74%)                                          prevailing operating conditions
• People of all skill levels drowned, including poor (12%),   • In the majority of cases emergency services were
  competent (12%) and strong swimmers (7%)                      contacted (89%), either by pool staff (8%) or a
• Coronial recommendations were not made in any                 bystander (8%) and treatment was administered in the
  drowning cases                                                majority of drowning cases (86%)
                                                              • People of all skill levels drowned, including non (14%),
Non-fatal drowning                                              poor (8%), competent (22%) and strong swimmers
                                                                (22%)
• There were 105 cases of non-fatal drowning in
  Communal swimming pools                                     • Coronial recommendations were made in 17% of cases,
                                                                referencing swimming ability, safety standards and
• The leading age group for non-fatal drowning was              features, supervision and education
  children aged 0-4 years (45%), followed by children
  aged 5-9 years (25%)
                                                              Non-Fatal Drowning
                                                              • There were 257 cases of non-fatal drowning in Public
                                                                and Commercial swimming pools
                                                              • The leading age group for non-fatal drowning was
                                                                children aged 0-4 years (45%), followed by children
                                                                aged 5-9 years (21%)

                                                              Source: Mahony, A, Peden, AE, Roberts, C, Barnsley, P (2018) A
                                                              10 year analysis of drowning in Aquatic Facilities: Exploring risk
                                                              at Communal, Public and Commercial swimming pools, Royal
                                                              Life Saving Society – Australia. Sydney.

                                                                                             NATIONAL DROWNING REPORT 2018         11
WHERE AND HOW DO THESE DROWNING DEATHS OCCUR?

     Rivers, creeks and streams                                                                73
     were the location with the
                                                                                          61
     largest number of drowning
     deaths, accounting for 25% of                      46 47                       44
     all drowning deaths in 2017/18.                                           40                                   41
                                                                                                               33
     The location categories of lakes/                                   25
                                                                                                      22 20
                                           20 18                    20
     dams/lagoons and swimming pools
     both recorded a 20% reduction on                                                                                             11
     the 10 year average.                                                                                                     7

                                           Bathtub     Beach    Lake/Dam Ocean River/Creek Rocks              Swimming       Other
     Swimming and recreating was the      /Spa Bath              /Lagoon /Harbour /Stream                       Pool
     leading activity being undertaken
     immediately prior to drowning                                   2017/18        10 year average
     (25%), followed by boating-related
     incidents (15%).                     Figure 9: Drowning Deaths by Location, 2017/18, 10 Year Average

                                                                   Unknown                      Bathing
                                                                     13%                          9%

                                                      Watercraft
                                                         2%                                                     Boating
                                                                                                                 15%

                                                                                                                         Diving
                                                                                                                          4%
                                           Swimming
                                          & Recreating
                                             25%

                                                                                                                 Fall 14%

                                                                 Rock                         Fishing 2%
                                                                Fishing
                                                                        Rescue Non-     Jumped
                                                                  4%
                                                                          2% aquatic      In
       RIVERS, CREEKS AND                                                                 2%
       STREAMS REMAIN THE                                                     Transport
       LEADING LOCATION FOR                                                      8%
       DROWNING IN AUSTRALIA
                                          Figure 10: Drowning Deaths by Activity Immediately Prior, 2017/18,
                                                     10 Year Average

       SWIMMING AND RECREATING
       ACCOUNTED FOR ONE
       QUARTER OF ALL DROWNING
       DEATHS IN 2017/18

12
DROWNING DEATHS BY LOCATION

         61
   RIVER/CREEK/STREAM

         46
         BEACHES

          40
     OCEAN/HARBOUR

          33
    SWIMMING POOLS

                              NATIONAL DROWNING REPORT 2018   13
LOCATION IN FOCUS: RIVERS/CREEKS/STREAMS

     There were 61 drowning

                                                                                                                                                     106
     deaths in rivers, creeks and
     streams across Australia in

                                                                                   83

                                                                                                                                                                                                    80
                                                                                                                           78
                                              77

                                                                         74
     2017/18. This represents a 10%

                                                                                                                                                                                                                                                                            73
                                                                                                            73

                                                                                                                                                                70
                                                                                              70

                                                                                                                                                                                                                                              68
                                                                                                                                           68

                                                                                                                                                                              68
                                                           67

                                                                                                                                                                                                                  63
     reduction on 2016/17 and a

                                                                                                                                                                                                                                                            61
                                                                                                                                                                                                                             58
     16% reduction when compared
     to the 10 year average.

     The 25-34 years age group recorded
     for the largest number of drowning

                                              2002/03

                                                           2003/04

                                                                         2004/05

                                                                                   2005/06

                                                                                              2006/07

                                                                                                             2007/08

                                                                                                                           2008/09

                                                                                                                                           2009/10

                                                                                                                                                     2010/11

                                                                                                                                                                2011/12

                                                                                                                                                                                  2012/13

                                                                                                                                                                                                    2013/14

                                                                                                                                                                                                                  2014/15

                                                                                                                                                                                                                             2015/16

                                                                                                                                                                                                                                              2016/17

                                                                                                                                                                                                                                                            2017/18

                                                                                                                                                                                                                                                                            10 Yr Avg
     deaths, with 12 fatalities. This year,
     there were no drowning deaths in
     the 5-9 years and the 15-17 years
     age groups in rivers.
                                              Figure 11: Drowning Deaths in River/Creek/Stream Locations 2002/03
     In 28% of cases the activity prior to               to 2017/18, 10 Year Average
     drowning in a river was unknown,
     indicating the person was alone
     when they drowned and the
     activity prior to drowning was                                                                                                                   12
     not witnessed.                                                                                                                                            11
                                                                                                                                                                                      10                                               10          10
                                                                                                                                     9        9                                                         9         9
                                                                                                                                                                                                                                                               8                 8
                                                                                                                                                                                                                             7
                                                                                                                                                                              6
                                                                                                                                                                                                                                                                      5

                                                           3
                                                                              2                   2                    2
                                                1                    0                  1                   0

                                                 0-4                     5-9          10-14               15-17                  18-24 25-34 35-44 45-54 55-64 65-74                                                                                                  75+
                                                                                                                       2017/18                          10 year average

                                              Figure 12: River/Creek/Stream Drowning Deaths by Age Group, 2017/18,
                                                         10 Year Average

                                                                                                                                                                                                                                                                      17
                                                                                             14
                                                                                                                                                     13                                                               13
                                                                                                                                               12
                                                                                   11                                                                                                                                                                                        11
                                                                                                                                                                                                              10
       RIVER DROWNING DEATHS
                                                           7
       HAVE DECREASED BY 16% IN
       2017/18 WHEN COMPARED                                                                                                           4
                                               3                     1                                                     3                                              1                         3                                         3                 1
                                                                              0                       2           2                                            0                     0                                           2                      0
       TO THE 10 YEAR AVERAGE
                                                 Boating

                                                                     Diving

                                                                                     Fall

                                                                                                        Fishing

                                                                                                                           Jumped In

                                                                                                                                              Non-aquatic
                                                                                                                                                Transport

                                                                                                                                                                Rescue

                                                                                                                                                                                       Swept Away

                                                                                                                                                                                                              Swimming &
                                                                                                                                                                                                                Recreating

                                                                                                                                                                                                                                 Watercraft

                                                                                                                                                                                                                                                        Other

                                                                                                                                                                                                                                                                       Unknown

                                                                                                                       2017/18                        10 year average

                                              Figure 13: River/Creek/Stream Drowning Deaths by Activity Immediately Prior
                                                         to Drowning, 2017/18, 10 Year Average

       UNKNOWN ACTIVITIES
       ACCOUNTED FOR 28%
       OF DROWNING DEATHS
       IN RIVERS IN 2017/18

14
CASE STUDY
RESEARCH USES MIXED
METHODS TO REVISE FATAL
RIVER DROWNING RATES
Royal Life Saving and James Cook
University researchers have published
a study in the Injury Prevention journal
examining river visitation and its impact
on drowning risk. Using fatal river
drowning data from the Royal Life Saving
National Fatal Drowning Database and
nationally representative survey data on
river visitation, river drowning risk based
on exposure for adults was estimated.
The study also examined differences in
traditional river drowning rates per 100,000
population when exposure was considered.

After adjusting for exposure, the study
found males were 8 times more likely than
females to drown in rivers in Australia.
Males aged 75 years and over and females
aged 55-74 years were at highest risk of
river drowning. Males were nine times more
likely to drown with alcohol present and 26
times more likely to drown in a boating or
watercraft-related incident than females.

The research addresses a gap in the
published literature, around exposure to
drowning at rivers, the leading location
for drowning in Australia, and a common
drowning location globally. While
challenging to calculate, the findings of
this research will guide the targeting of
future river drowning prevention strategies
to those most at risk.

For more information on the study
please visit injuryprevention.bmj.com

              MALES WERE 8 TIMES
              MORE LIKELY TO
              DROWN IN RIVERS

                   NATIONAL DROWNING REPORT 2018   15
LOCATION IN FOCUS: BEACHES

     There were 46 drowning

                                                                                                                                                                   65

                                                                                                                                                                                                        61
     deaths at Australian beaches

                                                                                                                                                                                              57
                                                                                             55
     in 2017/18. This represents a

                                                                                                                                                        53

                                                                                                                                                                                                                      49

                                                                                                                                                                                                                                                        47
                                                                                 47
     6% reduction on 2016/17 and a

                                                         46

                                                                                                                                                                                                                                46
                                                                   44

                                                                                                                     43

                                                                                                                                   41
     2% reduction when compared

                                           38

                                                                                                       38

                                                                                                                                             35

                                                                                                                                                                                 32
     to the ten year average.

     Drowning deaths at beaches in the
     35-44 years age group doubled in
     2017/18 when compared to the
     10 year average. There were no

                                           2002/03

                                                         2003/04

                                                                       2004/05

                                                                                 2005/06

                                                                                             2006/07

                                                                                                       2007/08

                                                                                                                     2008/09

                                                                                                                                   2009/10

                                                                                                                                             2010/11

                                                                                                                                                        2011/12

                                                                                                                                                                   2012/13

                                                                                                                                                                                  2013/14

                                                                                                                                                                                              2014/15

                                                                                                                                                                                                        2015/16

                                                                                                                                                                                                                      2016/17

                                                                                                                                                                                                                                2017/18

                                                                                                                                                                                                                                                        10 Yr Avg
     drowning deaths at beaches of
     children under 10 years.

     70% of all beach drowning deaths
     in 2017/18, occurred as a result of   Figure 14: Beach Drowning Deaths 2002/03 to 2017/18, 10 Year Average
     swimming and recreating.

                                                                                                                                                                  12

                                                                                                                                                       9                                                          9
                                                                                                                               8
                                                                                                                                                                                              7
                                                                                                                                      6                                 6                               6
                                                                                                                                              5                                           5                                        5
                                                                                                                                                                                                                                                           4
                                                                                                                                                                                                                            3                  3
                                                      1                      1       2           1     2         1
                                             0                     0

                                              0-4                  5-9              10-14              15-17              18-24 25-34 35-44 45-54 55-64 65-74                                                                                   75+
                                                                                                                 2017/18                        10 year average

                                           Figure 15: Beach Drowning Deaths by Age Group, 201/18, 10 Year Average

                                                                                                                                             32

                                                                                                                                                       26

       BEACH DROWNINGS
       DOWN 2% AGAINST
       THE 10 YEAR AVERAGE

                                                                                                                                                                                          7
                                                               1                             5                                                                                                          1         1                                 4
                                                                                  4                              4       3                                                                                                                3
                                                     0                                                                                                                       2
                                                     Boating

                                                                                    Diving

                                                                                                                 Recue

                                                                                                                                             Swimming &
                                                                                                                                               Recreating

                                                                                                                                                                             Watercraft

                                                                                                                                                                                                         Other

                                                                                                                                                                                                                                          Unknown

                                                                                                                     2017/18                       10 year average

       23% INCREASE ON BEACH               Figure 16: Beach Drowning Deaths by Activity Immediately Prior to Drowning,
                                                       2017/18, 10 Year Average
       DROWNING DEATHS AS A
       RESULT OF SWIMMING AND
       RECREATING, COMPARED
       TO 10 YEAR AVERAGE

16
CASE STUDY
DROWNING AS A
GLOBAL ISSUE
Drowning is a serious and neglected public
health issue which the World Health
Organization (WHO) estimates claims the
lives of 360,000 people every year around
the world. More than 90% of these
drowning deaths occur in low and middle
income countries, many of which are in
our region.

In December 2017, Royal Life Saving
Society – Australia, in partnership with
WHO Western Pacific Region gathered 14
delegates from 7 countries for a workshop
aimed at scaling up drowning prevention
efforts in priority countries of the Western
Pacific region.

Drowning rates in the countries
represented are extremely high by
comparison with Australia. Below we
compare Australia’s drowning rate to those
in the region, and to similar economies
around the world. Rates are drawn from
the WHO Department of Information,
Evidence and Research for 2016.

                                     Cambodia                             11.2

                                          China       3.9
Other countries in the region

                                             Fiji                  8.0

                                     Philippines            5.5

                                Solomon Islands            4.7

                                      Viet Nam                    7.2

                                       Thailand                     8.2

                                      Australia     0.8

                                       Canada        0.9
Similar economies

                                  New Zealand         1.4

                                United Kingdom      0.5

                                  United States
                                    of America        1.4

Figure 17: Crude drowning rates per 100,000
population among countries in the Western
Pacific region, Australia and similar economies

                                                    NATIONAL DROWNING REPORT 2018   17
LOCATION IN FOCUS: OCEAN/HARBOUR

     There were 40 drowning

                                           74
     deaths at ocean/harbour

                                                                                                                    64
     locations in 2017/18,

                                                                                                                                                                                                          54
     representing an 11% reduction

                                                                                            50
                                                                   45

                                                                                 45

                                                                                                                                                                 45

                                                                                                                                                                                                                        45
     on 2016/17 and a 9% reduction

                                                                                                                                                                                                                                                      44
                                                        42

                                                                                                                                  42

                                                                                                                                                       42

                                                                                                                                                                                                                                  40
                                                                                                                                            39
                                                                                                      37

                                                                                                                                                                                                37
     on the ten year average.

                                                                                                                                                                                   30
     The 65-74 years age group recorded
     the highest number of drowning
     deaths at ocean/harbour locations,
     an increase of 50% on the 10 year

                                           2002/03

                                                         2003/04

                                                                       2004/05

                                                                                 2005/06

                                                                                            2006/07

                                                                                                      2007/08

                                                                                                                    2008/09

                                                                                                                                  2009/10

                                                                                                                                            2010/11

                                                                                                                                                       2011/12

                                                                                                                                                                     2012/13

                                                                                                                                                                                   2013/14

                                                                                                                                                                                                2014/15

                                                                                                                                                                                                          2015/16

                                                                                                                                                                                                                        2016/17

                                                                                                                                                                                                                                  2017/18

                                                                                                                                                                                                                                                      10 Yr Avg
     average. There were no drowning
     deaths among children under 10
     years of age or adolescents aged
     15 to 17 years in ocean/harbour
     locations in 2017/18.                 Figure 18: Ocean/Harbour Drowning Deaths 2002/03 to 2017/18,
                                                      10 Year Average
     Boating-related incidents accounted
     for 70% of drowning deaths at
     ocean/harbour locations in 2017/18,                                                                                                                                                                                      9
     a 22% increase when compared to
                                                                                                                                             8                            8                     8
     the ten year average.
                                                                                                                                                      7                                                             7
                                                                                                                                                                                       6                  6                          6
                                                                                                                                                                 5

                                                                                                                              3      3                                                                                                                    3
                                                                                                                                                                                                                                                2

                                             0         0           0        0         1     0         0         0

                                              0-4                  5-9              10-14             15-17              18-24 25-34 35-44 45-54 55-64 65-74                                                                                    75+
                                                                                                                2017/18                        10 year average

                                           Figure 19: Ocean/Harbour Drowning Deaths by Age Group, 2017/18,
                                                      10 Year Average

                                                 28

                                                           23

       OCEAN/HARBOUR
       DROWNING DEATHS
       REDUCE BY 9% COMPARED
                                                                                                                                              5
       TO THE 10 YEAR AVERAGE                                                              11

                                                                                  4                                                                                                         2                                               2
                                                                                                                0        1                             1                       1                                        3                             3
                                                                                                                                                                                                              0
                                                     Boating

                                                                                   Diving

                                                                                                                Fall

                                                                                                                                            Non-aquatic
                                                                                                                                              Transport

                                                                                                                                                                               Watercraft

                                                                                                                                                                                                               Other

                                                                                                                                                                                                                                            Unknown

                                                                                                                    2017/18                           10 year average

       BOATING-RELATED                     Figure 20: Ocean/Harbour Drowning Deaths by Activity Immediately Prior
       INCIDENTS ACCOUNT FOR                          to Drowning, 2017/18, 10 Year Average
       70% OF OCEAN/HARBOUR
       DROWNING DEATHS

18
CASE STUDY
MULTIPLE FATALITY EVENTS
There were 8 multiple fatality events
(MFEs) in 2017/18 that claimed the lives of
21 people.

A detailed analysis of these events found:
• Males accounted for 76% of all
  drowning deaths
• The largest number of drowning deaths
  occurred in the 65-74 years age group,
  accounting for 24% of all deaths as a result
  of an MFE
• Queensland recorded 14 deaths as a result
  of MFEs, while New South Wales recorded
  four deaths
• Two thirds (67%) of all drowning deaths as
  a result of MFEs occurred in ocean/harbour
  locations, followed by rivers, creeks and
  streams (14%)
• The leading activity related to deaths as a
  result of MFEs was boating, accounting for
  57% of all deaths, followed by non-aquatic
  transport incidents (24%)

Multiple fatality events are tragic with
far-reaching effects on the victims’ families,
communities and rescue personnel. In order
to reduce the number of MFEs every year,
as well as reduce the number of lives lost, a
number of drowning prevention strategies
can be undertaken.

These include ensuring lifejackets are
worn when boating or rock fishing,
ensuring boats are seaworthy and fitted
with appropriate safety equipment,
monitoring weather reports and water
conditions before and during activity,
and avoiding driving, walking or wading
through floodwaters.

    08
MULTIPLE FATALITY EVENTS
IN 2017/18 THAT CLAIMED
THE LIVES OF 21 PEOPLE

                     NATIONAL DROWNING REPORT 2018   19
LOCATION IN FOCUS: SWIMMING POOLS

     There were 33 drowning

                                                                                                                                57
     deaths in swimming pools

                                                     51

                                                                                                                  50
     in Australia in 2017/18. This

                                           47

                                                                                                   46

                                                                                                                                                                                                  45
                                                                  44

                                                                                                                                                                                                                44
                                                                                                                                                              43

                                                                                                                                                                                                                                            41
     represents a 25% decrease

                                                                                         41

                                                                                                                                                                            40
                                                                               37

                                                                                                                                          36
     compared to 2016/17 and a

                                                                                                                                                                                                                              33
                                                                                                                                                                                        32
     20% decrease against the 10
     year average.

                                                                                                                                                    21
     Public swimming pools accounted
     for just 9% of all drowning deaths
     in swimming pools in Australia in

                                           2002/03

                                                      2003/04

                                                                     2004/05

                                                                               2005/06

                                                                                         2006/07

                                                                                                   2007/08

                                                                                                                  2008/09

                                                                                                                                2009/10

                                                                                                                                          2010/11

                                                                                                                                                    2011/12

                                                                                                                                                                  2012/13

                                                                                                                                                                            2013/14

                                                                                                                                                                                        2014/15

                                                                                                                                                                                                  2015/16

                                                                                                                                                                                                                2016/17

                                                                                                                                                                                                                              2017/18

                                                                                                                                                                                                                                            10 Yr Avg
     2017/18.

     Children under five recorded the
     largest number of drowning deaths
                                           Figure 21: Swimming Pool Drowning Deaths 2002/02 to 2017/18,
     in swimming pools, accounting for
                                                      10 Year Average
     36% of all swimming pool drowning
     deaths in 2017/18. There were no
     swimming pool drowning fatalities
     among those aged 5-24 years.                    15

     Falls into swimming pools were the
                                            12
     leading activity immediately prior
     to drowning, accounting for 55%
     of all swimming pool drowning
     deaths. Drowning deaths as a result
                                                                                                                                                                                                                                        7
     of swimming and recreating have
     declined In 2017/18 by 20% when                                                                                                                          5                                                                                5
     compared to the ten year average.                                                                                                                                                  4                                        4
                                                                                                                                                    3                  3            3             3
                                                                          2               1                  1                     2        1                                                               2         2
                                                                0                  0               0                        0

                                              0-4                5-9              10-14            15-17               18-24 25-34 35-44 45-54 55-64 65-74                                                                              75+
                                                                                                             2017/18                         10 year average

                                           Figure 22: Swimming Pool Drowning Deaths by Age Group, 2017/18,
                                                      10 Year Average

                                                                        22

                                                                18
       SWIMMING POOL
       DROWNING DEATHS                                                                                                      15
       DECREASE BY 20% AGAINST
       THE 10 YEAR AVERAGE                                                                                       10

                                                                                                                                                                                2                                         4
                                                                                                                                                                       1                                                            3
                                                                 Fall

                                                                                                                 Swimming &
                                                                                                                   Recreating

                                                                                                                                                                        Other

                                                                                                                                                                                                                          Unknown

                                                                                                                 2017/18                        10 year average

       FALLS INTO SWIMMING                 Figure 23: Swimming Pool Drowning Deaths by Activity Immediately Prior
       POOLS WERE THE LEADING                         to Drowning, 2017/18, 10 Year Average
       ACTIVITY IMMEDIATELY
       PRIOR TO DROWNING

20
CASE STUDY
NATIONAL AQUATIC
INDUSTRY SAFETY AWARDS
Six representatives from Australia’s Aquatic
Industry have been recognised in the
National Aquatic Industry Safety Awards.
Presented by Royal Life Saving Society –
Australia, the group of individuals and
organisations have been recognised for
their significant contribution to aquatic
safety within their community.

The 2018 award winners were:
• Excellence in Public Education –
  YMCA Casey RACE
• Excellence in Supervision –
  Ian Thorpe Aquatic Centre (pictured)
• Excellence in Customer Service –
  Christine Mitchell
• Excellence in Incident Management –
  YMCA Victoria
• Excellence in Staff Development –
  City of Greater Geelong
• Excellence in Facility Management –
  Cockburn Aquatic and Recreation Centre

The awards are an initiative of the National
Aquatic Industry Safety Committee to
acknowledge the achievements of aquatic
facilities and individuals towards improving
health and safety outcomes.

Between 1 July 2005 and 30 June 2015,
there were 293 drowning incidents in public
and commercial pools across Australia.
Thirty-six of these were fatal (12%).

A series of videos have been produced of
each winner, showcasing their work and
contribution to their community through
their aquatic health and safety initiatives.

To view the winner’s videos please visit:
youtube.com/RoyalLifeSavingAust

                     NATIONAL DROWNING REPORT 2018   21
22
DROWNING DEATHS BY LIFE STAGES

             18
   CHILDREN AGED 0-4 YEARS

              9
  CHILDREN AGED 5-14 YEARS

            29
YOUNG PEOPLE AGED 15-24 YEARS

         103
   MALES AGED 25-64 YEARS

            52
PEOPLE AGED 65 YEARS AND OVER
                                  23
LIFE STAGE IN FOCUS: CHILDREN AGED 0-4 YEARS

     There were 18 children aged

                                          42

                                                                             42
     0-4 years who drowned in

                                                     39

                                                                                       37

                                                                                                           35

                                                                                                                     35
     Australia in 2017/18. This is a

                                                                                                                                                    33
     38% reduction on 2016/17 and a

                                                                                                                                                                                            29
                                                                                                                                28

                                                                                                                                                                                                                            28
                                                                                                 27

                                                                                                                                                                        26
     36% reduction when compared

                                                                   25

                                                                                                                                                                                  22
                                                                                                                                          21
     to the 10 year average.

                                                                                                                                                              20

                                                                                                                                                                                                          18
     Swimming pools were the leading
     location for drowning among this
     age group, accounting for 67% of
     all drowning deaths. Swimming pool

                                          2002/03

                                                     2003/04

                                                                   2004/05

                                                                             2005/06

                                                                                       2006/07

                                                                                                 2007/08

                                                                                                           2008/09

                                                                                                                      2009/10

                                                                                                                                2010/11

                                                                                                                                          2011/12

                                                                                                                                                    2012/13

                                                                                                                                                              2013/14

                                                                                                                                                                        2014/15

                                                                                                                                                                                  2015/16

                                                                                                                                                                                            2016/17

                                                                                                                                                                                                          2017/18

                                                                                                                                                                                                                            10 Yr Avg
     drowning deaths in children under
     five have reduced by 20% when
     compared to the 10 year average.

     Accidental falls into water remain   Figure 24: Drowning Deaths of Children 0-4 Years, 2002/03 to 2017/18,
     the leading activity prior to                   10 Year Average
     drowning among children under
     five, with 14 drowning deaths or
     78% of all drowning deaths.                                                                                                                                           15

                                                                                                                                                                  12

                                                                   4
                                                     3                                               3                          1         3                                                                             3
                                                                                             0                                                                                                        2

                                                     Bathtub                           Lake/Dam                            River/Creek                        Swimming                                    Other
                                                    /Spa Bath                           /Lagoon                              /Stream                            Pool

                                                                                                           2017/18                    10 year average

                                          Figure 25: Drowning Deaths of Children 0-4 Years by Location, 2017/18,
                                                     10 Year Average

       DROWNING DEATHS                                                                                               21
       AMONG CHILDREN UNDER
       FIVE DOWN BY 36% ON
       THE 10 YEAR AVERAGE                                                                                 14

                                                               4         4                                                                                       1                                                  1
                                                                                                                                                       0                                              0
                                                               Bathing

                                                                                                             Fall

                                                                                                                                                       Swimming &
                                                                                                                                                         Recreating

                                                                                                                                                                                                      Other

       SWIMMING POOLS                                                                                      2017/18                    10 year average
       ACCOUNT FOR 67% OF
                                          Figure 26: Drowning Deaths of Children 0-4 Years by Activity Immediately Prior
       ALL DROWNING DEATHS                           to Drowning, 2017/18, 10 Year Average
       AMONG CHILDREN UNDER
       FIVE YEARS OF AGE

24
CASE STUDY
ANALYSIS OF CAUSAL
FACTORS FOR DROWNING
OF CHILDREN UNDER
FIVE IN NSW PRIVATE
SWIMMING POOLS
Children under the age of five are at
the highest risk of drowning, with home
swimming pools the leading location for
fatalities. Strategies for the prevention
of child drowning include active adult
supervision, restricting a child’s access to
water, water awareness and resuscitation.

Between 1 July 2002 and 30 June 2017, 91
children aged 0-4 years drowned in NSW
private swimming pools.

• Peak drowning times
  - 41% in summer
  - 42% on weekends
  - 45% during the afternoon

• Supervision was completely absent in
  64% of cases

• A further 6% of children were left to be
  supervised by siblings or other children

• Supervision was absent for 5-10 minutes
  in 35% of cases and 3-5 minutes in 24%
  of cases

• In 71% of cases the child drowned in the
  pool located at their primary residence

• The most common means of
  access were:
  - 38% faulty fence or gate
  - 26% lack of fence
  - 24% gate propped open

• In 67% of cases the parents of the child
  were the ones to commence CPR

Source: Mahony, A, Peden, AE (2017) NSW Child
Drowning Report: A 15 year analysis of causal
factors for drowning of children under 5 years in
private swimming pools 2002/03-2016/17, Royal
Life Saving Society – Australia. Sydney
LIFE STAGE IN FOCUS: CHILDREN AGED 5-14 YEARS

     There were 9 children aged

                                                                                            22
     5-14 years who drowned in
     Australia in 2017/18. This is a

                                                                    16

                                                                                                                           16
     25% reduction on 2016/17

                                            14

                                                                                                      14

                                                                                                                                     14

                                                                                                                                               14
     and when compared to the

                                                                                                                 12

                                                                                                                                                                                                          12

                                                                                                                                                                                                                                      12
                                                         11

                                                                                                                                                                                        11
     10 year average.

                                                                              10

                                                                                                                                                         10

                                                                                                                                                                    10

                                                                                                                                                                              9

                                                                                                                                                                                                                    9
     Bathtub/Spa Baths, Beaches and
     Lakes/Dam/Lagoons each recorded
     two drowning deaths each. River/

                                            2002/03

                                                         2003/04

                                                                    2004/05

                                                                              2005/06

                                                                                            2006/07

                                                                                                      2007/08

                                                                                                                 2008/09

                                                                                                                           2009/10

                                                                                                                                     2010/11

                                                                                                                                               2011/12

                                                                                                                                                         2012/13

                                                                                                                                                                    2013/14

                                                                                                                                                                              2014/15

                                                                                                                                                                                        2015/16

                                                                                                                                                                                                          2016/17

                                                                                                                                                                                                                    2017/18

                                                                                                                                                                                                                                      10 Yr Avg
     Creek/Stream locations saw a 75%
     reduction against the 10 year
     average in 2017/18.

     Swimming and recreating was the
     leading activity immediately prior     Figure 27: Drowning Deaths of Children 5-14 Years, 2002/03 to 2017/18,
     to drowning, accounting for 56% of                10 Year Average
     all deaths in this age group. There
     were no drowning deaths as a result
     of accidental falls into water or                                                                                                                                   4
     watercraft-related incidents in this
     age group in 2017/18.
                                                                                                                                                                                                                                      3

                                                 2                            2             2              2           2

                                                                1                                                                     1                        1                         1
                                                                                                                                               0                                                          0               0

                                             Bathtub                          Beach                   Lake/Dam                       Ocean/ River/Creek                                 Rocks                       Swimming
                                            /Spa Bath                                                  /Lagoon                       Harbour  /Stream                                                                 Pool

                                                                                                                 2017/18                   10 year average

                                            Figure 28: Drowning Deaths of Children 5-14 Years by Location, 2017/18,
                                                       10 Year Average

       CHILD DROWNINGS AT
       RIVERS, CREEKS AND                                                                                                                                      5         5
       STREAMS DOWN BY 75%
       IN 2017/18 COMPARED TO
       THE 10 YEAR AVERAGE
                                                                                                                       3

                                                 2

                                                                1             1             1                                        1         1                                                          1                           1
                                                                                                            0                                                                           0                                     0
                                                      Bathing

                                                                                  Boating

                                                                                                                Fall

                                                                                                                                      Non-aquatic
                                                                                                                                        Transport

                                                                                                                                                               Swimming &
                                                                                                                                                                 Recreating

                                                                                                                                                                                             Watercraft

                                                                                                                                                                                                                              Other

                                                                                                                 2017/18                   10 year average
       SWIMMING AND
       RECREATING THE LEADING
                                            Figure 29: Drowning Deaths of Children 5-14 Years by Activity Immediately
       ACTIVITY PRIOR TO                               Prior to Drowning, 2017/18, 10 Year Average
       DROWNING IN
       CHILDREN 5-14 YEARS

26
CASE STUDY
SECONDARY SCHOOL
CHILDREN AGED 13-15
YEARS ATTENDING
PRIVATE SWIM SCHOOLS
This research follows on from the report
‘Benchmarking Australian children’s
swimming and water safety skills: swim
school data part one’, which presented the
swimming and water safety skills of primary
school children aged 5-12 years attending
private swim school lessons. This report
analyses the skills of secondary school
children aged 13-15 years (teenagers)
attending private lessons.

A total of 2860 secondary school aged
children (13-15 years) (N = 2,844)
attending private swimming lessons in
Victoria, South Australia and New South
Wales. Lesson cost ranged from $15.00
to $21.83, with 70.4% being charged
$15.50 per lesson. Teenagers were most
commonly in lessons for the duration of
one swim school level, or the equivalent of
25 lessons over a period of 5.8 months

Very few teenagers enrolled in lessons
are achieving the minimum competencies
outlined in the National Swimming and
Water Safety Framework. Approximately
40% were being taught skills that were
described as ‘basic’ or ‘introduction’,
‘beginner’ or ‘water familiarisation’ skills.
Overall, 30% were able to swim 50m or
more of any stroke and 76% could swim
a distance between 10 and 25m. Only 7%
could swim over 200m. Of those competent
in treading/sculling water, 31% could
stay afloat for at least 2 minutes and an
additional 19% could tread/scull water for
at least 2 minutes wearing clothes.

These results suggest that many teenagers
attending private lessons are achieving well
below the expected benchmark standard
for their age, and that they may have had
little, if any, swimming and water safety
education previously.

Source: Pidgeon, S., Larsen, P., Barnsley, P., Scarr, J.,
Peden, A. (2018) Benchmarking Australian
childrens’ swimming and water safety skills: swim
school data part 2 beyond primary school. Royal
Life Saving Society – Australia. Sydney.

                          NATIONAL DROWNING REPORT 2018     27
LIFE STAGE IN FOCUS: YOUNG PEOPLE AGED 15-24 YEARS

     There were 29 young people

                                                                                                                                                                43
     aged 15-24 years who drowned

                                                                                                                                                                                         40
                                                                                                                        39
                                                                                 35

                                                                                                                                  35
                                                         35
     in Australia in 2017/18. This is

                                                                   34

                                                                                                          33

                                                                                                                                                                                                                                                                   33
                                                                                                32
                                           32

                                                                                                                                                   31

                                                                                                                                                                                                                              31
     a 7% reduction on 2016/17

                                                                                                                                                                                                                                        29
                                                                                                                                                                              28

                                                                                                                                                                                                                  26
                                                                                                                                                                                                   25
     and a 12% reduction on the
     10 year average.

     Beaches were the leading location
     for drowning among 15-24 year
     olds, accounting for 34%. This

                                           2002/03

                                                         2003/04

                                                                   2004/05

                                                                                 2005/06

                                                                                                2006/07

                                                                                                          2007/08

                                                                                                                        2008/09

                                                                                                                                  2009/10

                                                                                                                                                   2010/11

                                                                                                                                                                2011/12

                                                                                                                                                                              2012/13

                                                                                                                                                                                         2013/14

                                                                                                                                                                                                   2014/15

                                                                                                                                                                                                                   2015/16

                                                                                                                                                                                                                              2016/17

                                                                                                                                                                                                                                           2017/18

                                                                                                                                                                                                                                                                   10 Yr Avg
     was followed by river/creek/
     stream locations which accounted
     for 31%. There were no
     swimming pool drowning deaths
     among this age group in 2017/18.
                                           Figure 30: Drowning Deaths of Young People 15-24 Years, 2002/03 to
     Swimming and recreating was                      2017/18, 10 Year Average
     the leading activity immediately
     prior to drowning in 2017/18,
     accounting for 48% of all                                                                                                                                                11
     drowning deaths in this age                                         10
     group. There were no drowning                                                                                                                               9
     deaths associated with boating-
     related incidents in this age group                                               7
     in 2017/18.

                                                                                                                                              4                                                      4
                                                                                                          3         3             3                                                         3                                     3
                                                 1           1
                                                                                                                                                                                                                                                               2
                                                                                                                                                                                                                          0                          0

                                            Bathtub                      Beach                     Lake/Dam Ocean/ River/Creek Rocks                                                                              Swimming                           Other
                                           /Spa Bath                                                /Lagoon Harbour /Stream                                                                                         Pool

                                                                                                                        2017/18                          10 year average

                                           Figure 31: Drowning Deaths of Young People 15-24 Years by Location, 2017/18,
                                                       10 Year Average

                                                                                                                                                                                    14
                                                                                                                                                                                           12
       DROWNING DEATHS
       IN THIS AGE GROUP
       DECLINED BY 12% AGAINST
       THE 10 YEAR AVERAGE                   1           1
                                                                             2
                                                                                           1
                                                                                                    2                                        4                            2
                                                                                                                                                                                                       1
                                                                                                                                                                                                                   2                    4                      2
                                                                                                              3 3                  3                          3                                                                                      3
                                                                   0                                                                                                                                                          0
                                               Bathing

                                                                    Boating

                                                                                               Diving

                                                                                                                    Fall

                                                                                                                                       Jumped-In

                                                                                                                                                             Non-aquatic
                                                                                                                                                               Transport

                                                                                                                                                                                   Swimming &
                                                                                                                                                                                     Recreating

                                                                                                                                                                                                             Watercraft

                                                                                                                                                                                                                                   Other

                                                                                                                                                                                                                                                         Unknown

                                                                                                                        2017/18                          10 year average

                                           Figure 32: Drowning Deaths of Young People 15-24 Years by Activity Immediately
                                                      Prior to Drowning, 2017/18, 10 Year Average

       BEACH DROWNING DEATHS
       INCREASED BY 43% ON THE
       10 YEAR AVERAGE

28
CASE STUDY
FATAL DROWNINGS
UNDERREPORTED USING
ICD-10 CODING
Royal Life Saving researchers have published
a study in the journal BMJ Open (Dec 2017).
The study examined fatal drowning counts
via International Classification of Diseases
(ICD)-10 classifications using single and
multiple underlying causes of death, and
compared this to multi-source data collected
by Royal Life Saving.

The ICD-10 classification is the most
frequently used coding framework
internationally to describe deaths. Global
estimates, such as those reported by the
World Health Organization and the Global
Burden of Disease studies, rely on ICD-10
coding, and commonly only report a single
underlying cause of death.

The study used three different reporting
methodologies to describe unintentional
fatal drowning compared with the total
number of cases. It provides a greater
depth of understanding on how the
grouping of ICD-10 codes and the number
of included underlying causes of death can
impact the fatal drowning count.

The study found drowning deaths due to
boating and watercraft-related incidents
and non-aquatic transport incidents,
which largely occur in natural waterways,
were not well captured. This resulted in a
40% underreport of fatal unintentional
drowning in Australia between 2001-2011
when comparing ICD-10 based estimates
with those of Royal Life Saving Society –
Australia. In contrast, child drowning deaths
and those which occurred in swimming
pools and bathtubs, were well captured.

This study has highlighted the need for
more inclusive methodologies when
calculating the burden of fatal drownings
in Australia. The authors encourage similar
studies in other countries and discuss the
impact of ICD-10 coding methodologies on
the estimates of non-fatal drowning.

More information and to access a
free copy of the study please visit:
bmjopen.bmj.com

                    NATIONAL DROWNING REPORT 2018   29
LIFE STAGE IN FOCUS: MALES AGED 25-64 YEARS

     There were 103 drowning

                                         148

                                                                                                                                                                                                                      141
                                                                               140
     deaths of males aged 25-64

                                                                                                                                                                         134
                                                      131

                                                                                                                         129

                                                                                                                                                                                            125
                                                                                                                                       124
     years in Australia in 2017/18.

                                                                                                                                                                                                                                                                      122
                                                                                                                                                                                                           118
                                                                  116

                                                                                                                                                                                                                                        114
                                                                                           113

                                                                                                         113

                                                                                                                                                  111

                                                                                                                                                            106
     This is a 10% reduction on

                                                                                                                                                                                                                                                   103
     2016/17 and a 16% reduction on
     the 10 year average.

     River/creek/stream locations were
     the leading location for drowning
     among males aged 25-64 years in
     2017/18, accounting for 26% of

                                         2002/03

                                                      2003/04

                                                                  2004/05

                                                                               2005/06

                                                                                              2006/07

                                                                                                          2007/08

                                                                                                                         2008/09

                                                                                                                                       2009/10

                                                                                                                                                  2010/11

                                                                                                                                                            2011/12

                                                                                                                                                                         2012/13

                                                                                                                                                                                            2013/14

                                                                                                                                                                                                           2014/15

                                                                                                                                                                                                                      2015/16

                                                                                                                                                                                                                                        2016/17

                                                                                                                                                                                                                                                   2017/18

                                                                                                                                                                                                                                                                      10 Yr Avg
     all drowning deaths in this age
     group. River drowning deaths
     among this cohort in 2017/18 have
     reduced by 18% when compared
     to the 10 year average.             Figure 33: Drowning Deaths of Males Aged 25-64 Years, 2002/03 to 2017/18,
                                                    10 Year Average
     Boating-related incidents
     accounted for 20% of all drowning
     deaths of males 25-64 years in                                                                                                                                      33
     2017/18, followed by swimming
     and recreating, which accounted                                                                                                             27         27
     for 19% of all drowning deaths in                                             25
     this cohort.                                                                                                                    22
                                                                          18
                                                                                                                                                                                                  14
                                                                                                        11          11                                                                                      12
                                                                                                                                                                                                                                             8
                                             6           3                                                                                                                                                                 3                                 2        3

                                          Bathtub                         Beach                  Lake/Dam Ocean/ River/Creek Rocks                                                                                    Swimming                               Other
                                         /Spa Bath                                                /Lagoon Harbour /Stream                                                                                               Pool

                                                                                                                     2017/18                            10 year average

                                         Figure 34: Drowning Deaths of Males Aged 25-64 Years by Location, 2017/18,
                                                    10 Year Average

       A 16% REDUCTION IN                                                                                                                                                                                     28
       DROWNING DEATHS OF
       MALES 25-64 YEARS                                    21 20                                                         3
                                                                                                                                                                                                      20
       RECORDED AGAINST THE                                                                                                                                                                                                                                      15
       10 YEAR AVERAGE                                                                   11                                                                                                                                                                            12
                                                                                                    9 9                                                                                     9                                       10
                                          6 3                                                                                      3        7 8             3               6                                                                     2 5
                                                                               5                                     4                                              4                                                   5
                                            Bathing

                                                                Boating

                                                                                  Diving

                                                                                                        Fall

                                                                                                                           Fishing

                                                                                                                                         Non-aquatic
                                                                                                                                           Transport

                                                                                                                                                                Rescue

                                                                                                                                                                                   Rock Fishing

                                                                                                                                                                                                       Swimming &
                                                                                                                                                                                                         Recreating

                                                                                                                                                                                                                                Watercraft

                                                                                                                                                                                                                                                  Other

                                                                                                                                                                                                                                                                  Unknown

                                                                                                                    2017/18                        10 year average

                                         Figure 35: Drowning Deaths of Males Aged 25-64 Years by Activity Immediately
                                                    Prior to Drowning, 2017/18, 10 Year Average
       RIVERS, CREEKS AND
       STREAMS THE LEADING
       LOCATION FOR DROWNING
       AMONG MALES 25-64 YEARS

30
CASE STUDY
DON’T LET YOUR MATES
DRINK AND DROWN
In the past decade, 1,995 men have
drowned in preventable tragedies. Two in
five men had drugs and/or alcohol in their
system. Men are four times more likely to
drown than women, with males accounting
for 80% of all drowning deaths.

Royal Life Saving Society - Australia, with
support of the Australian Government,
launched a new drowning prevention
campaign in time for summer 2017. The
campaign is urging men to look out for their
mates and stand up to the sorts of risk-
taking behaviour that can lead to accidents
and drowning. A culture of risk-taking
behaviour among men can be dangerous
around water, and when combined with
alcohol and/or drugs it is often fatal.

Almost a quarter (24%) of male
drowning deaths involved alcohol
alone. Of the men who had been
drinking and subsequently drowned,
67% would have failed a random
breath test with a recorded a blood
alcohol content above 0.05.

Dave is the face of the ‘Don’t Let Your Mates
Drink and Drown’ campaign. He’s an all-
round top bloke who looks out for his mates
by not letting them make stupid decisions.

Be like Dave. Look out for your mates.

For more information on the program
please visit:
royallifesaving.com.au/programs

              MALES ACCOUNT
              FOR 80% OF ALL
              DROWNING DEATHS

              24% OF MALE
              DROWNING DEATHS
              INVOLVED ALCOHOL

                    NATIONAL DROWNING REPORT 2018   31
LIFE STAGE IN FOCUS: PEOPLE AGED 65 YEARS AND OVER

     There were 52 drowning deaths

                                                                                                                                                                                                                           69
     of people aged 65 years and

                                                                                                                                                                      64
                                                                                                                                63

                                                                                                                                          59

                                                                                                                                                    59
     over in Australia in 2017/18.

                                                                                                                                                                                                           58

                                                                                                                                                                                                                                                       57
                                                                                                                      56
                                                                  54

                                                                                                                                                                                               53
     This is a 26% reduction on

                                                                                                                                                                                                                                     52
                                                                                                                                                                                   51
                                           50
     2016/17 and a 9% reduction on

                                                        45

                                                                                43
     the 10 year average.

                                                                                                        39
                                                                                              38
     Rivers, creeks and streams were
     the leading location for drowning
     among this age group in 2017/18,
     accounting for 29% of all deaths.
     Beach drowning deaths among
     this age group declined by 33%
                                           2002/03

                                                        2003/04

                                                                  2004/05

                                                                                2005/06

                                                                                              2006/07

                                                                                                        2007/08

                                                                                                                      2008/09

                                                                                                                                2009/10

                                                                                                                                          2010/11

                                                                                                                                                    2011/12

                                                                                                                                                                      2012/13

                                                                                                                                                                                   2013/14

                                                                                                                                                                                               2014/15

                                                                                                                                                                                                           2015/16

                                                                                                                                                                                                                           2016/17

                                                                                                                                                                                                                                     2017/18

                                                                                                                                                                                                                                                       10 Yr Avg
     in 2017/18, compared to the 10
     year average.

     Boating-related incidents accounted
     for the largest proportion of         Figure 36: Drowning Deaths of People Aged 65 Years and Over, 2002/03
     drowning deaths in this age group,               to 2017/18, 10 Year Average
     at 23%, an increase of 50% on the
     10 year average. There were no
     watercraft-related drowning deaths                                                                                                                               16
     in this age group in 2017/18.                                                                                                                  15

                                                                                                                                11
                                                                                                                                                                                                                              10
                                                                                      9                                                   9                                                                            9

                                                                            6
                                                5                                                                 5
                                                           4
                                                                                                        3
                                                                                                                                                                                      2          2                                             1
                                                                                                                                                                                                                                                      0
                                            Bathtub                     Beach                    Lake/Dam Ocean/ River/Creek Rocks                                                                         Swimming                            Other
                                           /Spa Bath                                              /Lagoon Harbour /Stream                                                                                    Pool

       DROWNING DEATHS                                                                                                2017/18                   10 year average
       AMONG PEOPLE AGED
       65 YEARS AND OVER                   Figure 37: Drowning Deaths of People Aged 65 Years and Over by Location,
       REDUCE BY 26% AGAINST                          2017/18, 10 Year Average
       THE 10 YEAR AVERAGE

                                                                  12                             12
                                                                                                                                                                                11 11
                                                                                                                       3
                                                                            8
                                                                                                                                     7                                                                                                             7 7
                                                                                                                                          6
                                            5                                             5
                                                     4
                                                                                                              1         1                                                                                                      1     3
                                                                                                                                                    2 2                                                  0 2
                                              Bathing

                                                                   Boating

                                                                                              Fall

                                                                                                                  Fishing

                                                                                                                                 Non-aquatic
                                                                                                                                   Transport

                                                                                                                                                       Rock Fishing

                                                                                                                                                                                Swimming &
                                                                                                                                                                                  Recreating

                                                                                                                                                                                                          Watercraft

                                                                                                                                                                                                                                 Other

                                                                                                                                                                                                                                                   Unknown

       BOATING-RELATED
       INCIDENTS THE LEADING                                                                                      2017/18                  10 year average
       CAUSE OF DROWNING
       DEATHS AMONG PEOPLE                 Figure 38: Drowning Deaths of People Aged 65 Years and Over by Activity
       65 YEARS AND OVER                              Immediately Prior to Drowning, 2017/18, 10 Year Average

32
CASE STUDY
DROWNING DEATHS
BY REMOTENESS
By collecting data on the postcode of the
drowning incident location, it is possible to
determine the remoteness classification of
the location of the drowning incident.

Drowning deaths in major cities commonly
occurred in rivers, creeks and streams
(23%), followed by beaches (21%) and
swimming pools (19%).

Swimming and recreating was the activity
being undertaken immediately prior to
drowning in 29% of drowning deaths in
inner regional areas, followed by falls (16%).

Ocean/Harbour locations accounted for the
highest proportion of drowning deaths in
outer regional areas with 36%, followed by
rivers, creeks and streams (20%).

Boating, diving and falls into water were
the leading activities being undertaken
immediately prior to drowning in rural and
remote areas, accounting for 20% each.

An increased awareness of the risks of
undertaking aquatic recreation alone in
remote locations, and the importance of
first aid and CPR skills for first responders is
vital to reducing drowning deaths.

  38%           MAJOR CITIES

  30%           INNER REGIONAL

  24%           OUTER REGIONAL

                REMOTE/
   8%           VERY REMOTE

                     NATIONAL DROWNING REPORT 2018   33
CASE STUDY: ECONOMIC BENEFITS OF AUSTRALIA’S PUBLIC AQUATIC FACILITIES

     Many Australians are               Key findings
     physically inactive, putting       • The average aquatic facility creates $2.72 million a year in
     at them of risk of death and         value to the community
     disability and leading to          • The average Australian visits a public aquatic facility 4.4
     burdens on Australia’s health        times a year
     care system. Aquatic facilities
                                        • Every year in Australia physical inactivity costs the health system
     provide Australians with
                                          $3.7 billion and leads to death and disability costing $48 billion
     opportunities for safe, low
     impact physical activity, and      • Insufficient physical activity is responsible for 5% of all death
     can generate significant health      and disability in Australia
     benefits for Australian society.   • Nearly 40% of the Australian population is classified
                                          as “physically inactive” according to the World Health
                                          Organization’s physical activity scale
                                        • A weekly visit to a pool is enough to take most people out of
                                          the “physically inactive” category
                                        • Increased risk of disease is heavily concentrated among the
                                          “physically inactive” category
                                        • As a result of these health benefits, every aquatic facility visit
                                          creates economic benefits worth an average of $26.39, in
                                          addition to the leisure value gained by users

      Figure 39: How much exercise
                 do Australians do?

34
Estimating the dollar value of health gains                             Results
Royal Life Saving used the Australian government’s Value of a           Based on the dollar value
Statistical Life Year to estimate the dollar value of the costs of      of these improved health
physical inactivity - $48 billion a year – as well as the health care   outcomes, the report shows
costs and reduced productivity stemming from physical inactivity.       that an extra swimming pool
Overall, we estimate that the additional ill health someone who         visit by a randomly selected
falls in the “physically inactive” bracket can expect costs society     Australian is worth, on
an additional $4,576 each year, compared to $1,185 for people in        average, $26.39, meaning that
the low activity group. This means that additional exercise which       Australia’s aquatic facilities
moves someone from inactive to low activity leads to health             produce $2.8 billion in health
gains worth $3,391 in that year alone.                                  benefits each year, over and
                                                                        above their value as sources
Based on a data-set provided by the Australian Institute of Health      of recreation, community and
and Welfare showing exactly how much Australians currently              aquatic education.
exercise, we simulated the effect of an average pool visit’s
worth of exercise to a randomly selected person. Calculating the
average impact on health burden over millions of simulations,
we found that, on average, a swimming pool visit leads to health        Source: Barnsley, P. Peden, A. Scarr, J.
                                                                        (2017) Economic Benefits of Public
benefits worth $26.39. The graph below shows how those gains            Aquatic Facilities, Royal Life Saving
break down in the case of a single person moving from inactive          Society – Australia, Sydney.
to low activity.

                                                                          Figure 40: Breakdown of financial
                                                                                     gains from becoming active

                                                                              NATIONAL DROWNING REPORT 2018        35
FATAL DROWNING RISK FACTORS

     Risk factors that can increase a           PRE-EXISTING MEDICAL CONDITIONS
     person’s chance of drowning include
                                                Of the 249 people who drowned, 48 were known
     age, sex and socio-economic status,
                                                to have a pre-existing medical condition. This
     as well as the presence of pre-
                                                represents 19% of all drowning deaths in this
     existing medical conditions and prior
                                                year’s National Drowning Report. Of these, 83%
     consumption of drugs and/or alcohol.
                                                were male and more than 48% were aged 65
                                                years and over.
     The following are case studies
     investigating the frequency of several
                                                The most common medical conditions were
     risk factors in the drowning deaths that
                                                cardiac conditions, such as ischaemic heart
     occurred in 2017/18.
                                                disease and coronary artery atherosclerosis.
                                                Cardiac conditions were recorded in 44% of
                                                cases where a pre-existing condition was
                                                known to be present. Other commonly occurring
                                                medical conditions were mental and behavioural
                                                disorders (17%) and epilepsy (13%).

                                                A pre-existing medical condition was deemed
                                                to have been contributory to the chain of events
                                                that led to the drowning in 70% of cases where a
                                                medical condition was known to be present.

                                                Royal Life Saving recommends that people aged
                                                65 years and over undergo regular medical
                                                check-ups, as well as anyone participating in
                                                activities such as scuba diving. Children or adults
                                                with a history of epilepsy should always be
                                                supervised when in, on or around the water.

                                                           48
                                                  PEOPLE WHO DROWNED
                                                  HAD PRE-EXISTING
                                                  MEDICAL CONDITIONS

36
VISITOR STATUS                                      DRUGS & ALCOHOL
In 74 cases (30%) the person who drowned            There were 31 people who drowned who were
was known to be a visitor to the location where     known to have recorded positive readings
they drowned. Of these, 40 people drowned           for alcohol in their bloodstream at the time
within their own State or Territory in a postcode   of drowning. 81% recorded a blood alcohol
that was 100km or further from their residential    concentration that was equal to or greater than the
postcode. A further 17 people were visiting a       legal limit for operating boats and motor vehicles
different State or Territory when they drowned.     in most States and Territories (0.05%). Of those,
                                                    32% recorded a blood alcohol concentration that
This year, 17 people who drowned were overseas      was 1.5 times the legal limit (0.150%) or higher.
tourists, predominately from North America (35%)
and Europe (24%). Overseas tourists commonly        There were 28 people who drowned that were
drowned at beaches (35%) and ocean harbour          known to have some kind of drug in their system
locations (35%). The most common activities         when they drowned. In almost two-fifths (39%)
being undertaken immediately prior to drowning      of cases, the drug(s) consumed was known to
were non-aquatic transport incidents (47%) and      be illegal or an abuse of legal drugs. Commonly
swimming and recreating (29%).                      occurring illegal drugs were cannabis (36%) and
                                                    methamphetamine (18%).
Regardless of how far you live from the aquatic
environment you visit, particularly with inland     The consumption of illegal drugs and/or alcohol
waterways, conditions can change rapidly            prior to undertaking aquatic activity is known to
and without warning. Where possible you             increase the risk of drowning as they can impair
should check with a local resident regarding        judgment, slow reaction times, impair coordination
the conditions prior to entering the water.         and result in a greater risk-taking behaviour.
International tourists to Australia should ensure
they take care when diving in the ocean, to         Some medications can also increase the risk of
always swim at patrolled beaches between the        drowning as they may make people unsteady
flags and to take care when recreating in and       on their feet or slow reaction times. Mixing
around our inland waterways.                        prescription medication with alcohol can also
                                                    increase a person’s risk of drowning. Royal Life
                                                    Saving strongly urges people to refrain from
                                                    consuming alcohol or taking illicit drugs when
                                                    around water, as well as considering the possible
                                                    side effects of prescription medication.

           74                                                   31
  PEOPLE DROWNED WHO                                  PEOPLE DROWNED WHO
  WERE VISITORS TO THE                                RECORDED POSITIVE
  INCIDENT LOCATION                                   READINGS FOR ALCOHOL

                                                                                                          37
You can also read