NATIONAL CEO SURVEY 2016 - Business Responses to the Australian Dollar The Australian Industry Group - Ai Group
←
→
Page content transcription
If your browser does not render page correctly, please read the page content below

Highlight
                                                                        The Australianinfo or date
                                                                                       Industry Group

                              NATIONAL CEO SURVEY 2016
                                Business Responses to the
                                          Australian Dollar
                                                                                               August 2016

THE AUSTRALIAN INDUSTRY GROUP 2016 National CEO Survey – Business responses to the Australian dollar         1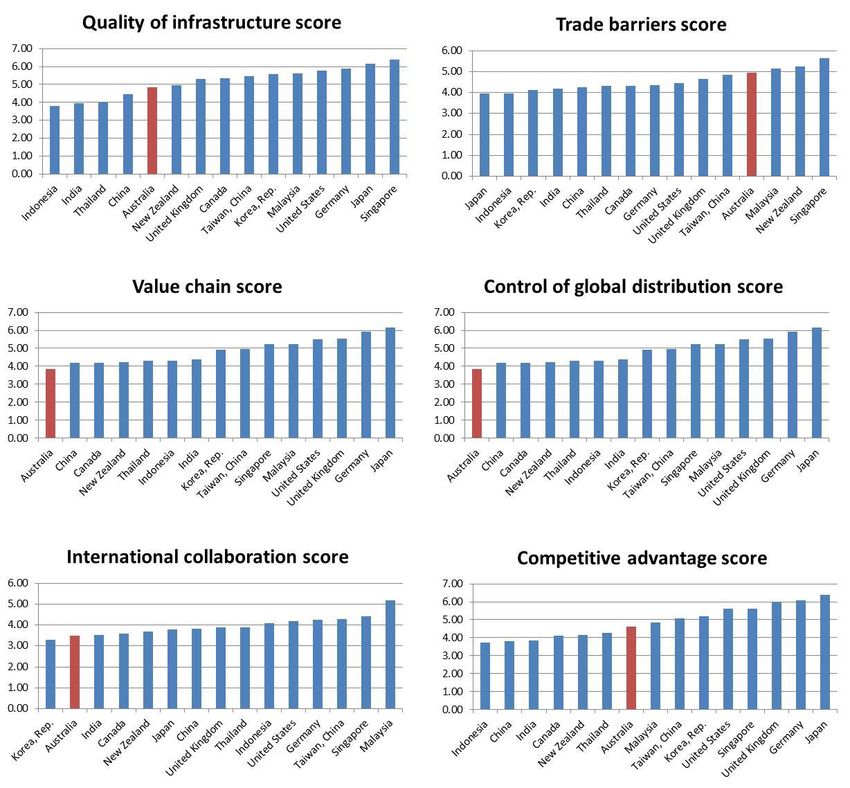
About Ai Group
The Australian Industry Group (Ai Group) is Australia’s peak industry association.
Acting on behalf of business for more than 140 years, we are the country’s only truly
national employers’ organisation.
Ai Group represents the interests of more than 60,000 businesses employing more
than 1 million staff. Our longstanding involvement with diverse industry sectors
including manufacturing, construction, transport, labour hire, mining services,
defence, airlines and ICT means we are genuinely representative of Australian
industry.
With more than 250 staff in offices across NSW, QLD, SA, VIC and WA, we have the
resources and the expertise to meet the changing needs of our members. We provide
the practical information, advice and assistance you need to run your business more
effectively.
Ai Group also offers members a voice at all levels of government through our policy
leadership and influence. Our deep experience of industrial relations and workplace
law positions Ai Group as the leading advocate on behalf of enterprises large and
small across Australia.
We intrinsically appreciate the challenges facing industry and remain at the cutting
edge of policy debate and legislative change – and strategic business management.

Australian Industry Group contact

Peter Burn
Head of Influence and Policy
Australian Industry Group
51 Walker Street
North Sydney, NSW 2060
Australia Tel: 02 9466 5566

 THE AUSTRALIAN INDUSTRY GROUP 2016 National CEO Survey – Business responses to the Australian dollar   2
Contents
Key points .................................................................................................................................................................................................4
1 The Australian dollar: recent trends and drivers ...................................................................................................................................5
2 Responses to changes in the dollar from manufacturers ....................................................................................................................13
4 Australia’s trade: Recent trends ..........................................................................................................................................................21
5 Australia’s Free Trade Agreements .....................................................................................................................................................33
Appendix .................................................................................................................................................................................................37
National CEO Survey – Business Prospects in 2016: survey participants ...............................................................................................37
National CEO Survey – Business Prospects in 2016: questionnaire........................................................................................................38

  THE AUSTRALIAN INDUSTRY GROUP 2016 National CEO Survey – Business responses to the Australian dollar                                                                                                     3
Key points
The lower Australian dollar and Australian businesses’ active responses to it have played a significant
role in the improvement of business conditions and optimism in 2015 and 2016 compared to earlier
years.
The Australian dollar experienced an unusually strong period of appreciation between 2006 and 2011
(other than the dramatic fall and rise associated with the global financial crisis), trading above parity
against the US dollar and well above its post-float average of around 77 US cents for much of that period.
While the high dollar meant cheaper imports and more affordable international travel for Australian
businesses and consumers, it also had strong, negative impacts on non-resource exports and import
competition across a wide range of industries.
The lower Australian dollar since April 2013 has partly reversed these impacts and is assisting a recovery
in exporting goods and services and in businesses’ ability to compete against imported goods and
services in the domestic market. ABS data confirm that significantly more businesses were exporting
non-resource goods and services in 2014-15 in response to the lower dollar and Ai Group’s CEO Surveys
and the Ai Group monthly Australian PMI® indicate that this favourable response continued in 2015 and
into 2016, as more businesses sought new markets abroad.
As a result, the lower dollar is helping the Australian economy transition away from the heavy emphasis
on mining and energy-related investment towards a pattern of growth that is spread more evenly across
sectors, geographies and markets.
At the same time, the lower dollar is increasing prices for imported consumer goods and business inputs.
For many businesses margins are tightening because they are unable to pass on these cost increases in
the face of intense competition, a generally weak consumer inflation environment and low real wage
growth.
Strong opportunities now exist for Australian businesses in export markets and Australia is well placed
to engage with the growing middle-class consumers in Asia. This is assisted by improving access to key
markets through a number of Free Trade Agreements (FTAs).
Of course, opportunity itself is not enough to ensure the success of Australian businesses and many are
taking active steps to advance their prospects including by looking for export opportunities, engaging in
international markets and integrating more closely into global supply chains.
These roads are not easily travelled, particularly given the volatility and uncertainty surrounding global
trade and growth. In an increasingly complex and risky global marketplace, Australian businesses need
to focus on efficiency, reliability, innovation, collaboration and continuous improvement. They must
look to adapt their offerings; integrate into global supply chains; enhance collaboration with customers,
suppliers and global firms; and make better use of our FTAs and emerging opportunities in existing and
new markets.
Australia’s success in further rebalancing the economy, and in building more diverse and resilient
sources of economic strength, rests on the success of these efforts.
THE AUSTRALIAN INDUSTRY GROUP 2016 National CEO Survey – Business responses to the Australian dollar 4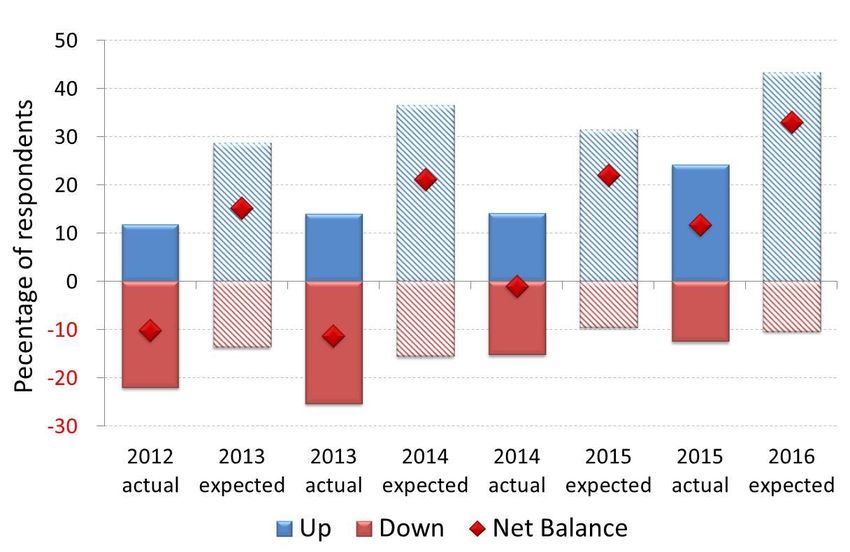
1 The Australian dollar: recent trends and
drivers
Recent Australian dollar trends
After a unique period of high exchange rates, peaking in the 2011-13 period, the Australian dollar has
fallen considerably.
The Australian dollar is a widely traded currency and the primary drivers of exchange rates continue to be
commodity prices and the difference between Australian and US interest rates. Commodity prices have
fallen significantly since 2011 and Australian interest rates have been converging toward US rates
(although they are still significantly higher). These have been the main forces driving the Australian dollar
lower in recent years.
Since the dollar was floated in 1983 it has generally remained below parity with the US dollar. The average
value of the Australian dollar against the US dollar since this time has been 77 US cents. However, recent
years have seen the Australian dollar trading significantly higher. The mining/commodities price boom,
largely driven by a tidal wave of investment and construction in China, resulted in a profound
strengthening of the Australian dollar culminating in a period (between February 2011 and April 2013)
where its average was comfortably above parity with the US dollar.1
This unique period in Australia’s history had both positive and negative impacts on the Australian
economy: it made it harder for businesses to export, but it also gave Australian consumers significantly
more international purchasing power. A number of sectors of Australian industry suffered a debilitating
bout of ‘Dutch disease’ during this period, with the mining sector powering ahead but many other non-
mining, trade-exposed industries languishing. All the while, Australian residents enjoyed unparalleled
access to cheaper global goods and services and record numbers enjoyed international holiday travel.
The commodity price boom has since ended and the Australian dollar has fallen a long way from the highs
of US$1.10 in 2011. Over this period the Australian economy has readjusted and the benefits of the falling
dollar have been significant for large segments of the economy. Sectors such as tourism, education and
manufacturing have benefitted and the exposure of agricultural, mining and energy businesses to steep
commodity price falls has been somewhat cushioned by the lower dollar.
Over the past year (to May 2016), the monthly average of the Australian dollar against the US dollar was
73 US cents, trading in a range between 70 and 77 US cents. Moving forward, the risk for the Australian
economy is if the dollar again resumes an upward trend. The transition of growth toward the non-mining
parts of the Australian economy could be derailed as a result. More recently, the United Kingdom voted
to leave the European Union (otherwise known as ‘Brexit’); this development will add significant
uncertainty as to the future trajectory of the Australian dollar.

1
    Between February 2011 and April 2013 the value of the Australian dollar averaged US$1.04.

THE AUSTRALIAN INDUSTRY GROUP 2016 National CEO Survey – Business responses to the Australian dollar       5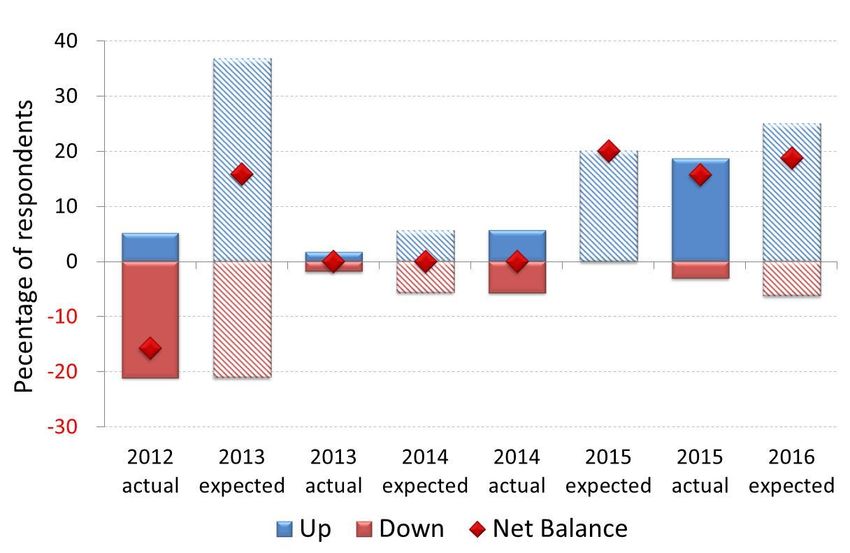
Chart 1: Australian dollar to US dollar, TWI

                            Source: RBA

Australian dollar drivers
The Australian dollar is the fifth most traded currency in the world (as a US dollar currency pair) 2. The
dollar is traded globally to facilitate trade in Australian goods and services and also to facilitate global
market movements in Australian equities, bonds and other market instruments.
The Australian dollar is also relatively popular as an investment vehicle among foreign exchange traders
in its own right because it is readily available, lightly regulated and has a reputation for infrequent central
bank intervention (that is, the RBA does not often intervene directly and overtly in foreign exchange
markets) relative to other global currencies and especially relative to other common currencies in the
Asia-Pacific region.
These various influences mean that the Australian dollar is often somewhat volatile in the short term.
More fundamentally and over the longer term however, the level of the Australian dollar generally moves
according to two key drivers:
1. Non-rural commodity prices. Australia is designated in global financial markets as a ‘mining’ economy
   (along with the likes of Canada, Russia, Chile and Brazil).
2. The difference between Australian and US interest rates and most visibly the difference between the
   RBA cash rate and the US Fed funding rate (known in financial markets as the ‘cash rate differential’).

2
    RBA, Survey of Foreign Exchange and Derivatives Markets, September 2013

THE AUSTRALIAN INDUSTRY GROUP 2016 National CEO Survey – Business responses to the Australian dollar         6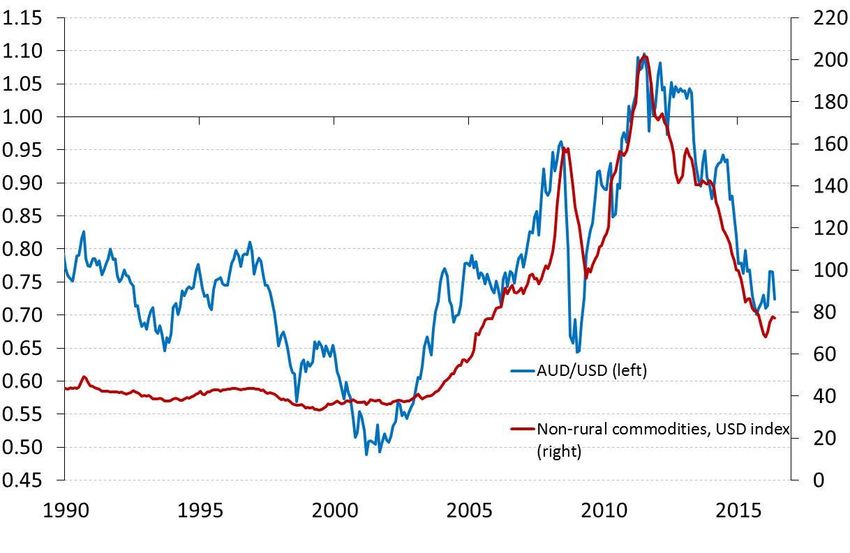
Chart 2: AUD/USD and non-rural commodity price index

                            Source: RBA

To highlight this dependency on commodities, and observing the recent cycle in commodities (see Chart
2), the dollar has fallen in tandem with the fall in commodity prices off their peak in 2011. During this
cycle, a collapse in global commodity demand, followed by an increase in commodity supply, sent
commodity prices plunging. The downward trend in commodity demand was heavily influenced by China,
with slower investment in infrastructure and construction. Recently China has attempted to transition
toward consumption as a driver of economic growth instead of construction and investment. A more
certain outcome however is the end of the commodity ‘super cycle’, with commodity prices falling back
towards their 1990s levels.
Interestingly, commodity prices staged a mild recovery in early 2016 and this lifted the Australian dollar
temporarily. The rise in commodity prices were short lived however, as the changes were likely in
response to stimulatory measures in the Chinese economy.
In addition to the impact on the Australian dollar, global commodity prices also have a major and direct
impact on Australia’s terms of trade – that is, on the nominal prices earned on our exports relative to the
nominal prices paid for our imports. An increase in the terms of trade index implies that Australia is
receiving relatively more for exports and/or paying less for its imports. Crucially, Australia’s exports
account for around one-fifth of Australia’s GDP; therefore, price reductions in export prices (lowering of
terms of trade) will have an adverse impact on growth.
Commodities make up more than half of Australia’s exports and the prices received for commodity
exports have a large bearing on terms of trade. As shown in Chart 3, price movements in commodities are
very closely tied to terms of trade. From the highs of around 2012, the prices of Australia’s main
commodity exports of coal and iron ore have undergone significant declines and this is reflected in the
declining terms of trade.

THE AUSTRALIAN INDUSTRY GROUP 2016 National CEO Survey – Business responses to the Australian dollar     7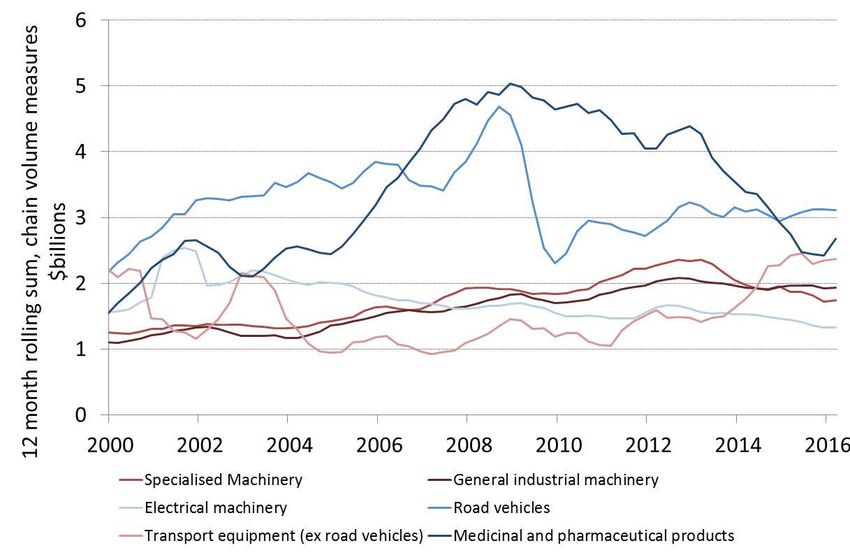
Chart 3: Terms of trade and RBA commodity price index

                               Source: RBA, ABS

Somewhat counterbalancing this trend in commodity prices is the effect of interest rate differentials.
Australia’s interest rates are high compared to other advanced economies. However, this gap has been
slowly narrowing.

 Chart 4: Differential between Australian and US 10-year government bond yields

                               Source: RBA, Bloomberg

THE AUSTRALIAN INDUSTRY GROUP 2016 National CEO Survey – Business responses to the Australian dollar   8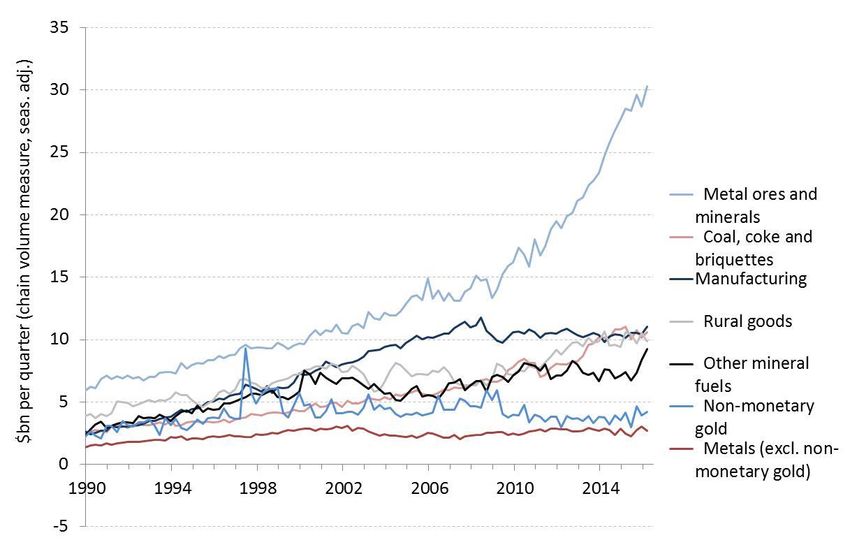
In 2015 the Reserve Bank of Australia (RBA) lowered the cash rate by 25 basis points in both February and
May. In May 2016, the RBA again lowered the cash rate by 25 basis points and, most recently, the RBA
again lowered the cash rate in August to a record low 1.50%. Accordingly, the interest rate gap with other
advanced economies has been narrowing, as seen by the shrinking difference between Australian and US
government bond yields (a proxy for the cash rate). Significantly, the US Federal Reserve lifted rates for
the first time in over a decade in December 2015.

Notwithstanding this narrowing, most other advanced economies (including the US) still have significantly
lower interest rates for the time being. Monetary policy across major global economies has been very
accommodative, with many major central banks employing some sort of monetary stimulus. Globally, this
means that interest rates are quite low. However, should the RBA cut rates further and other major
economies (mainly the US) raise rates in future, this will likely result in a depreciation of the Australian
dollar due to lower interest rate differentials.

In addition to commodity prices and interest rate differentials, the Australian economy has been relatively
resilient compared to other advanced economies in recent years, making Australia a popular destination
for investment and putting some upward pressure on the dollar. Australian Gross Domestic Product (GDP)
growth over the past decade, while slower than trend, has been better than growth in comparable
countries. So while many advanced economies continue to deal with Global Financial Crisis (GFC)
hangovers, high levels of government debt and other structural issues, the Australian economy has been
better positioned than most.

       Chart 5: 10-year (2006-2015) average real GDP growth (% p.a.): Australia
                      compared to other advanced economies

                               Source: OECD

Among other effects, this has meant that Australian Government bonds have become extremely
attractive to international investors. The Federal Budget Papers for 2016-17, for example, indicate that as
of December 2015, 63.5% of the $420bn of Commonwealth Government Securities (CGS) on issue were
held by non-Australian residents, down from its historical peak of over 75% in 2012. 63% is still regarded

THE AUSTRALIAN INDUSTRY GROUP 2016 National CEO Survey – Business responses to the Australian dollar      9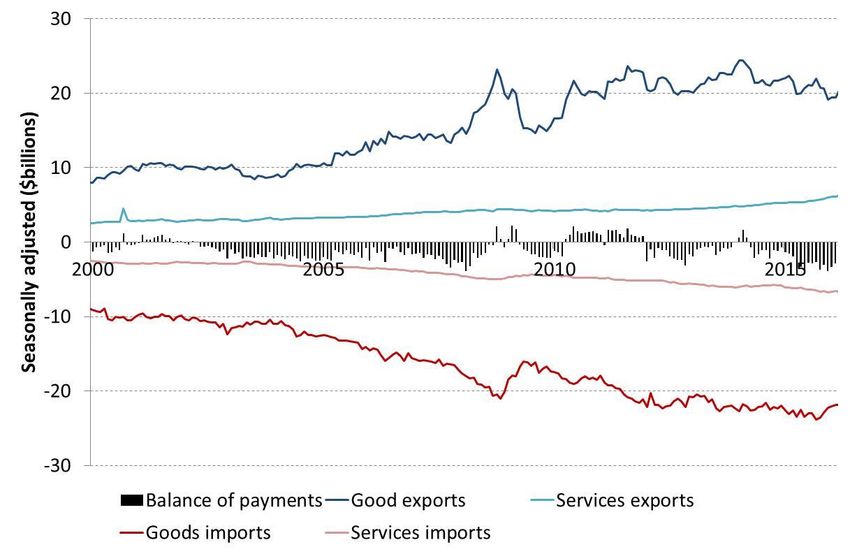
by Treasury as an ‘elevated’ level of international investment in these key Government bonds.
Across major global economies, trends and events that have influenced the trading range of the Australian
dollar in 2015 and 2016 have included:
The US Federal Reserve halted its ‘Quantitative Easing’ program in October 2014 and lifted its cash
rate for the first time in over a decade by 25 basis points in December 2015. The Federal Reserve has
repeatedly signaled delays in raising rates further, in response to the slow recovery in the US domestic
economy and doubts about the outlook for China and other major trading partners. Market volatility
resulting from Brexit may also prompt the Federal Reserve to defer any rate hike in 2016.
The Euro Area’s economic recovery continues slowly. With limited response options available, the
European Central Bank (ECB) put its asset repurchasing program on hold in January 2016, but kept
rates very low, with the benchmark refinancing rate maintaining a record low of 0.5%. An ECB rate
rise seems unlikely in the near term. The Euro Area is only starting to deal with the fallout from Brexit
and this may also mean that monetary conditions will remain very accommodative for longer.
In 2015, the Japanese economy improved after a very long period of stagnation, supported in part by
expansionary monetary measures by the Bank of Japan. In attempts to encourage spending,
investment and inflation, the Bank of Japan aims to increase the monetary base by around 80 trillion
yen per year and has adopted a negative benchmark interest rate of -0.1%. Brexit has initially caused
a sharp appreciation in the Yen, hampering the country’s export competitiveness, and this may
prompt further stimulatory/monetary measures by authorities.
The Peoples Bank of China (PBC) lowered its benchmark interest rates five times (165 basis points)
and cut the reserve requirement ratio for banks four times in 2015, in response to slowing investment
growth. China’s GDP growth slowed to 6.9% in 2015 and is likely to stay within the Government’s
target range of 6.5%-7.0% for 2016-2020. This is in line with the Chinese Government’s shifting policy
focus from physical infrastructure investment (especially in transport and energy) to household
consumption and especially services (health, education and personal services). The economy faces
multiple challenges as it progresses though this massive transition. The PBC program of cutting
benchmark rates and providing other stimulus measures is a key management tool.
In contrast to the major developed economies, a number of smaller emerging market economies have
raised interest rates in 2015 in order to rein in inflation caused by currency depreciations and
commodity price declines.
The Trade Weighted Index
As these events shape the direction of the Australian dollar, it is important to accurately capture the value
in terms of a range of important currency pairs. A key measure of Australia’s exchange rate is the Trade
Weighted Index (TWI). The TWI provides an indicator of the average value of the Australian dollar against
the trade-weighted basket of currencies of Australia’s major trading partners. The TWI covers at least 90%
of Australia’s two-way merchandise trade and takes into account both the amount of trade and the
relative value of the Australian dollar to trading partner currencies.
THE AUSTRALIAN INDUSTRY GROUP 2016 National CEO Survey – Business responses to the Australian dollar 10Chart 6: Weights of major trading partners in TWI
United Kingdom
pound sterling Other
4% 22% Chinese renminbi
28%
New Zealand dollar
4%
Japanese yen
12%
Singapore dollar
5% European euro United States dollar
9% 10%
South Korean won
6%
Source: RBA
The Chinese renminbi has the largest weighting in the TWI (28%), reflecting the growing size of the trade
flows between Australia and China. Also significant is the Japanese yen, the US dollar and the Euro (12%,
10% and 9% respectively). Asian currencies have become more prominent in the TWI in recent years, with
their weighting now exceeding two-thirds of total two-way trade.
The path of the TWI is similar to the Australian dollar / US dollar trend described above, falling dramatically
in recent years after the mining boom peak. The TWI fell 22% from a high of 79.1 points in March 2013,
to 61.7 points in May 2016. Driving the movements in the TWI are downward swings in the Australian
dollar’s value against major currencies, particularly against the US dollar. Compared to mid-2015, the
Australian dollar declined 5.5% against the US dollar by May 2016 and was 34% lower than the recent
peak in July 2011.
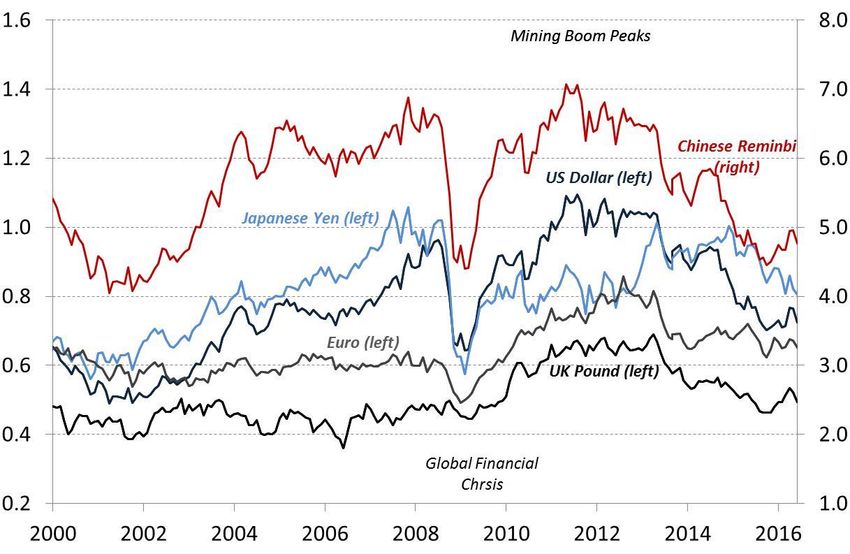
Chart 7: Australian dollar against major trading partners
Source: RBA
THE AUSTRALIAN INDUSTRY GROUP 2016 National CEO Survey – Business responses to the Australian dollar 11Other major currency pair movements, as of May 2016, include:
Chinese renminbi: the Australian dollar is largely unchanged against the renminbi compared to a year
ago and 33% lower against the recent peak in April 2011. Chinese authorities have been known to peg
the Renminbi to the US dollar and this helps to explain why the TWI and AUD-USD cross tend to move
so closely together (with Australia’s largest trading partner currency moving broadly in line with the
USD).
Japanese Yen: the Australian dollar is now 15% lower against the yen compared to a year ago and 21%
lower against the recent peak in April 2013.
Euro: the Australian dollar is now 7% lower against the euro compared to a year ago and 24% lower
against the recent peak in July 2012.
South Korean Won: the Australian dollar is now 2% higher against the won compared to a year ago but
29% lower against the recent peak in February 2012.
UK Pound Sterling: the Australian dollar is now 1% lower against the pound compared to a year ago and
28% lower against the recent peak in March 2013.
THE AUSTRALIAN INDUSTRY GROUP 2016 National CEO Survey – Business responses to the Australian dollar 122 Responses to changes in the dollar from
manufacturers
This section examines how Australian manufacturers have responded to changes in the Australian dollar
in recent years, drawing on evidence from Ai Group’s National CEO Survey (annual) and the Australian
PMI® (monthly). Documented experiences and responses to the lower dollar since 2014 have included:
Increased exports and an increased interest in exploring new export markets;
Increased import replacement within the Australian market;
Changes in the use of imported inputs; and
Changes in business strategy.
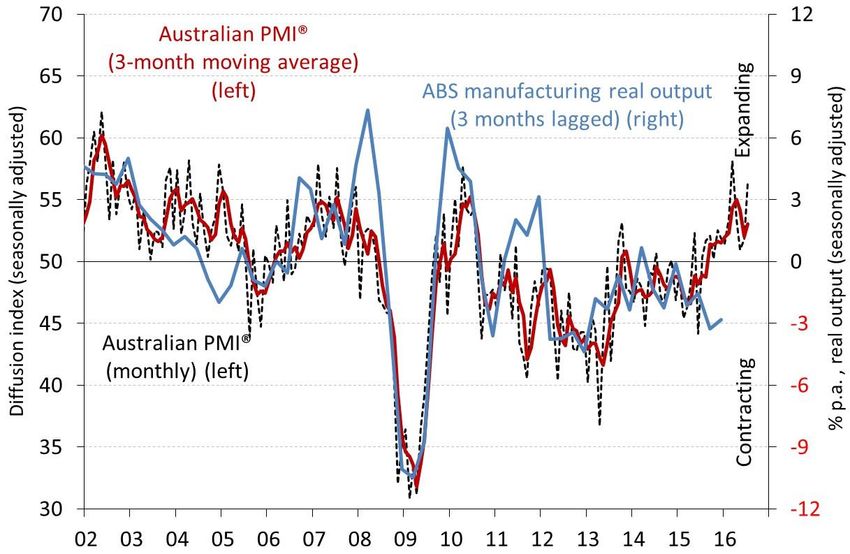
Chart 8: Australian PMI® and ABS measure of manufacturing output
Source: Ai Group and ABS
The Australian PMI® was above 50 points and indicating expansion for twelve months to June 2016
(readings above 50 points indicate expansion, with higher readings indicating a stronger expansion in the
month). This indicated a welcome recovery after many years of contraction. It was the longest run of
expansion since 2006 and included the highest reading (in March 2016) since 2004. The lower dollar was
the single biggest reason for this recovery. Manufacturers noted that their export orders and volumes
have been increasing, especially in the food and beverages manufacturing sub-sector.
The Australian PMI® exports sub-index indicates that exports were firmly expanding over most of 2015
and all months of 2016 so far. This indicates that much of the recent strength in manufacturing can be
attributed to the lower Australian dollar.
THE AUSTRALIAN INDUSTRY GROUP 2016 National CEO Survey – Business responses to the Australian dollar 13Comments from manufacturers participating in the Australian PMI® indicate that both export sales and
‘import replacements’ have recovered, with businesses expanding their export sales but also winning back
local sales contracts from Australian-based customers. These favorable trends have been most visible in
the food and beverages manufacturing sector and in the packaging sector that supplies it. They are also
apparent in building materials (mainly wood products and glass, cement, bricks, coatings and other
materials) and building-related furnishings and fixtures. The latter group of businesses has benefited in
the local market from resurgence in residential construction in 2015 and 2016, at the same time as the
lower dollar.
While there is no hard and fast rule about which level of the Australian dollar best supports manufactured
goods exports, the history of the Australian PMI® since around 2004 suggests a TWI value of around 70
points or under (approximately equal to a dollar value of around 75 US cents or under) is a reasonable
benchmark at which manufactured goods exports can begin to expand (see Chart 9). This relationship is
not automatic however, since so many other variables can affect an industry’s export performance and
its real competitiveness in global markets.
Chart 9: Australian PMI® exports sub-index and TWI
Source: RBA and Ai Group, Australian PMI, data to end of February 2016.
However, while manufacturers have benefitted from the lower Australian dollar, the reversal of the
Australian dollar’s downward trajectory in early 2016 appears have cooled the recovery in manufacturing,
at least temporarily. More recently, manufacturers participating in the Australian PMI® have noted that
the recent appreciation (and volatility) in the dollar is paring back some of the gains made over 2015.
The 2016 National CEO Survey showed that manufacturing businesses had generally expected export
income to increase in 2016 in line with relatively lower Australian dollar expectations. However, the
expected benefits of the lower Australian dollar may not be materialising as many businesses had
expected, with 2015 actual export incomes falling short of expected outcomes.
THE AUSTRALIAN INDUSTRY GROUP 2016 National CEO Survey – Business responses to the Australian dollar 14Chart 10: Changes in export income, actual and expected
Source: Ai Group
For 2015, a net balance of 12% of exporting manufacturers reported increased export revenue, with 24%
reporting an increase and 12% reporting a decrease in export income. This was a smaller proportion of
manufacturing businesses reporting a decline in export income than in 2014 (15%) or 2013 (25%).
Expectations for 2016 were more positive, with 43% of exporting manufacturers expecting their export
income to increase. These expectations were more optimistic than the expectations expressed for 2015
(32%), 2014 (37%) or 2013 (29%).
This recent experience of an unusually high dollar over an unusually long period might also have led
manufacturing businesses to reassess the exchange rate at which they can remain competitive. These
exchange rates are generally lower in 2016 than previously estimated in the same surveys.
Almost all export and import competing manufacturers stated that they can remain competitive at
exchange rates under $0.70 AUD/USD; however, significantly fewer businesses estimated they will be
competitive above this level in 2016, compared to previous years in which the dollar was higher. 83% of
manufacturing exporters and 76% of manufacturers competing with imports said they can be competitive
in 2016 between 71 cents and 80 cents, compared to 94% for both categories in the 2015 survey.
Significantly fewer businesses believe they can be competitive in the 81 cents to 90 cents range in 2016,
with 44% of manufacturing exporters and 35% of manufacturers competing with imports believing they
can remain competitive, compared to 63% and 66% respectively in the 2015 survey. Only 11% of
manufacturing exporters and 16% of manufacturers competing with imports say they can remain
competitive at the 91 cents to $1 range, compared to 29% and 24% respectively in the 2015 survey.
THE AUSTRALIAN INDUSTRY GROUP 2016 National CEO Survey – Business responses to the Australian dollar 15Table 1: Manufacturing businesses that can remain competitive at each
AUD/USD trading range (cumulative % of businesses)
Source: Ai Group
Apart from the exchange rates required for manufacturers to remain competitive, manufacturers
reported on a range of other areas where the exchange rate impacts their business. These areas include
strategies for expanding into overseas markets (or replacing imports), key threats from a high or variable
exchange rate and competition from imports, as well exposure to imported input price increases from a
declining dollar.
Table 2: Manufacturing businesses responses to foreign exchange related
questions (percentage of businesses)
Source: Ai Group
The lower dollar has opened up opportunities for exporters, with 61% of manufacturers noting that
expanding overseas markets was a growth strategy for them. Manufacturers have been increasingly
interested in seeking overseas market opportunities, as noted by the rising trend of manufacturers
naming this as a key growth strategy over previous years.
On the risks of a higher dollar, 60% of manufacturers thought that a high/variable dollar was an inhibitor
to future growth (see Table 2). Yet, with the depreciation of the Australian dollar over the last year,
manufacturers seem slightly less concerned about the risks of a rising dollar than in previous years. 46%
of manufacturers stated that competition from imports (and online sales) was a key risk to growth;
however, this too has declined from recent years. Clearly, risks from a high dollar and from overseas
competition are still prominent, although possibly to a lesser degree than previous years.
THE AUSTRALIAN INDUSTRY GROUP 2016 National CEO Survey – Business responses to the Australian dollar 16The lower dollar is however a two-edged sword, with more competitive selling prices internationally but more expensive prices paid for imported inputs. The annual CEO survey asked businesses to estimate the change in imported input costs over the past year (2015). Significantly, 62% of manufacturers noted an increase in input costs, with a majority of manufacturers (net balance of 52%) observing increased imported input prices. With the decline of the Australian dollar, imported input prices have been heading upwards, and the proportion of manufacturers noting this has more than doubled since the 2015 survey. This highlights the interdependence of many manufacturers with their export markets, but also indicates a significant exposure to risk due to the high rate of imported inputs for manufacturers. As seen in many survey responses to the Australian PMI® recently, manufacturers’ margins are coming under pressure, and this increase in imported input prices helps explain tightening margins. THE AUSTRALIAN INDUSTRY GROUP 2016 National CEO Survey – Business responses to the Australian dollar 17
3 Responses to changes in the dollar from services
businesses
Exports by services businesses have been significantly smaller than goods exports in the past, but service
exports are becoming an increasingly important growth driver. In particular, the lower Australian dollar
has been spurring stronger growth in the number of overseas arrivals for education and tourism since
2015.
Collectively, the services sectors typically account for over two thirds of Australian GDP and three quarters
of employment. Services businesses include:
Businesses that wholesale, retail and distribute goods, including transport, storage, wholesale
trade, retail trade and the repair of consumer goods;
Businesses that provide services directly to consumers including hospitality (cafes, restaurants,
hotels and accommodation), education, healthcare, welfare services, arts, recreation and personal
services (such as hairdressing, mechanics and cleaning);
Business-to-business services (sometimes called ‘enabling’ or ‘transaction’ services) including IT,
media, telecommunications, finance, professional services (e.g. legal, accounting, design,
advertising and engineering services), administrative services, rental and real estate services; and
Public administration and public services including Australia’s three levels of government (federal,
state and local), the defence force, national security and the justice system. These public services
account for around 5% of GDP. They are not included in the scope of this report.
The 2016 National CEO survey showed that services businesses generally expect export income to
increase in 2016 in line with relatively lower Australian dollar expectations. However export income was
generally below expectations for 2014 and 2015, with actual export revenues eventuating at lower levels
than expected.
For 2015, a net balance of 16% of exporting services businesses reported increased export revenue, with
19% reporting an increase and 3% reporting a decrease in export income. This was a smaller proportion
reporting a decline in export income compared to 2014 (6%).
Expectations for 2016 were more positive, with a net balance of 18% of services businesses expecting
their export income to increase. These expectations look more moderate than the expectations expressed
in 2015.
Services businesses noted some impact from the Australian dollar, with more recent remarks indicating
the dampening effect of the rising Australian dollar in early 2016. Compared to manufacturers, the effects
of changes in the dollar seem to flow through more quickly to services businesses.
THE AUSTRALIAN INDUSTRY GROUP 2016 National CEO Survey – Business responses to the Australian dollar 18Chart 11: Changes in export income, actual and expected
Source: Ai Group
The 2016 Ai Group National CEO Survey asked services businesses to nominate key risks and growth
strategies for the year ahead. A significant amount (48%) nominated expanding overseas markets as a
growth strategy, which is significantly higher than recent years. 41% noted that a high/variable dollar was
a key risk (less than the 2015 survey) and 37% nominated competition from foreign firms (and online
sales) as a key risk to them. The data, as for manufacturing, shows a clear response to the lower Australian
dollar, with significantly more services businesses seeking opportunities in foreign markets and less
concerned about a higher dollar. However, an important point of note is that competition from foreign
firms (and online sales) remains a key threat, and this has actually become more prominent than in
previous years.
Table 3: Services businesses responses to foreign exchange related questions
(percentage of businesses)
Source: Ai Group
THE AUSTRALIAN INDUSTRY GROUP 2016 National CEO Survey – Business responses to the Australian dollar 19On input costs, a significantly higher proportion of services businesses (47%) noted an increase in imported input costs than in previous years (see Table 3), with a net balance of 38% seeing an increase in imported input costs for 2015. This highlights that services businesses are positioned to benefit from, but also exposed to higher input costs with, the lower dollar. Recent responses in the Australian PSI® include observations of increased margin pressures, including from increased input prices (significantly dependent on imported inputs), but limited ability for businesses to pass on these increased costs in their selling prices, due to increased competition (including from foreign businesses). THE AUSTRALIAN INDUSTRY GROUP 2016 National CEO Survey – Business responses to the Australian dollar 20
4 Australia’s trade: Recent trends
Goods (including rural products, mining commodities and manufactured goods) represent the majority of
Australian trade, at around 79% of both imports and exports. Mining commodities are the largest group
of exported goods, with iron ore and coal the single largest goods. Services represent around 21% of trade
but are growing rapidly. Historically, Australia has generally run a trade deficit (that is, more imports than
exports). In 2015 for example, Australia’s trade deficit was $35.3 billion, with total exports at $317.2 billion
and imports at $352.5 billion for 2015, up from a trade deficit of $26.4 billion in 2014.

                                  Chart 12: Australian Monthly Trade Balance

                               Source: ABS

While exports of resources (including iron ore, coal and LNG) appear to be flattening off, services, rural
and some manufacturing exports have increased in recent years. Notwithstanding this, resources exports
are still historically high, with the mining industry now moving from the investment phase to the
production phase.

THE AUSTRALIAN INDUSTRY GROUP 2016 National CEO Survey – Business responses to the Australian dollar         21
Chart 13: Australian goods exports (Quarterly)
Source: ABS
Export growth in recent years has been dominated by resources (particularly iron ore, and increasingly
LNG). Recent trade data show that over the year to March 2016 (chain volume measures), mining and
metals exports increased, LNG exports increased dramatically with the completion of several LNG export
terminals, and manufacturing increased:
Metal ores and minerals exports (dominated by iron ore) were up 6.4%;
Coal exports were down 3.7%;
Other minerals & fuels exports (including LNG) were up 24.6;
Manufacturing exports were up 8.6%;
Rural goods exports were down 6.9%;
Non-monetary gold exports were up 1.4%; and
Metals exports were up 9.9%.
As significant capacity in the resources sector comes online (particularly LNG), resources exports have
been increasingly significantly, despite lower commodity prices globally. Coal exports remain the
exception to this however; with international efforts to move away from fossil fuel energy and depressed
prices, exports have decreased recently. Manufacturing and metals exports have also been recovering
after several tough years.
Many of these export sectors have clearly benefitted from the lower Australian dollar, especially for
exporters that are less exposed to increasing input prices resulting from the lower Australian dollar.
THE AUSTRALIAN INDUSTRY GROUP 2016 National CEO Survey – Business responses to the Australian dollar 22Manufacturing exports are recovering with the assistance of the Australian dollar; however, the
composition of Australian exports (and the countries buying them) has changed markedly over recent
years. Manufacturing exports have been dominated by petroleum and petroleum-related products in the
past decade; however, non-rural products (including food and beverages) are now looking to overtake
this sector as the main manufacturing export area. Indeed, food and beverages exports have been
performing very strongly in the Australian PMI® recently, benefitting strongly from the lower Australian
dollar, as well as growing middle-class markets in Asia.
This composition is expected to change in future years, with the imminent departure of the automotive
industry and changing markets of Australia’s major trading partners.
Chart 14: Major Australian manufacturing exports (12-month rolling sum)
Source: ABS
Although machinery manufacturing exports look to be modestly declining, a closer look at the subsectors
reveals specialised and electrical machinery exports have been waning while transport equipment
(excluding automotive) has been the main growth driver for machinery exports. Automotive exports have
been relatively steady in recent years but this is expected to change as Australian car making ceases in
the coming years. This presents a significant headwind for manufacturing exports and the manufacturing
sector generally in the coming years.
Also of note, medicinal and pharmaceutical products exports have been increasing significantly after
several years of decline, increasing 53% compared to the March 2015 quarter. Products such as
pharmaceuticals are benefiting not only from the lower dollar but significantly increased demand from
Asian consumers (particularly China).
THE AUSTRALIAN INDUSTRY GROUP 2016 National CEO Survey – Business responses to the Australian dollar 23Chart 15: Machinery & pharmaceuticals exports (12-month rolling sum)
Source: ABS
Services exports have been increasing strongly, with trade data for the March 2016 quarter (in chain
volume measures) showing that over the year:
Travel exports (mainly tourism) were up 16.5%;
Transport exports (including passenger and freight) were up 4.1%; and
Other services exports were up 13%.
The lower Australian dollar is having a stronger impact through services exports, particularly in areas such
as tourism and education, where overseas tourists and students (especially from Asia) are finding
Australia an increasingly attractive location for holidays and study.
Chart 16: Australian services exports (Quarterly)
Source: ABS
THE AUSTRALIAN INDUSTRY GROUP 2016 National CEO Survey – Business responses to the Australian dollar 24Recent data from the ABS on the characteristics of Australian exporters show that the number of
Australian exporters has been increasing in recent years. For 2014-15, 4,160 additional firms began
exporting, a 9% increase from 2013-14. The uptick in exporting firms was across both goods (+9% p.a.)
and services (+8% p.a.) exporting firms. Interestingly, the recent surge in the number of exporting firms
was driven by smaller firms (exporting less than $1 million p.a.).
Chart 17 Goods exporters Chart 18: services exporters
Source: ABS
In terms of value (nominal), large goods exporters with exports of $100 million p.a. or more saw export
values decline during 2014-15 (-9% p.a.), yet the decline was mainly confined to large mining companies
and was largely attributable to falling commodity prices. All other exports from businesses exporting less
than $100 million p.a. increased. Conversely, the gain in value in services exports for 2014-15 (+10% p.a.)
was mainly due to large services exporters with exports over $100 million p.a. (increasing 20% p.a.).
Exports from smaller exporters (less than $1 million p.a.) fell by 13% p.a.
These results suggest that many more firms are expanding their business into export markets and of these,
particularly smaller businesses are seizing the opportunities that arise with a more competitive currency.
Smaller goods exporters are expanding in number and value of exports, while larger services exporters
are increasing both in number and value of exports.
By industry, the number of goods manufacturers increased across the main industry groups. For 2014-15,
the largest increases were in manufacturing (273 new exporters, 3% p.a. increase), wholesale trade (262
new exporters, 2.1% p.a. growth) and retail trade (263 new exporters, 6.6% p.a. growth). For service
businesses, the largest increases were in telecommunication and IT services (127 new exporters, 19% p.a.
growth), financial services (79 new exporters, 86% p.a. growth) and transport services (45 new exporters,
47% p.a. growth). The number of goods exporters increased in each of the main industry divisions
presented in this publication.
THE AUSTRALIAN INDUSTRY GROUP 2016 National CEO Survey – Business responses to the Australian dollar 25Encouragingly, the number of manufacturing exporters is recovering after a long period of decline. This
finding is consistent with recent results in the Australian PMI®, showing the manufacturing sector
expanding for all of the last 12 months to June and strong results for the exports sub-index, with the sub-
index expanding in much of the past year. Exporting services businesses are also showing promising signs
of growth, with key sectors such as tourism and education performing strongly with the lower Australian
dollar.
Chart 19 Manufacturing exporters & services exporters
Source: ABS
THE AUSTRALIAN INDUSTRY GROUP 2016 National CEO Survey – Business responses to the Australian dollar 265 Australia’s international trade competitiveness
Many factors affect Australian trade performance in addition to the Australian dollar. Free Trade
Agreements and growing middle class markets in Asia are boosting market opportunities for sectors like
food manufacturing, agribusiness and tourism, but there is still significant work to be done in terms of
improving market access, improving efficiency and diversifying Australia’s export mix. Australian
businesses also need to take advantage of Free Trade Agreements and other export opportunities, as well
as enhancing their own efficiency and innovation in order to thrive in the global market place.
The 2015-16 World Economic Forum (WEF) Global Competitiveness report provides a range of trade-
related indicators that help assess the competitiveness of Australian trade processes and conditions. The
results indicate that, despite low trade barriers, Australia ranks relatively poorly on a range of trade
competitiveness measures, relative to its peers.
Australia ranked 21st overall for global competitiveness in 2015-16, up one place from 22nd in 2014-15.
This ranking was based on a score of 5.1 points out of a possible 7 points in 2015-16 (see Chart 20). This
score reflects Australia’s aggregate performance across a number of indicators, based on a mixture of
survey responses and national data. This score has been steady since 2010-11. Since Australia’s GCI score
has been stable at 5.1 points, the change in ranking over this time has been solely due to changes in the
performance of other countries on various measures within the WEF Index, rather than due to a wholesale
improvement in Australia’s own performance.
Chart 20: Australia’s Global Competitiveness Index (GCI) score and ranking
Source: WEF
Several indicators within the 2015-16 Global Competitiveness Index provide more detail about Australia’s
performance with regard to trade. In terms of trade infrastructure (including transport networks such as
roads, rail and ports), of the 140 countries measured, Australia ranks a poor 35 th generally behind its
trading partners and competitors. This is not surprising or even disappointing; Australia has always faced
THE AUSTRALIAN INDUSTRY GROUP 2016 National CEO Survey – Business responses to the Australian dollar 27some unique challenges with its transport infrastructure, particularly road and rail infrastructure, given
its relatively large land mass and distance from its trading partners. Australia’s scores in this measure have
been trending down in recent years.
Charts 21-26: Australia's trade competitiveness measures
Source: WEF
Australia ranks better on non-tariff trade barriers, coming in at 12th place. Compared to its major trading
partners, only Malaysia, New Zealand and Singapore rank ahead of Australia. This is a positive for
importers of goods and services to Australia (foreign firms and Australian businesses using imported
inputs) and is a positive for Australian consumers. This is consistent with the many Free Trade Agreements
that have recently been executed or are in progress.
However, this also means it is relatively easy for foreign firms to compete with Australian producers.
Indeed, respondents to the Australian PMI® have noted intensifying competition from international
players in recent surveys. Australia’s scores and rankings have improved in this measure in 2015-16 after
deteriorating in recent years.
With regard to being able to achieve competitive advantage through product differentiation and process
improvements (as opposed to low-cost labor and resources), Australia ranks at 26th place and is around
THE AUSTRALIAN INDUSTRY GROUP 2016 National CEO Survey – Business responses to the Australian dollar 28the middle of the pack compared to its major trading partners. As an advanced economy, with high labor
costs, Australia needs to rely on the high quality of exports, more efficient production processes and
unique product differentiation in order to compete in the global market place. Encouragingly, both scores
and international rankings for this measure have been improving in recent years. However, there is room
for improvement here, with Australia trailing advanced countries such as Japan (first place), many
European economies and the US.
With regard to capturing more of the production value chain, Australia is ranked a very poor 61st and is
behind all its major trading partners. This indicates that Australia is taking a lower position in the value
chain and producing more raw inputs (e.g. more iron ore but less steel and finished metal products)
instead of providing higher value inputs to goods and services exports. With the recent ramp up in
resources exports, Australia’s score in this measure has decreased in 2015-16. Related to this lack of clout
in the value chain, Australia ranks 40th for being able to control the international distribution of its exports,
which puts Australia in last place against its trading partners. Scores for this measure have been steady in
recent years, indicating no trend of improvement.
Of even greater concern, Australia ranked 68th for collaboration with international companies, coming in
behind most of its major trading partners. This highlights the need for Australian companies to further
innovate and collaborate internationally in order to improve opportunities and productivity, and to
diversify exports away from raw commodities.
Chart 27: Australia’s Global Competitiveness score on trade measures
Source: WEF
THE AUSTRALIAN INDUSTRY GROUP 2016 National CEO Survey – Business responses to the Australian dollar 29Chart 28: Australia’s Global Competitiveness rank on trade measures
Source: WEF
All of the countries in the WEF top ten in 2015-16 were also in the top ten in 2014-15. Rankings at the top
of the GCI have remained relatively stable in recent years. Highly advanced large economies including the
US, the UK, Germany, Japan and Hong Kong continue to dominate the Top Ten list, as do the more
specialised and ‘boutique’ northern European nations such as Finland, the Netherlands and Sweden.
These nations are not the cheapest locations of production globally. Instead, they share key competitive
characteristics such as:
Very open and competitive trade facilities (including large and efficient ports);
Advanced manufacturing sectors;
Very high education standards; and
Strong and stable financial, legal and political systems.
Switzerland was in the number one position again in 2015-16, for a seventh consecutive year. Switzerland
consistently scores first for ‘innovation and business sophistication’, but not for ‘basic business
requirements’ or for ‘efficiency enhancers’. This underscores the importance of fostering innovation and
sophistication in creating a truly competitive business trading environment. This needs to be supported
by an excellent (but not necessarily world-best) standard of physical and social infrastructure, plus
business regulation.
In a separate report last published in 2014, the WEF ranked Australia 23rd for its ability to enable trade,
down from a peak of 14th place in 2009. While Australia’s ‘Enabling Trade Index (ETI)’ had declined only
marginally over the six years to 2014, many other countries have improved their performance on cross-
border trade facilitation. This resulted in Australia’s global ETI ranking slipping over that period.
THE AUSTRALIAN INDUSTRY GROUP 2016 National CEO Survey – Business responses to the Australian dollar 30In 2014, the WEF found that ‘identifying potential markets and buyers’ and ‘high costs or delays caused
by international transportation’ are the top two problems currently facing Australian exporters. On the
importers’ side, ‘burdensome import procedures’ was the biggest challenge faced by Australian
importers, followed by (domestic) ‘tariffs’, ‘domestic technical requirements and standards’ and ‘high cost
or delays caused by domestic transportation’. Some of these results appeared to reflect Australia’s
relative isolation from key international markets (despite the growing benefits of new technologies), but
others clearly suggested that Australian trade policies, regulations and procedures require attention.
Although these WEF data pre-date the more recent falls in the Australian dollar, most of these factors are
not related to the level of the dollar and seem to be still relevant to trade today.
Chart 29: Problematic factors for Australian exporters and importers in 2013
Source: WEF
These WEF rankings on global competitiveness and trading ability are similar to the findings of a recent
report on global manufacturing competiveness which placed Australia as the 21 st most competitive
manufacturing economy out of 40 large manufacturing nations in 2016 (Deloitte 2016). Deloitte expects
this ranking to fall to 22nd by 2020. Australia’s relatively low ranking in this index is related to its market
size (much smaller than its peers) and distance, but is also a consequence of its lack of deep engagement
in global manufacturing supply chains.
THE AUSTRALIAN INDUSTRY GROUP 2016 National CEO Survey – Business responses to the Australian dollar 31Deloitte places China as the most competitive manufacturing nation currently but expects China to give
up first position to the US by the end of the decade, with advanced manufacturing being the key to
maintaining future competitiveness. This shift should benefit advanced economies such as Australia, but
Deloitte predicts Australia’s competitiveness will actually slip. The report cites top drivers of
manufacturing competitiveness as sourcing top (innovative) talent, effecting cost competitiveness and
productivity, and developing supplier networks. The implications for Australian manufacturing are:
A need to develop a highly skilled manufacturing workforce, including investing in workplace skills and
the need for targeted education investment in STEM areas;
Improving productivity and cost competitiveness through efficiencies and innovative technologies; and
A need to effect increased integration into the global supply chain (including more mature supplier
networks).
THE AUSTRALIAN INDUSTRY GROUP 2016 National CEO Survey – Business responses to the Australian dollar 325 Australia’s Free Trade Agreements
Australia has seen an increasing number of Free Trade Agreements (FTAs) either being formalised or
proposed over the past decade. This contrasts with previous trade policy trends, in which multilateral
rather than bilateral arrangements were the focus (e.g. through World Trade Organization negotiation
rounds or in the General Agreement on Trade and Tariffs, or GATT, that preceded the WTO). Australia has
been part of many of these recent FTAs.
An FTA is an international treaty that regulates trade barriers and facilitates stronger commercial ties
between the countries involved in the Agreement. Such agreements generally seek to open up
opportunities for Australian exporters, improving market access to foreign markets and boosting
competitiveness of Australian businesses.
As of 2016, Australia has ten FTAs, potentially covering around two-thirds of Australia’s trade flows. These
countries include the Association of South East Asian Nations (ASEAN) member nations, Chile, China,
Japan, Korea, Malaysia, New Zealand, Singapore, Thailand and the United States.
Chart 30: Australia's major FTA's
Source: Ai Group
THE AUSTRALIAN INDUSTRY GROUP 2016 National CEO Survey – Business responses to the Australian dollar 33Australia’s existing FTAs include the following agreements3:
Australia-United States Free Trade Agreement (AUSFTA)
Came into effect in January 2005.
Provides greater access to the US market for Australian products.
Thailand-Australia Free Trade Agreement (TAFTA)
Came into effect in January 2005.
Immediate elimination of more than half of Thailand’s 5000 tariffs across all sectors (some up to
200%), importantly in agriculture, processed food and beverages, mining and automotive products.
Ensures greater access to the Thai market for Australian products.
Thailand has agreed to relax a number of restrictions including visas and work permits and to
guarantee non-discriminatory treatment of Australian investments in Thailand.
Will lead to the complete elimination of Thailand’s significant tariffs across all sectors (95 per cent
of all current trade between Australia and Thailand completely tariff free by 2010).
Singapore-Australia Free Trade Agreement (SAFTA)
Came into effect in July 2003.
Gives Australia deeper access than the World Trade Organization in relation to trade in services,
intellectual property, investment and competition policy.
Eliminates Singapore's tariffs and provides cheaper inputs for Australian businesses on a range of
products.
Provides a more open and predictable business environment across a range of areas.
Australia New Zealand Closer Economic Agreement (ANZCERTA)
Came into effect in 1983.
The first of Australia’s bilateral agreements.
Recognised by the World Trade Organization as a model Free Trade Agreement, covering
substantially all trade in goods, including agricultural products, and services.
Allows free flow of capital between countries for investment purposes.
Australia-Chile Free Trade Agreement (ACl-FTA)
Came into effect in March 2009.
Covers trade in goods, services and investment.
The most comprehensive FTA Australia has negotiated with another agricultural producing country
since ANZCERTA.
Tariffs on all existing merchandise trade eliminated by 2015.
3
http://dfat.gov.au/trade/agreements/Pages/trade-agreements.aspx
THE AUSTRALIAN INDUSTRY GROUP 2016 National CEO Survey – Business responses to the Australian dollar 34You can also read