Mid Sussex Economic Profile 2018 - OPEN4 BUSINESS - Mid Sussex District Council
←
→
Page content transcription
If your browser does not render page correctly, please read the page content below
Mid Sussex
Economic Profile 2018

                            OPEN4
                            BUSINESS
                        D I G I TA L & Y O U
Place
  Contents Page                                                                                             Future demand of employment space....................................... 40

  Introduction....................................................................................... 3     Levels of industrial and office rents .......................................... 41

  PLACE                                                                                                     Provision for start up / small businesses .................................. 42

  Key findings ...................................................................................... 6     Hotels and conference centres ................................................ 44

  Town centre and retail spaces........................................................... 8                PEOPLE

  Retail data...........................................................................................8   Key findings .............................................................................. 46

  Business parks................................................................................ 20         Mid Sussex population and workforce....................................... 48

  Parking............................................................................................. 21   Travel to work ........................................................................... 49

  Housing............................................................................................ 24    Employment .............................................................................. 50

  Infrastructure................................................................................... 27      Employment by occupation....................................................... 52

  Protecting & enhancing the District’s built and natural environment 29                                    Average earnings .................................................................. ... 50

  PREMISES                                                                                                  Finance and insurance sector.................................................... 57

  Key findings...................................................................................... 30     6th form provision....................................................................... 58

  Size of businesses in Mid Sussex................................................... 32                    Apprenticeships......................................................................... 59

  Diverse and specialised sectors...................................................... 34                  PROMOTION

  Biggest commercial employers in Mid Sussex .............................. 36                              Key findings .............................................................................. 61

  Current employment space in Mid Sussex ...................................... 37                          Tourism ...................................................................................... 64

                                                                                                            Strengths and Drivers infographic ............................................. 66

Mid Sussex Economic Profile                                                                                                                                                                              Page 2
Introduction

                       About Mid Sussex
                       Mid Sussex is an affluent district in West Sussex in the
                       South East of England with a total population of 147,000.
                       It is an ideal location to deliver economic success, given
                       its position between London and the coast and proximity
                       to Gatwick Airport. There are excellent transport links
                       by road and rail, good access to the South Coast ferry
                       ports and to Gatwick International Airport. The District
                       is within the Gatwick Diamond, an economic partnership
                       consisting of the local authorities surrounding Gatwick
                       and the Greater Brighton Economic Board, a partnership
                       of local authorities and businesses in Brighton and
                       the surrounding area. Mid Sussex is also part of the
                       Coast to Capital Local Economic Partnership, which
                       is committed to growing the economy of the area and
                       creating jobs. There are high levels of employment and
                       the educational standard of the local population is well
                       above average.

                       Mid Sussex contains about 605,000 m2 of commercial
                       office, industrial and warehouse space. This is split
                       relatively evenly between manufacturing, warehousing
                       and commercial office space.

                       Commercial property centres around the three towns of
                       Haywards Heath, Burgess Hill and East Grinstead but
                       there are also business parks in some of the rural parts
                       of the District.

Mid Sussex Economic Profile                                                                        Page 3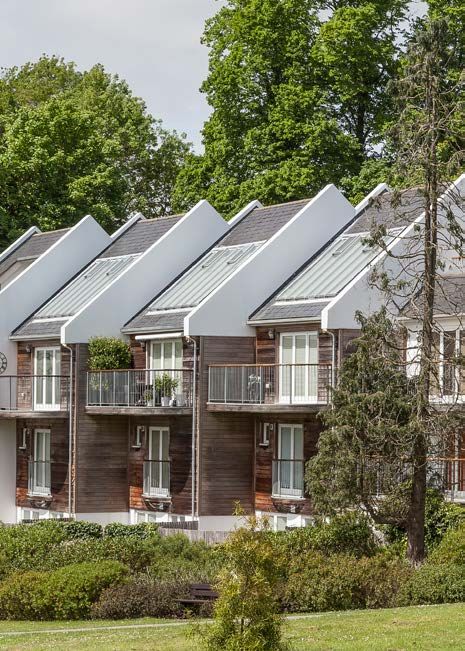
Page 4
Introduction
                                                                                   3
  The District has three main towns – Burgess Hill, East Grinstead and
  Haywards Heath, and a number of villages meeting local communities
  needs. It is a popular place to live with a high standard of living. The
  District’s outstanding natural environment and rich heritage make it highly
  valued by its residents and a popular tourist destination. Mid Sussex is
  consistently listed in the 20 best places to live in the country. The District
  also benefits from low crime levels and a strong sense of community.

  The Mid Sussex economy is diverse and is home to a number of
  innovative and nationally known businesses with a third of businesses
  in the professional, scientific and technical, and information and
  communication sectors. There is a range of smaller businesses across
  sectors such as finance, service industries and light manufacturing. The
  Mid Sussex area has approximately 7,300 businesses. Over 85 per cent
  of these employ fewer than 10 people with the majority employing fewer
  than five employees. The District continues to see a high number of
  business start-ups each year and it is a resilient economy, with survival
  rates better than the South East average.

  Aim of this Profile

  The aim of this profile is to build a picture of the economic landscape
  of Mid Sussex to help identify the issues for inclusion in the Council’s
  Economic Development Strategy. The information it contains is gathered
  from a variety of sources and includes both quantitative data and
  feedback from our contacts with the Mid Sussex business community.
  The Profile will be regularly updated to assess progress with the
  implementation of the Economic Development Strategy.
  The document is structured in line with the priority themes identified in
  the strategy - place, premises, people and promotion.

Mid Sussex Economic Profile                                                                           Page 5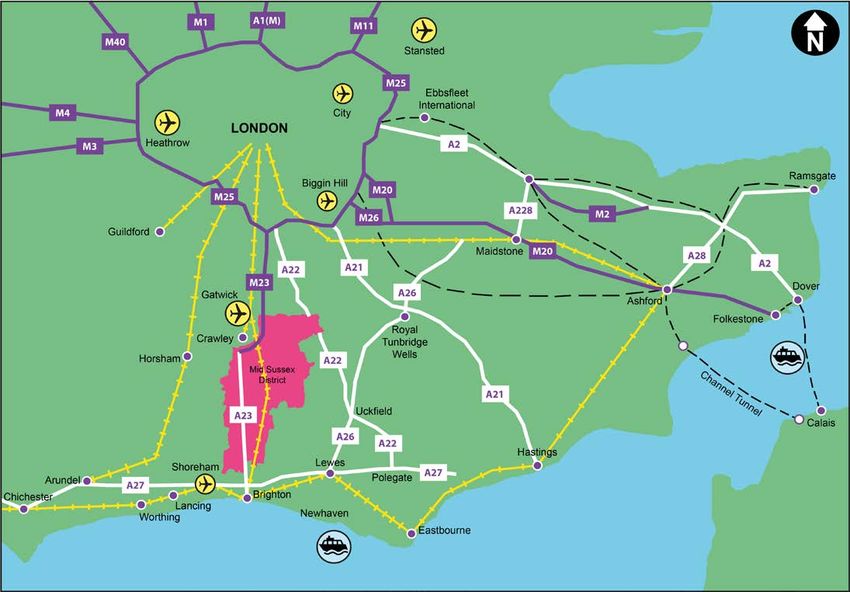
Place

       Place
       Having assessed the data around our places the following key issues have emerged:

       Key findings:

       •    The main shopping centres in the three towns of Burgess Hill, Haywards Heath and East Grinstead are
            performing reasonably well as shopping destinations, but are not meeting their full potential.
            There is also strong competition for comparison goods from Crawley and Brighton.
       •    There is evidence of consumer demand not being met by shops in the District and shoppers resorting to
            alternative channels such as online shopping.
       •    Burgess Hill has additional capacity for convenience floorspace, Haywards Heath for comparison floorspace
            and East Grinstead for both.
       •    There are twenty one business parks spread across the District - the largest is the Victoria Business
            Park in Burgess Hill. There has not been sufficient growth in industrial floorspace to meet demand.
       •    There are twenty town centre Council car parks operated by pay and display with 1.68 million transactions in
            2016/17 however 83 per cent of transactions are for less than two hours.
       •    A lack of car, van and lorry parking for businesses in the District, particularly in the town centres and at the
            Victoria Business Park in Burgess Hill, is seen as an issue by the business community.
       •    There are relatively high house prices and affordability issues with a ratio of median house prices to median
            earnings in 2015 of 12.
       •    Superfast broadband availability in Mid Sussex is at the average level of 86 per cent. However, there are
            slow broadband speeds and mobile “not spots” in some rural locations.
       •    There is a lack of conference and hotel accommodation, particularly in the towns which is an issue for the
            business community.

Mid Sussex Economic Profile                                                                                                    Page 6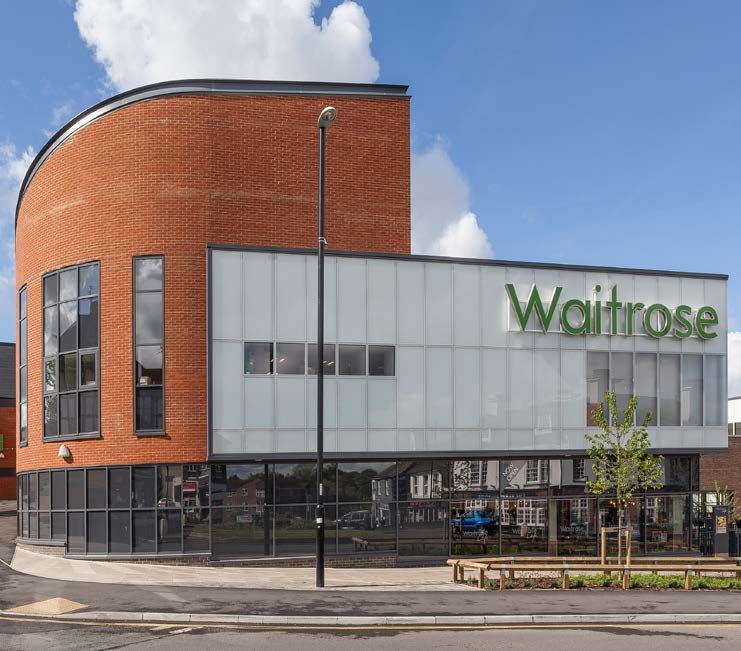
“Business in
the town centre
remains strong.
But competition
from on-line retail
and from nearby
destinations
like Brighton
and Crawley is a
challenge. Making
the District’s town
centres more
accessible and
attractive would
really help.”

                      Grape and Grain
                      Haywards Heath    Page 7
Place

                         Town centres and retail spaces

                         The main shopping centres in Mid Sussex are in the three towns of Burgess
                         Hill, Haywards Heath and East Grinstead. The Mid Sussex District Council
                         (MSDC) Retail Study (Carter Jonas, May 2016) found that while the three towns
                         are performing reasonably well as shopping destinations, they are not meeting
                         their full potential, with a need to improve their attractiveness to minimise the
                         competition from other towns outside the District. There is also competition from
                         out-of-town shopping facilities and the growth in online shopping. Information
                         from an Experian Study in 2017 placed Haywards Heath in eighth place in their
                         top 50 retail centres for multi-channel shopping. This points to a high level of
                         consumer demand not being met by traditional local shops and shoppers resorting
                         to alternative channels such as shopping online.

                         The MSDC Retail Study identified that the three main town centres face
                         competition from Brighton and Crawley for non-food purchases, especially for
                         fashion shopping. The Study identified the potential for expansion of the food and
                         convenience goods offers in the three main town centres. For Burgess Hill, an
                         under-provision of clothing and fashion shops has been identified. Prime Zone
                         A rents achieved are generally lower than East Grinstead and Haywards Heath.
                         Haywards Heath was seen as performing well as a non-food shopping location
                         in Mid Sussex. Hassocks and Hurstpierpoint are the District’s two largest village
                         centres. Both were found to be performing relatively well.

                         Plans for major new investments in retail schemes are in place, with a £35m
                         Haywards Heath station site redevelopment including a new Waitrose store
                         now complete and the £65m redevelopment of the Martlets Shopping Centre in
                         Burgess Hill, which will provide an extra 21,336 square metres of retail space.
                         Improvements planned in East Grinstead include the redevelopment of the
                         Queens Walk area.

Mid Sussex Economic Profile                                                                                           Page 8
Place

  Mid Sussex retail centres

  This section of the profile provides
  information about the three towns as retail
  centres. Classifications of retail units
  refer to comparison and convenience
  shops. The latter refers to outlets which
  sell consumer goods purchased on a
  regular basis, including food, groceries and
  cleaning materials. Comparison goods
  include durable goods such as clothing,
  household goods, furniture, DIY and
  electrical goods. Information comes from
  the Local Data Company reports 2017.

  The council is working with West Sussex
  County Council to establish footfall data
  for the three town centres and this will be
  available for the next Profile.

Mid Sussex Economic Profile                              Page 9
Place

                              The MSDC Retail Study assessed the vitality and viability of the town and village
                              centres in Mid Sussex and looked at the quantitive need for new retail space
                              over the District Plan period (up to 2031) having taken into account population
                              projections; housing allocations; retail expenditure data and analysis of shopping
                              patterns based on a telephone survey.

                              Hassocks, Hurstpierpoint and our smaller villages have additional retail capacity for
                              both convenience and comparison good floorspace, although the scale is smaller,
                              reflecting the size and catchment of these centres.

                              Burgess Hill

                              Although the new Lidl store will meet need of the demand initially, by 2024, there
                              is additional retail capacity for convenience floorspace and by 2029 this capacity
                              exceeds 1,500m2. The redevelopment of the Martlets addresses the identified
                              comparison capacity in Burgess Hill until 2031.

                              East Grinstead

                              The limited supply of new retail floorspace means that there is significant capacity in
                              both convenience floorspace (nearly 3,500m2 by 2031) and comparison floorspace
                              (over 4,000m2 by 2031).

                              Haywards Heath

                              The new Waitrose has absorbed the future forecast convenience retail capacity
                              by unit 2031 however there is significant capacity for comparison floorspace (over
                              3,500m2 by 2031).

                              The Council maintains a record of Health Check data of our town centres, including
                              land uses and vacancy rates, and the health of our centres is set out below.

Mid Sussex Economic Profile                                                                                    Page 10
Place
Burgess Hill
Overall Burgess Hill has 178 retail, service and leisure units, 46 of which are in the Martlets main shopping centre. The
Martlets Centre has planning permission for significant levels of redevelopment including the provision of larger floorspace
sites suitable for fashion retail. The proposals also include provision for a multiplex cinema and an increased food and
beverage offer. This improved retail and leisure offer combined with significant improvements to the public realm will
enhance the vitality and viability of Burgess Hill.
Classification of retail and vacant units in Burgess Hill compared to Britain as a whole (June 2017).
Classification Number % of total National (%) of total
Comparison 52 31 29
Convenience 10 6 13
Service 64 37 27
Leisure 37 22 25
Miscellaneous 7 4 6
Vacant Units 18 10 11
Set out on this table are businesses which
are under represented or over represented
in Burgess Hill compared to the GB average.
The redevelopment of the Martlets is
seeking to address this.
- - - - - -
Mid Sussex Economic Profile Page 11Place
0.5% 1.0% 1.5% 2.0% 2.5% 3.0%
Vacancy rates in Burgess Hill overall are higher than in the other two main towns at 10 per cent, but below the national
average of 11 per cent. For the Martlets Shopping Centre, the vacancy rate is 13 per cent due in part to the imminent
redevelopment. In Burgess Hill 42 per cent of the comparison shops are run by [national chains] as opposed to 58 per
cent run by independents. The national average is 35 per cent to 65 per cent respectively. For Burgess Hill overall the
quality of the multiple comparison goods offer in 2017 is 3 per cent premium, 60 per cent mass and 38 per cent value.
Looking at retail and service floorspace, the 2014 Retail Study estimated that Burgess Hill has a total retail and service
floorspace of 35,416m2 , broken down as follows:
Category Floorspace m2 % of total UK average %
Convenience 5,091 14.4 14.9
Comparison 12,050 34.0 36.3
Total Service 14,177 40.0 39.0
- Retail Service (i.e. health & beauty, travel agents, opticians, etc) 3,317 9.4 7.4
- Leisure Servcie (bars & clubs, cinema, and sport halls, etc) 6,949 19.6 23.2
- Finance & business (banks, building societies, etc) 3,911 11.0 8.2
Vacant 4,143 11.7 9.3
Total 35,461 100 100
Mid Sussex Economic Profile Page 12Place
East Grinstead
Overall East Grinstead has 249 retail units 13 of which are at Queens Walk, the main shopping area.
The current classification of business premises in East Grinstead compared to Britain as a whole (June
2017) demonstrate that the centre is relatively ‘healthy’.
Classification Number % of total GB (%)
Comparison 85 34 29
Convenience 16 6 13
Service 75 30 27
Leisure 57 23 25
Miscellaneous 16 6 6
Total 249 100 100
Vacant units 17 7 11
Set out below are tables which highlight those businesses which are under represented or over
represented in East Grinstead compared to the GB average.
The historic core of the
town centre dates back
to the 14th and 15th
Centuries, is identified as
a Conservation Area and
gives East Grinstead a
distinctive character and
feel.
Mid Sussex Economic Profile Page 13Place
Oversupply by business type (top 5)
The overall vacancy rate at June 2017 was 7 per cent, which is below the national average of 11 per cent. East Grinstead
has a breakdown of 37 per cent multiples and 63 per cent independent retailers, compared to the national average of 35 per
cent multiples and 65 per cent independents. The quality of multiple comparison goods offer in East Grinstead is 6 per cent
premium, 60 per cent mass and 33 per cent value.
Category Floorspace m2 % of total UK average %
Convenience 4,394 11 15
Comparison 14,446 37 36
Total Service: 17,113 44 39
- Retail Service (i.e. health & beauty, travel agents, opticians, etc) 4,822 12 7
- Leisure Servcie (bars & clubs, cinema, and sport halls, etc) 7,423 19. 23
- Finance & business (banks, building societies, etc) 4,868 13 8
Vacant 2,769 7 9
Mid Sussex Economic Profile Page 14Place
Haywards Heath
Overall Haywards Heath has 247 retail units, 36 of which are in the main shopping centre known as The Orchards.
The current classification of business premises in Haywards Heath compared to Britain as a whole (June 2017)
demonstrate that the centre is relatively ‘healthy’.
Classification Number % of total GB (%)
Comparison 85 33.7 29
Convenience 21 8.3 13
Service 87 34.5 27
Leisure 46 18.3 25
Vacant Units 12 4.9% 11.0
The new Waitrose, station
redevelopment and car parking
have improved the quality
of public realm and arrival
experience to this centre by
public transport. Along with
the recent permissions for
planning a new hotel, these
developments demonstrate a
strong appetite for investment in
Haywards Heath.
- - - - - -
Mid Sussex Economic Profile Page 15Place
Oversupply by business type (top 5)
The vacancy rate at 5 per cent is well below the national average of 11 per cent. Overall Haywards Heath has 44.7 per
cent multiples 55 per cent independents, against the Great Britain average of 35 per cent to 65 per cent. For the Orchards
shopping centre the breakdown is 56 per cent multiple and 44 per cent independent retailers. For Haywards Heath overall
the quality of multiple comparison goods offer is premium 9 per cent, mass 66 per cent and value 25 per cent.
Looking at retail and service floorspace, the 2014 Retail Study estimated that Haywards Heath has a total retail and service
floorspace of 33,807m2, broken down as follows:
Category Floorspace m2 % of total UK average %
Convenience 2,824 8 15
Comparison 16,602 49 36
Total Service: 11,873 35 39
- Retail Service (i.e. health & beauty, travel agents, opticians, etc) 3,094 9 7
- Leisure Servcie (bars & clubs, cinema, and sport halls, etc) 5,035 14 23
- Finance & business (banks, building societies, etc) 3,744 11 8
Vacant 2,508 7 9
Total 33,807 100 100
Mid Sussex Economic Profile Page 16Place
Village retail centres in Mid Sussex
The Mid Sussex Retail Study 2014 also set out the results of the health checks
of Hassocks and Hurstpierpoint (the two largest of the village centres). The study
concluded that these centres are performing well in their roles as community “hubs”,
meeting the more frequent retail, service and leisure needs of their local populations.
Hassocks
The primary shopping area in Hassocks runs along Keymer Road, the main exception
to this being the Garden Centre, south of Stonepound Crossroads. Hassocks retail
operators are generally independents. There is a good level of car parking, including
surface car parks behind the parades and some on-street parking. In addition to a
Budgens store, there is also a Sainsbury’s Local convenience store. The village has
a good level of service provision, including opticians, a pharmacy and a number of
hairdressers and estate agents.
Hassocks retail composition 2014
Category / Use Class Number of units Percentage (%)
Convenience 5 9.3
Comparison 20 37.0
Service 27 50.0
Vacant 2 3.7
Total 54 100
The vacancy rate of 3.7 per cent is considerably lower than the national average of 11
per cent, demonstrating how well Hassocks village centre is performing.
Mid Sussex Economic Profile Page 17Place
Hurstpierpoint
The main shopping area in the village is in the High Street, with the majority of retail
units having independent occupiers and being of a high quality. The comparison offer
consists mainly of homeware and interior decoration stores of a high quality. There
has been a recent increase in the number of service units in the village including a
hairdressers. The 2014 Retail Study commented that Hurstpierpoint continues to
suffer congestion problems due to a lack of parking provision and the narrow road
and pavement layouts.
Hurstpierpoint retail composition 2014
Category / Use Class Number Percentage (%)
Convenience 7 11.1
Comparison 19 30.2
Service 36 57.1
Vacant 1 1.6
Total 63 100
Again the very low vacancy rate demonstrates the health of this village centre.
Hurstpierpoint High Street is designated as a Conservation Area and it is
characterised by a rich streetscape made up of a number of listed and unlisted
buildings dating back from the 14th Century and maintaining this distinctive character
will be important going forward.
Mid Sussex Economic Profile Page 18Place
Lindfield
In 2013 a study was commissioned of Lindfield
village centre by the Parish to support the
preparation of the Lindfield and Lindfield Rural
Neighbourhood Plan. This study identified that the
centre is very healthy and meets local community
needs. The retail units are largely owned and
operated by independent retailers and offer an
attractive location for comparison retailing.
The centre is made up of 48 shops and commercial
premises over half of which are in retail use. A
good range of bars, cafes and restaurant uses
complement the retail offer of the centre.
Only 6 per cent of the units are occupied by financial
or professional services which is below the national
average.
The entire centre falls within Lindfield Conservation
Area and the layout and shopfronts of the centre
are a strong characteristic feature which adds to the
charm of this village centre.
Mid Sussex Economic Profile Page 19Place
Business parks
1
Copthorne 2
3 4
East
Grinstead
I
5
The District has
Crawley Ashurst 6
Down Wood
many successful
business parks, the
largest being the
Victoria Business 8
Park in Burgess 7
Pease
Pottage
Hill. Over the past
few years these
9
business parks
have not expanded Horsted
Keynes
and few industrial
units have been
built. Successful,
10 12
14
13
growing businesses Cuckfield
Haywards
Heath
have difficulty 11
finding larger
16
Bolney Existing Mid Sussex
Business Parks
premises. This 15
1 Borers Yard, Copthorne
has resulted in a 17 2 Barns Court, Crawley Down
The Birches, East Grinstead
1 2 19 3
shortage of “grow Sayers
Burgess 4 Imberhorne Industrial Estate, Imberhorne Way, East Grinstead
18 Hill
5 Charlwoods Road Industrial Estate, East Grinstead
on” space and Common 20 6 Ivydene Industrial Estate, Ashurst Wood
The Pavilions, Pease Pottage
“start-up” space
21 7
Hurstpierpoint
8 Lakeland Business Centre, Pease Pottage
for small and new 10
9 Horsted Keynes Industrial Park, Horsted Keynes
Mill Green Road Industrial Estate, Haywards Heath
businesses. Hassocks 11 Western Road Industrial Park, Haywards Heath
12 Lindfield Enterprise Park, Lindfield
13 Burrell Road Industrial Estate, Haywards Heath
14 Bridge Road, Haywards Heath
15 Ricebridge Business Park, Bolney
16 Cross Point Industrial Park, Bolney
17 Bolney Grange, Bolney
18 Victoria Business Park, Burgess Hill
19 Sheddingdean Industrial Estate, Burgess Hill
20 King Business Centre, Sayers Common
21 Avtrade Global, Sayers Common
Proposed Mid Sussex Business Parks
Mid Sussex District Council. 100021794. 2017.
1 Science Park 2 Burgess Hill Business Park
Mid Sussex Economic Profile Page 20Place
Parking
The Council’s contacts with the business community indicate that the lack of car, van
and lorry parking in the District could be having a detrimental impact on economic
growth. This is particularly the case for companies in the District that employ large
numbers of staff. Anecdotally this is also an issue for businesses that are based in the
centres and our towns or on the Victoria Business Park in Burgess Hill.
The Council has 20 town centre car parks operated by pay and display and providing
a total of 2,071 chargeable spaces. The Council Parking Strategy refers to the role
of car parking to support the local economy, local businesses and town centre vitality
through the provision of a quality service.
In 2016/17 there were a total of 1,684,244 pay and display transactions in the Council’s
town centre car parks, which is a 2 per cent increase on the previous year. Of these
transactions, 42 per cent were made in Haywards Heath, 31 per cent in East Grinstead
and 26 per cent in Burgess Hill. Analysis of their use showed that 83 per cent of the
stays were for less than 2 hours.
89,109
27,175 (5%)
(2%) Overall Pay & Display
174,839 Transactions 2016/17
(10%)
809,986
(48%)
583,135
(35%)
Mid Sussex Economic Profile Page 21Place
Haywards Heath
There are eight pay and display car parks in Haywards Heath providing 598 spaces,
the majority of which are designated short stay. A total of 709,697 pay and display
transactions were made in 2016/17, a growth of 3 percent on the previous year. 87
per cent of overall transactions were for the 0-1 hour and 1-2 hours stay periods.
5%
1%
10%
49%
35%
East Grinstead
There are seven pay and display car parks in East Grinstead providing 675 spaces,
with four short stay, two long stay and one combined long and short stay car park. A
total of 529,972 pay and display transactions were made in 2016/17, a two per cent
increase on the previous year. 76 per cent of transactions were for the 0-1 hour and
1-2 hours stay periods.
8%
2%
14%
41%
35%
Mid Sussex Economic Profile Page 22Place
Burgess Hill
There are five pay and display car parks in Burgess Hill providing 818 spaces - two long stay, two
short stay and one combined long and short stay car park. A total of 444,575 pay and display
transactions were made in Burgess Hill during 2016/17, a growth of 2 per cent on the previous year.
84 per cent of all transactions were made for the 0-1 hour and 1-2 hour stay periods. It should
be noted that an additional 300 spaces are provided within the town by the Marketplace shopping
centre, commonly known as the Waitrose car park, which are excluded from this analysis.
5%
1%
10%
49%
35%
Car parking issues in the business parks / town centre offices
The lack of available car parking is a key concern for the businesses with many indicating that
this has impacted a recruitment and retention of staff as well as business expansion. A number
of businesses are starting to explore development of Green Travel Plans for staff and have been
exploring the potential for park and ride schemes.
Analysis of the use of Council car parks and the fact that 83 per cent of transactions were for less
than 2 hours, will be used to inform the refresh of the parking strategy to ensure car parks are
supporting the economic prosperity of each town centre.
Mid Sussex Economic Profile Page 23Place
Housing
Mid Sussex has competitive Council Tax charges as shown by the 2017/18 figures
below:
Council Tax Charges for a Band D property
Adur £1,697.23 - £1,725.13
The average
Arun £1,580.77 - £1,698.88 house price in
Chichester £1,560.31 - £1,675.48
Crawley £1,603.54
Mid Sussex for
Horsham £1,565.68 - £1,645.54 July 2016 was
Mid Sussex £1,570.68 - £1,678.82
Worthing £1,577.03 - £1,634.14
£367,793.
Housing affordability
House prices are high in Mid Sussex compared with the average for West Sussex
and the national average. Land Registry figures show that the average house price
in Mid Sussex at July 2016 was £367,793, against the average for the South East
of £313,315 and for West Sussex of £311,327. Average house prices in the District
have increased by 44.5 percent in the period 2011-2016 The ratio of median house
prices to median earnings in 2015 in Mid Sussex was 12, demonstrating issues with
housing affordability, particularly for young people trying to get on to the housing
ladder.
Housing tenure
Mid Sussex has a higher level of privately owned homes than most of the country.
This may be a reflection of higher than average salaries of residents of the district
and the fact that there are many long-term residents. There has, however, been a
large increase in the size of the private rented sector between the 2001 and 2011
Census, up from 8 per cent to 13 per cent. The percentage of owner occupation in
Mid Sussex has decreased in this period from 79 per cent to 74 per cent.
Mid Sussex Economic Profile Page 24Place
Tenure of households Mid Sussex West Sussex (%) South East (%) England (%)
Owner occupied 42,658 (74.3%) 70.6 67.6 63.4
Shared ownership 561 (0.7%) 0.8 1.1 0.8
Social rent 6,092 (10.6%) 12.8 13.7 17.7
Private rented 7,322 (12.8%) 14.4 16.3 16.8
Living rent free 776 (1.4%) 1.4 1.3 1.3
Total number of households 57,409 (100%) 100.0 100.0 100.0
1.4%
12.8%
Owner occupied
10.6% Shared ownership
0.7% Social rent
Private rented
74.3%
Living rent free
Mid Sussex Economic Profile Page 25Place
Rural economy
The Coast to Capital LEP produced a Rural Statement in 2016 in recognition that the rural economy is a significant contributor to the Coast to
Capital’s prosperity.
In Mid Sussex 29.18 per cent of businesses are based in rural locations which is just above the national average of 26 per cent.
Coast to Capital Local Authority District % of rurally based business
Horsham 71.50
Lewes 35.51
Mid Sussex 29.18
Crawley 1.51
Brighton and Hove 0.41
The rural business population is sectorally diverse in the Coast the Capital LEP area and includes agricultural and forestry; wholesale and retail
trade and repair of motor vehicles; professional, scientific and technical services; construction; and tourism. Home based businesses arean
important feature of the rural economy however these are generally characterised as being small.
The National Farmers Union has provided a detailed breakdown of farming in Mid Sussex by sector
Viticulture is a significant business in Mid Sussex with a growing number of successful and
renown wine growers in the area including the award winning Bolney Wine Estate.
Key challenges identified and being addressed at a local and sub-regional level for the
rural economy include:
• access to communication technology including poor broadband speeds
• transport infrastructure
• access to skills and labour
• housing affordability.
Mid Sussex Economic Profile Page 26Place
Infrastructure
Broadband Worthing West
The figures in the
adjoining table refer to
superfast availability and Mid Sussex
broadband speeds to local
BT telecommunications
boxes. Many businesses Horsham
in the District do not
actually receive these
speeds to their premises East Worthing % of connections > 30 mb/s
since they are connected & Shoreham % of connections > 10 mb/s
to a box via copper wires
% of connections > 2 mb/s
which are sometimes
many miles long. This Average download speed mb/s
Crawley
particularly applies to rural Ultrafast broadband availability %
businesses. Current figures Superfast broadband availability %
suggest that 29 per cent of
businesses in Mid Sussex Chichester
are rurally based and are
often receiving broadband
speeds as low as 2Mb/s. Bognor Regis &
West Sussex County Littlehampton
Council in partnership
with BT Open Reach has Arundel and
been rolling out superfast South Downs
broadband across the
County for some years.
The rural parts of the
County have, for population
density reasons had a
lower priority.
Mid Sussex Economic Profile Page 27Place Broadband speeds The percentage with superfast broadband available in Mid Sussex is at the average level for the South East of 86 per cent, but average download speeds at 22.2Mb/s are lower than the South East average of 30.2Mb/s. Slow broadband speeds and mobile “not spots” in rural locations act as a constraint to economic growth. Many businesses have taken affordable, adequate premises in a rural environment when they do not need to be based in a commercial area. This is particularly true of web based and general IT companies. However, the number of premises that could be used is very restricted across the District because of poor broadband speeds to the premises. This situation restricts the growth of the rural economy and prevents the use of many premises which could be used for growing businesses. Areas with intermittent or no mobile phone reception (“not spots”) still exist across the District. Transport All three town centres have either benefited from recent investment in transport infrastructure or funding has been secured for future investment. The East Grinstead and Haywards Heath train stations have been upgraded and provided with addional parking. £16.96m has been secured from Local Growth Funds to upgrade the A2300 in Burgess Hill with a futher £14.9m secured for infrastructure improvements, the majority of which will support a comprehensive sustainable transport package. A comprehensive transport study assessing measures to improve traffic flow around Haywards Heath has led to the prioritisation of projects to be delivered with Section 106 funds. Mid Sussex Economic Profile Page 28
Place
  Protecting and enhancing the District’s built and natural
  environment
                                                                                                                                                                                     I
  The Mid Sussex area has 36 designated conservation areas. Once a
  conservation area is designated the Council is required by the legislation to
  preserve or enhance the character of the area and development proposals have
  to be considered in light of this requirement.

  •     There are also 1,040 listed buildings within the District of which 18 are the
        highest grade (Grade I) which are considered to be of exceptional
        importance, along with 10 Registered Parks and Gardens in the District.

  Mid Sussex District has a high quality natural environment and around 60 per
  cent of the District is covered by protected landscape designations. Nearly 50 per
  cent of the District is within the High Weald Area of Outstanding Natural Beauty
  (AONB) and just over 10 per cent is within the South Downs National Park. In
  addition the Ashdown Forest lies adjacent to the North East boundary of the
  District.

  The High Weald AONB is a mediaeval landscape characterised by dispersed
  settlements, historic routeways, ancient woodland, open heaths and small
  irregular-shaped fields.

  The South Downs National Park has rolling chalk downland with a steep north-
  facing scarp dropping down to the Low Weald landscape. The chalk grassland
  is a valuable habitat and the area is popular for walking and cycling. The South
  Downs National Park Authority is the local planning authority for the National
  Park area.

  Mid Sussex District also has a variety of nature conservation sites including                                                                 South Downs National Park
  thirteen Sites of Special Scientific Interest (SSSI) and six Local Nature Reserves                                                            AONB - Area of Outstanding Natural Beauty

  which are important for biodiversity. Mid Sussex is the tenth most wooded district                                                            Built Up Area Boundary

  in the South-East and two-thirds of its woodland is classed as ancient woodland.      Mid Sussex District Council. 100021794. 2017.
                                                                                                                                                Mid Sussex District

Mid Sussex Economic Profile                                                                                                                                                  Page 29
Premises
Premises
Having assessed the data around availability of premises the following key issues have emerged:
Key findings:
• There are a diverse range of businesses within Mid Sussex with 20 per cent in the professional, scientific
and technical sector
• 7,305 businesses in the District and a high number of new businesses starting up each year - 905
business births in 2014
• There are better survival rates of businesses in Mid Sussex than the South East average.
• Mid Sussex is home to a number of major manufacturers, retailers and insurers and is also home to a
number of leading science and technology companies, there are a high proportion of micro businesses
(75 per cent) employing fewer than 5 people
• There is a reasonable supply of employment space (605,000 m2 with 41 per cent industrial; 29 per cent
distribution and warehousing; and 30 per cent office space)
• The stock is relatively old and there is some evidence of a lack of “grow on premises” for smaller
businesses looking to expand
• The industrial and office rents are competitive compared to Crawley and Brighton and Hove however the
rental values have increased over the last year
• There has been a significant loss of office floor space to residential conversions particularly in East
Grinstead
• Allocated employment land in Mid Sussex must be brought to the market quickly in order to meet local
need and reduce the risk of displacement of local businesses.
Mid Sussex Economic Profile Page 30“There is
real potential
for growth
amongst both
SMEs and
large business,
but we need
to have
modern and
competitive
premises for
them to grow
into.”
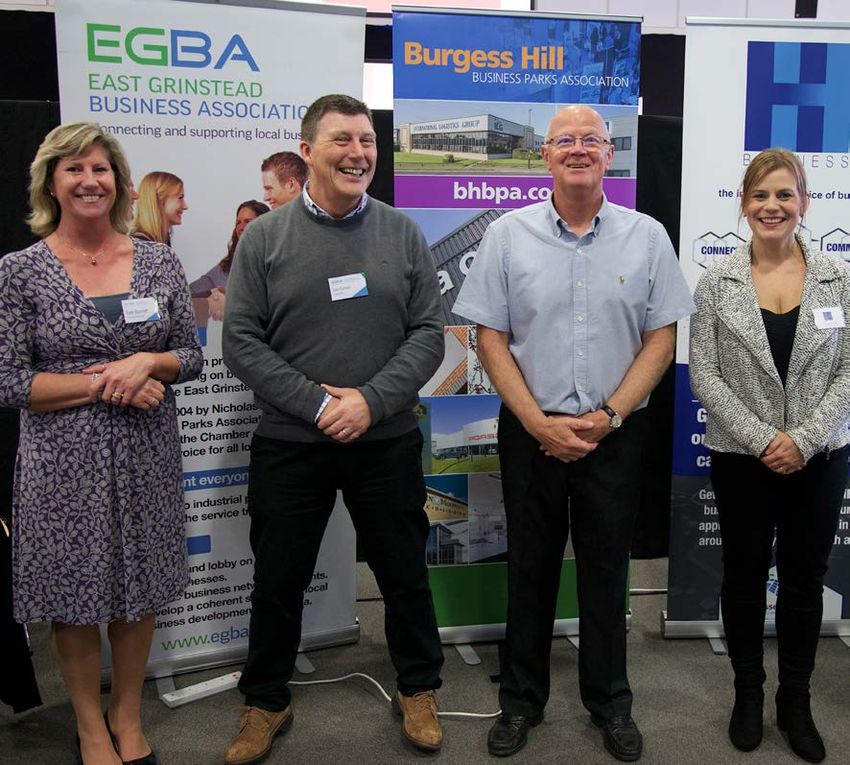
Representives from the
Business Associations for
Haywards Heath, Burgess Hill
& East Grinstead
Page 31Premises
There were 56,800 employees working in Mid Sussex in 2015, 49,100 (87 per
cent) of whom work in the private sector. Mid Sussex is in line with the West
Sussex average, but has a higher proportion of private sector employees
compared to England as a whole (83 per cent).
Two thirds (66 per cent) of local employees in Mid Sussex work full-time and
34 per cent work part-time, which is in line with the West Sussex average. In
England as a whole 69 per cent are full-time and 31 per cent part-time. Four
sectors account for over half (55 per cent) of employee jobs in Mid Sussex as
follows:
Wholesale and retail trade 21%
Human Health and social work activities 16%
Education 11%
Professional, scientific and technical activities 8%
Total 55%
Size of businesses in Mid Sussex
Mid Sussex has a number of major manufacturers, retailers and insurers as well
as many smaller businesses. The table on the next page shows the variety of
sizes of businesses in the local area. Mid Sussex has a higher proportion of
micro businesses than most of West Sussex, with 75 per cent of businesses
employing fewer than five people. Many of Mid Sussex’s businesses are listed
in the Mid Sussex Business Directory which can be found on the Council’s
website. A number of the business parks are supported by active business
associates. Details of these associations can be found at:
Burgess Hill Business Park Association http://www.bhbpa.co.uk/
East Grinstead Business Association http://www.egba.co.uk/
and Haywards Heath Business Association http://hhdba.com/home/
There are also a number of smaller industrial estates across the District.
Mid Sussex Economic Profile Page 32Premises
Size of businesses by employment
Employment 0-4 5-9 10-19 20-49 50-99 100-249 250+ Total
Size
Adur 1,860 350 190 125 40 15 5 2,585
Arun 4,225 855 480 305 70 40 10 5,985
Chichester 5,395 960 520 335 85 50 25 7,370
Crawley 2,710 600 455 310 150 100 55 4,380
Horsham 6,090 990 505 340 105 35 15 8,080
Mid Sussex 5,960 965 565 320 95 60 15 7,980
West Sussex 29,360 5,320 3,080 1,975 635 340 140 40,850
South East 329,810 55,945 33,080 21,295 7,015 3,945 1,615 452,705
Source: ONS 2016 UKBABa Enterprise/local units by employment size band and local authority
Mid Sussex Economic Profile Page 33Premises
Diverse and specialised sectors
Mid Sussex is home to a diverse range of businesses as shown in the chart below.
The largest sector in Mid Sussex is the professional, scientific and technical sector
at 20 per cent. Information and communication enterprises account for 10 per cent
of all enterprises in Mid Sussex. Both of these sectors require employees with
technical skills.
Breakdown of Mid Sussex business by industry group 2016
Mid Sussex Economic Profile Page 34Premises
Source: BRES Analysis (The Business Register and Employment Survey) information at 2015
Mid Sussex Economic Profile Page 35Premises Biggest commercial employers in Mid Sussex American Express Europe Flowserve 1st Central Insurance Rockwell Collins Alexander Rose CAE The Caravan Club Serco Roche Diagnostics Servecorp AV Trade Accelerated Mail and Marketing HPC Compressed Air Systems Edwards Thermo Fisher Scientific International Logistics Group Mid Sussex Economic Profile Page 36
Premises

                        Mid Sussex has a record of being a resilient economy with a large number of active
                        businesses and a high survival rate for new enterprises.

                        Active Businesses

                         Active             2009        2010          2011    2012       2013       2014
                         businesses
                         Adur              2,290       2,320          2,255   2,275     2,340      2,390
                         Arun              5,345       5,290          5,260   5,225     5,205      5,320
                         Chichester        6,295       6,310          6,240   6,255     6,300      6,390
                         Crawley           2,970       2,960          3,015   3,100     3,215      3,380
                         Horsham           6,965       6,875          6,810   6,860     7,065      7,365
                         Mid               6,820       6,865          6,910   6,990     7,065      7,305
                         Sussex
                         Worthing          3,850       3,880          3,800   3,830     3,890      4,005

                        Source: ONS Business Demography 2009 - 2014

                        Mid Sussex has the second largest number of active businesses in West Sussex
                        and the numbers have increased each year between 2009 and 2014.

Mid Sussex Economic Profile                                                                                             Page 37
Premises
Current employment space in Mid Sussex
The current stock of employment (41 per cent) floorspace in Mid Sussex is 605,000 m2 with
much of the supply formed of industrial, distribution and warehousing space (29 per cent).
The commercial office stock at that stage was 81,000 m2, representing some 30 per cent
of all employment floorspace in the District. The distribution of the District’s office stock
is primarily concentrated in Haywards Heath (31 per cent), Burgess Hill (25 per cent) and
East Grinstead (24 per cent). The stock of industrial floorspace is concentrated around
Burgess Hill (42 per cent) and the A273 corridor.
Analysis included in the Economic Growth Assessment 2014 (EGA) found that the stock
was relatively old. 77 per cent of all commercial office space was built before 1980 (50
per cent before 1940), which is a greater proportion in than the wider South East region
as a whole (65 per cent and 40 per cent respectively). For industrial space, 70 per cent is
pre-1980s, slightly higher than the regional equivalent of 66 per cent. Mid Sussex vacancy
levels are around 12 per cent of total stock. Industrial floorspace vacancy was recorded as
8 per cent in Burgess Hill. These levels of vacancy are considered normal for the market
(10 per cent is usually considered a reasonable average vacancy level). As a consequence
there is a shortage of high quality end accommodation for both offices and industrial uses.
As such there is a risk that some businesses will move out of the local area.
The Strategic Economic Land Availability Assessment prepared in May 2016 assessed the
quality of employment sites in the District. Approximately 35 per cent of the sites surveyed
were rated as good, 57 per cent average and only 7 per cent of sites were rated as poor.
Permitted Development Legislation passed in 2013 allows owners of office buildings to
convert them to residential use without the need to apply for planning consent. Since the
value of a building is much greater as residential than it is as office space, the District has
seen an accelerating loss of office space. East Grinstead has been the worst affected to
date with Haywards Heath and Burgess Hill also affected.
Mid Sussex Economic Profile Page 38Premises The Basepoint Centre provides 2896 m2 of high quality workspace and managed office to over 30 local businesses, and is located within walking distance to Haywards Heath Train Station. The Centre has been at full capacity shortly after opening and has a healthy waiting list which supports a gap in the market for a similar opportunity. Mid Sussex’s commercial property market centres around the District’s three main towns of Haywards Heath, Burgess Hill and East Grinstead, totalling 70.5 hectares of employment land, each with a distinctive offer and character. Haywards Heath is the District’s main office centre due in part to its connectivity strengths, and historic role as an important office destination. Demand for good quality modern office premises remain high although there is a need to improve the older stock so that it continues to be attractive to current business occupiers. Burgess Hill has the largest and most established industrial space market and the new business parks, once developed will provide even further employment opportunities. East Grinstead has a mixed employment offer although has suffered significant loss of office space through permitted development. The EGA analysed the quality and suitability of existing employment locations and identifiedthat four of the District’s business parks were identified as good quality sites: - Victoria Business Parks (East and West) at Burgess Hill - Birches Industrial Estate in East Grinstead - Sheddingdean at Burgess Hill Mid Sussex Economic Profile Page 39
Premises

                          Future demand for employment space

                          The Quarter 1 2017 Stiles Harold Williams assessment of Industrial and Logistics for
                          Burgess Hill and Haywards Heath reported a high level of take up of business premises
                          in the year to date. This would have been significantly higher if more stock was
                          available. They report an increasing number of local occupiers frustrated with the lack
                          of available stock in Burgess Hill and Haywards Heath who are desperate to expand
                          and are now having to consider other areas. For East Grinstead, business take up has
                          been lower, attributed to the lack of available stock rather than a reduction in demand.
                          The town also benefits from business demand coming from the Crawley market. Our
                          contacts with the business community point to the lack of “grow on” premises in the
                          District, with the worst impact on the 278m2 – 929m2 category.

                          The EGA noted that a lack of readily available land for new office and industrial
                          development was beginning to divert enquiries outside of the District, as requirements
                          cannot be met.

                          A survey conducted by the Burgess Hill Business Parks Association in September 2014
                          found that 74 per cent of the businesses that responded had grown in the previous 12
                          months whilst a significant number of businesses reported a need to move or expand
                          their premises within the next 18 months. This survey identified that just under half (43
                          per cent) of business had experienced difficulties in finding suitable premises / sites
                          to expand, upgrade or relocate within the local area. Just over half (51 per cent) of
                          respondents were considering expanding premises in the next 5 - 10 years.

                          The EGA concluded that the Council should:

                          - Seek to promote new offices and encourage renewal of older office stock within
                          the Burgess Hill town centre. The business parks proposed to the west of Burgess
                          Hill should be delivered in order to provide additional space and scope for existing
                          occupiers to expand and build new premises.

Mid Sussex Economic Profile                                                                                                 Page 40
Premises
- Intensify existing building space at East Grinstead to reflect demand. The EGA acknowledges
that the Park Road / Maypole Road office cluster has lost considerable office space to
residential use, however, the London Road / Wood Street area, closer to the town centre and
railway station, is a more logical area for retention of space.
- Support and encourage office uses in the town centre. Market feedback suggests that
Haywards Heath is still a relatively popular location for office occupiers.
The stock of office space in Haywards Heath, the District’s main office location, requires
renewal of older legacy space originally designed for larger corporate occupiers in the 1980s
to smaller, more modern and flexible accommodation that is better suited to the smaller
businesses that are now locating in the town.
Levels of industrial and office rents
The Northern West Sussex Economic Growth Assessment (2014) identified the highest levels
of industrial and office rents in Crawley, although this varies depending upon the quality and
age of premises. Rents in Mid Sussex offer a cost advantage to both Crawley and nearby
areas such as Brighton & Hove, Guildford and Reigate.
Industrial and office rents in Northern West Sussex and comparator
locations 2014
Location Industrial (£/sqft) Offices (£/sqft)
Crawley - Manor Royal 7 - 10 15 - 25
Crawley - Town Centre / Three Bridges 7-8 10 - 20
Horsham 6-8 10 - 15
East Grinstead 7-8 9 - 10
Haywards Heath n/a 16 - 17
Burgess Hill 7-8 9 - 11
Brighton & Hove 10 - 12 10 - 20
Source: Northern West Sussex Economic Growth Assessment 2014
Mid Sussex Economic Profile Page 41Premises
Provision for start-up / small businesses
The Council recognises the importance of home based businesses, many of which are likely
to have growth potential. The potential demand for start-up/small business space is often
indicated by the proportion of the working-age population who identify their home as their
primary place of work.
The most up to date data is from the 2011 Census, which showed that 13 per cent of
residents worked from home in Mid Sussex compared to 8 per cent across the South East
and 6.6 per cent across England and Wales. There are several possible reasons for this
shift towards home-working, which could include the opportunities from improved information
infrastructure, increase in transport prices and employers become more flexible. Also, a
trend arising from the period of economic recession of the unemployed being driven into
self-employment and some pre-existing small businesses moving out of commercial property
sites and into the home as a cost-cutting measure.
Home-based businesses often seek more formalised employment space or access to
business support facilities as they grow and expand. There is currently a scarcity of the
Managed Workspace required for homebased businesses to have the opportunity to expand.
In 2015, The Council, in partnership with West Sussex County Council and Basepoint,
provided 33 new business starter units on the site of the old waste depot at Bridge Road in
Haywards Heath.
The only other such operational facility in the District is Citibase in Burgess Hill, which offers
27 serviced offices for rent.
Mid Sussex Economic Profile Page 42Premises
Business births
Mid Sussex has a high number of new businesses starting up each year. The District
saw the largest increase in West Sussex of enterprise births between 2013 and 2014
at nine per cent. There were 905 enterprise births in 2014 in Mid Sussex, the highest
number in the County.
Enterprise birth rates (per 1,000 working age population (aged 16-64))
2009 2010 2011 2012 2013 2014
West Sussex 6.6 6.5 7.0 7.0 8.8 8.7
Mid Sussex 7.3 7.6 8.1 8.0 9.5 10.3
Great Britain 5.9 5.8 6.5 6.7 8.6 8.7
South East 6.7 6.7 7.4 7.5 9.2 9.3
Source ONS Business Demography 2014 Headlines for West Sussex. WSCC Insight Team.
Enterprise death rates (per 1,000 working population, aged 16-64)
Mid Sussex Economic Profile Page 43Premises
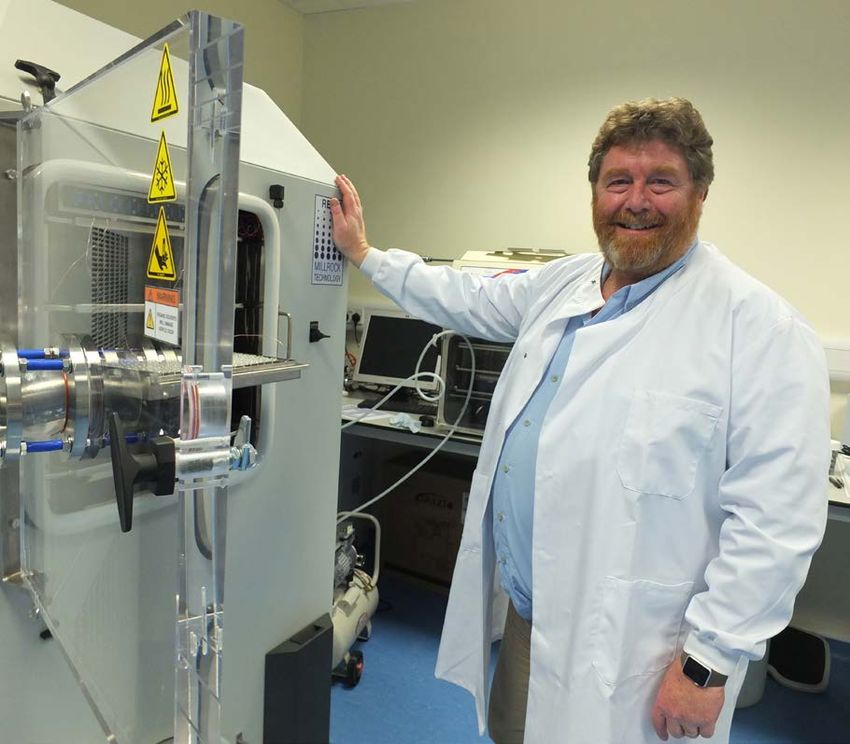
Hotels and conference centres
Our contacts with the local business
community suggest an adequate
level of provision of conference and
hotel accommodation in the more
rural parts of the District, but a lack of
such facilities to meet business needs
in the three towns. The shortage of
local hotel accommodation particularly
applies to companies who have a
high volume of visitors, such as flight
simulation companies who train up
to 150 pilots per week on four week
courses.
The town centre redevelopment
scheme in Burgess Hill includes a 65
bed Travelodge. A 78 bed hotel has
just been granted planning permission
in Haywards Heath, and another
Travelodge is being delivered in East
Grinstead. Once opened these new
facilities will go some way to meeting
local demand, although there is still
considerable demand for mid-range
hotel facilities along with conference
facilities.
Mid Sussex Economic Profile Page 44Premises
Mid Sussex District’s Council property portfolio
The Council’s property portfolio contributes significantly to the economic health of the local economy in a number of ways:-
• In the town centres the Council uses its property interests to encourage development of the retail centres and to
facilitate economic investment
• Leasing and disposal of commercial property to generate revenue income and capital receipts for the Council
encourage businesses to locate and invest within the District
• Identification of appropriate land within the Council’s ownership to bring to market that encourages development for
housing and business uses, brings work and new customers to the District
• Monitoring new business start-ups at the Basepoint Centre, Bridge Road in Haywards Heath on Council land that
provides affordable virtual office space and managed offices for new enterprises within the region.
Mid Sussex Economic Profile Page 45People
People
This section looks at the Mid Sussex population and workforce and the following key
findings have emerged:
Key findings:
• In Mid Sussex there is a high proportion of economically active residents and low
levels of unemployment at 0.5 per cent.
• There are relatively high levels of commuting - 44 per cent commute out of the
District and 33 per cent commute in to Mid Sussex to work although through the
development of new higher quality employment space there is the scope to retain
some of these higher - skilled out - commuters.
• The resident population is highly educated with 46.6 per cent of those aged 16-64
possessing a degree or equivalent.
• Nearly 58 per cent of residents are in Groups 1 – 3 of the Standard Occupational
Classification as managers,senior officials, professional and technical occupations.
• Median earnings by residence of full-time workers who live in Mid Sussex of £615.80
are higher than median earnings by Mid Sussex workplace at £537.60.
• Gross Value Added (GVA) per employee overall is relatively low compared to other
Coast to Capital authorities, but the finance and insurance sectors in Mid Sussex
perform better.
• There is a lack of dedicated 6th form provision in the District.
• There are growing numbers of apprenticeships in the District with 640 starts in
2014/15.
Mid Sussex Economic Profile Page 46“Mid Sussex is
home to a highly
educated and
skilled workforce.
As locally based
science and
technology
business we are
keen to attract
more of that
expertise. Looking
ahead we’re keen
also to have a
future supply of
skilled workers, so
strong education
provision in the
district, and
strong links to
nearby universities
is important
to us too”.
Cells4Life
Burgess Hill Page 47People
Mid Sussex population and workforce
Mid Sussex has a total population of around 147,000 with just over half residing in Burgess
Hill (28,800), East Grinstead (23,900) and Haywards Heath (22,800). Mid Sussex has
economic activity and employment rates that are well above the average and a highly
educated workforce.
Working age population and labour supply
Over 60 per cent of the district’s population are of working age, which is nearly the same as
the average for West Sussex, but slightly below the regional level.
Population aged Mid Sussex Mid Sussex (%) South East (%)
16 - 64 (Number)
All people aged 16 - 64 88,400 61 62
Males aged 16 - 64 43,700 61 63
Females 16 - 64 44,700 60 61
Source: ONS population estimates 2015 accessed through Nomis
Mid Sussex has a high proportion of economically active residents and low levels of
unemployment.
Economically Active Mid Sussex (Number) Mid Sussex (%) South East (%)
Total Economically Active 76,500 83 81
In employment 75,100 81 77
- Employees 62,700 69 65
- Self employed 12,500 12 12
Unemployed 1,900 2 4
Source: ONS annual population survey April 2015 – March 2016 accessed through Nomis
Mid Sussex Economic Profile Page 48People
Westminster
3,313
Travel to work
Tower Hamlets
592
The number of people economically active
(i.e. people available to work) in Mid Sussex
is over 75,000, which accounts for 83 per cent
Croydon
of the 16-64 year old population of the District.
667 There are around 73,000 people in the District
Reigate in employment. Around 44 per cent of residents
and Banstead
(31,745 at 2011) commute out of the District
598 and over 33 per cent of workers in the District
1,727
Tandridge
commute in to Mid Sussex to work.
940
The relatively high level of in and out
commuting has a impact on infrastructure.
Crawley
2,651
While it is recognised that in commuters
7,119
make a significant financial contribution to
the District, it is important that appropriate
Mid 1,358
employment opportunities are promoted within
Sussex Wealden the District to ensure that people who live
2,375
Horsham 2,001
locally have the opportunity to work locally.
1,805
1,802 % 2011
3,492
2,131 Census
Lewes
4,008 % who live and work in the District 48
779
Brighton Work mainly at home 13
Adur & Hove
Commute within the area 35
688
Worthing
332
Travel to work by private vehicle 67
Eastbourne
Travel to work by public transport 5
Travel to work on foot or cycle 28
Inflows and Outflows
to Mid Sussex
Mid Sussex Economic Profile Page 49You can also read