Resident Water Survey Municipality of Chester, 2020
←
→
Page content transcription
If your browser does not render page correctly, please read the page content below
Resident Water Survey
Municipality of Chester, 2020

           Prepared for:
        Municipality of Chester
            151 King St.
             PO Box 369
             Chester, NS
               B0J 1J0

            Prepared by:
            Coastal Action
           45 School Street
              Suite 403
           Mahone Bay, NS
                B0J 2E0

             August 2020
Resident Water Survey, Chester 2020
Coastal Action
45 School Street, Suite 403, PO Box 489, Mahone Bay, Nova Scotia B0J 2E0
Phone: (902) 634-9977
Email: info@coastalaction.org
Web: www.coastalaction.org
Prepared by:
Taylor Creaser, B.Sc., American Eel Project Coordinator, Coastal Action
Contributing Authors and Surveyors:
Shanna Fredericks, M.Sc.
Molly LeBlanc, M.Sc.
Kaylee MacLeod, B.Sc.
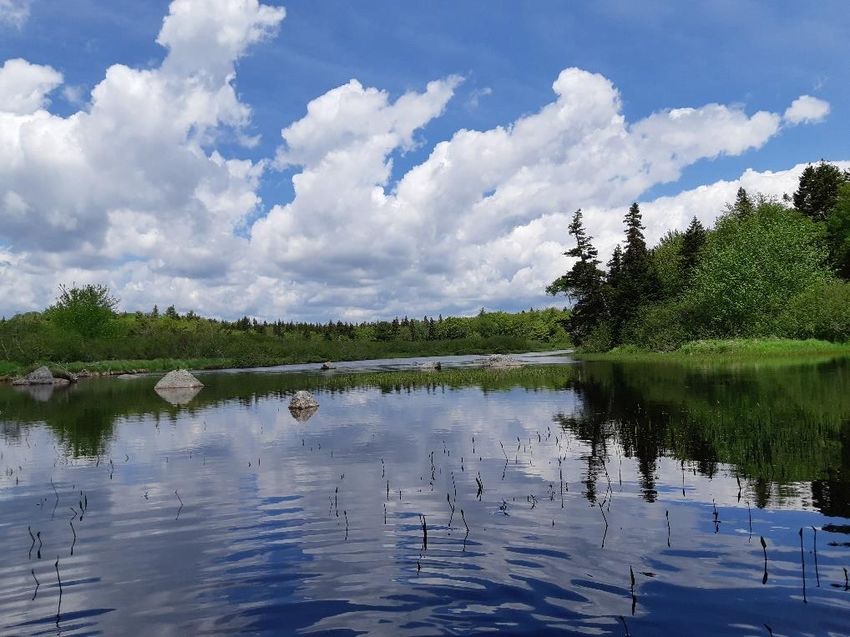
Cover Photo: East River, Municipality of Chester, Taylor Creaser
Coastal Action is a non-profit organization based in Mahone Bay, NS with a mandate to address
environmental concerns throughout the South Shore region of Nova Scotia and beyond. Our mission is to
restore and protect the environment through research, education, and action. Coastal Action works
mainly within four key research areas: Climate Change & Education, Species at Risk & Biodiversity, Water
Quality & Watersheds, and Coastal & Marine.
Page | ii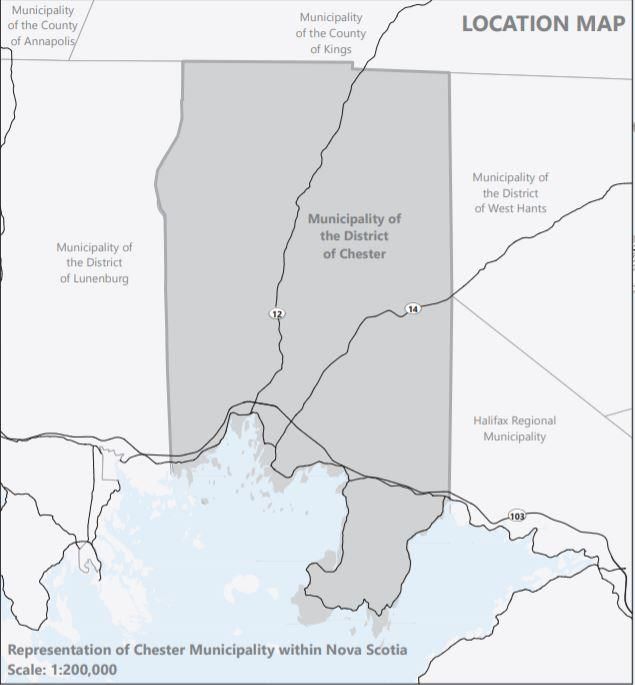
Resident Water Survey, Chester 2020

Table of Contents
Executive Summary...................................................................................................................................... vi
1.0 Introduction ............................................................................................................................................ 1
   1.1 History and Background ...................................................................................................................... 1
   1.2 Project Overview and Objectives ........................................................................................................ 2
   1.3 Survey Area ......................................................................................................................................... 3
2.0 Materials and Methods ........................................................................................................................... 4
   2.1 Survey Design ...................................................................................................................................... 4
   2.2 Implementation & Timeline ................................................................................................................ 4
3.0 Results ..................................................................................................................................................... 5
   3.1 Participant Demographics ................................................................................................................... 5
   3.2 Household Water Infrastructure......................................................................................................... 6
   3.3 Public Perceptions............................................................................................................................... 9
   3.4 Level of Concern................................................................................................................................ 14
   3.5 Water Conservation & Healthy Water Practices .............................................................................. 18
   3.6 Barriers to Conservation ................................................................................................................... 27
   3.7 Level of Support for Municipal Water Strategy and Action Plan ...................................................... 29
4.0 Discussion & Recommendations........................................................................................................... 32
   4.1 Recommendations ............................................................................................................................ 35
5.0 Acknowledgements............................................................................................................................... 36
6.0 References ............................................................................................................................................ 36

                                                                                                                                                     Page | iii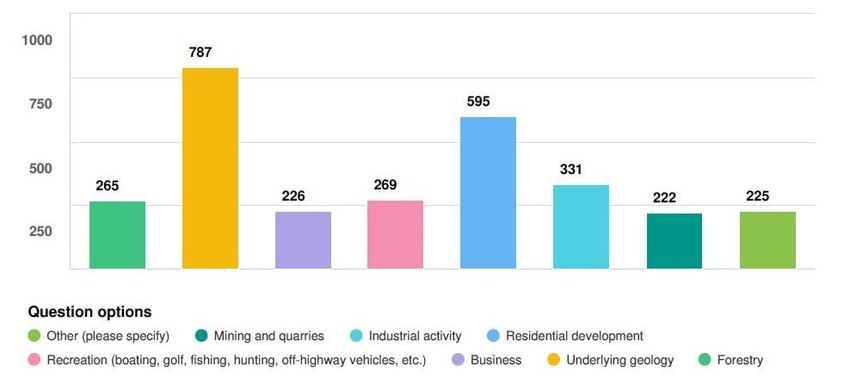
Resident Water Survey, Chester 2020

List of Figures
Figure 1. Map of Nova Scotia showing the Municipality of Chester in red (Source: Wikipedia, 2009). ....... 3
Figure 2. Municipality of Chester boundaries (Source: Municipality of the District of Chester).................. 3
Figure 3. Number of survey participants from each of the seven Districts in the Municipality. .................. 5
Figure 4. Number of respondents versus number of months per year lived in the Municipality. ............... 6
Figure 5. Number of respondents versus number of years lived in the Municipality. ................................. 6
Figure 6. Type of water treatment systems used by residents. ................................................................... 7
Figure 7. Party that most frequently maintains water treatment systems. ................................................. 7
Figure 8. Annual cost of maintaining water treatment systems with purchase and installation costs
omitted. ........................................................................................................................................................ 8
Figure 9. Most common types of septic systems survey respondents have. ............................................... 8
Figure 10. Frequency of septic pumping of respondents. ............................................................................ 9
Figure 11. Participant opinions on the top three factors influencing water quality in their communities.
 .................................................................................................................................................................... 10
Figure 12. Participant opinions on the top three factors influencing water quantity in their communities.
 .................................................................................................................................................................... 12
Figure 13. Map showing water bodies of medium and high concern in the Municipality; including
Sherbrooke Lake (medium) Gold River (high) and Middle River (medium). .............................................. 14
Figure 14. Map showing water bodies of medium and high concern in the Municipality; including Middle
River (medium), Stanford Lake (high), Spectacle Lake (high), East River watershed (medium), Fox Point
Lake (high) and Bayswater Pond (medium). ............................................................................................... 14
Figure 15. Parties most responsible for managing quality and quantity of water in the Municipality of
Chester. ....................................................................................................................................................... 15
Figure 16. Graphical representation of respondent’s views on performance of each party managing
water resources. ......................................................................................................................................... 16
Figure 17. Each District's perception of the Municipal Government’s performance managing water
quality and quantity. ................................................................................................................................... 17
Figure 18. Each District's perception of the Provincial Government's performance managing water
quality and quantity. ................................................................................................................................... 17
Figure 19. Each District's perception of Citizen's performance managing water quality and quantity. .... 18
Figure 20. Occurrences of water shortages in the Municipality. ................................................................ 19
Figure 21. Map of the Municipality showing location and number of water shortages reported to the
water survey since 2014. ............................................................................................................................ 20
Figure 22. Map of the Municipality showing location and number of water shortages reported to the Dry
Well Inventory since 2016. ......................................................................................................................... 20
Figure 23. Frequency of water supply testing for bacteria (fecal coliforms and E. Coli) among 66% of
participants who indicated they test their water for bacteria. .................................................................. 21
Figure 24. Frequency of water supply testing for common chemicals (arsenic, uranium, lead, nitrate,
nitrite and fluoride) among just over 50% of participants who indicated they test their water for
chemicals. ................................................................................................................................................... 21
Figure 25. Most common barriers for water testing reported in terms of the number of respondents who
indicated they did not test their water for bacteria and/or metals. .......................................................... 23
Figure 26. Breakdown of ways to remove barriers to water testing, reported by respondents who
indicated they did not test their water. ...................................................................................................... 24

                                                                                                                                                          Page | iv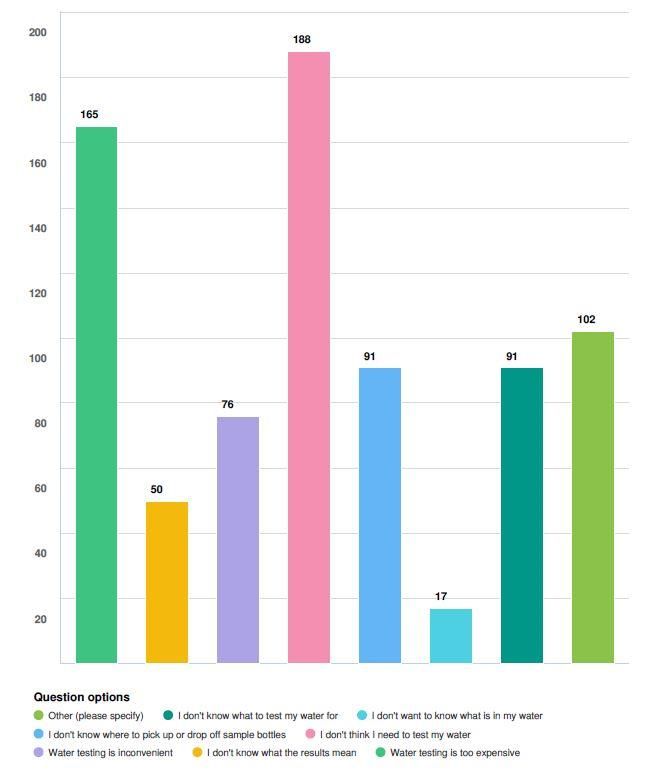
Resident Water Survey, Chester 2020

Figure 27. Known water quality issues reported by survey respondents................................................... 25
Figure 28. Map showing the type, frequency, and location of known water quality issues as reported by
survey participants. Aesthetic parameters were omitted in favor of mapping only issues of higher
concern. ...................................................................................................................................................... 26
Figure 29. Most common water conservation practices used by survey participants. .............................. 27
Figure 30. Most common barriers for household water conservation reported by respondents who
indicated they did not practice any conservation measures. ..................................................................... 28
Figure 31. Breakdown of ways to remove barriers to water conservation measures, reported by
respondents who indicated they did not practice water conservation...................................................... 29
Figure 32. Level of support of all respondents for a Municipal Water Strategy and Action Plan. ............. 30
Figure 33. How much financial considerations impact decisions related to the quality and quantity of
respondent’s water supply. ........................................................................................................................ 30
Figure 34. Amount that survey participants are willing to pay for access to adequate quality and quantity
of water to meet their needs. ..................................................................................................................... 31
Figure 35. Breakdown of how much respondents are willing to pay based on the district in which they
live. There were no significant differences between the District’s willingness to pay. .............................. 31

List of Tables
Table 1. Analysis showing participant responses to Likert Scale questions asking about water quality,
quantity, and importance of water issues in the Municipality. .................................................................. 10
Table 2. Percentages indicating respondents perceived primary (gold), secondary (green) and tertiary
(grey) threats to water quality in each District. Percentages (including % skipped) sum to 300 as
respondents could choose up to three options. ......................................................................................... 11
Table 3. Percentages indicating respondents perceived primary (gold), secondary (green) and tertiary
(grey) threats to water quantity in each District. Percentages (including % skipped) sum to 300 as
respondents could choose up to three options. ......................................................................................... 12
Table 4. Analysis showing participant views on how well each party fulfills their water managing
responsibility on a survey wide scale. The median response in all cases was 2 (adequate). ..................... 15
Table 5. Comparison of well number and well type with shortages reported to the Municipal Dry Well
Inventory versus the survey after 2014. ..................................................................................................... 19
Table 6. Proportions of absent (respondents that indicated they do not test) and infrequent (testing
every 6 years or less) resident water testing based on District. ................................................................. 22

                                                                                                                                                     Page | v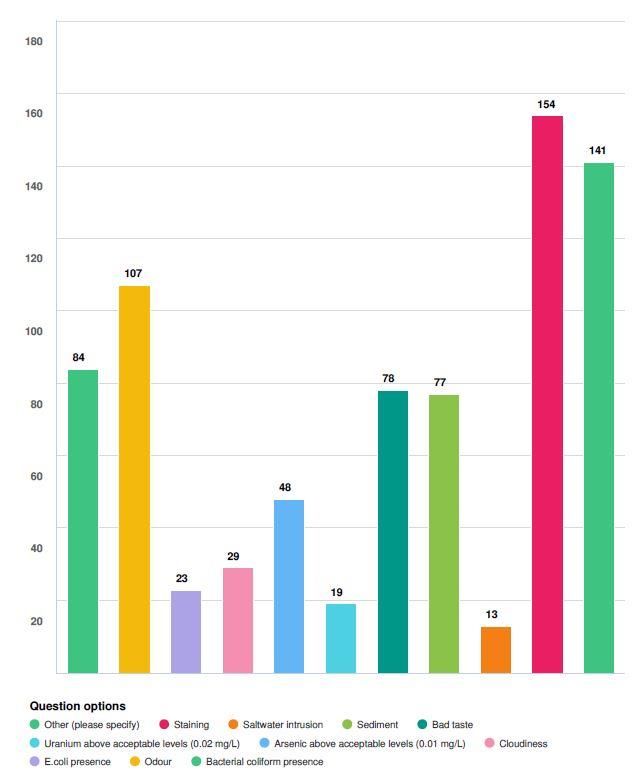
Resident Water Survey, Chester 2020

Executive Summary
In the fall of 2019, Coastal Action was approached by the Municipality of Chester to assist with the design,
implementation, and analysis of a resident water survey for all residents and businesses within the
Municipality of Chester. The consultation process was intended to create a baseline understanding of
current public perceptions, attitudes, and opinions on water management and conservation in the
Municipality. This public consultation is to be used as a means of informing the development of the
comprehensive Water Strategy and Action Plan. The survey was designed over the winter of 2019/20 and
6,100 print copies were mailed to all residents of the Municipality at the beginning of April 2020.
Participants also had the option to complete the survey online during the consultation period, which
lasted approximately eight weeks.

In total, 1,220 surveys were returned, both through the online platform, Voices and Choices, and the
return of completed print copies, a return rate of 20%. The survey primarily captured the responses of
long-term (55%) and full-time (87.4%) occupants from all seven Districts in the Municipality. Public
perceptions and knowledge levels of personal water quality and quantity and the risks to them were
generally high. Underlying geology was identified as the top concern to water quality, while climate
change and drought were considered the top threats to water quantity. There was much less certainty
among respondents about threats to specific water bodies in their area and about who is responsible for
managing water resources. The analysis revealed differing views among some of the Districts on how well
the responsible stakeholders’ function at managing water, displaying a change in attitude depending on
the respondent’s location.

Gaps in reporting to the Municipal Dry Well Inventory were identified, as only 42 of the total 270 dry well
reports identified by the survey were also reported to the inventory since 2014. The survey also showed
that rates of infrequent testing (every 6 years or more) or absence of testing altogether were high, with
over 50% of participants from almost every District testing infrequently for both bacteria and chemicals.
Barriers to water testing primarily included the view that it was unimportant (38.3%) and that it was too
expensive (33.6%). Although most respondents indicated they would be willing to test their water if these
barriers were removed.

Most respondents indicated that they employ water conservation practices in their home or business
(84.4%), with the most common being general water conscientious actions (82.0%) and fixing leaks
(80.3%). An assessment of the barriers among those that did not conserve water revealed the attitude
that it is unimportant and not a priority, with many indicating they would be willing to if there were
financial incentives to do so (36.4%).

Finally, the level of support for the Municipal Water Strategy and Action Plan was found to be a median
value of 2, or ‘somewhat support’. There was no difference in this level of support across Districts within
the Municipality, indicating general approval for the plan among respondents.

                                                                                                  Page | vi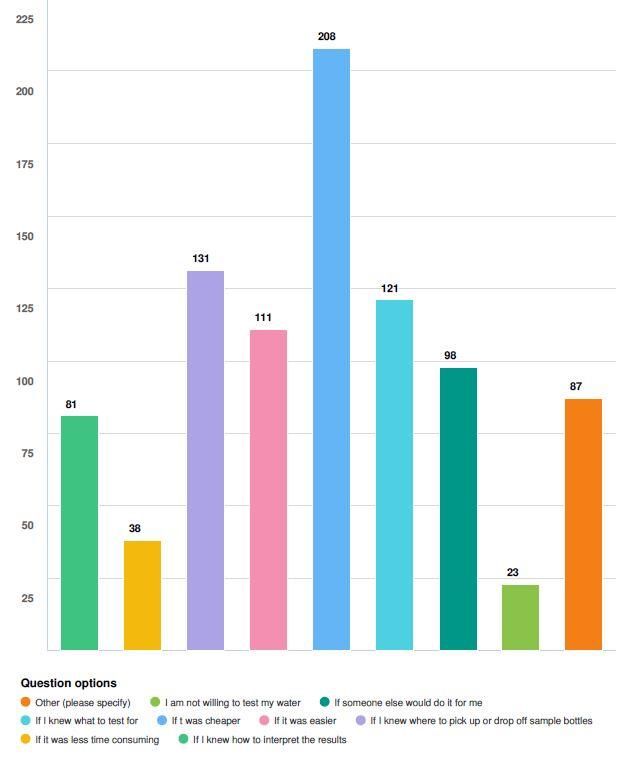
Resident Water Survey, Chester 2020

1.0 Introduction
1.1 History and Background
A Water Strategy and Action Plan was created by the Municipality of the District of Chester (MOC) with
the mandate to proactively manage surface and ground water resources while combatting water issues
such as climate change, sea level rise, growth, and development within the Municipality. The strategy
aims to address the needs of the environment, while meeting the economic and physical needs of
residents for a safe and sufficient water supply. Using an integrated approach to manage both the surface
and ground water supply, the strategy is meant to be a living document which will be amended and
improved to maintain a clean and abundant supply of water for today and into the future. This strategy
outlines several key objectives such as: understanding the current state of the Municipality’s water supply,
development of water conservation plans, addressing the needs of the natural environment, and creating
plans for managing drought.

A Water Strategy Team has been created to meet the above objectives. This is in combination with the
continued development of a comprehensive strategy with tools and programs that MOC and its partners
can use when addressing water supply and water quality issues. There are several ongoing and past
water-related initiatives that are being conducted as part of this strategy, in addition to the Municipal
Water Survey. They include the investigation of a central water supply for the Village of Chester; a
Municipal Dry Well Inventory; a Water Supply Upgrade Lending Program; and several ongoing water
quality monitoring programs in conjunction with Coastal Action and the Municipality of the District of
Lunenburg.

Discussions surrounding the installation of a central water system in Chester Village have been ongoing
since a 1967 study which determined that the wells in the Village would not be able to provide a long-
term supply to meet demand of residents and businesses. Since that time, many consultations and
options have been explored. Currently, the two most feasible options are to obtain central water from a
ground water source (Middle River) or surface water (Spectacle Lake). On January 26, 2019, residents of
the village voted on whether to pursue a central system or not. This resulted in a 43% yes vote and 57%
no (Municipality of the District of Chester, n.d.).

MOC began an initiative to track wells that are dry or nearly so within the Municipality. It began in 2016
and has continued annually. Residents can report to a Water Shortage Tracker, which is hosted on the
Municipality’s website. They report their name and address, the date, type of well, community, and any
other relevant information, which is then compiled into a database to track annual shortage trends.

There is currently a Water Supply Upgrade Lending Program in place which provides eligible residents with
low interest loans to help with costs of improving their supply of safe, potable water. The budget for this
project is allocated annually on a first come, first serve basis to help with a variety of things including the
construction of a new dug or drilled well; an upgrade to an existing well required to source potable water
for the property; the installation of equipment such as a well pump, a water line, and an electrical
connection to support the function of a new or upgraded well; and other equipment, such as cisterns and
containers, to improve the supply, use, and conservation of potable water (Municipality of the District of
Chester, n.d.).

                                                                                                      Page | 1
Resident Water Survey, Chester 2020

MOC delivers several ongoing water quality monitoring programs in conjunction with Coastal Action.
These programs were initiated due to public concerns over the recreational safety of water as well as the
impacts of development. MOC currently supports the following monitoring programs: Fox Point Lake,
Bayswater Pond, Rafuse Cove, and Sherbrooke Lake. The Sherbrooke Lake Water Quality Monitoring
Program is completed in partnership with the Municipality of the District of Lunenburg.

1.2 Project Overview and Objectives
Coastal Action was approached by MOC in the fall of 2019 to assist with the design and implementation
of a public consultation process which would engage all homeowners within the seven Districts of the
Municipality on issues of water usage, conservation, quality, and quantity. The consultation process was
intended to create a baseline understanding of current public perceptions, attitudes, and opinions on
water management and conservation in the Municipality of Chester. This public consultation is to be used
as a means of informing the development of the comprehensive Water Strategy and Action Plan.

Following discussions between Coastal Action and the Water Strategy and Action Plan Steering
Committee, five objectives were identified for the public consultation process:

    1. Determine public perceptions (knowledge level) of MOC residents regarding water usage,
       conservation, quality, and quantity.
    2. Determine attitudes (level of concern) of MOC residents regarding water usage, conservation,
       quality, and quantity.
    3. Determine current water conservation practices being used by MOC residents.
    4. Determine barriers preventing MOC residents from implementing water conservation practices.
    5. Determine opinions and level of support of MOC residents for various components/programs of
       a Municipal Water Strategy and Action Plan.

The survey questions and analyses were designed to directly answer the above consultation objectives by
engaging all residents and businesses within the Municipality of Chester.

                                                                                                Page | 2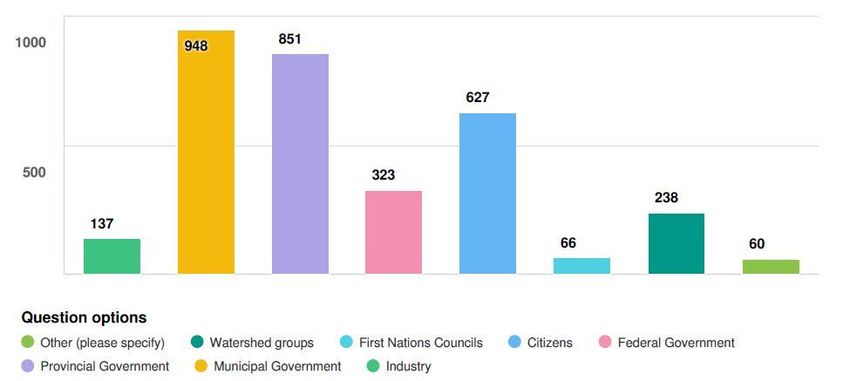
Resident Water Survey, Chester 2020

  1.3 Survey Area
  The survey was administered in the Municipality of Chester. The Municipality is located within Lunenburg
  County, on the South Shore of Nova Scotia. It covers a geographical area of approximately 1,122 km2
  within Lunenburg County (Statistics Canada, 2017). It borders Halifax Regional Municipality and the
  Municipality of the District of West Hants on one side, with the easternmost community being Hubbards.
  Most of the population is clustered in communities adjacent to the coast, although the Municipality
  extends substantially inland and borders on Kings County to the north. Finally, the community of Martins
  River defines its westernmost border, after which is also Lunenburg County, however, within the
  jurisdiction of the Municipality of the District of Lunenburg. The Municipality of Chester is divided into
  seven Districts, each including multiple communities.

Figure 1. Map of Nova Scotia showing the Municipality of Chester in red   Figure 2. Municipality of Chester boundaries (Source:
(Source: Wikipedia, 2009).                                                Municipality of the District of Chester).

  District One is comprised mainly of the communities on the Aspotogan Peninsula including: Aspotogan,
  Bayswater, Blandford, Northwest Cove, Deep Cove, East River, and part of East Chester. District Two is
  comprised of Hubbards, Mill Cove, Fox Point, Simms Settlement, Mill Lake and The Lodge. District Three
  contains the most populated area in the municipality, Chester Village, and part of East Chester. District
  Four has the communities of Chester Basin, Chester Grant, and part of Middle River. District Five is
  comprised of Gold River, Beech Hill, Western Shore, Martin’s Point, and part of Martin’s River. District Six
  has the communities of Seffernsville, Lake Ramsay, Forties, Franey Corner, and Fraxville. Finally, the
  communities of Windsor Road, Canaan, Sherwood, and Marriotts Cove comprise District Seven.

                                                                                                                    Page | 3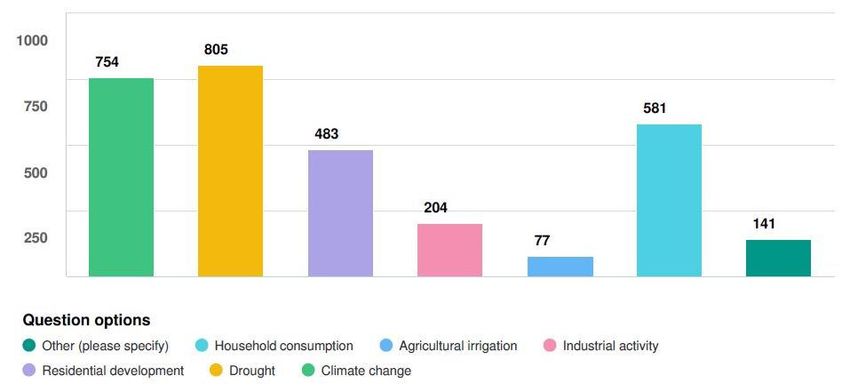
Resident Water Survey, Chester 2020

2.0 Materials and Methods
2.1 Survey Design
This survey was designed using elements from the Total Design Method (Dillman, 1978) with the intention
of increasing response rates. Dillman’s method has been shown to yield an average response rate of 73%.
Due to both financial and time constraints, not all facets of the Total Design Method were employed;
however, several aspects were utilized.

Surveys were designed in booklet format, using standard letter-sized paper which was folded in half. This
size is less likely to be viewed as junk mail, decreasing the likelihood of it being discarded. The first page
began with an introductory covering letter to participants explaining the purpose of the survey and what
the data will be used for. Easier “warm-up” questions that required less critical thinking to answer were
placed at the beginning of the survey, while the more difficult questions were placed near the middle.
Demographic questions were placed at the end of the survey as research shows they are more likely to
be completed if they are asked later (Hoddinott & Bass, 1986).

MOC designed an online version of the survey, providing respondents with a digital option. It was hosted
on the Municipality’s online engagement platform, Voices and Choices. Deploying both hard copy and
online surveys was important to target a wider range of demographics within the Municipality and to
reduce barriers in survey return. Although the question formatting varied slightly between the online and
paper versions of the survey, the total number of questions asked of all respondents was 54.

Included with the surveys was a prepaid return envelope, again to minimize barriers to returning the
survey and allow participants to complete it at no cost. Finally, a postcard was mailed out to all addresses
at the mid-point of the consultation period to remind them of the importance of filling it out and to
encourage a greater response rate.

2.2 Implementation & Timeline
Once the design phase was completed, MOC handled distribution and promotion of the survey. In total,
6,100 print surveys were sent via Canada Post's unaddressed neighborhood mailing to every address
within the Municipality. The sealed survey booklet was sent along with a return envelope, each of which
had a unique alpha-numeric code to avoid survey duplication when using Voices and Choices. At the mid-
point of the consultation period, Canada Post’s unaddressed mail-out was once again utilized to send out
the reminder postcards to every address in the Municipality.

The consultation period lasted approximately eight weeks. Surveys were mailed at the beginning of April
2020 and the cut-off date for accepting returns was approximately June 5, 2020. This was not a hard date
as both paper and online surveys were still accepted during the data entry phase, which was completed
by both MOC and Coastal Action staff by the end of June 2020.

                                                                                                     Page | 4
Resident Water Survey, Chester 2020
3.0 Results
3.1 Participant Demographics
At the conclusion of the survey period, a total of 1,220 surveys were completed by residents and
businesses located within the Municipality of Chester. This is a 20% return rate of the total 6,100 copies
of the survey that were mailed out. Responses were collected both through the return of hard copy
surveys and the online survey platform. The paper questionnaires were then entered into the online
platform by Municipal staff and Coastal Action staff for analysis.
Respondents from all seven Districts were represented in the survey analysis (Figure 3). Participants were
asked in an open-ended question to identify their communities, which in turn, allowed for sorting into
Districts. Over 40 communities in the Municipality were represented from each of the seven Districts.
District Three is comprised, in part, by the most densely populated area in the Municipality, Chester
Village, and was represented with the largest number of respondents (22.1%). This was followed by a
relatively comparable number of participants from the remaining six Districts in the Municipality, with
District Seven having the least number of respondents (Figure 3).
300
250
Number of Respondents
200
150
100
50
0
1 2 3 4 5 6 7 Unknown
District
Figure 3. Number of survey participants from each of the seven Districts in the Municipality.
This questionnaire primarily captured responses from long-term and full-time residents of the
Municipality. Of the 1,207 respondents who chose to answer, only 27 (2.2%) filled the survey out for a
commercial property and the remaining 1,182 (97.8%) were residential. Eight hundred fifteen (87.4%)
were full-time occupants of the Municipality, living and/or operating businesses on a year-round basis
(Figure 4). Five hundred thirty respondents (55.0%) also indicated that they have been residents/business
operators within the Municipality for 20 years or greater, with the remaining time categories split into
residents who had lived in the Municipality for five years or less (15.7%), between six and ten years (11.4%)
and 17.8% who had lived there for 11 to 20 years (Figure 5). Further demographic questions indicated
most respondents were also homeowners (85.0%) as opposed to tenants, who occupied single family,
Page | 5Resident Water Survey, Chester 2020
detached homes (91.6%). Other housing types included apartments (1.4%), mobile homes (2.4%),
duplex’s (1.6%), cottages, and townhomes.
1000 600
# of Respondents
# of Respondents
800 500
400
600
300
400 200
200 100
0 0
20 years
month month months months round years years
# Months per Year Spent in Municipality Years Lived In Municipality
Figure 4. Number of respondents versus number of months per Figure 5. Number of respondents versus number of years lived
year lived in the Municipality. in the Municipality.
3.2 Household Water Infrastructure
The certainty among respondents about the source of their drinking water was high, with the question
receiving a 98% response rate. Of the respondents, only 0.5% answered that they did not know where
their water came from. Most residents obtained their household water from either dug (49.6%) or drilled
wells (47.5%). Other sources included cisterns, springs, surface water, brought from elsewhere, or did not
know; however, these sources accounted for less than 1% each. The twelve “other” responses were coded
and sorted into categories, all of which indicated a combination of two or more of the above water
sources. Of those that indicated they have a well, 81.8% reported that they drink the water from it, with
the remaining 18.2% stating they do not.
There was also a great deal of certainty among respondents regarding whether their drinking water was
treated or not. The question received a 98% response rate, with only 1.1% of respondents answering that
they did not know. The proportion of residents who treat their water (45.8% all household water; 5.9%
drinking water only) was slightly larger than the proportion of residents who had no treatment installed
(47.2%). However, this certainty changed when it came to identifying the type of treatment they used.
Only 37% of participants responded to the question. The most common types of treatment used were
ultraviolet light (31.3%), water softeners (30.7%), and reverse osmosis (14.6%). In the coded “other”
responses (5.1%), several residents indicated that they used particle filters, bleached their water, boiled
their water, or used iron filters (Figure 6).
Page | 6Resident Water Survey, Chester 2020
160
Number of Respondents
140
120
100
80
60
40
20
0
Reverse Water Greensand Activated UV I Don’t Know Other
Osmosis Softener Filter Carbon
Treatment Type
Figure 6. Type of water treatment systems used by residents.
Just over half of respondents (50.4%) maintained their own treatment systems, followed by 35.9% who
employed a company and 8.0% that were maintained by a plumber. The remaining 5.7% of respondent’s
treatment systems were maintained primarily by friends, other members of the household, or property
managers. The response rate for this question was higher (49.3%) than the previous question asking the
type of treatment system (37%). This result is surprising due to the large proportion that indicated they
maintained their own system but did not indicate the type that they had (Figure 7).
350
300
Number of Respondents
250
200
150
100
50
0
I maintain Friend Company Plumber Family Don't Know Other
my own Member
Who Maintains Treatment System
Figure 7. Party that most frequently maintains water treatment systems.
The annual cost of maintaining these systems was reported, with the largest proportion of respondents
who had treatment systems installed (47.3%), paying between $100 - $299 annually and 28.9% paying
between $1-$99. Very few (2.1%) paid over $1,000 and 9.4% stated that they did not pay anything (Figure
8).
Page | 7Resident Water Survey, Chester 2020
300
250
Number of Respondents
200
150
100
50
0
$1-$99 $100-$299 $300-$499 $500-$1000 >$1000 Don't pay
anything
Yearly Treatment Cost
Figure 8. Annual cost of maintaining water treatment systems with purchase and installation costs omitted.
Participants were also asked to describe their septic systems, in which there was a large amount of
certainty, again with a 98% response rate. The most common type of septic system is a holding tank and
distribution field (71.0%) followed by central sewer (20.9%) and holding tank only (2.9%). Very few
residents had cesspools, outhouses/composting toilets, or “other” such as peat and anaerobic composting
systems. Several residents indicated they did not have septic systems; some were unsure of the type and
some indicated within the “other” response section that they were on town systems (Figure 9).
900
800
Number of Respondents
700
600
500
400
300
200
100
0
Type of Septic System
Figure 9. Most common types of septic systems survey respondents have.
Page | 8Resident Water Survey, Chester 2020
Those with their own septic systems reported how frequently they are pumped. Most fell within the Nova
Scotia provincial recommendations of every three to five years, with 38.4% stating they pumped their
septic every one to three years and 31.4% getting it pumped every four to five years (Figure 10).
400
350
Number of Respondents
300
250
200
150
100
50
0
Every year Every 1 - 3 Every 4 -5 Every 6 - 10 > 10 years I don't know
years years years ago
Frequency of Septic Pumping
Figure 10. Frequency of septic pumping of respondents.
3.3 Public Perceptions
One of the primary objectives of the questionnaire was to examine public perceptions and knowledge
levels pertaining to water quality, quantity, usage, and conservation. The survey began with three
questions which were designed to be relatively simple to encourage higher overall response rates. They
were Likert Scale questions which asked participants to rank their water quality and quantity from
excellent (1) to very good (2), fair (3), poor (4), very poor (5), with a don’t know (6) option. Overall, most
respondents reported both their drinking water quality and quantity to be either very good or excellent.
These questions had high response rates, with few participants skipping them. The median rank when
examining participant’s perceived water quality was 2 (very good) and the perception of quantity yielded
a median value of 1 (excellent). Participants seemed to be very knowledgeable about the quality and
quantity of their water sources, with only 4.8% and 2.45% respectively, answering that they did not know
(Table 1). Respondents also indicated with a high degree of certainty that water issues were very
important (72.8%) or important (13.8%) to them, with the question having a median value of 2 (very
important).
Page | 9Resident Water Survey, Chester 2020
Table 1. Analysis showing participant responses to Likert Scale questions asking about water quality, quantity, and importance
of water issues in the Municipality.
Standard % Don’t
Variable Scale Range Mean Median
Deviation Know
Excellent (1) to Very 2.60 1.88 4.84
Quality of Water 2
Poor (5)
Excellent (1) to Very
Quantity of Water 1.99 1 1.39 2.45
Poor (5)
Importance of Very Important (1) to
2.6 2 1.2 0.6
Water Issues Not Important (5)
Participants were then asked to choose what they thought were the top three factors impacting both
water quality and quantity from a list. The largest perceived impact to water quality in the Municipality
was underlying geology, as 67.7% of respondents felt it was important. This was followed by residential
development (51.2%), industry (28.4%), forestry (22.8%), recreation (23.1%), business (19.4%), other
(19.3%), and mining and quarries (19.0%). Many threats to water quality were described, when “other”
responses were coded and sorted, some of which fell into the above categories. The main “other” threats
identified by residents included: farming, acid rain, climate change and drought, runoff from roads, poor
septic and well design, surface water contamination, infilling of wetlands, and saltwater intrusion (Figure
11).
Figure 11. Participant opinions on the top three factors influencing water quality in their communities.
These threats were analyzed based on the District in which respondents live. The top three threats were
ranked for each District (Table 2). Each of the seven Districts agreed that underlying geology was the top
factor impacting water quality. All Districts, except for Five and Six, ranked residential development as
Page | 10Resident Water Survey, Chester 2020
the number two concern. District Five listed recreation and District Six said forestry was the secondary
factor impacting water quality. Finally, most areas listed industry as the third most important factor;
however, business, mining and quarries, and “other” were also chosen.
Table 2. Percentages indicating respondents perceived primary (gold), secondary (green), and tertiary (grey) threats to water
quality in each District. Percentages (including % skipped) sum to 300 as respondents could choose up to three options.
Residential Mining &
Geology Industry Recreation Forestry Business Other
District Development Quarries
(%) (%) (%) (%) (%) (%)
(%) (%)
1
72.7 45.3 41.3 16.9 22.7 13.4 20.9 18.6
n = 172
2
63.3 54.7 31.7 30.2 24.5 10.8 14.4 15.8
n = 139
3
69.6 60.4 20.0 14.1 10.0 30.7 15.2 19.6
n = 270
4
61.2 46.1 35.4 19.7 23.0 19.1 27.0 14.6
n = 178
5
60.8 18.9 18.9 25.2 16.1 16.1 11.9 22.4
n = 143
6
65.4 33.1 18.0 39.1 48.1 8.3 16.5 21.8
n = 133
7
62.2 41.8 23.5 20.4 21.4 15.3 26.5 18.4
n = 98
DK
48.3 48.3 28.7 19.5 18.4 25.3 13.8 14.9
n = 87
The largest perceived impact to water quantity was drought (68.9%), followed by climate change (64.5%),
household consumption (49.7%), residential development (41.3%), industrial activity (17.5%), other
(12.1%) and agricultural irrigation (6.1%). The “other” responses were coded and sorted into categories
such as land use changes, recreation, fish farms, tourism, and seasonal residents (Figure 12).
Page | 11Resident Water Survey, Chester 2020
Figure 12. Participant opinions on the top three factors influencing water quantity in their communities.
Perceived threats to water quantity were also divided and examined based on District. There seemed to
be a consensus across all of the Districts about the main water quantity threats. Climate change and
drought were listed as the top concerns in each of the Districts, followed either by residential
development or household consumption (Table 3).
Table 3. Percentages indicating respondents perceived primary (gold), secondary (green), and tertiary (grey) threats to water
quantity in each District. Percentages (including % skipped) sum to 300 as respondents could choose up to three options.
Climate Residential Agricultural Household
Drought Industrial
District Change Develop- Irrigation Consump- Other (%)
(%) Activity (%)
(%) ment (%) (%) tion (%)
1
62.8 65.1 41.3 23.8 6.4 45.9 10.5
n = 172
2
54.1 64.0 48.2 17.3 5.8 50.4 7.91
n = 139
3
53.0 67.4 51.5 15.9 4.4 50.4 13.7
n = 270
4
68.0 73.0 35.4 20.8 6.2 46.1 7.3
n = 178
5
58.0 69.2 30.1 11.2 2.1 47.4 14.0
n = 143
6
70.7 63.9 27.1 10.5 13.5 47.4 1.6
n = 133
7
68.4 67.3 32.7 15.3 7.1 51.0 11.2
n = 98
DK
51.7 48.3 36.8 16.1 8.0 39.1 11.5
n = 87
Page | 12Resident Water Survey, Chester 2020
In an open-ended question, participants were asked to identify freshwater bodies within the Municipality
which they were concerned about with a brief explanation as to why. This question was skipped by 65%
of survey participants. It is unclear if this was due to not having any concerns about freshwater bodies,
or if it can be attributed to a general lack of knowledge about water quality and quantity in the area. Both
statements are likely true as within the responses, 157 participants (12.9% of all survey participants)
stated they were not concerned, or their answers were not applicable to freshwater bodies in the survey
area. Twenty-six (2.1%) respondents also stated they did not have enough knowledge to answer the
question. Seventy-three respondents (6.0%) provided general comments over concerns such as
deforestation, road salt, development, sewage systems, algae blooms, and industrial runoff, but did not
specify what systems they were concerned about.
The number of times each water body was mentioned was tallied. Water bodies of concern were then
separated into three different categories: Low concern (1-7 mentions), medium (8-14 mentions) and high
concern (>15 mentions). Stanford Lake, Gold River, and Fox Point Lake were rated as high concern.
Sherbrooke Lake, East River Watershed, Bayswater Pond, Middle River, and Spectacle Lake were areas of
medium concern (Figures 13 & 14). Over 40 freshwater bodies in total were mentioned in the responses
to this question, including but not limited to: Millett Lake, Hutt Lake, Harris Lake, Martin’s River,
Dauphinees Mill Lake, Little Vaughn Lake, Goat Lake, Wallaback Lake and Lake Ramsay, which were all
mentioned more than once.
The main concerns at Stanford Lake were varied, but included sedimentation, development, and pollution
from infilling of wetlands, road salt, and garbage such as old cars in the lake. The concerns within the
Gold River Watershed were mainly related to water acidity, lack of suitable fish habitat, and untreated
sewage. Excess nutrients and declining water quality due to the new golf course and housing
developments were the largest concerns surrounding Fox Point Lake.
Concerns on Sherbrooke Lake were primarily centered around algal blooms, and residential and park
development. In the East River Watershed, the primary concerns were industries that use the water,
pollution, and runoff from roads. At Bayswater Pond, many noted that the beach is often closed during
the summer due to pollution and possible E. coli in the pond. In Middle River, residents were concerned
about overdevelopment and a lack of riparian buffers, along with pollution and contaminants such as lead
and arsenic. Finally, Spectacle Lake was listed as an area of concern, mainly due to its watershed area
designation, along with development and recreational uses of the lake.
Page | 13Resident Water Survey, Chester 2020
Figure 14. Map showing water bodies of medium and high concern in Figure 13. Map showing water bodies of medium and high concern in
the Municipality; including Sherbrooke Lake (medium) Gold River the Municipality; including Middle River (medium), Stanford Lake
(high) and Middle River (medium). (high), Spectacle Lake (high), East River Watershed (medium), Fox
Point Lake (high), and Bayswater Pond (medium).
3.4 Level of Concern
Participants were asked to choose the top three parties they viewed as most responsible for managing
both water quality and quantity issues in their area. Out of the 1,143 participants who answered the
question, the findings revealed that the top three parties were the Municipal Government (82.9%), the
Provincial Government (74.5%), and citizens (54.9%). This was followed by the Federal Government,
watershed groups, industry, First Nations Council, and ‘other’. ‘Other’ responses were coded and tallied.
Most responses fit into the above categories, with participants answering “myself”, or listing a branch of
government. Others did not know or said no one was responsible, and several indicated that homeowners
specifically were responsible for water quality and quantity within the Municipality (Figure 15). The top
three parties responsible did not vary by District.
Page | 14Resident Water Survey, Chester 2020
Figure 15. Parties most responsible for managing quality and quantity of water in the Municipality of Chester.
Following identification of responsible groups, participants were asked to rank each of the groups above
on how well they fulfill their responsibility in managing water resources. Each party was ranked on a scale
from poorly (1) to well (3) with a don’t know (4) option. There was a great level of uncertainty among the
rankings for all groups and large percentages of respondents skipped these questions or answered that
they did not know (Table 4). The median rank for all the groups was two (adequate), possibly indicating
that respondents did not have a strong opinion either way.
Table 4. Analysis showing participant views on how well each party fulfills their water managing responsibility on a survey wide
scale. The median response in all cases was 2 (adequate).
Standard % Don’t %
Scale Range Mean Rank Median
Deviation Know Skipped
Poorly (1) to 1.63 2 0.66
Industry 53.5 20.8
Well (3)
Poorly (1) to 2.03 0.69
Citizens 2 32.0 16.4
Well (3)
First Nation’s Poorly (1) to 1.85 0.71
2 77.7 25.7
Council Well (3)
Municipal Poorly (1) to 1.79 2 0.68
34.0 14.7
Government Well (3)
Provincial Poorly (1) to 1.70 2 0.67
40.7 14.1
Government Well (3)
Federal Poorly (1) to 1.63 0.65
2 54.2 18.3
Government Well (3)
Watershed Poorly (1) to well 2.17 0.73
2 64.1 22.9
Groups (3)
Page | 15Resident Water Survey, Chester 2020
800
700
Number of Responses
600
500
400
300
200
100
0
Industry Citizens First Nations Municipal Provincial Federal Watershed
Council Government Government Government Groups
Group
Poorly Adequate Well Don't know
Figure 16. Graphical representation of respondent’s views on performance of each party managing water resources.
Views on how well each group fulfills their water quality roles was broken down and examined by District.
A Kruskal-Wallis test was performed to compare views on how well the Municipality performs across each
District using an alpha of 0.05, which found there is a significant difference in views between the Districts
(p=1.52e-08). Post hoc testing was completed with a Dunn test and Bonferroni correction, which showed
that the differences lie between District Three and One, Two, Four, Five and Six (p=4.03e-6, p=1.94e-6,
p=3.11e-4, p=1.04e-5, p=3.82e-4). Although the median value for each District is two (adequate), Figure
17 shows that District Three has a much larger proportion of respondents who rated the Municipality’s
performance as 1 (poor).
Page | 16Resident Water Survey, Chester 2020
120
100
Number of Respondents
80
60 Poorly
40 Adequate
Well
20
Don't Know
0
District
Figure 17. Each District's perception of the Municipal Government’s performance managing water quality and quantity.
The performance of the Provincial Government was also examined using a Kruskal-Wallis test. Again,
there was a significant difference detected between the Districts (p=0.016). Post hoc testing with a Dunn
test and Bonferroni correction indicated that the only place this difference in views was significant was
between District One and District Three (p=0.034). District One had a relatively high proportion of
respondents rating the Provincial Government’s performance as adequate (2), as compared to District
Three, which predominantly rated their performance poorly (1). Across all Districts, a ranking of three or
“well” was the least chosen option (Figure 18).
100
90
Number of Respondents
80
70
60
50
40
30
20
10
0
Unknown One Two Three Four Five Six Seven
District
Poorly Adequate Well Don't Know
Figure 18. Each District's perception of the Provincial Government's performance managing water quality and quantity.
Finally, the third group that was compared across the Districts was citizens, as they were ranked as third-
most responsible overall for managing water within the Municipality. A Kruskal-Wallis test was used for
comparison purposes. Again, there was a significant difference detected between the Districts (p=0.01).
Page | 17Resident Water Survey, Chester 2020
Post hoc testing with a Dunn test and Bonferroni correction indicated that the differences were between
District Two and Three (p=0.027) and Three and Four (p=0.04). The most common ranking provided by
District Three respondents was adequate (2). Both Districts Two and Four had large proportions of
respondents agree that citizens fulfill their responsibility adequately; however, there was less certainty,
with more don’t know (4) responses (Figure 19).
100
90
Number of Respondents
80
70
60
50
40
30
20
10
0
Unknown One Two Three Four Five Six Seven
District
Poorly Adequate Well Don't Know
Figure 19. Each District's perception of citizen's performance managing water quality and quantity.
3.5 Water Conservation & Healthy Water Practices
Coastal Action was provided with the Municipality of Chester’s Dry Well Inventory which has tracked
reports of wells with water shortages since 2016. These wells are catalogued with resident’s addresses,
associated community, year, and type of well. These data were then compared against the results of dry
well reports in the questionnaire. In total, 1,193 participants answered the question about their water
quantity, of which, 347 (29.1%) indicated they had experienced a water shortage at their current
residence. Two-hundred seventy of these shortages have taken place since 2014. Of those, only 42
(15.6%) had reported the shortages to the Municipal Dry Well Inventory (Table 5). Water shortages in the
survey were compiled from 2014 onward and the Dry Well Inventory began in 2016.
The percentage of drilled wells that had shortages were also much larger in reports from the survey as
opposed to the inventory. A Two Proportions z test was completed and found that there was a highly
significant difference between the number of drilled wells reported to the survey versus reported to the
inventory (p = 0.0008) at a 95% confidence interval.
Page | 18Resident Water Survey, Chester 2020
Table 5. Comparison of well number and well type with shortages reported to the Municipal Dry Well Inventory versus the
survey after 2014.
# Wells # Wells reported # Wells not Dug Other
Drilled
reported after to survey and reported to wells water
wells (%)
2014 inventory inventory (%) sources (%)
Survey 270 42 228 26.6 69.6 3.7
Dry Well
252 42 - 6.0 91.7 2.4
Inventory
Participants were asked to indicate when water shortages occurred. Of the respondents who had
shortages, 14.5% indicated they took place over more than one of the time periods, meaning they
persisted over multiple years. In addition to this, the highest occurrences of water shortages (43.9%) took
place between 2017 and 2019. Unsurprisingly, most wells went dry during the summer season (85.7%),
although nearly 20% of respondents reported shortages over one or more seasons of the year and 2%
reported year-round shortages (Figure 20).
160
140
Number of Respondents
120
100
80
60
40
20
0
Currently < 1 year ago 1 -3 years ago 4 -6 years ago > 6 years ago
Time of Water Shortage
Figure 20. Occurrences of water shortages in the Municipality.
Reported water shortages in the survey (after 2014) and inventory were separated into communities and
mapped based on the number reported (Figures 21 & 22). For both the inventory and survey, Chester
and Chester Basin have high frequencies (>26) of dry wells reported, and the inventory reported Western
Shore in this high frequency category as well. In the medium frequency category (11-25 reports), the
inventory identifies the communities of Marriott’s Cove and Gold River. The survey includes these
communities and in addition reports New Ross and East Chester as also falling into the medium category.
Communities reporting low frequencies (1-10 reports) include Forties, New Ross, Beech Hill, Chester
Grant, Windsor Road, East River, East Chester, East River Point, Simms Settlement, Fox Point, Hubbards,
Page | 19Resident Water Survey, Chester 2020
Mill Cove, Aspotogan, and Blandford. The survey includes all of these communities with the exception of
Beech Hill and East River Point, while also identifying new reports from Bayswater, Northwest Cove,
Martins River and Martins Point, which were not included in the inventory data.
Figure 21. Map of the Municipality showing location and number of Figure 22. Map of the Municipality showing location and number of
water shortages reported to the water survey since 2014. water shortages reported to the Dry Well Inventory since 2016.
Survey participants were asked if and how often they tested their water, both for bacterial and chemical
contamination. Most residents (66.6%) answered “yes” they do test their water for bacteria, where 33.4%
said they do not. Approximately half tested for bacteria every 13 months to five years (45.6%), with 19.8%
and 18.8% testing every six to 14 months and every six to 10 years, respectively. Few participants met
the recommended Nova Scotia guideline for bacteria testing every six months (4.3%). Likewise, a minority
of respondents (11.5%) tested their water more than 10 years ago (Figure 23). The response rate for both
questions was high, with very few participants skipping them.
Page | 20Resident Water Survey, Chester 2020
400
350
Number of Respondents
300
250
200
150
100
50
0
Every 6 months Every 6 - 14 Every 13 Every 6 - 10 Over 10 years
or less months months - 5 years ago
years
Frequency of Water Testing for Bacteria
Figure 23. Frequency of water supply testing for bacteria (fecal coliforms and E. Coli) among 66% of participants who indicated
they test their water for bacteria.
Chemicals such as arsenic, uranium, lead, nitrate, nitrite, and fluoride were tested for on a much smaller
scale than bacteria. Just over half of respondents said they tested for chemicals, whereas the remaining
49.2% did not. This is also representative of most survey participants, as only 2.7% of the overall
respondents skipped this question. The most common frequency of chemical testing was every 25 months
to five years (37.8%) followed by every 12- 24 months (27.4%). Nineteen percent and 15.8% tested their
water every six to 10 years and over 10 years ago, respectively (Figure 24).
250
Number of Respondents
200
150
100
50
0
Ever 12 - 24 Every 25 months to Every 6 - 10 years Over 10 years ago
months 5 years
Frequency for testing for Chemicals
Figure 24. Frequency of water supply testing for common chemicals (arsenic, uranium, lead, nitrate, nitrite, and fluoride) among
just over 50% of participants who indicated they test their water for chemicals.
Page | 21Resident Water Survey, Chester 2020
Percentages of respondents who do not test their water, or test it infrequently (regular testing occurring
only every six years or less) were compiled and examined on the District level, which shows larger
percentages of respondents that do not test their water regularly for bacteria or chemicals across all
Districts (Table 6). Percentages of absent and infrequent testing for bacteria ranged from 43.7% in District
Three to 62.4% in District Six, with all others falling in between. Percentages of absent and infrequent
testing for chemicals were higher, ranging from 56.7% in District Three to 76.7% in District Six. In both
cases, District Six has the highest rates of infrequent testing and Districts Three, Two, and One have the
lowest. In almost every case, less than 50% of respondents in each District are meeting provincial
recommendations for bacterial and chemical testing.
Table 6. Proportions of absent (respondents that indicated they do not test) and infrequent (testing every six years or less)
resident water testing based on District.
Absent and infrequent bacteria testing Absent and infrequent chemical testing
District
(%) (%)
One 50.6 66.8
Two 52.5 59.0
Three 43.7 56.7
Four 55.1 68.5
Five 52.4 67.1
Six 62.4 76.7
Seven 53.1 69.4
Unknown 56.3 62.1
Barriers to testing were examined for those respondents that indicated they did not test their water for
chemicals and/or bacteria. Nearly 500 respondents listed barriers, along with factors that would make
them consider testing their water. Participants were invited to select all answers that apply and the most
common reason why they did not test their water was that they did not feel they had to (38.3%). This
was followed by the expense of water testing (33.6%), and other reasons (20.8%). The “other” responses
were quite varied, but included barriers such as: water was tested when home was purchased; landlord’s
responsibility; water is treated; water is not consumed; have never gotten sick from drinking water; the
water seems fine; haven’t thought of it; don’t know what to do with a poor result; and can’t get samples
to the lab. Following these responses was respondents not wanting to know what is in their water (18.5%)
and not knowing what to test for (18.5%) (Figure 25).
Page | 22You can also read