The Quality of Stored Rainwater for Washing Purposes - MDPI

Page created by Mildred Holmes
 
CONTINUE READING
The Quality of Stored Rainwater for Washing Purposes - MDPI
water
Article
The Quality of Stored Rainwater for
Washing Purposes
Joanna Struk-Sokołowska 1, *, Joanna Gwoździej-Mazur 2 , Piotr Jadwiszczak 3 ,
Andrzej Butarewicz 4 , Piotr Ofman 1 , Marcin Wdowikowski 5 and Bartosz Kaźmierczak 6
 1   Department of Environmental Engineering Technology, Faculty of Civil Engineering and Environmental
     Sciences, Bialystok University of Technology, 15-351 Bialystok, Poland; p.ofman@pb.edu.pl
 2   Department of Water Supply and Sewerage Systems, Faculty of Civil Engineering and Environmental
     Sciences, Bialystok University of Technology, 15-351 Bialystok, Poland; j.mazur@pb.edu.pl
 3   Department of Air Conditioning, Heating, Gas Engineering and Air Protection, Faculty of Environmental
     Engineering, Wroclaw University of Science and Technology, 50-370 Wroclaw, Poland;
     piotr.jadwiszczak@pwr.edu.pl
 4   Department of Chemistry, Biology and Biotechnology, Faculty of Civil Engineering and Environmental
     Sciences, Bialystok University of Technology, 15-351 Bialystok, Poland; a.butarewicz@pb.edu.pl
 5   Institute of Meteorology and Water Management-National Research Institute, 01-673 Warsaw, Poland;
     marcin.wdowikowski@imgw.pl
 6   Department of Water Supply and Sewerage Systems, Faculty of Environmental Engineering,
     Wroclaw University of Science and Technology, 50-370 Wroclaw, Poland; bartosz.kazmierczak@pwr.edu.pl
 *   Correspondence: j.struk@pb.edu.pl
                                                                                                   
 Received: 18 November 2019; Accepted: 14 January 2020; Published: 16 January 2020                 

 Abstract: The use of rainwater for washing clothes is determined by its amount, composition and
 quality of washing. Raw rainwater is soft and free of pollution. The collected rainwater already
 contains pollution present in the atmosphere and washed away from roofs and other surfaces. It can
 also change its quality when stored in tanks. Washing clothes does not require drinking quality
 water but just clean, safe water that guarantees effective removal of dirt from fabrics. The study
 determined the physicochemical and microbiological changes of rainwater characteristics during
 retention. Rainwater was collected in a standard underground tank for 30 days and water analyses
 were conducted every 10 days. The possibility of tap water replacement in the household with
 collected rainwater for ecological clothes washing has been assessed.

 Keywords: stored rainwater; RWH system; washing; retention; physicochemical and microbiological
 changes; Varimax

1. Introduction
     Drinking water resources are under increased pressure due to rising water demand, growing
population, progressive urbanization, pollution and overexploitation of water bodies. To secure
sufficient drinking water, new strategies of protection and prudent and rational use of water
are promoted and developed, including sustainable rainwater harvesting (RWH) [1]. The RWH
is an alternative, widely available, ecological and beneficial source of fresh water suitable for an entire
range of uses and areas [2]. Rainwater harvesting increases water self-sufficiency and delays the need
to build new centralized water infrastructure [3–5]. Globally implemented RWH systems could cover
up to 90% of household water consumption [6] and the RWH plays a critical role in solving the world’s
problem of increased water stress [7,8]. Also, these systems can be useful in the reduction of flood risk
in urban areas [9,10]. Many countries created legal and economic conditions to support or enforce the
use of RWH as part of climate, environmental and social policies [11,12]. Next to the implementation

Water 2020, 12, 252; doi:10.3390/w12010252                                       www.mdpi.com/journal/water
The Quality of Stored Rainwater for Washing Purposes - MDPI
Water 2020, 12, 252                                                                                                                      2 of 17

project and design solutions, the support programs, grants and subsidies significantly and positively
affect the system’s economic profitability [13–15].
      Water 2019, 11, x FOR PEER REVIEW                                                                                             2 of 16
      The prevalence of RWH systems and the use of rainwater in European countries is varied. In the
UK, storage     of rainwater
      implementation         projectfor home     use is popular
                                         and design        solutions,and thehas    a long programs,
                                                                                support       tradition [16].      In Germany,
                                                                                                              grants    and subsidies one third
of allsignificantly
       new buildings         use   rainwater      for   household     purposes        through
                       and positively affect the system’s economic profitability [13–15].           local   government         subsidies     [17].
Similarly, The
             Spain    has launched
                 prevalence      of RWH   a national
                                             systems andprogram
                                                             the useofofsubsidies
                                                                          rainwaterfor   in RWH
                                                                                             European in new    buildings
                                                                                                           countries          [18].InInthe
                                                                                                                       is varied.        France,
a tax UK,
       reduction
           storagehas      been implemented
                      of rainwater     for home useto       encourage
                                                         is popular  andthe has use
                                                                                 a longof tradition
                                                                                            rainwater       [19].
                                                                                                        [16].      To promote
                                                                                                               In Germany,      one rainwater
                                                                                                                                     third
      of all new
harvesting          buildings use rainwater
              as complementary                      for household
                                          technology,                 purposes
                                                           Italy issued    technicalthrough      local government
                                                                                          guidelines      for RWH [20].  subsidies    [17]. price
                                                                                                                               The high
      Similarly,    Spain   has   launched     a  national    program     of  subsidies     for   RWH
of drinking water has increased the popularity of rainwater systems in Austria, Sweden, Switzerland,      in  new   buildings     [18].  In
      France,  a   tax  reduction
Belgium and Denmark [21–23].          has   been   implemented      to  encourage       the   use   of rainwater     [19].  To  promote
      rainwater harvesting as complementary technology, Italy issued technical guidelines for RWH [20].
      A typical RWH system consists of the concentration, collection, and storage of rainwater for
      The high price of drinking water has increased the popularity of rainwater systems in Austria,
use on   site and reduction of drinking water consumption from centrally supplied sources. In urban
      Sweden, Switzerland, Belgium and Denmark [21–23].
areas rainwater
            A typical canRWHbe collected       from of
                                 system consists       impervious      surfaces
                                                          the concentration,          such asand
                                                                                  collection,      roofs,   terraces
                                                                                                        storage         or courtyards
                                                                                                                  of rainwater     for use [24].
Harvested      water
      on site and        is stored
                     reduction         in above
                                   of drinking        or underground
                                                  water    consumption from    tanks     with supplied
                                                                                   centrally      capacities      designed
                                                                                                              sources.          according
                                                                                                                         In urban    areas to
waterrainwater
        demand can   [6,25].   Closed tanks
                          be collected      from minimize
                                                    imperviousthe    risk of such
                                                                   surfaces      contamination           from environment,
                                                                                        as roofs, terraces        or courtyards people[24]. or
      Harvested     water   is stored   in  above   or  underground      tanks   with   capacities
animals, prevent growth of algae and reduce mosquito breeding. A system of gutters, downpipes,         designed    according     to water
flushdemand
       diverters, [6,25].  Closed
                      debris          tanks
                                screens        minimize
                                             and             the riskthe
                                                   filters supply       of runoff
                                                                             contamination
                                                                                       to the tank fromduring
                                                                                                           environment,
                                                                                                                    downpour. peopleSeparate
                                                                                                                                         or
pumpanimals,     preventnetwork
        and pipeline         growth of      algae and
                                         supplies         reduce mosquito
                                                      rainwater    from the breeding.
                                                                                 tank to devicesA system  andoftaps
                                                                                                                 gutters,
                                                                                                                      in thedownpipes,
                                                                                                                                house [13,26].
      flush diverters, debris screens and filters supply the runoff to the tank during downpour. Separate
      In households, rainwater can be used for toilet flushing, washing, irrigation, cleaning, car washing
      pump and pipeline network supplies rainwater from the tank to devices and taps in the house [13,26].
and more. In the absence of rainwater, quality standards for household drinking and bathing water
            In households, rainwater can be used for toilet flushing, washing, irrigation, cleaning, car
quality   regulations apply in many countries [27–30]. Rainwater meeting the drinking water quality
      washing and more. In the absence of rainwater, quality standards for household drinking and
can fully   replace
      bathing   watertap      water
                         quality        in households.
                                    regulations                Bathing
                                                    apply in many          water[27–30].
                                                                      countries       qualityRainwater
                                                                                                  rainwatermeetingis suitable     for laundry
                                                                                                                           the drinking
washing,    toilet   flushing,     garden     watering      and   car washing        or   other    cleaning
      water quality can fully replace tap water in households. Bathing water quality rainwater is suitable       activities.    The   structure
of water   demand
      for laundry        (Figuretoilet
                      washing,       1) indicates
                                           flushing,that     up to
                                                        garden      60% ofand
                                                                 watering       domestic       waterorcan
                                                                                     car washing               be replaced
                                                                                                           other                with bathing
                                                                                                                   cleaning activities.
waterThe   structure
        quality         of waterwithout
                   rainwater         demandany  (Figure   1) indicates that
                                                     inconvenience              up to 60% of domestic
                                                                          to inhabitants.          Laundrywater        can be about
                                                                                                                 consumes       replaced 15% of
      with bathingwater
total household         waterdemand
                                quality rainwater        without any
                                            and replacement             inconvenience
                                                                   of hard     tap waterto     byinhabitants.
                                                                                                    soft rainwaterLaundry     consumes
                                                                                                                        is environmentally
      about [15].
beneficial    15% of    total household
                      Rainwater       has awater
                                               very demand       and replacement
                                                       low hardness        which prevents of hard tap     water by
                                                                                                     limescale     insoft   rainwater
                                                                                                                       washing            is
                                                                                                                                     machines
      environmentally beneficial [15]. Rainwater has a very low hardness which prevents limescale in
and reduces detergent consumption. This increases the life of washing machines and the energy
      washing machines and reduces detergent consumption. This increases the life of washing machines
consumption for heating remains constant for years. Less detergent means less pollution of both
      and the energy consumption for heating remains constant for years. Less detergent means less
the wastewater        treatment plant and the environment and less detergent residue in clothes which is
      pollution of both the wastewater treatment plant and the environment and less detergent residue in
particularly    beneficial     for allergy
      clothes which is particularly             sufferers.
                                             beneficial   for allergy sufferers.

           Figure
        Figure    1. Matrix
               1. Matrix  ofofwater
                               waterusage
                                     usage and
                                           and allowed
                                               allowedwater
                                                       waterquality
                                                             qualityin in
                                                                       household needs
                                                                          household    [13,14,17,18,28–30].
                                                                                    needs   [13,14,17,18,28–30].
The Quality of Stored Rainwater for Washing Purposes - MDPI
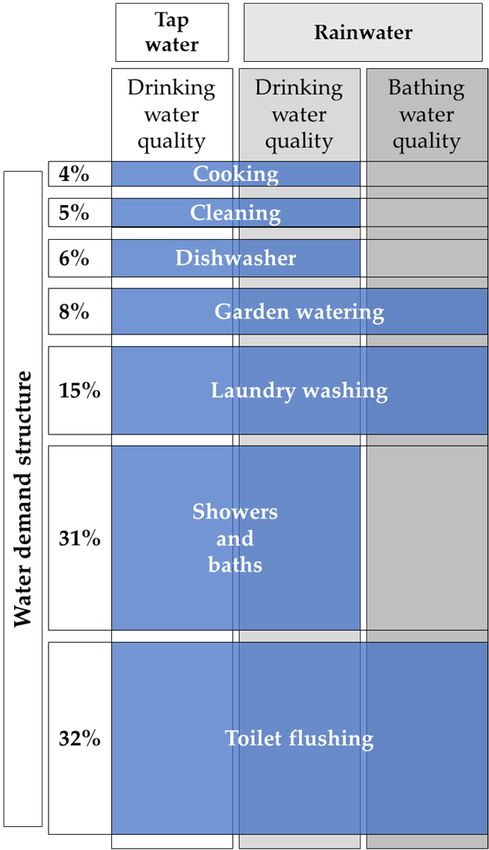
Water 2020, 12, 252                                                                                                               3 of 17
Water 2019, 11, x FOR PEER REVIEW                                                                                                 3 of 16
Water 2019, 11, x FOR PEER REVIEW                                                                                                3 of 16
       It
       It is
          is very
             very convenient
                   convenient toto use
                                   use rainwater
                                         rainwater in in automatic
                                                         automatic washing
                                                                        washing machines
                                                                                  machines as as in
                                                                                                 in one
                                                                                                     one average
                                                                                                         average cycle
                                                                                                                    cycle the
                                                                                                                           the
 washing
 washing     machine
      It is very
             machine    consumes
                  convenient   to use
                        consumes     30 to  90 L.
                                     30rainwater   Automatic
                                                     in automatic
                                         to 90 L. Automatic       washing
                                                                       washing
                                                                  washing     does not  require
                                                                                 machines
                                                                              does                drinking
                                                                                             as indrinking
                                                                                   not require               water
                                                                                                    one average
                                                                                                              water   quality
                                                                                                                   cycle  the
                                                                                                                      quality
 but
 but physicochemical
      physicochemical
washing                   and
                           and microbiological
             machine consumes   microbiological      standards
                                                     standards
                                    30 to 90 L. Automatic          of
                                                                   of bathing
                                                                       bathing
                                                                 washing        water.
                                                                             doeswater. The
                                                                                        The use
                                                                                  not require     of
                                                                                                   of rainwater
                                                                                              usedrinking
                                                                                                      rainwater
                                                                                                             waterinstead
                                                                                                                  instead
                                                                                                                     qualityof
                                                                                                                            of
 tap
but  water
      watershould
               shouldprovide
 tapphysicochemical             users
                                  userswith
                                          witha agood
                          and microbiological
                        provide                         quality
                                                    standards
                                                   good    qualityeffect.
                                                                  of       Unpleasant
                                                                      bathing
                                                                     effect.             smell
                                                                                water. The
                                                                              Unpleasant     useorofor
                                                                                            smell   color, andand
                                                                                                     rainwater
                                                                                                       color,   residues
                                                                                                                 instead   on
                                                                                                                           of
                                                                                                                     residues
 cleaned
tap
 on water
     cleanedand   washed
              should
                 and      items
                       provide
                     washed       would
                                 users
                              items        discourage
                                         with
                                       would   adiscourageusers
                                                  good quality    from
                                                               users     using
                                                                    effect.
                                                                       from     rainwater.
                                                                            Unpleasant
                                                                              using        smell or color, and residues
                                                                                    rainwater.
       The
       The requirements
on cleaned      and washedfor
              requirements       collected
                             items
                              for     wouldrainwater
                                   collected   discourage
                                                rainwater for users
                                                              washing from
                                                              for washing purposes
                                                                             using   can becan
                                                                                   rainwater.
                                                                                purposes     defined    using three
                                                                                                 be defined     usinggroups
                                                                                                                        three
 of factors:   proper
      Theofrequirements
 groups                tank size, quality
                             fortank
               factors: proper    collected and   safety
                                               rainwater
                                       size, quality      of accumulated
                                                             for washing
                                                       and safety             rainwater   and  washing
                                                                               purposesrainwater
                                                                      of accumulated       can be defined  quality  based
                                                                                                              usingquality
                                                                                                      and washing          on
                                                                                                                       three
 outcome,
groups
 based on     results
          of factors:
              outcome,and  users’
                      proper   tank
                         results   satisfaction
                                  and size, quality
                                        users'     (Figure   2).(Figure
                                                      and safety
                                                satisfaction        of accumulated
                                                                          2).          rainwater and washing quality
based on outcome, results and users' satisfaction (Figure 2).

                      Figure 2. Three factors of stored rainwater suitability  for washing  purposes.
                      Figure  2. Three factors of stored rainwater
                       Figure 2.                         rainwater suitability
                                                                   suitability for
                                                                                for washing
                                                                                    washing purposes.
                                                                                             purposes.

      The
       The qualityand   andpollution
                             pollution     of harvested      rainwater      depends       on the environment,          location,
       The quality
            quality and       pollutionof harvested    rainwater
                                            of harvested            depends
                                                               rainwater         on the environment,
                                                                             depends                        location, collection
                                                                                           on the environment,          location,
collection
 surface    surface
          and   the RWH and the    RWH      systemFor[31–35].    For the purposes          of thisthree
                                                                                                    analysis    three   areas of
 collection  surface     and system
                               the RWH  [31–35].          the purposes
                                             system [31–35].      For the of      this analysis
                                                                              purposes                     areas
                                                                                            of this analysis       of rainwater
                                                                                                                 three   areas of
rainwater   contamination
 contamination       have been  have   been identified
                                   identified   (Figure (Figure
                                                            3).  In 3).
                                                                    the  Infirst
                                                                             the one
                                                                                   first one rainwater getsgets  contaminated
 rainwater contamination         have   been identified     (Figure   3). In  the firstrainwater
                                                                                          one rainwater      contaminated
                                                                                                            gets  contaminated by
by  assimilating
 assimilating   air air  pollutants
                    pollutants   (“1” (“1”
                                       on    on Figure
                                            Figure 3), in3),
                                                           theinsecond
                                                                 the second
                                                                         one   itone   it washes
                                                                                   washes   dirt    dirt from
                                                                                                  away    awaythefrom
                                                                                                                    roofthe  roof
                                                                                                                          (“2” on
 by assimilating air pollutants (“1” on Figure 3), in the second one it washes dirt away from the roof
(“2”  on Figure
 Figure     and 3)    and in  the third changes
                                              occuroccur     during   storage     of rainwater    in the  tank  (“3”
                                                                                                                   onon   Figure
 (“2” on3)Figure   in
                    3) the
                       andthird
                            in thechanges
                                    third changes    during
                                                     occur      storage
                                                              during       of rainwater
                                                                       storage               in the
                                                                                   of rainwater    in tank   (“3”
                                                                                                      the tank   (“3”  Figure  3).
                                                                                                                       on Figure
3). Combination
 Combination         of  changes
                  of changes       in
                                in thethe  quality
                                        quality     of  rainwater
                                                 of rainwater        in these
                                                                  in these       three
                                                                              three      areas
                                                                                      areas    impact
                                                                                             impact       the
                                                                                                       thethe quality
                                                                                                            quality     of water
                                                                                                                     of water   at
 3). Combination      of changes    in the  quality  of rainwater     in these     three  areas  impact        quality   of water
at the
 the    point
     point  of of
               useuse   (“4”
                     (“4”  onon  Figure
                               Figure     3).
                                        3).
 at the point of use (“4” on Figure 3).

                         Figure 3. Schematic representation of rainwater harvesting for washing.
                        Figure
                         Figure3.3.Schematic
                                    Schematicrepresentation
                                              representationof
                                                             ofrainwater
                                                                rainwaterharvesting
                                                                          harvestingfor
                                                                                     forwashing.
                                                                                        washing.
         The level of water pollution in the first area is affected by local air pollution and time of year. It
  is anThearealevel
         The         of
                      of water
                         water pollution
                independent
               level              of RWH solutions  first
                                            in the first  area
                                                        and
                                                          area   isis affected
                                                              should  affected   bylocal
                                                                          be treated
                                                                                by  local   aair
                                                                                       as air    pollutionand
                                                                                              characteristic
                                                                                                pollution    and   atime
                                                                                                               oftime    ofofyear.
                                                                                                                      given    year.It Itis
                                                                                                                              location
isananarea
  [33].  area  independent
         In independent
            the   second area,of of RWH
                                  the
                                 RWH      solutions
                                      runoff           and
                                              assimilates
                                        solutions  and       should  be be
                                                             all pollution
                                                         should             treated
                                                                                  as aascharacteristic
                                                                               present
                                                                         treated          aoncharacteristic
                                                                                                         of aof  a given
                                                                                               the roof, including
                                                                                                               given         location
                                                                                                                       precipitation
                                                                                                                        location   [33].
[33].
  (i.e.,
 In  theInwet
           thedeposition),
           secondsecond   area,
                      area,      the runoff
                             theatmospheric
                                  runoff     assimilates allall
                                                deposition
                                          assimilates           pollution
                                                                (i.e.,
                                                              pollution       presenton
                                                                         drypresent
                                                                              deposition)onthethe
                                                                                               androof,
                                                                                                    materials
                                                                                                  roof, includingused precipitation
                                                                                                                          in the roof
                                                                                                                       precipitation
(i.e.,  wet
         wet deposition),
  construction.
 (i.e.,                        atmospheric
                     [13,26]. In
                deposition),       urban areas,
                                atmospheric    deposition
                                                  roofs are (i.e.,
                                                deposition      (i.e.,drydry deposition)
                                                                contaminated                  and
                                                                                               andmaterials
                                                                                   with wind-blown
                                                                             deposition)                    dirtused
                                                                                                    materials            in
                                                                                                                          in the
                                                                                                                  including
                                                                                                                 used             roof
                                                                                                                              theheavy
                                                                                                                                   roof
  metals and nutrias,
construction.
 construction.      [13,26].lichens
                     [13,26]. In
                               Inurbanandareas,
                                   urban   mosses,
                                          areas,     fungus,
                                                 roofs
                                                  roofs  are     fecal droppings
                                                          are contaminated
                                                               contaminated       with
                                                                                   withfrom    birds and dirt
                                                                                           wind-blown
                                                                                           wind-blown      other    animals, heavy
                                                                                                           dirtincluding
                                                                                                                 including      insects
                                                                                                                                 heavy
metals     and or
  and litter,     nutrias,
                    fallen lichens
                            organicand    mosses,
                                      matter  fromfungus,      fecal droppings
                                                     the surroundings                from birds
                                                                               trees pollute     the and
                                                                                                     waterother
                                                                                                             [36].animals,     insects
                                                                                                                     Metal roofs     are
and    litter,for
  suitable      or fallen  organicofmatter
                   high quality              from rainwater—high
                                       harvested    the surroundingstemperature
                                                                              trees polluteand  the water  [36]. Metal
                                                                                                    ultraviolet             roofs are
                                                                                                                   light effectively
suitable for high quality of harvested rainwater—high temperature and ultraviolet light effectively
Water 2020, 12, 252                                                                                4 of 17

metals and nutrias, lichens and mosses, fungus, fecal droppings from birds and other animals, insects
and litter, or fallen organic matter from the surroundings trees pollute the water [36]. Metal roofs are
suitable for high quality of harvested rainwater—high temperature and ultraviolet light effectively
and naturally disinfect the rooftop surface. To maintain a high quality of collected rainwater a regular
cleaning of catchment areas and storage tanks is required [33]. Literature review reveals that rainwater
is highly variable in the quality and quantity of contaminants and microorganisms [33,37].

2. Materials and Methods
     The aim of the study is to evaluate the possibility of using rainwater for washing in areas
considered as being particularly clean in Europe, like north-west Poland. The analyses were conducted
in 2017 (August–November) using standard RWH in single family house located in the suburbs of
Bialystok, a city with a population of 300,000, elevated 160 m above the sea level. This new housing
estate is surrounded by arable fields and forests, connected to the city by a national road. There is no
heavy industry and noxious emitters of air pollution in the area. Only light industry plants are located
in Bialystok city such as electromechanical, electrotechnical, food and textile.
     Investigated rainwater was collected from 110 m2 tiled cement rooftop by the standard rainwater
harvesting system for residential purposes. The RWH system is built of PVC gutters, underground PE
tank with a volume of 1.7 m3 and automatic pump with a floating extractor. Gutter top screens, sloped
debris screen and first flush diverter were used to supply the clean runoff to the tank. Tightly closed
underground PE tank, covered with 50 cm of soil, protects water against secondary contamination,
eliminates sunlight operation and stabilizes the storage temperature.
     The study determined the physicochemical and microbiological changes of rainwater quality
during retention in a tank for 30 days. The analyses were conducted every 10 days (4 times in the
research cycle). To assess the quality of stored rainwater for washing purposes the characteristics were
benchmarked against Polish drinking water standards (DWS) [38], World Health Organisation (WHO)
Guidelines [39], EU Drinking Water Directive (DWD) [29] and EU Bathing Water Directive (BWD) [30].
     An analysis of meteorological conditions was performed as the background for the conducted
research. For this purpose, measurement data of the Polish hydrological and meteorological
service conducted by Institute of Meteorology and Water Management-National Research Institute
(IMWM-NRI) at the 1st order synoptic station, Bialystok was used. Basic meteorological elements such
as precipitation (daily precipitation hd (mm) and intensity ht (mm·min−1 )), air temperature (hourly th
and daily values: average td (◦ C), minimum tmin (◦ C) and maximum tmax (◦ C)), air relative humidity
Rh (%), atmospheric pressure reduced to the sea level pr (hPa) as well as wind speed vs (m/s) and
direction vd (◦ ) were analyzed. Assessment of the meteorological situation describing considerate
period will indicate potential conditions for the microorganisms’ development in the proposed network
of supplying rainwater to the household. Meteorological data was derived from IMWM-NRI website
open access database (https:dane.imgw.pl).
     On the basis of carried out laboratory studies, a complex database was obtained, which made
it possible to identify factors influencing the quality of considered rainwater. The identification of
the factors involved reduction analyses, the aim of which is to reduce the number of variables in the
input data set. One such method is the principal components analysis. The effect of the data reduction
is the separation of factors consisting of selected variables included in the analysis. The degree of
connection of individual variables with a separate factor is determined by factor correlations. These
factor correlation values can be interpreted in a similar way as the values of the Pearson or Spearmen
correlation coefficients.
     The crucial element of the analysis of the principal components is to determine the number
of identified factors determining changes in the data matrix. The most frequently used criterion
determining the number of identified factors is the Kaiser criterion, according to which the specific
value of a given factor should be greater than 1. This means that if a single factor does not reveal more
information than 1 variable, then it shall be rejected. According to the mentioned criterion, 3 factors
Water 2020, 12, 252                                                                                                      5 of 17

influencing the quality of the studied rainwater were selected from the input data set. The number
of factors and the value of the isolated variance are given in Figure 4. The first isolated factor was
characterized by the value of the isolated variance at the level of 13.11, the second one at the level of
11.34  and the
 Water 2019, 11, xthird factor
                   FOR PEER    at the level of 7.55.
                            REVIEW                                                                 5 of 16

                                               Figure4.4. Settlement
                                               Figure     Settlement diagram.
                                                                     diagram.

      The
      The data
            data was
                   was standardized
                         standardized before
                                          before thethe analysis,
                                                          analysis, which
                                                                      which resulted
                                                                               resulted inin averaging
                                                                                             averaging the  the variance
                                                                                                                variance of
                                                                                                                          of all
                                                                                                                              all
variables   accepted    for  analysis.  Additionally,      the variables    were    rotated  using
 variables accepted for analysis. Additionally, the variables were rotated using the Varimax method  the  Varimax   method    in
order  to enable
 in order  to enablethethe
                         interpretation   of the
                             interpretation         separated
                                               of the   separated factors.
                                                                      factors.
      Rainwater
      Rainwater for analysis was sampled from the tank
                     for  analysis    was  sampled       from    the   tank toto sterile
                                                                                  sterile bottles
                                                                                          bottles andand transported
                                                                                                           transported toto the
                                                                                                                             the
laboratory
 laboratoryofof Department
                    Department   of Chemistry,
                                     of Chemistry,Biology    and Biochemistry
                                                          Biology                   at Bialystok
                                                                      and Biochemistry         at University
                                                                                                   Bialystok of    Technology.
                                                                                                                 University    of
Microbiological     analyses were analyses
 Technology. Microbiological          carried out    in the
                                                  were       autumn
                                                          carried   outofin2017.   The totalofviable
                                                                            the autumn          2017. count   of heterotrophic
                                                                                                       The total  viable count
psychrophilic
 of heterotrophicbacteria   incubated in
                       psychrophilic       22 ◦ C (TVC
                                         bacteria           22 ◦ C) in
                                                      incubated     and22total
                                                                            °C viable
                                                                                (TVC count
                                                                                        22 °C)ofandheterotrophic   mesophilic
                                                                                                        total viable  count of
bacteria  incubated            ◦
                        in 37 Cbacteria      ◦
                                   (TVC 37incubated
                                               C) were in  carried
 heterotrophic    mesophilic                                  37 °C out
                                                                     (TVC in 37
                                                                             accordance     with Polish
                                                                                °C) were carried      out inStandards  PN-EN
                                                                                                              accordance   with
ISO  6222:2004P.
 Polish  Standards  The   presence
                       PN-EN     ISOof  EscherichiaThe
                                      6222:2004P.      coli presence
                                                            (EC) and of total  coliformscoli
                                                                           Escherichia     (TC)  was
                                                                                              (EC)     determined
                                                                                                     and             using(TC)
                                                                                                          total coliforms   the
membrane      filtration   technique    according      to Polish   Standard     PN-EN     ISO
 was determined using the membrane filtration technique according to Polish Standard PN-EN ISO  9308-1:   2014-12  A  1:2017-4.
After filtration,
 9308-1:   2014-12 100AmL    of rainwater
                          1:2017-4.    Afterthefiltration,
                                                 filters were 100placed
                                                                    mL onto     Chromocult
                                                                          of rainwater      theColiform     Agar (CCA-Merck
                                                                                                  filters were    placed onto
Ltd) and   incubated     at 37 ◦ C for 24 h. All deep blue colonies were counted as EC and all red or pink-red
 Chromocult Coliform Agar (CCA-Merck Ltd) and incubated at 37 °C for 24 h. All deep blue colonies
colonies   were as
 were counted      counted
                      EC andasallTC.redFor  assayingcolonies
                                        or pink-red       the Enterococci
                                                                    were countedmembrane
                                                                                      as TC. filtration
                                                                                               For assayingmethod    was used
                                                                                                               the Enterococci
according
 membranewith       Polish method
               filtration   Standardwas PN-ENusedISO     7899-2:2004P.
                                                     according      with Detection     of Salmonella
                                                                           Polish Standard       PN-EN  spp.ISO
                                                                                                              were carried out
                                                                                                                 7899-2:2004P.
in accordance
 Detection    of with    Polishspp.
                  Salmonella      Standards    PN-EN out
                                       were carried       ISO 19250:2013-07E.
                                                                in accordance with Polish Standards PN-EN ISO
 19250:2013-07E.
3. Results
3. Results
3.1. Weather Conditions
 3.1. Weather
      For more Conditions
                 than the first decade of October (1–13 October), Poland was under the dominant
influence of Low-pressure area moving from the Atlantic through Scandinavia to western Russia.
      For more than the first decade of October (1–13 October), Poland was under the dominant
These Low centers were accompanied by systems of atmospheric fronts. During October 6 to 7, Poland
 influence of Low-pressure area moving from the Atlantic through Scandinavia to western Russia.
temporarily found itself in the range of High-pressure area moving from Scandinavia. At that time,
 These Low centers were accompanied by systems of atmospheric fronts. During October 6 to 7,
polar-sea air was flowing into the country, which was temporarily warmer. At the same time, arctic
 Poland temporarily found itself in the range of High-pressure area moving from Scandinavia. At that
air was temporarily present, resulting in mostly large cloud cover, but with greater clear weather.
 time, polar-sea air was flowing into the country, which was temporarily warmer. At the same time,
During the High-pressure area there were also sunny weather. From 14 to 21 October, Poland was
 arctic air was temporarily present, resulting in mostly large cloud cover, but with greater clear
under the influence of the Low-pressure area of Western Europe, only initially succumbing to the
 weather. During the High-pressure area there were also sunny weather. From 14 to 21 October,
High-pressure area from the Balkans. At that time, tropical air and temporarily warm polar-sea flowed
 Poland was under the influence of the Low-pressure area of Western Europe, only initially
in. The cloudiness was small and moderate, in the northwestern half of the country it increased to
 succumbing to the High-pressure area from the Balkans. At that time, tropical air and temporarily
large periods causing rain. Until the end of October, northern and western Poland was under the
 warm polar-sea flowed in. The cloudiness was small and moderate, in the northwestern half of the
influence of Low-pressure area with systems of atmospheric fronts, which moved on the Baltic Sea and
 country it increased to large periods causing rain. Until the end of October, northern and western
 Poland was under the influence of Low-pressure area with systems of atmospheric fronts, which
 moved on the Baltic Sea and the North Sea. The south and east parts of the country were reaching a
 High-pressure area wedge from the Atlantic Sea. Initially there was advection of tropical and then
 polar sea, temporarily warm. In the south of the country, the cloud cover was small, and in the rest
 of the area it was large, with more rain and local weather. It rained or drizzled in the north of Poland
Water 2020, 12, 252                                                                                                   6 of 17

the North Sea. The south and east parts of the country were reaching a High-pressure area wedge from
the Atlantic Sea. Initially there was advection of tropical and then polar sea, temporarily warm. In the
south of the country, the cloud cover was small, and in the rest of the area it was large, with more rain
and local weather. It rained or drizzled in the north of Poland (Figure 5).
   Water 2019, 11, x FOR PEER REVIEW                                                                                    6 of 16

    A                                                                        B

    C                                                                        D

        Figure
      Figure   5. 5.Weather
                     Weathercharts
                              chartsrespectively
                                     respectively (W—High
                                                   (W—High pressure
                                                           pressure area,
                                                                    area, N—Low
                                                                          N—Low pressure
                                                                                pressurearea):
                                                                                         area):(A)
                                                                                                 (A)1 1X,X,(B)
        12  X, (C)  23 X, (D) 3 XI.
      (B) 12 X, (C) 23 X, (D) 3 XI.

        The
      The      analyzed
            analyzed       period
                        period   waswas   relatively
                                       relatively      rainy
                                                    rainy      (Figure
                                                            (Figure     6).6).
                                                                            The The   occurred
                                                                                   occurred        rainfall
                                                                                                rainfall  waswas   moderately
                                                                                                                moderately
   intensive,
intensive,  withwith  intensities
                  intensities      between
                               between        0.1–2.5
                                         0.1–2.5 mm per mm10per min, 10which
                                                                        min, which       is a characteristic
                                                                                is a characteristic   domain domain       of the
                                                                                                               of the Polish
climate in October and November. During 40 analyzed days, there were 32 rainy days, with 3 days as 3
   Polish  climate  in  October   and  November.     During      40  analyzed     days,   there  were   32 rainy  days, with
   daysof
a dust   asprecipitation
             a dust of precipitation
                            which means whichhd =means    hd = 0.01
                                                   0.01 mm.      The mm.
                                                                       dailyThe     dailytotals
                                                                               rainfall     rainfall  totals
                                                                                                  ranged     ranged
                                                                                                           from       fromto0.1
                                                                                                                 0.1 mm
   mm
14.7 mm,to and
           14.7 the
                 mm, 40and
                        days the 40 days
                               total       total134.8
                                     was only    was only
                                                       mm. 134.8      mm. Consecutive
                                                              Consecutive       10-day totals 10-day
                                                                                                 weretotals   were43.8
                                                                                                        56.3, 12.7,  56.3,mm
                                                                                                                           12.7,
and43.8 mm
     21.5  mm,andrespectively.
                   21.5 mm, respectively.      In theperiod,
                                  In the analyzed      analyzed   theperiod,
                                                                       average theairaverage   air temperature
                                                                                       temperature               ◦
                                                                                                        was 7.1 C,  was 7.1 °C,
                                                                                                                      which
was  2.7 ◦ C
   which   was   2.7 °C deviation
              deviation              from the long-term
                          from the long-term                   period 1971–2000.
                                                 period 1971–2000.         The maximum  The maximum
                                                                                                temperature    was 19.8 ◦was
                                                                                                            temperature     C
and19.8
     the°C   and the temperature
         minimum                      was −2.1 ◦ C.was
                       minimum temperature            There−2.1was°C.noThere    was average
                                                                         day with     no day with      averagebelow
                                                                                                 temperature            0 ◦C
                                                                                                                 temperature
   below7).0 Relative
(Figure      °C (Figure    7). Relative
                       humidity    rangedhumidity
                                            from 50ranged
                                                      to 87% from
                                                                while50    to 87% while
                                                                        atmospheric           atmospheric
                                                                                          pressure            pressure953.9
                                                                                                     varied between     varied
andbetween     953.9West
     1010.2 hPa.      andand1010.2   hPa. West
                                south-west    windand     south-west
                                                     directions            wind directions
                                                                     dominated,      32 and 21%dominated,
                                                                                                    respectively,32with
                                                                                                                     andthe 21%
   respectively,   with  the     −1
                              average
average wind speed 2.8 m s (Figure 8).  wind  speed    2.8  m  s −1 (Figure 8).

                                                       16

                                                       14

                                                       12
                                   precipitation, mm

                                                       10

                                                       8

                                                       6

                                                       4

                                                       2

                                                 0
                                               01.10.2017   11.10.2017   21.10.2017   31.10.2017   10.11.2017
43.8 mm and 21.5 mm, respectively. In the analyzed period, the average air temperature was 7.1 °C,
 which was 2.7 °C deviation from the long-term period 1971–2000. The maximum temperature was
 19.8 °C and the minimum temperature was −2.1 °C. There was no day with average temperature
 below 0 °C (Figure 7). Relative humidity ranged from 50 to 87% while atmospheric pressure varied
 between 953.9 and 1010.2 hPa. West and south-west wind directions dominated, 32 and 21%
Water 2020, 12, 252                                                                         7 of 17
 respectively, with the average wind speed 2.8 m s−1 (Figure 8).

                                                           16

                                                           14

                                                           12

                                       precipitation, mm
                                                           10

                                                            8

                                                            6

                                                            4

                                                            2

                                                     0
                                                   01.10.2017       11.10.2017       21.10.2017   31.10.2017     10.11.2017
                                                                                          day
Water 2019, 11, x FOR PEER REVIEW                                                                                                            7 of 16
                                   Figure6.6.Precipitation
 Water 2019, 11, x FOR PEER REVIEWFigure      Precipitationfor
                                                            forBialystok
                                                                Bialystokstation.
                                                                          station.                                                             7 of 16

                                                                                                                        t max
                                                                                                                        t min
                                                                                                                           t max
                                           20                                                                              t min
                                                           20

                                           15
                                                           15
                                 temperature, °C
                               temperature, °C

                                           10
                                                           10

                                                  5
                                                           5

                                                  0
                                                           0

                                      -5
                                     01.10.2017
                                         -5       11.10.2017   21.10.2017   31.10.2017   10.11.2017
                                       01.10.2017   11.10.2017   21.10.2017
                                                                      day     31.10.2017   10.11.2017
                                                                                          day
                                                Figure 7. Air temperature for Bialystok station.
                                                  Figure7.7.Air
                                                 Figure      Airtemperature
                                                                 temperaturefor
                                                                             forBialystok
                                                                                 Bialystokstation.
                                                                                           station.

                                                                             N
                                                                NNW              N          NNE
                                                                  NNW                         NNE
                                               NW                                                    NE
                                                NW                                                     NE

                          WNW                                                                                  ENE
                           WNW                                                                                   ENE V, m/s
                                                                                                                              >= 7.0
                                                                                                                           V, m/s
                                                                                                                              6.0>=
                                                                                                                                  - 7.0
                                                                                                                                     7.0
                                                                                                                              5.06.0
                                                                                                                                  - 6.0
                                                                                                                                     - 7.0
                           W                                                                                    E             4.05.0
                                                                                                                                  - 5.0
                                                                                                                                     - 6.0
                               W                                                                                    E         3.04.0
                                                                                                                                  - 4.0
                                                                                                                                     - 5.0
                                                                                                                              2.03.0
                                                                                                                                  - 3.0
                                                                                                                                     - 4.0
                                                                                                                              1.02.0
                                                                                                                                  - 2.0
                                                                                                                                     - 3.0
                          WSW                                                                                  ESE            0 -1.0
                                                                                                                                  1.0- 2.0
                           WSW                                                                                   ESE             0 - 1.0

                                               SW                                                    SE
                                                 SW                                                    SE
                                                                SSW                         SSE
                                                                  SSW        S                SSE
                                                                                 S
                                                               Winddirection
                                                     Figure8.8.Wind
                                                    Figure          directionfor
                                                                              forBialystok
                                                                                 Bialystokstation.
                                                                                            station.
                                                      Figure 8. Wind direction for Bialystok station.
3.2. Rainwater
  3.2. Rainwater
      The aim of the study was to analyze changes in physicochemical characteristics of RWH
        The for
rainwater     aimwashing
                   of the study    wasfrom
                            collected    to analyze    changesroofs.
                                              tiled, ceramic     in physicochemical
                                                                       The experiment characteristics
                                                                                          was carried out  of with
                                                                                                               RWH
  rainwaterwater
increased      for washing
                    retentioncollected   from tiled, after
                               time (immediately       ceramic  roofs.
                                                            rainfall and The
                                                                           10,experiment
                                                                               20, 30 dayswas    carried
                                                                                             after        out The
                                                                                                    rainfall).   with
  increased    water  retention  time  (immediately     after rainfall  and  10, 20, 30  days  after
results of physicochemical analysis of rainwater are presented in Table 1. According to the available rainfall). The
  results of[40–44]
literature    physicochemical
                    and standardsanalysis  of rainwater
                                     [29,30,38,39],       areof
                                                     the pH   presented
                                                                rainwater incan
                                                                             Table  1. According
                                                                                 range  from weaklyto the available
                                                                                                       acidic  (pH
  literature  [40–44] and  standards   [29,30,38,39],  the pH  of rainwater   can  range  from weakly
3.1) to weakly alkaline (pH 11.4). In conducted studies, the pH of rainwater range of 6.6–8.26. Figures  acidic  (pH
Water 2020, 12, 252                                                                                                                       8 of 17

3.2. Rainwater
      The aim of the study was to analyze changes in physicochemical characteristics of RWH rainwater
for washing collected from tiled, ceramic roofs. The experiment was carried out with increased
water retention time (immediately after rainfall and 10, 20, 30 days after rainfall). The results
of physicochemical analysis of rainwater are presented in Table 1. According to the available
literature [40–44] and standards [29,30,38,39], the pH of rainwater can range from weakly acidic
(pH 3.1) to weakly alkaline (pH 11.4). In conducted studies, the pH of rainwater range of 6.6–8.26.
Figures 4 and 5 show changes in the concentration of organic and nutrient compounds in harvesting
rainwater during the experiment. It should be noted that that the concentration of all analyzed
parameters was lower than that specified in the Polish standards [38] and global regulations [29,30,39].
The only exception was water turbidity which was slightly higher than required for drinking water
(1 NTU). The water turbidity determined during the experiment was acceptable for washing purposes.
Figure 6 shows changes in the concentration of heavy metals in rainwater. The concentration of all
analyzed heavy metals was low and did not exceed the acceptable standards. Test results available
in literature indicate that out of all heavy metals it is lead (Pb) which most frequently exceeds the
DWS limit (10 µg·dm−3 ) in raw rainwater. For instance, in a Malaysian study [40] Pb concentrations
exceeded 10 mg/L in all rainwater samples. Simmons, et al. [41] indicated 14.4% of total samples
had Pb concentrations exceeding New Zealand’s water standards [41]. Similar results were reported
by Huston, et al. [42] who concluded that 14.2% rainwater samples in Australia exceeded DWS [42].
Over 30% of rainwater samples in which lead concentration was exceeded was presented in Australian
studies conducted by Magyar, et al. [43] and Huston, et al. [44]. The above-mentioned authors attribute
the presence of lead in rainwater to chemical treatment of tanks or paint (as much as 58%), deposition
in the atmosphere (21%) and hydraulics (16%). These authors have found that the most important
element in a rainwater harvesting system is correct design. It is very probable that the RWH system
that was built for the Polish experiment was designed and built correctly resulting in rainwater not
exceeding requirements after 30 days storage. Additional positive influence on water quality is the
location of the system in one of the cleanest regions in Europe, specifically Podlaskie, Poland. Al-Batsh,
et al. [33] notice that after a stabilization period the stored rainwater becomes significantly cleaner [33],
and this reflected many of the results in Table 1.

      Table 1. Physicochemical characteristics of rainwater (cement tile roof) in comparison with Polish
      drinking water standards (DWS) [38], World Health Organization guidelines for drinking water quality
      (WHO) [39], EU Drinking Water Directive (DWD) [29] and EU Bathing Water Directive (BWD) [30].
                                                                   After . . . Days
                    Parameter                     Unit                                        DWS [38]     WHO [39]   DWD [29]     BWD [30]
                                                            0       10         20      30
    Water temperature each time it was sampled     ◦C      13.0     13.5     12.3     11.8        –            –            –         –
                       pH                           -      6.60     7.58     8.26     7.61     6.5–9.5      6.5–8.5     6.5–9.5       –
                   Alkalinity                    mg·dm−3    0.50    0.70      0.80     0.30       –            –            –         –
                    Hardness                     mg·dm−3   28.02   22.16     20.02    21.60   60.0–500.0       –            –         –
                                                                                                                       2500.0 at
              Conductivity at 25 ◦ C             µS·cm−1   72.40   50.00     34.40    35.16    2500.0       2000.0                    –
                                                                                                                         20 ◦ C
                      Turbidity                   NTU      2.40     3.00      2.25    2.10        1.0         5.0     acceptable      –
                       Colour                     Pt-Co    30.00   36.00     25.00    27.00   acceptable       –      acceptable      –
            Total dissolved solids (TDS)         mg·dm−3   31.00   56.00     61.00    45.00        –         500.0          –         –
            Total suspended solids (TSS)         mg·dm−3   10.00   10.00     10.00    21.00        –           –            –         –
              Dissolved oxygen (DO)              mg·dm−3    3.10    4.96      3.60     4.41        –           –            –         –
        Biological Oxygen Demand (BOD5 )         mg·dm−3    5.00    4.00      5.00     6.00        –           –            –         –
        Chemical Oxygen Demand (COD)             mg·dm−3   29.00   38.00     36.00    22.00        –           –            –         –
                Oxidizable (KMnO4 )              mg·dm−3    2.50    2.40      2.80     2.10       5.0          –           5.0        –
                   Sulfate (SO4 2− )             mg·dm−3    3.00    5.00      2.00     4.40     250.0          –         250.0        –
           Total Kiedjahl nitrogen (TKN)         mg·dm−3    1.31    1.28      2.23     1.19        –           –            –         –
               Total phosphorous (P)             mg·dm−3    2.10    2.80      2.60     1.90        –           –            –         –
                Phosphates (PO4 -P)              mg·dm−3    1.41    1.54      2.24     0.90        –           –            –         –
         Ammoniacal-nitrogen (NH3 − N)           mg·dm−3    0.41    0.42      0.26     0.38        –           –            –         –
             Nitrate-nitrogen (NO3 − N)          mg·dm−3    1.71    2.40      2.00     1.90      50.0          –          50.0        –
Water 2020, 12, 252                                                                                                                                      9 of 17

                                                                              Table 1. Cont.
                                                                                       After . . . Days
                             Parameter                      Unit                                                      DWS [38]     WHO [39]        DWD [29]   BWD [30]
                                                                          0             10         20       30
                                                − N)
                      Nitrite-nitrogen (NO2                mg·dm−3       0.00       0.01           0.02     0.01          0.5          –             0.5         –
                            Chloride (Cl− )                mg·dm−3       2.00       1.00           1.00     1.00        250.0        250.0          250.0        –
                            Cadmium (Cd)                   µg·dm−3       0.00       0.02           0.02     0.01          5.0          –             5.0         –
Water 2019, 11, x   FOR PEER       REVIEW
                             Calcium  (Ca)                 mg·dm−3      4.2442     4.2810         3.5006   3.6801          –           –              –          –             9 of 16
                           Chromium (Cr)                   µg·dm−3      0.0198     0.0221         0.0290   0.0271        50.0          –             50.0        –
                             Copper (Cu)                   mg·dm−3      0.0126     0.0063         0.0151   0.0583         2.0          –             2.0         –
                               Iron (Fe)                   µg·dm−3      0.1405     0.1215         0.1488   0.1533       200.0          –            200.0        –
      Table 1 shows the results of physicochemical characteristic of the rainwater samples:
                              Lead (Pb)                    µg·dm−3      0.0306     0.0295         0.0281   0.0297        10.0          –             10.0        –
                          Magnesium (Mg)                   mg·dm−3      0.0925     0.1311         0.0802   0.1103     30.0–125.0       –              –          –
immediately after rainfall and 10, 20, 30 days later. The pH values of the rainwater ranged from 6.6
                          Manganese (Mn)                   µg·dm−3      0.0023     0.0002         0.0006   0.0017        50.0          –             50.0        –
                              Nickel (Ni)                  µg·dm−3      0.0415     0.0341         0.0414   0.0366        20.0          –             20.0        –
to 8.26 with an average value of 7.51 and was similar to that given by Al-Khatib, et al. (2019) [35]. In
                            Potassium (K)                  µg·dm−3      1.8386     2.0873         1.2937   1.8953          –           –              –          –
                               Zinc (Zn)                   µg·dm−3      0.0557     0.0138         0.0306   0.0432          –           –              –          –
addition, the average value of conductivity for the analyzed rainwater (47.99 µS·cm−1) was eight times
lower than the     average value (389 µS·cm−1) noted in rainwater from Yatta [35]. This confirms the good
                Table 1 shows the results of physicochemical characteristic of the rainwater samples: immediately
quality ofafter
             rainwater
                 rainfall andin 10,
                                 one20,of30 the
                                             dayscleaner
                                                  later. Theregions
                                                               pH values   of ofEurope.    Another
                                                                                 the rainwater     ranged parameter
                                                                                                             from 6.6 to confirming
                                                                                                                           8.26 with     this
statementanisaverage
                the concentration
                         value of 7.51 and  of was
                                               totalsimilar
                                                      dissolved
                                                              to thatsolids
                                                                       given by  (TDS).    The et
                                                                                   Al-Khatib,     highest
                                                                                                     al. (2019)value
                                                                                                                  [35]. of  total dissolved
                                                                                                                        In addition,
          the  average   value   of conductivity    for  the analyzed     rainwater    (47.99 µS·cm    −1 ) was eight times lower
solids measured in the analyzed rainwater was 61 mg·dm while the literature data [35] give values
                                                                                  −3
          than the average value (389 µS·cm−1 ) noted in rainwater from Yatta [35]. This confirms the good quality
more than    five times higher. A similar accuracy was noted for the other examined parameters such
          of rainwater in one of the cleaner regions of Europe. Another parameter confirming this statement is
as: chlorine,    ammonia, etc., which were many times lower in the examined rainwater than the
          the concentration of total dissolved solids (TDS). The highest value of total dissolved solids measured
literatureinreports    [35]. rainwater was 61 mg·dm−3 while the literature data [35] give values more than five
             the analyzed
      Rainwater     flowing
          times higher.           downaccuracy
                             A similar      from thewasroofnotedisfor
                                                                   cleaned
                                                                       the other onexamined
                                                                                      mechanical        filters.such
                                                                                                 parameters        Suspensions
                                                                                                                       as: chlorine,(mainly
          ammonia,
heavier than    water) etc., which were
                          sediment       andmany  times
                                               settle onlower
                                                            the in  the examined
                                                                 bottom      of therainwater
                                                                                      tank, and   than  the literature
                                                                                                     some     (lighterreports   [35]. float
                                                                                                                         than water)
                Rainwater flowing down from the roof is cleaned on mechanical filters. Suspensions (mainly
on the surface. However, the stable temperature in the ground (about 8–10 °C) and the lack of access
          heavier than water) sediment and settle on the bottom of the tank, and some (lighter than water) float
to sunlight   significantly inhibit biological processes, causing the rainwater in the tank to remain
          on the surface. However, the stable temperature in the ground (about 8–10 ◦ C) and the lack of access to
odorless,sunlight
           colorless     and turbid
                     significantly        forbiological
                                     inhibit   a long time.       Overflowing
                                                          processes,                  of the tank
                                                                      causing the rainwater            causes
                                                                                                  in the  tank tothe    suspensions
                                                                                                                   remain   odorless, to be
carried away     from
          colorless  andthe    tank,
                          turbid   for at  thetime.
                                       a long   sameOverflowing
                                                        time oxygenating
                                                                      of the tank the    water
                                                                                    causes         and ensuring
                                                                                            the suspensions            its high
                                                                                                                 to be carried    clarity.
                                                                                                                               away
          from   the tank,   at the same   time  oxygenating     the water    and  ensuring   its  high
      Figures 9–11 present the characteristic of rainwater immediately after rainfall and 10, 20, 30 daysclarity.
                Figures 9–11 present the characteristic of rainwater immediately after rainfall and 10, 20,
later.
            30 days later.

                                          100

                                                                                                                                    pH
                                                                                                                                    Alkalinity
                                           10                                                                                       Hardness
                                                                                                                                    Conductivity
                                                                                                                                    Turbidity
                                  range

                                                                                                                                    Colour
                                                                                                                                    TDS
                                            1                                                                                       TSS
                                                                                                                                    DO

                                          0.1
                                                       0           10                        20                  30
                                                                                 day

                  Figure 9. Physicochemical indicators of rainwater (immediately after rainfall and 10, 20, 30 days later)
      Figure 9. used
                Physicochemical
                     in the study. indicators of rainwater (immediately after rainfall and 10, 20, 30 days later)
      used in the study.

                                          100

                                          10
                                                                                                                                       BOD5
                                                                                                                                       COD
                                                                                                                                       KMnO4
                                           1                                                                                                  2-
day

    Figure 9. Physicochemical indicators of rainwater (immediately after rainfall and 10, 20, 30 days later)
    used in the study.
         Water 2020, 12, 252                                                                                          10 of 17

                                        100

                                           10
                                                                                                     BOD5
                                                                                                     COD
                                                                                                     KMnO4
                                            1
                                                                                                     SO42-
                               range

                                                                                                     TKN
                                                                                                     P
                                           0,1
                                                                                                     PO4-P
                                                                                                     NH3-N
                                                                                                     NO3-N
                                        0,01
                                                                                                     NO2-N
                                                                                                     Cl-
                                       0,001
                                                      0       10               20        30
                                                                        day
Water 2019, 11, x FOR PEER REVIEW                                                                                                 10 of 16
              Figure 10. Changes in quantities of organic and nutrient compounds in rainwater (immediately after
    Figure   10. Changes
              rainfall and 10,in20,
                                 quantities    of used
                                    30 days later) organic  and
                                                       in the    nutrient compounds in rainwater (immediately
                                                              study.                                                         after
    rainfall and 10, 20, 30 days later) used in the study.
                                             100

                                                 10
                                                                                                       Cd
                                                                                                       Ca
                                                  1                                                    Cr
                                                                                                       Cu
                                                                                                       Fe
                                   range

                                             0.1
                                                                                                       Pb
                                                                                                       Mg
                                            0.01                                                       Mn
                                                                                                       Ni
                                                                                                       K
                                           0.001                                                       Zn

                                            1E-4
                                                          0        10               20        30
                                                                         day

               Figure 11. Concentration of heavy metals in rainwater (immediately after rainfall and 10, 20, 30 days
      Figureafter
              11. Concentration      of study.
                  rainfall) used in the  heavy metals in rainwater (immediately after rainfall and 10, 20, 30 days
      after rainfall) used in the study.
              The pH of the analyzed rainwater ranged from 6.6 to 8.26 and increased after falling on roofs and
        during storage in tanks. It indicates that the rainfall is not acidic in the study area and thus eliminates
      The   pH of the analyzed rainwater ranged from 6.6 to 8.26 and increased after falling on roofs
        the possibility of any undesirable chemical reaction. Similar observations are given in the literature [35].
and during      storage
        The increase   in pH inoftanks.    It indicates
                                   the stored                thatbethe
                                               rainwater could       duerainfall      is notnature
                                                                           to the alkaline      acidic   in the
                                                                                                     of roof     study
                                                                                                             materials     area and thus
                                                                                                                        (cement
eliminates    the [35,45].
        tile roof)  possibility     of anyinundesirable
                             The increase       pH could notchemical
                                                                 be caused by reaction.     Similar
                                                                                  the material   from observations
                                                                                                       which the storage  aretank
                                                                                                                                given in the
literature
        was[35].
              made,The     increase
                      as the  literatureinstates
                                           pH of     the stored
                                                 [35,46],           rainwater
                                                           as a PE tank   was used  could
                                                                                       in thebe   due to the alkaline nature of roof
                                                                                              study.
              The   physical   characteristics   of  the rainwater   in  all
materials (cement tile roof) [35,45]. The increase in pH could not be caused analyzed    samples    as color
                                                                                                          by and
                                                                                                             the temperature
                                                                                                                  material from which
        were acceptable. However, the turbidity was found to be two to three times higher than recommended
the storage tank was made, as the literature states [35,46], as a PE tank was used in the study.
        in the DWS [38]. This pollution may have been caused by dust settling on the roof during the traffic
      The   physical
        of the  estate’s characteristics
                          residents. The roads of the    rainwater
                                                    in the              in all analyzed
                                                            surveyed housing       estate weresamples      as color
                                                                                                  not yet paved.       and the
                                                                                                                  Between      temperature
were acceptable.          However,
        rainfall in the surveyed     area,the    turbidity
                                            the roofs            was with
                                                       were covered      found      to be dust.
                                                                              characteristic   two Additionally,
                                                                                                      to three times this dusthigher
                                                                                                                                is     than
recommended
        generated in as athe   DWS
                           result       [38]. This
                                  of numerous          pollution
                                                  construction    andmay     haveworks
                                                                       finishing     beenoncaused       by dust
                                                                                                the housing  estate.settling on the roof
              In the  analyzed    rainwater   samples    the  concentration
during the traffic of the estate's residents. The roads in the surveyed housingof chlorides   was  very  low from estate
                                                                                                                    1 to 2 mg/L.
                                                                                                                              were not yet
        None of the samples contained chlorides exceeding the DWS [38] or WHO [39] standards. According
paved. Between the rainfall in the surveyed area, the roofs were                                 covered with characteristic dust.
        to the literature, concentrations of chlorides exceeding 250 mg·dm−3 cause salty taste of water and
Additionally,      this dust is generated as a result of numerous construction and finishing works on the
        may lead to physiological damage [35,47]. The results of the studies exclude the possibility of the
housing    estate.
        above-mentioned        problems.
     In the analyzed rainwater samples the concentration of chlorides was very low from 1 to 2 mg/L.
None of the samples contained chlorides exceeding the DWS [38] or WHO [39] standards. According
to the literature, concentrations of chlorides exceeding 250 mg·dm−3 cause salty taste of water and
may lead to physiological damage [35,47]. The results of the studies exclude the possibility of the
above-mentioned problems.
Water 2020, 12, 252                                                                                  11 of 17

     The alkalinity values ranged from 15 to 40 mg/L CaCO3 with an average value of 28.8 mg/L
CaCO3 , and all values were very low and acceptable. According to the literature [35] alkalinity is a very
important parameter for safe drinking water as it buffers against rapid pH changes. Values of total
dissolved solids (TDS) in the rainwater samples ranged between 31 to 61 mg/L with an average value
of 48.3 mg/L and all values were within the DWS [38] and WHO [39] standards. The average TDS
value in analyzed rainwater was four times lower than value noted by Al-Khatib, et al. [35]. Therefore,
the water will not have a bitter or salty taste, as the TDS concentration does not exceed 500 mg/L.
In addition, the purpose of the water is not to consume it, but to use it for laundry purposes.
     Zinc, lead and nickel have the biggest share in rainwater. They account for about 60–80% of all
metals, which is due to the widespread use of these elements in the automotive and fuel industries.
In analyzed rainwater, a lead concentration of 0.0306 µg·dm−3 was found. The amount of lead decreased
with the storage of rainwater in the tank. The main source of lead in urbanized areas is public transport.
The majority of lead compounds are emitted together with exhaust gases and occur e.g., in the form of
lead ammonium halide. All lead compounds are highly dispersible and are easily absorbed on the
surface of atmospheric dust particles, which are deposited on hardened surfaces, from where they
are further flushed to rainwater. Nickel atmospheric air pollution is closely related to emissions from
the metallurgical industry and the burning of liquid fuels. The stored rainwater contained a small
concentration of nickel (min. 0.0341 µg·dm−3 , max. 0.0415 µg·dm−3 ) which, like lead, decreased with the
storage of rainwater in the tank. The chromium found in the analyzed rainwater (min. 0.0198 µg·dm−3 ,
max. 0.029 µg·dm−3 ) may be obtained from non-ferrous metallurgy and cement and lime materials
production. Chromium compounds concentrations, and its increased amounts are caused mainly by
industrial activities. Minor amounts of copper (min. 0.0063 µg·dm−3 , max. 0.0583 µg·dm−3 ) in the
rainwater under investigation may originate from coal combustion processes and industrial activities.
     Figures 12 and 13 show the projection of the identified factors into the plane of variables.
The variables that were considered to describe a given factor to the greatest extent were those
characterized by the greatest cosine of the angle of inclination of the straight line routed from the
center of the coordinate system and the resultant point of variance. Hence, component 1 consisted
mainly of the pH value (component correlation value −0.92), hardness (0.84), TDS (−0.96), TKN (−0.80),
NO2 -N (−0.94), Cd (−0.92), Pb (0.97), Mn (0.86). Taking into account the values and signs of component
correlations of significantly influencing variables, this factor may be related to the inflow of fresh water
into the retention tank. This is indicated by negative correlations with the reaction, TDS and forms
of nitrogen and a positive correlation with water hardness. Component 1 explained 40.96% of the
changes of variance in the arrangement of variables. The percentage of the explained variance can
be interpreted as the amount of explained changes. Therefore, this factor was responsible for almost
41% of changes in the quality of rainwater. Component 2 consisted of water temperature (component
correlation value 0.90), color (0.99), turbidity (0.98), Ca (0.81) and Fe (−0.99). This component explained
35.43% of the variance and could be related to the water retention time in the retention tank.
     The third component was correlated only with TSS (0.84) and oxidizability (−0.80). It explained
23.60% of the changes in the variable system and could be responsible for precipitation processes under
the influence of oxygen dissolved in precipitation water.
     Despite the possibility of the occurrence of a large variety of pathogenic organisms in harvested
rainwater there is no need to detect them all. Therefore, common indicator organisms as Salmonella,
Escherichia coli, total coliforms, enterococci and total viable count of heterotrophic bacteria were chosen
to assess the degree of microbiological contamination. The results of microbiological analysis of
harvested rainwater samples from Bialystok area are presented in Table 2.
40.96% of the changes of variance in the arrangement of variables. The percentage of the explained
       variance can be interpreted as the amount of explained changes. Therefore, this factor was
       responsible for almost 41% of changes in the quality of rainwater. Component 2 consisted of water
       temperature (component correlation value 0.90), color (0.99), turbidity (0.98), Ca (0.81) and Fe (−0.99).
       This12,
Water 2020, component
               252      explained 35.43% of the variance and could be related to the water retention time in 12 of 17
       the retention tank.

       Water 2019, 11,Figure
                       x FOR PEER
                           Figure REVIEW
                                  12. Projection
                              12. Projection   of of variableson
                                                  variables    oncomponent
                                                                  component 11and
                                                                               andcomponent
                                                                                   component2 plane.
                                                                                              2 plane.       12 of 16

           The third component was correlated only with TSS (0.84) and oxidizability (−0.80). It explained
      23.60% of the changes in the variable system and could be responsible for precipitation processes
      under the influence of oxygen dissolved in precipitation water.

                        Figure
                   Figure      13. Projection
                          13. Projection      of variables
                                           of variables  ononcomponent
                                                              component 11 and
                                                                           and component
                                                                               component3 3plane.
                                                                                             plane.

     BasedDespite
             on the the   possibility
                     results   givenofinthe occurrence
                                         Table 2, it canofbe
                                                           a large variety that
                                                              concluded    of pathogenic  organisms
                                                                                 water stored  in theinRWH
                                                                                                        harvested
                                                                                                             system
       rainwater there is no need to detect them all. Therefore, common indicator organisms as Salmonella,
for 30 days does not meet the requirements for water intended for human consumption due to Total
       Escherichia coli, total coliforms, enterococci and total viable count of heterotrophic bacteria were
Viable Count of heterotrophic bacteria incubated in 22 ◦ C and 37 ◦ C. The limit values of the first of the
       chosen to assess the degree of microbiological contamination. The results of microbiological analysis
above-mentioned      indicators
       of harvested rainwater      were exceeded
                                 samples             by 2.5
                                          from Bialystok  areatimes  to maximum
                                                                are presented       38 2.
                                                                               in Table times. Exceedances of the

            Table 2. Microbiological contamination of harvested rainwater in Bialystok area in comparison with
            EU Drinking Water Directive (DWD) [29] and EU Bathing Water Directive (BWD) [30].

                                                         After … Days                   DWD          BWD
            Indicator         Unit
                                              0          10        20          30        [29]         [30]
          TVC 22 °C         CFU/mL        1.6 × 10³   2.9 × 10² 3.8 × 10³   2.5 × 10²    100            -
Water 2020, 12, 252                                                                                                                13 of 17

    limit values of Total Viable Count of heterotrophic bacteria incubated in 37 ◦ C were significantly lower,
    i.e., with maximum 3.5-fold. The water stored in the RWH system, on the other hand, corresponded to
    the quality of bathing water and was of excellent quality. None of the harvested rainwater samples
    showed the presence of Salmonella. Only in one sample E. coli or Enterococcus were detected in very low
    numbers but on the other hand, total coliforms were detected in each investigated sample. The number
    of total coliforms ranged from 6 to 2300 (CFU/100 mL) with a downward trend during the study. There
    is a high probability that contamination of total coliforms, E. coli or Enterococcus was caused by bird or
    animal droppings. In the case of rainwater retention, it is worth considering introducing disinfection,
    e.g., by UV lamps to improve the water’s sanitary safety.

          Table 2. Microbiological contamination of harvested rainwater in Bialystok area in comparison with
          EU Drinking Water Directive (DWD) [29] and EU Bathing Water Directive (BWD) [30].

                                                                            After . . . Days
            Indicator      Unit                                                                            DWD [29]         BWD [30]
                                                                   0        10              20        30
               ◦
       TVC 22
Water 2019, 11,◦ C        CFU/mL
                 x FOR PEER REVIEW   1.6 × 10³   2.9 × 10²   3.8 × 10³  2.5 × 10²     100                 -     13 of 16
       TVC 37 C         CFU/mL       7.0 × 101   6.0 × 101   5.0 × 101  2.0 × 101      20                 -
       E. coli         CFU/100 mL    2.0 × 100        0          0           0         0       500 excellent quality *
downward        trend during
       Total coliform  CFU/100the
                               mL study.   There
                                     2.0 × 101
                                                  is ×a 10
                                                 2.3    high
                                                           3
                                                             probability
                                                             2.3 × 101    that
                                                                        6.0 × 100contamination
                                                                                        -        of total- coliforms,
       Enterococci     CFU/100 mL        0            0      3.0 × 100       0          0      200 excellent quality *
E. coliSalmonella
        or Enterococcus   was caused by
                       CFU/100 mL        0
                                             bird or 0animal droppings.
                                                                 0
                                                                            In
                                                                             0
                                                                               the case- of rainwater retention,
                                                                                                          -
                                                                                                                       it
is worth considering introducing disinfection,       e.g., by UV lamps to improve the water’s sanitary
                                          * Based on the 95th percentile.
safety.
      Figure
       Figure14
              14present
                  present the
                           the microbiological characteristicof
                               microbiological characteristic   ofrainwater
                                                                    rainwaterimmediately
                                                                              immediatelyafter
                                                                                          afterrainfall
                                                                                                 rainfall and
                                                                                                        and 10,
10, 20, 30 days  later.
  20, 30 days later.

                                                           4
                            log CFU/ml or log CFU/100 ml

                                                           3                                               TVC 22°C
                                                                                                           TVC 37°C
                                                                                                           E.coli
                                                                                                           Total coliform
                                                           2                                               Enterococci
                                                                                                           Salmonella

                                                           1

                                                           0
                                                               0       10              20        30
                                                                                 day

         Figure 14. Microbiological indicators of rainwater (immediately after rainfall and 10, 20, 30 days after
        Figure 14. Microbiological indicators of rainwater (immediately after rainfall and 10, 20, 30 days after
         rainfall) used in the study.
        rainfall) used in the study.

       Anticipating future changes is always difficult and uncertain. When analyzing two divergent
     Anticipating future changes is always difficult and uncertain. When analyzing two divergent
 scenarios, an improvement or deterioration of the environment can be expected. If climate policies
scenarios, an improvement or deterioration of the environment can be expected. If climate policies
 and actions are successful, the environment will become stable and clean, without weather extremes.
and actions are successful, the environment will become stable and clean, without weather extremes.
 Rainwater will contain natural pollutants with little or no pollution of civilization (anthropogenic).
Rainwater will contain natural pollutants with little or no pollution of civilization (anthropogenic).
 Regular rainfall will counteract the accumulation of pollutants on the roofs, the water in the tank will
Regular rainfall will counteract the accumulation of pollutants on the roofs, the water in the tank will
 be “overflowing” and overhead, which is conducive to maintaining its good quality. The collected
be “overflowing” and overhead, which is conducive to maintaining its good quality. The collected
 water will not require any advanced treatment but only filtration. If climate change worsens, extreme
water will not require any advanced treatment but only filtration. If climate change worsens, extreme
 climate events such as aridity, droughts, floods or storms rainfall are expected. A dry climate and
climate events such as aridity, droughts, floods or storms rainfall are expected. A dry climate and
 rare rainfall will promote the accumulation of pollutants on the roof, including heavy metals from
rare rainfall will promote the accumulation of pollutants on the roof, including heavy metals from
 polluted air. Acid rainfall will drastically deteriorate the quality of rainwater flowing into the tank.
polluted air. Acid rainfall will drastically deteriorate the quality of rainwater flowing into the tank.
 The accumulated water may be completely unsuitable for domestic use. In a favorable scenario it can
The accumulated water may be completely unsuitable for domestic use. In a favorable scenario it can
 also be predicted that the water will have an appropriate chemical composition with low biological
also be predicted that the water will have an appropriate chemical composition with low biological
 activity. It will be suitable to be kept in tanks for domestic use, including washing.
activity. It will be suitable to be kept in tanks for domestic use, including washing.

4. Conclusions
        On the basis of the results of the research carried out the following conclusions were drawn:
       The stored rainwater contains pollutants flushed from roofing and atmosphere. This is in
You can also read