Evaluation of Nine Low-cost-sensor-based Particulate Matter Monitors
←
→
Page content transcription
If your browser does not render page correctly, please read the page content below

Aerosol and Air Quality Research, 20: 254–270, 2020
Copyright © Taiwan Association for Aerosol Research
ISSN: 1680-8584 print / 2071-1409 online
doi: 10.4209/aaqr.2018.12.0485

Evaluation of Nine Low-cost-sensor-based Particulate Matter Monitors

Jiayu Li1#, Simar K. Mattewal1,2#, Sameer Patel1,3, Pratim Biswas1*
1
  Aerosol and Air Quality Research Laboratory, Department of Energy, Environmental and Chemical Engineering,
Washington University in St. Louis, St. Louis, MO 63130, USA
2
  Indian Institute of Technology Delhi, New Delhi 110016, India
3
  University of Colorado, Boulder, CO 80309, USA

ABSTRACT

   Due to their affordability, compact size, and moderate accuracy, low-cost sensors have been studied extensively in
recent years. Different manufacturers employ different calibration methodologies and provide users with calibration
factors for their models. This study assessed the performance of nine low-cost PM monitors (AirVisual, Alphasense, APT,
Awair, Dylos, Foobot, PurpleAir, Wynd, and Xiaomi) in a chamber containing a well-defined aerosol. A GRIMM and a
SidePak were used as the reference instruments. The monitors were divided into two groups according to their working
principle and data reporting format, and a linear correlation factor for the PM2.5 mass concentration measurement was
calculated for each monitor. Additionally, the differences between the mass concentrations reported by the various
monitors and those measured by the reference instruments were plotted against their average before and after user
calibration to demonstrate the degree of improvement possible with calibration. Bin-specific calibration was also
performed for monitors reporting size distributions to demonstrate coincidence errors that could bias the results. Since
monitors designed for residential use often display the air quality index, typically illustrating it with a simplified, color-
coded index, the color schemes of various monitors were evaluated against the U.S. EPA regulation to determine whether
they could convey the overall air quality accurately and promptly. Although these residential monitors indicated the air
quality moderately well, their differing color schemes made the evaluation difficult and potentially inaccurate. Altogether,
the tested monitors offer low-cost sensors in packages that are convenient for use and ready for deployment without
additional assembly. However, to improve the accuracy of the measurements, user-defined calibration for the target PM
source is still recommended.

Keywords: Low-cost PM monitors; Residential application; Calibration and characterization; Air quality index.

INTRODUCTION                                                       Cohen et al., 2005; Burnett et al., 2014). It has been reported
                                                                   that when the mass concentration of fine particulate matter
   As a major atmospheric pollutant, particulate matter (PM)       (PM2.5, particulate matter with a diameter < 2.5 µm) increases
has adverse health effects; therefore, it is routinely monitored   by about 10 µg m–3, the risk of lung cancer mortality
to reduce the harm it causes. In 2013, PM was classified as        increases by approximately 8% (Pope III et al., 2002). Due
a Group 1 carcinogen by the International Agency for               to these adverse health effects, stringent regulations on PM
Research on Cancer (IARC), and has been associated with            mass concentration have been enacted and enforced by
lung cancer, premature mortality, cardiopulmonary diseases,        governments and local agencies. The standards for the annual
and cardiovascular diseases (Valavanidis et al., 2008; Brook       PM2.5 concentration were set as 12 µg m–3 and 10 µg m–3
et al., 2010; Stewart and Wild, 2017). PM pollution accounts       by the United States Environmental Protection Agency
for nearly 1.2 million premature deaths and approximately          (U.S. EPA) and the World Health Organization (WHO)
6.4 million annual deaths globally (Smith and Mehta, 2003;         respectively (WHO, 2005). Apart from the PM concentration
                                                                   standard, the U.S. EPA also specified the gravimetric
                                                                   method as the Federal Reference Method (FRM) for PM
                                                                   mass concentration measurement. The gravimetric method
#
    These authors contributed equally to this work.                calculates the PM mass concentration by weighing the
                                                                   particles accumulated on a filter over a period of time. This
*
    Corresponding author.                                          conventional method has been considered to be one of the
    Tel.: +1-314-935-5548; Fax: +1-314-935-5464                    most reliable methods for PM mass concentration
    E-mail address: pbiswas@wustl.edu                              measurement; nevertheless, maintaining the system and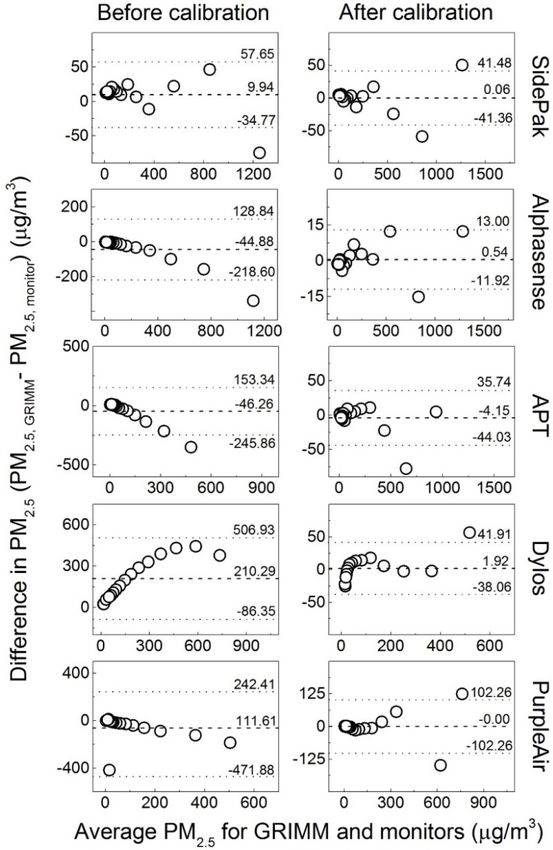
Li et al., Aerosol and Air Quality Research, 20: 254–270, 2020                              255

weighing filters are laborious. Furthermore, the gravimetric        as we elaborate in the following section.
method is not real-time measurement and can report only                Low-cost PM monitors, whose major components are low-
the accumulative PM mass concentration. The cost and                cost PM sensors, are usually assembled and pre-calibrated
labor required by the gravimetric method have hindered              before distribution to users. Compared to conventional PM
the application of this method for personal use. Alternative        measurement instruments, they still have an appealing
measurement methods, for example, TEOM, GRIMM,                      price advantage; however, accuracy is still a major
FIMS, and SMPS, can measure real-time PM concentration              concern. Compared to just the PM sensors, the assembled
accurately, but still face the challenges of high cost and          monitors’ price is higher, but these monitors are advertised
long-term stability (Allen et al., 1997; Sioutas, 1999; Klepeis     with enhanced data quality and stability due to improved
et al., 2007; Wang et al., 2018).                                   algorithms and advanced factory calibration. Occasionally,
   As a potential alternative method for PM concentration           these monitors have even been chosen as reference
measurement, low-cost PM sensors have been studied                  instruments to calibrate low-cost sensors. The Air Quality
extensively in recent years (White et al., 2012; Kumar et           Sensor Performance Evaluation Center (AQ-SPEC), a unit
al., 2015; Rai et al., 2017; Morawska et al., 2018).                of the South Coast Air Quality Management District
Compared to bulky laboratory instruments costing up to              (SCAQMD), has evaluated the majority of commercial
thousands of dollars, palm-sized low-cost sensors usually           monitors for multiple sources (Polidori et al., 2017). They
cost less than fifty dollars. It should be noted that the term      have also built a calibration chamber that can maintain a
“low-cost PM sensor” refers only to the opto-electrical             stable and reproducible test environment (Papapostolou et
sensing module, such as popular models made by Sharp,               al., 2017). Several popular monitors have been highlighted
Shinyei, Samyoung, Oneair, and Plantower (Wang et al.,              recently. The Dylos DC1700 Air Quality Monitor (Dylos
2015; Sousan et al., 2016b; Kelly et al., 2017; Liu et al.,         Corp., Riverside, CA, USA) has been evaluated for
2017). To make low-cost PM sensors functional, circuit              different scenarios and has been deployed in indoor and
board design, programming, and calibration are necessary            outdoor environments (Semple et al., 2013; Holstius et al.,
to establish the relationship between electrical signals            2014; Dacunto et al., 2015; Manikonda et al., 2016; Rai et
(current, voltage, or pulse width) and the PM concentrations.       al., 2017). The Alphasense OPC-N3 particulate monitor
After assembly and laboratory calibration, low-cost PM              (Alphasense Ltd., Great Notley, UK) has been evaluated
sensors exhibit good linearity against reference instruments,       focusing on its ability to accurately report the mass
showing high potential for personal PM monitors and                 concentration of PM1, PM2.5, and PM10 (Sousan et al., 2016a;
sensor networks (Wang et al., 2015).                                Crilley et al., 2018). The PurpleAir PA-II-SD Air Quality
   Currently, research on low-cost PM sensors mainly focuses        Sensor (PurpleAir, UT, USA) has demonstrated good
on two aspects: interpreting their signal comprehensively           linearity against reference instruments for both laboratory
through calibration or characterization and modifying them          calibration and ambient field measurement (Kelly et al.,
for personal or sensor network use. Several groups have             2017). Several other low-cost monitors have also been
tried to explain the deficiencies and limitations of low-cost       evaluated and compared in different studies, including the
sensors due to their working principles (Li and Biswas,             AirVisual Node (AirVisual, Inc., USA), APT low-cost
2017; Zhang et al., 2018). Some studies also calibrated a           monitor (Applied Particle Technology, MO, USA), Awair
variety of low-cost PM sensors for different aerosol                air quality monitor (Bitfinder, Inc., CA, USA), Foobot
sources (e.g., NaCl, Arizona Road Dust [ARD], sucrose,              (Airboxlab, San Francisco, CA, USA), wearable Wynd Air
silica, welding fumes, and diesel fumes) in different test          Quality Tracker (Wynd Technologies, Inc., CA, USA), and
environments (laboratory, residential, and ambient) to              Xiaomi Mi PM2.5 Detector (Beijing Ji Mi Electronics
identify the optimal performance and favorable working              Technology Co., Ltd., China) (Sousan et al., 2017; Moreno-
conditions of each type of sensor (Wang et al., 2015;               Rangel et al., 2018; Singer and Delp, 2018).
Manikonda et al., 2016; Sousan et al., 2016a, b; Kelly et              Although low-cost PM monitors have been well
al., 2017; Liu et al., 2017; Rai et al., 2017; Zikova et al.,       characterized, the studies reflect inherent limitations. First,
2017; Aliyu and Botai, 2018; Johnson et al., 2018; Hapidin          there is no specified boundary between low-cost PM
et al., 2019). These studies demonstrated the advantages            monitors and low-cost PM sensors. Occasionally, low-cost
and limitations of these sensors and laid a solid foundation        PM monitors are used as reference instruments to calibrate
for further deployment and application. Wireless sensors            low-cost PM sensors. At other times, they are treated the
or sensor networks, as one major application, have been             same as low-cost PM sensors. It is necessary to distinguish
deployed in households, meeting rooms, factories, cities,           low-cost PM monitors from low-cost PM sensors according
etc. to monitor the dynamic process of pollution events             to the differences mentioned above. However, it is still
with high spatiotemporal resolution (Kim et al., 2010; Kim          uncertain whether they are qualified enough as a reference
et al., 2014; Rajasegarar et al., 2014; Leavey et al., 2015;        instrument. Second, calibration methods for low-cost PM
Patel et al., 2017; Jeon et al., 2018; Li et al., 2018). Some       monitors are very likely different, but differences are not
of these studies have explored in depth the algorithms for          highlighted in the literature. For low-cost PM sensors, a
organizing sensor data and extracting the maximum                   user calibration procedure will establish the relationship
effective information (He et al., 2018; Li et al., 2018).           between the PM concentration and an electrical signal
Apart from use in sensor networks, low-cost PM sensors              (e.g., current, voltage, or pulse width). Hence, the major
find another important application as low-cost PM monitors,         concern is whether low-cost PM sensors can correlate well
256                                 Li et al., Aerosol and Air Quality Research, 20: 254–270, 2020

with reference instruments. However, for low-cost PM                 distribution for sorting into multiple bins. When particles
monitors, the correlation is between PM concentrations               pass through the measurement area one at a time, the
reported by monitors and the reference instrument, and a             scattered light generates a pulse that is detected by a
larger concern is whether the agreement between monitors             photodiode, and then the particle size is classified according
and the reference instrument is good enough. Hence, linear           to the pulse height. The particle sensing modules of the
or polynomial regression may not be sufficient to                    AirVisual, Awair, Foobot, Wynd, and Xiaomi monitors report
demonstrate the accuracy of these low-cost PM monitors.              an analog measurement of the total mass concentration.
Third, an important function of some residential monitors            Particles that pass through the measurement area at the
is indicating air quality through a color change, which is a         same time scatter light onto the photodiode and the detected
straightforward display. However, few studies have examined          light intensity can be correlated with the PM concentration.
whether a color indicator can convey air quality information            Among the first group, the APT and PurpleAir are
accurately and promptly. To bridge the scientific gap, in            equipped with a Plantower single-particle sensing module
this study, the performance of nine types of popular low-            (Plantower Co., Ltd., Beijing, China). The Alphasense and
cost PM monitors was compared, including devices from                Dylos have their own custom-designed sensing modules.
AirVisual Pro, Alphasense, APT, Awair, Dylos, PurpleAir,             Due to the differences between modules, the data reporting
Foobot, Wynd, and Xiaomi. One monitor from each brand                formats of each monitor are different. The APT and PurpleAir
was tested in the laboratory experiments. These monitors             monitors, using the low-cost Plantower sensor, report the
were divided into two groups according to their number of            size distribution of particles ranging from 0.3–10 µm in
channels and type of metrics. As for reference instruments,          6 bins. The Alphasense has a better resolution and reports
GRIMM (11C; GRIMM Technologies, Inc., GA, USA)                       the sizes ranging from 0.3–38 µm in 24 bins. The Dylos
and TSI SidePak (AM530; TSI Inc., MN, USA) were                      has only 2 bins for particles larger than 0.5 µm and 2.5 µm
chosen to evaluate these monitors. A chamber was built to            respectively. To make the Dylos results comparable with
provide an adjustable test environment with approximately            other monitors in the first group, the number concentration
well-mixed and evenly distributed PM concentrations,                 of the second bin (> 2.5 µm) was subtracted from that of the
together with humidity and temperature control.                      first bin (> 0.5 µm) to represent the number concentration
                                                                     of particles smaller than 2.5 µm. The Alphasense, APT, and
METHODS                                                              PurpleAir not only report the size distribution in the unit of
                                                                     number concentration, but also report mass concentrations
   In this study, nine popular low-cost personal PM monitors         of PM1, PM2.5, and PM10.
were compared against two reference instruments. The                    For data logging, Alphasense and Dylos do not have a
specifications and metrics of the different monitors were            wireless module; hence they need to be connected to a
compared, as were their features for convenient application.         computer to display real-time data. The PurpleAir and
The procedure to compare monitors with different                     APT monitors can upload data to a manufacturer-provided
specifications and metrics will be elaborated in this section.       webpage through a Wi-Fi module. The Alphasense, APT,
A chamber with temperature and humidity control was                  and PurpleAir also have internal off-line data logging
designed to provide a well-mixed and evenly distributed              system that can record the data on a microSD card in case
flow for calibration experiments. The mixing performance             of connection malfunction. The sampling interval of the
of the chamber was examined at random locations to                   APT is adjustable, and in our study was set at 1 minute to
demonstrate its workability. With the temperature around             be consistent with the Dylos and GRIMM. The Alphasense
23 ± 0.5°C and relative humidity around 50 ± 4%, three               reported data every 1 second, and the data were averaged
types of aerosols—ARD particles, sea salt particles, and             over 1 minute too. The PurpleAir has a fixed sampling
incense particles—were generated from dust dispenser,                interval of 80 seconds; hence the data were interpolated to
atomizer, and burning incense to evaluate the performance            get a 1-minute sampling interval.
of different monitors.                                                  The monitors in the second group are targeted for
                                                                     residential use; hence they are cheaper and smaller, with
Specifications of Low-cost PM Monitors and Reference                 an attractive appearance and a straightforward display.
Instruments                                                          Apart from PM mass concentration, the AirVisual, Awair,
   Table 1 lists the specifications of all low-cost PM               and Foobot also monitor the CO2 or VOC concentrations
monitors tested in this study. Although some of the monitors         for a more comprehensive air quality measurement. Since
(for example, the Alphasense and Dylos) have been utilized           they are designed for residential use, important features, for
as reference instruments to calibrate low-cost PM sensors            example, the sampling interval or working principle, are
as reported in the literature (Rajasegarar et al., 2014; Prabakar    not explained thoroughly in the manufacturer’s descriptions.
et al., 2015; Gao et al., 2016; Hojaiji et al., 2017), we treated    For data logging, all five monitors have a wireless module,
all of them as test units since there are no significant price       a Bluetooth chip for the Wynd and a Wi-Fi chip for the
differences between them and other tested monitors.                  rest of the monitors, to synchronize the data to a tablet or
Monitors were classified into two groups on the basis of             phone applications. For the AirVisual and Foobot, after data
their working principle and metrics. The Alphasense, APT             is synchronized with the application, it can be accessed
(Applied Particle Technology Minima), Dylos, and PurpleAir           online with a 10-minute and a 5-minute interval respectively.
all use a single-particle counter which measures the size            However, for other monitors, historical data is not accessible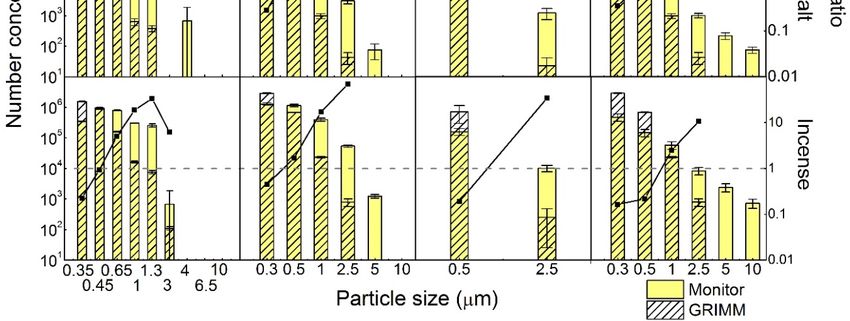
Table 1. Specifications of low-cost PM monitors.
Monitor Cost ($) Size (cm) Metrics Data logging Selected references
Group I Alphasense 506 8 × 6 × 6 24 bins (0.35–40 µm) (# mL–1) Cable + computer software Sousan et al. (2016a)
–3
PM1, PM2.5, and PM10 (µg m ) microSD card Hojaiji et al. (2017)
RH & T (% & °C) Rai et al. (2017)
Crilley et al. (2018)
Zhang et al. (2018)
APT N/A 10 × 9 × 3 6 bins (0.3–10 µm) (# 0.1L–1) Wi-Fi + webpage N/A
PM1, PM2.5, and PM10 (µg m–3) microSD card
RH & T (% & °C)
Dylos 425 19 × 13 × 9 2 bins (> 0.5 µm, > 2.5 µm) (# ft–3) Cable + computer software Dacunto et al. (2015)
Semple et al. (2013
Manikonda et al. (2016)
Sousan et al. (2016b)
Hojaiji et al. (2017)
Rai et al. (2017)
PurpleAir 259 5×4×2 6 bins (0.3–10 µm) (# 0.1 L–1) Wi-Fi + webpage Morawska et al. (2018)
PM1, PM2.5, and PM10 (µg m–3) microSD card Singer and Delp (2018)
RH & T (% & °F) Kelly et al. (2017)
Group II AirVisual 269 21 × 12 × 8 PM2.5 (µg m–3) Wi-Fi + App Morawska et al. (2018)
CO2 (ppb) Retrieval through node ID Singer and Delp (2018)
RH & T (% & °F)
AQI + color (N/A)
Awair 200 16 × 9 × 5 PM2.5 (µg m–3) Wi-Fi + App Singer and Delp (2018)
CO2 (ppm)
VOC (ppb)
RH & T (% & °F)
AQS + color (N/A)
Li et al., Aerosol and Air Quality Research, 20: 254–270, 2020
Foobot 200 17 × 8 × 7 PM2.5 (µg m–3) Wi-Fi + App Sousan et al. (2017)
CO2 (ppm) Retrieval through web login Moreno-Rangel et al. (2018)
VOC (ppb) Singer and Delp (2018)
RH & T (% & °C)
AQI + color (N/A)
Wynd 79 7×4×2 PM2.5 (µg m–3) Bluetooth + App N/A
AQI + color (N/A)
Xiaomi 75 6×6×3 PM2.5 (µg m–3) Wi-Fi + App N/A
Color (N/A)
257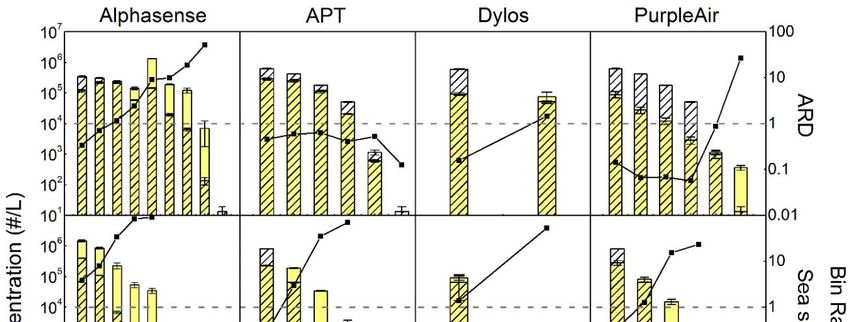
258                               Li et al., Aerosol and Air Quality Research, 20: 254–270, 2020

since it is not saved. Our study circumvented this problem         be correlated directly with different monitors. GRIMM, as
by video recording the screen with the app running to              a Federal Reference Method (FRM), is a single-particle
record the data and time. The data were manually extracted         counter that measures the sizes of PM ranging from 0.25–
and averaged over 1-minute intervals. Apart from measuring         32 µm and reports the distribution in 31 bins. A bin-wise
PM concentrations, these monitors also report an air               comparison, as shown in Fig. 1, was conducted for the
quality-related index and use different colors to display the      monitors of the first group to demonstrate the accuracy of
air quality more straightforwardly.                                their size distribution measurements. Compared to APT,
   Comparing different data logging methods of all tested          Dylos, and PurpleAir, the Alphasense has more bins and a
low-cost PM monitors, a Wi-Fi module or a Bluetooth                different distribution; therefore, common ranges for the
module can synchronize the data remotely and conveniently          Alphasense and GRIMM were selected for bin-wise
as opposed to connections with cables. Generally, monitors         calibration. The APT, Dylos, and PurpleAir use fewer bins
with a Bluetooth module can be configured more easily              than the GRIMM; hence several GRIMM bins were summed
than monitors with a Wi-Fi module, since the Wi-Fi module          to enable comparison.
usually requires a specific type of wireless internet. The
Bluetooth module can be connected to user applications             Air Quality-related Index and Color Display
straightforwardly; however, the data transfer relies on the           The second group of monitors, the AirVisual, Awair,
user-end application and is restricted in a confined space.        Foobot, Wynd, and Xiaomi, used both numeric indexes
On the other hand, monitors with the Wi-Fi module can              and color display to report the air quality. Foobot gives a
continue collecting the data even without running user-end         simplified numeric index on a scale of 0 to 100 indicating
applications, which allows long-term and remote data               air quality ranging from healthy to poor. The Awair presents
collection. The transferred data can then be accessed through      an air quality score (AQS), and AirVisual and Wynd present
user-end applications (AirVisual, Awair, Foobot, Wynd,             the air quality index (AQI). The AQS is scaled from 0 to
and Xiaomi), through web portals (AirVisual, APT, Foobot,          100 to indicate the air quality from poor to healthy.
and PurpleAir), or through computer software (Alphasense           However, neither the product manual nor the literature
and Dylos).                                                        describes how the AQS is calculated. Compared to the
   To compare monitors with different working principles,          AQS, the AQI is a more common parameter for presenting
GRIMM and SidePak were chosen as reference instruments.            the potential airborne hazards. The component species and
SidePak reported the PM2.5 mass concentration, which can           calculation details of the AQI vary with local regulations,

Fig. 1. Bin classification for monitors in the first group (Alphasense, APT, Dylos, and PurpleAir) in bin-wise comparison
against the GRIMM. The dash-dot line and dashed line represent the bin distribution of each monitor and the GRIMM
respectively. The 31st bin of GRIMM (> 32 µm) is not depicted in this figure. The thick box represents the common range
of combined bins for comparison.
Li et al., Aerosol and Air Quality Research, 20: 254–270, 2020 259
but normally, several common air pollutants are included: HEPA filter, and a flow controlled vacuum pump was used
PM, ozone, VOC, carbon monoxide, and sulfur dioxide to adjust the flow rate (2–15 L min–1) and to control the
(Gao et al., 2015; Hu et al., 2015; U.S. EPA, 2016). A high PM concentration level inside. The interior included a
AQI indicates an unhealthy environment, and the AQI mixing area and a test area, separated by two baffles with a
range from low to high is divided into 6 segments with matrix of 1-inch holes. In the mixing area, two fans were
numeric index ranging from 0 to 500 that describes the used to improve air circulation. A humidifier and a cartridge
overall air quality, from excellent to heavily polluted. Since heater in the mixing area were connected to a humidity
PM is the major object of this study, the AQI mentioned in sensor and a temperature sensor in the test area to maintain
the following section is calculated based on the PM mass the temperature and humidity in the test area at 23 ± 0.5°C
concentration, following the U.S. EPA regulations published and 50 ± 4% respectively. Particles, heat, and humidity
in 2016 (U.S. EPA, 2016). were mixed with distorted streamlines. After sufficient
Compared to numeric indexes, color is a more mixing, the streamlines passed through two baffles with
straightforward way of showing air quality. The U.S. EPA densely spaced holes to form an evenly distributed laminar
divides the AQI into 6 sections, and each section has a flow passing through the test area. During the experiments,
signal color (green indicates “good,” yellow is “moderate,” monitors of the same group and the SidePak were placed
orange means “unhealthy for sensitive groups,” red represents on the lower-level baffle, and the GRIMM was placed
“unhealthy,” purple indicates “very unhealthy,” and maroon outside the chamber but connected to the test area. The
stands for “hazardous”). Ideally, all monitors would use monitors of the first group (Alphasense, APT, Dylos, and
the same color scheme of the AQI, which would make the PurpleAir) and the SidePak were placed on the lower-level
results directly comparable. In reality, only the AirVisual baffle as shown in Fig. 3(b). The monitors of the second
follows the AQI color distribution. The Awair, Foobot, group (AirVisual, Awair, Foobot, Wynd, and Xiaomi) and
Wynd, and Xiaomi monitors assign colors according to the SidePak were placed on the lower-level baffle as
their own schemes, as shown in Fig. 2. For example, the shown in Fig. 3(c). To avoid the edge effect, all monitors
Foobot uses just 2 colors, blue and orange, and Xiaomi were placed within 20 cm from the center. Monitors in
monitor has only 3 colors, green, yellow, and red. To Figs. 3(b) and 3(c) were arranged approximately the same
examine whether the color display properly conveys the air distance from the center, and their inlets were directed
quality message, the U.S. EPA regulated AQI was first toward the center.
calculated based on the PM concentration reported by the Incense particles were generated by burning a cone stick
GRIMM, and the AQI-designated color was used to incense (Surya Devya Enterprises) near the inlet, and they
represent the air quality. The colors reported by the various enter the chamber with the inlet flow. Sea salt particles
monitors were recorded at the same time for comparison. were generated by atomizing sea salt solutions (sea salts
Ideally, all the colors would be both identical and accurate (S9883-1KG; Sigma-Aldrich®, MO, USA) and deionized
representations of the GRIMM-reported PM concentration. water) with an aerosol generator (Model 3076; TSI Inc., MN,
USA). For Arizona Road Dust particles, commercial powders
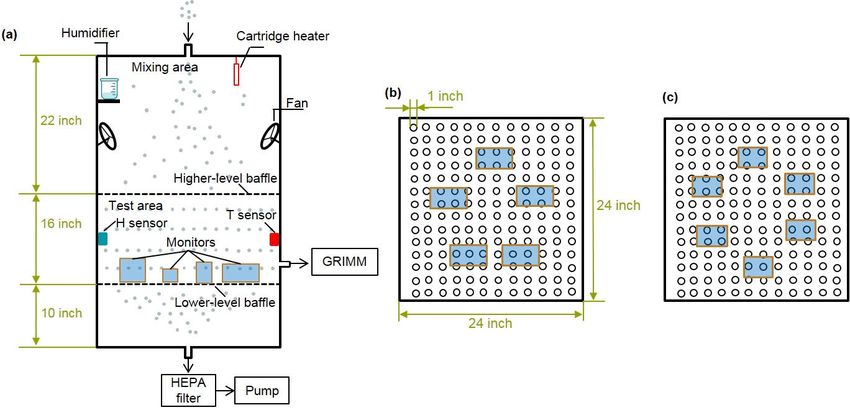
Test Chamber and Aerosol Sources (A1 Ultrafine Test Dust; Powder Technology Inc., MN,
A chamber was designed according to Fig. 3(a) to provide USA) were suspended by a fluidized-bed aerosol generator
a well-mixed and evenly distributed PM flow as the test (Model 3400A; TSI Inc., MN, USA). A T-connector was
environment. The aerosol was introduced to the chamber used to connect the aerosol generator with the chamber
through the inlet on the top and then ventilated through the inlet, and one port of the T-connector was left open to
outlet on the bottom. The exhaust air was filtered by a balance the flow rate. The normalized mass distribution of
Fig. 2. Color display pattern of each monitor and U.S. EPA stipulated display.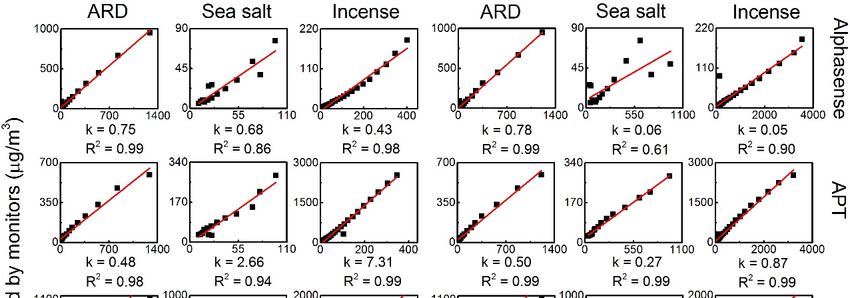
260                               Li et al., Aerosol and Air Quality Research, 20: 254–270, 2020

Fig. 3. (a) The schematic diagram of the chamber used in this study for testing monitors. The chamber provided a well-
mixed and evenly distributed PM flow. (b) The monitors of the first group (Alphasense, APT, Dylos, and PurpleAir) and
the SidePak were placed on the lower-level baffle as shown. (c) The monitors of the second group (AirVisual, Awair,
Foobot, Wynd, and Xiaomi) and the SidePak were placed on the lower-level baffle as shown.

each source was reported by GRIMM, as shown in Fig. 4.             Test Agreement between Monitors and Reference
Incense particles and sea salt particles peaked around 0.5         Instruments
and 0.3 µm respectively. ARD particles were larger and                Conventional methods usually use the correlation
peaked around 2–4 µm. In experiments, the PM concentration         coefficient (R2) to evaluate the performance of low-cost PM
was allowed to increase in the chamber after which the PM          sensors. R2 values can demonstrate the linearity between
source was removed. The monitors were tested during the            monitors and reference instruments; however, they cannot
decay of the PM concentration. The space occupied by the           demonstrate the agreement between instruments. Bland
monitors and the reference instrument was much smaller             and Altman (1986) have demonstrated a method to evaluate
than the volume of the chamber (453 L), and thus no                the agreement between new techniques and established
disturbance in the PM levels is expected.                          instruments, and this method has been used to examine
   Using incense particles, the uniformity of the PM               whether an instrument is a qualified substitute for the
distribution in the test area was examined by the SidePak          reference instrument (Bland and Altman, 1986, 2003; Astrua
and the APT monitor. While the spatial distribution could          et al., 2007). The same method was used in this work to
not be measured by the APT and SidePak monitors due to a           examine the performance of SidePak and the first group of
time dependent PM profile, they provided similar responses.        monitors (Alphasense, APT, Dylos, and PurpleAir). The
Thus, the assumption of spatial uniformity of PM                   GRIMM monitor and ARD particles were selected as the
distribution is reasonable. To validate this assumption, the       reference instrument and the PM source respectively. The
response from the APT monitor was correlated with that             differences between the PM2.5 mass concentrations reported
from the SidePak via a linear regression under 500 µg m–3          by monitors and GRIMM were plotted against their
concentration level. The whole procedure was repeated              average to show the agreement between the monitors and
three times by placing the SidePak monitor and the APT             the reference instrument before calibration. The average of
monitor at different locations surrounding the center of the       the differences (σ) and the standard deviation of the
low-level baffle at an approximately similar distance. In all      differences (SD) were calculated for each monitor. A
three tests, the response from the APT monitor correlated          smaller absolute value of σ and a narrower boundary (4SD)
well with SidePak, and the slopes from different tests were        indicate a better data quality.
approximately similar 0.847 (R2 = 0.985), 0.867 (R2 = 0.984),         To demonstrate the difference in the performance before
and 0.897 (R2 = 0.986). The average and the standard               and after calibration, a similar procedure was repeated for
deviation of the slopes from all three tests were 0.870 and        monitors post calibration. All monitors were calibrated
0.0252 respectively. Such a small standard deviation               according to either linear regression (SidePak, APT, and
indicated that the PM was approximately well mixed and             PurpleAir) or secondary polynomial regression (Alphasense
evenly distributed in the test area.                               and Dylos) to obtain an R2 value larger than 0.96. The
                                                                   data reported by monitors from direct measurements were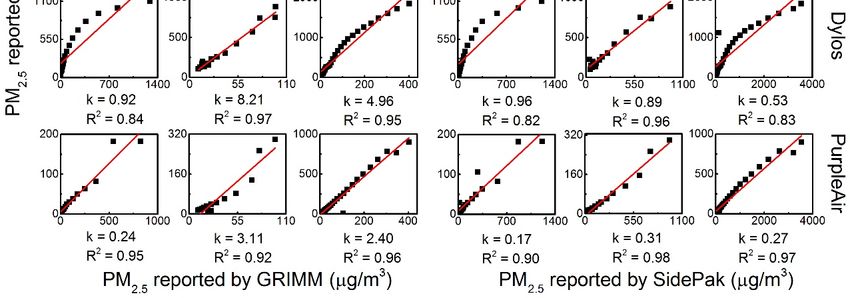
Li et al., Aerosol and Air Quality Research, 20: 254–270, 2020 261
Fig. 4. Normalized mass concentration distributions of ARD particles, sea salt particles, and incense particles generated
during the experiments, measured by GRIMM.
re-calculated with calibration equations. After calibration, Particles in this range were supposed to be classified into
the differences between the PM2.5 mass concentrations the small bin; however, they may have been accidentally
reported by calibrated monitors and GRIMM were plotted classified into the large bin. Misclassification can influence
against their average, and the σ and SD were re-calculated data accuracy, which results in a noticeable delay. According
for the post-calibration dataset. to the number-based size distribution, approximately 30% of
the ARD particles fall in the range of 0.5–2.5 µm, but only
RESULTS AND DISCUSSION 6% of incense particles and 1% of sea salt particles fall in
this range. Thus, the delay is noticeable for ARD particles
Alphasense, Dylos, APT, and PurpleAir Monitors but almost negligible for incense and sea salt particles.
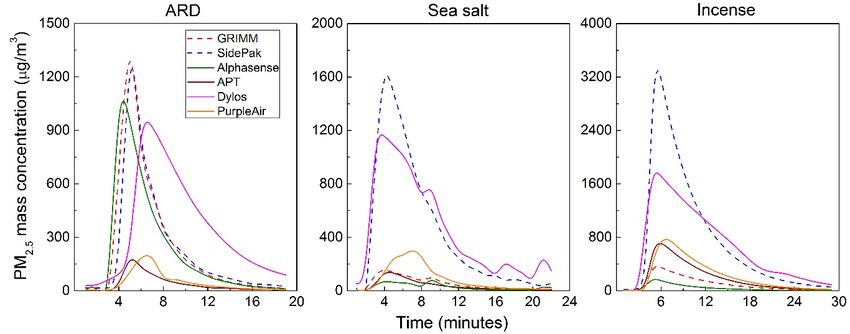
Time Response and Correlation Based on PM2.5 Mass The PM2.5 mass concentration reported by each monitor
Concentration was also plotted against the reference instruments for
The PM2.5 mass concentrations reported by monitors and pairwise correlation, as shown in Fig. 6. These monitors had
reference instruments for different PM sources are plotted been pre-calibrated; hence better accuracy was expected.
with time in Fig. 5, with a 1-minute sampling interval. The Apart from a high R2 value, a slope value approximate to 1
red and blue dashed lines represent the GRIMM and was expected to demonstrate the agreement between
SidePak respectively, and the solid lines with different monitors and reference instruments. A slope larger or
colors represent different low-cost PM monitors. For ARD smaller than 1 represents a monitor’s overestimation or
particles, the GRIMM and SidePak overlapped well with underestimation of the PM2.5 mass concentration compared
each other, since they were both calibrated with ARD to the reference instruments, respectively. The APT and
particles in their factory calibrations. While the GRIMM PurpleAir demonstrated good linearity for various sources,
and SidePak responded simultaneously for incense and sea with all R2 values larger than 0.94 and 0.91 respectively.
salt particles, their indicated PM levels were different. For the Dylos, linear regression may not be the optimal
Such a difference might be due to the different working fitting method. For the Alphasense, the data slopes were
principles: The GRIMM is a single-particle counter, but the stable when compared against the GRIMM for different
SidePak performs ensemble measurement. Other monitors sources. One thing worth noting is that the linear correlation
also responded simultaneously to PM concentration may not be sufficient to demonstrate agreement between
fluctuations for incense and sea salt particles, although monitors and reference instruments. It cannot demonstrate
there was a difference among peak values. However, for how data quality has been improved after calibration.
ARD particles, a noticeable delay was found for the Dylos Thus, we plotted the data in a different manner, which will
monitor in repeated tests. Two reasons may lead to such a be illustrated in a later section.
delay. First, the other monitors directly reported the mass
concentration of PM2.5, but for the Dylos monitor, the large Bin-wise Evaluation for Size Distribution Measurement
bin (> 2.5 µm) was subtracted from the small bin (> 0.5 µm) Based on the bin classification in Fig. 1, we plotted the
to calculate the number concentration of particles from number concentration reported by the GRIMM and the
0.5–2.5 µm. Then, the number concentration was converted tested monitors for different bins in Fig. 7. The dashed line
to the mass concentration by assuming all these particles in the figure represents the 1:1 ratio, where the monitors
were 2.5 µm, with a density of 1200 kg m–3. This method and the GRIMM reported the same results. For comparison,
did not consider the particles smaller than 0.5 µm and used figures of the same source were plotted under the same
the 2.5 µm diameter to represent all particles between 0.5– scales, except for the correlation between the Dylos and
2.5 µm, which might introduce errors into the results, the GRIMM for incense measurement. The legends of
leading to a visual delay. Another possible reason is the different monitors are displayed on the rightmost position
misclassification of particles ranging from 0.5–2.5 µm. of each row.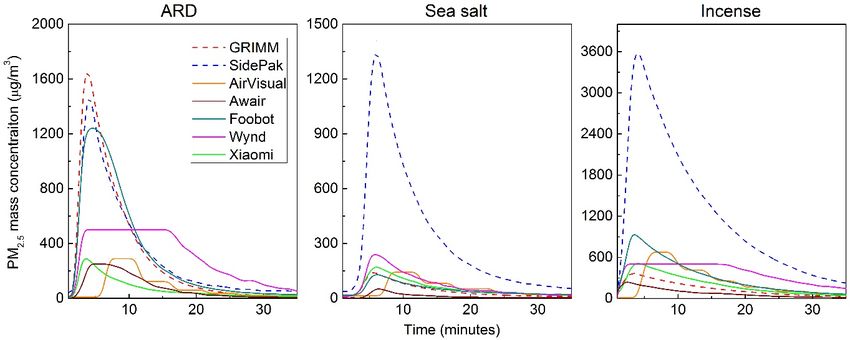
262                              Li et al., Aerosol and Air Quality Research, 20: 254–270, 2020

   In Fig. 7, Alphasense demonstrates an overestimation           with increasing PM concentration, especially for ARD and
for tested sources. One more thing worth noting is that           incense particles. Such an inverted U-shape may be caused
after saturation, the response from Alphasense decreased          by the coincidence error that several small particles passed

Fig. 5. The PM2.5 mass concentration variation against time for different aerosol sources, reported by reference instruments
(GRIMM and SidePak) and monitors (Alphasense, APT, Dylos, and PurpleAir monitors).

Fig. 6. Pairwise correlation among the monitors (Alphasense, APT, Dylos, and PurpleAir) and the reference instruments
(GRIMM and SidePak) for ARD, sea salt, and incense particles. Slope and R2 values were calculated by least squares
regression.
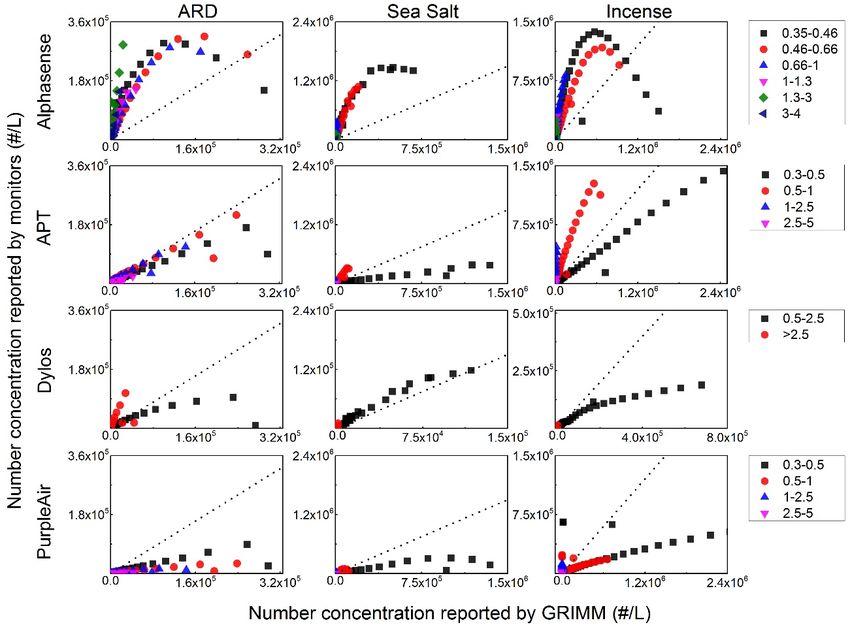
Li et al., Aerosol and Air Quality Research, 20: 254–270, 2020                             263

Fig. 7. Bin-wise number concentration comparison of monitors (Alphasense, APT, Dylos, and PurpleAir) and the
reference instrument (GRIMM) for different sources in different concentration ranges.

the measuring point at the same time and were characterized        may oversimplify the situation. In Fig. 7, most of the data
as a larger particle by mistake. Coincidence error may lead        points could not fall in a narrow range, indicating that no
to an inaccurate size distribution due to the underestimation      unique calibration factors could be applied for all different
and overestimation for small and large particles respectively.     channels. Instead, different calibration factors from bin-wise
However, the PM mass correlation in Fig. 6 was not largely         size distribution calibration may produce better accuracy.
influenced by such coincidence error since the misclassified       However, a bin-wise calibration may lower the resolution
large particles made up the mass loss of small particles.          since common ranges between the monitors and the
The APT monitor showed a very close estimation for ARD             reference instruments need to be selected. In addition, the
particles; however, for sea salt and incense particles, there      bin-wise calibration may be influenced by the PM
was an underestimation and overestimation for 0.3–0.5 µm           composition too, since the composition will influence the
and 0.5–1 µm particles respectively. Dylos predicted a             size characterization, which makes the situation more
very close estimation for sea salt particles; however, it          complicated.
underestimated ARD and incense particles for smaller bins,            To demonstrate a more straightforward comparison, the
and overestimated ARD particles for larger bins. PurpleAir         size distribution reported by different monitors and the
monitor demonstrated an underestimation for tested sources.        GRIMM is displayed in Fig. 8. Three samples under an
   Fig. 7 also gives a clue on the question whether the            approximately stable and high PM concentration were
calibration procedures should be the same for the optical          selected for different sources, and the number concentrations
particle counters and the monitors performing ensemble             reported by the GRIMM and the tested monitors were
measurement. For sensors performing ensemble                       plotted in shaded and yellow columns, respectively, on the
measurement, calibration procedures established the one-           left y-axis. The bin ratio, which is the ratio of the number
to-one relationship between the sensor output and the PM           concentration reported by the monitors to that reported by the
concentration level. However, for optical particle counters,       GRIMM, is plotted in a line to be read from the right y-axis.
all different channels together contribute to the final mass       The dashed line in the figure represents the bin ratio of 1,
concentration estimation, and the one-to-one correlation           where the monitors and the GRIMM reported the same
264                                Li et al., Aerosol and Air Quality Research, 20: 254–270, 2020

Fig. 8. Size distributions reported by monitors (Alphasense, APT, Dylos, and PurpleAir) and the reference instrument
(GRIMM). The number concentrations reported by the monitors and GRIMM are plotted on the left y-axis in yellow and
shaded columns respectively. The bin ratio can be read on the right y-axis.

results. Fig. 8 also indicates that no unique calibration factor    representing a constant drift that can be corrected. However,
can be deployed for all channels, although all sensors              the inherent discrepancy cannot be eliminated through
predicted a roughly correct size distribution. Alphasense and       further calibrations, similar to random errors that cannot be
PurpleAir displayed an underestimation and overestimation           ruled out. To demonstrate the agreement between monitors
for small and large particles respectively, which might be          and the reference instrument, together with distinguishing
due to the coincidence error. The Dylos has only 2 bins;            whether the discrepancies were inherent or the result of
therefore, it is difficult to compare the size distribution. One    inadequate calibration, the ARD PM2.5 data in Fig. 6 was
thing worth noting is that the noticeable overestimation for        re-plotted as shown in Fig. 9 with the method reported by
larger particles might not be adequate to assess the                Bland and Altman et al. (1986). On each figure, the dashed
monitors’ true performance. The number concentration is             line in the middle is the mean of differences (σ), and the
very low for larger particles, which may skew the evaluation.       dotted lines (σ ± 2SD) indicate the upper and lower
The GRIMM detected almost no particles larger than 4 µm,            boundaries of the differences.
but the PurpleAir, APT, and Alphasense monitors reported               Before calibration, the low-cost PM monitors exhibited a
the existence of 10-µm particles.                                   strong relationship between the difference and the average.
                                                                    For the Alphasense, APT, and PurpleAir, the difference
Agreement Before and After Calibration                              increased negatively with the average, which illustrated
   As mentioned in the introduction, a large selling point of       that the calibration factor provided by the manufacturer
these low-cost PM monitors is that they arrive assembled            was too large. Therefore, these monitors overestimated the
and calibrated for deployment. However, according to the            PM2.5 mass concentration compared to the GRIMM. The
results of the pairwise correlation based on the PM2.5 mass         overestimation was proportional to the measurement scale;
concentration and the bin-wise comparison based on the              hence the difference and the average demonstrated a strong
number concentration, discrepancies existed between                 correlation. The Dylos showed a positive correlation between
measurements. Two reasons can explain such discrepancy:             the difference and average, which may be caused by too
different inherent working principles of these monitors,            small a calibration factor. The response of these light-
and errors that can be eliminated by calibrations. In other         scattering monitors depends on the type of PM sources
words, the calibration discrepancy is a systematic error,           used, and this has been demonstrated in previous studies
Li et al., Aerosol and Air Quality Research, 20: 254–270, 2020 265 Fig. 9. Differences and averages of PM2.5 mass concentrations reported by the monitors and GRIMM for examining the agreement before and after calibration. (Jiang et al., 2011; Li and Biswas, 2017). Therefore, if In summary, the factory calibration is sufficient for the monitors were calibrated based on different types of PM SidePak for measuring ARD PM2.5; however, the user sources other than ARD particles, they may demonstrate a calibration improves the data quality of the other four disagreement in user-defined calibration using ARD particles. monitors. After the user calibration, the distribution of For all four monitors, the gaps between boundaries (4SD) differences demonstrated a narrower difference boundary had shrunk observably and the σ had been reset closer to (4SD) and a smaller absolute value of σ, which supports zero after applying calibration equations, which demonstrate the elimination of calibration deviation. After user calibration, that calibration deviations for these four monitors were the Alphasense demonstrated the best performance, with an corrected after user calibration. even narrower gap of boundaries (4SD) than the SidePak. One thing worth noting is that whether before or after The reason might be that both the GRIMM and the calibration, the SidePak did not show a strong correlation Alphasense use a single-particle counter, but the SidePak between the difference and the average. It showed the uses ensemble measurement. Hence, after the user calibration, narrowest gap between boundaries (4SD) before calibration the Alphasense demonstrated a greater consistency with when compared to other monitors. After calibration, the the GRIMM data. width of the gap (4SD) remained the same, and the mean of the difference (σ) was reset closer to zero. This behavior AirVisual, Awair, Foobot, Wynd, and Xiaomi Monitors illustrated that user calibration did not significantly improve Time Response and Correlation Based on the PM2.5 Mass the data quality of the SidePak. Therefore, user calibration Concentration is not necessary for SidePak in measuring ARD PM2.5 Similar to the first group, the PM2.5 mass concentration mass concentration. reported by different monitors and reference instruments
266                               Li et al., Aerosol and Air Quality Research, 20: 254–270, 2020

were plotted against time. As shown in Fig. 10, the monitors       correlated with the PM2.5 mass concentration reported by
responded almost simultaneously to increasing PM                   the GRIMM, as shown in Fig. 12.
concentrations. However, it is noticeable that the AirVisual          Among these monitors, the AirVisual has the same color
demonstrated a different shape due to its 5-minute sampling        pattern as the U.S. AQI; the Awair and Wynd each had a
interval. The Awair and Wynd saturated very quickly in             similar color pattern. The Awair does not use the color
the tests, especially for ARD and incense particles. This          maroon, which represents the poorest air quality in the
saturation can be observed more clearly in Fig. 11, which          U.S. AQI. The Wynd uses a blue instead of green for good
plots the PM2.5 mass concentration reported by the monitors        air quality. The Xiaomi and Foobot have just 3 and 2 colors
against the reference instruments.                                 respectively—a very simplified color scheme that is
   Fig. 11 shows that all five monitors demonstrated a             inconvenient for comparison. For example, for ARD particles,
good linear correlation with the GRIMM or SidePak. The             when other monitors turned red or maroon indicating
AirVisual had a longer sampling interval, leading to               unhealthy air quality, the Xiaomi monitor still displayed
segmented scattered data. The Awair and Wynd showed                green, indicating a healthy environment, which is misleading
lower saturation concentrations, and the linear fitting curve      to users. Among the monitors in the second group, the
in the figure is based on the unsaturated part. The Foobot         Foobot most closely predicted the PM mass concentration,
and Xiaomi correlated well with the GRIMM and SidePak              but its color pattern is very different from that of the U.S.
over the full range for different PM sources. However, for         AQI or other monitors. Nevertheless, for Foobot, the color
AirVisual, Awair, and Wynd, saturation occurred at a lower         change between blue and orange always happened when
concentration level. The Foobot presented a high R2 value          the U.S. AQI was displaying a yellow color, indicating
with a slope close to 1 for ARD particles; hence the Foobot        moderate air quality, which can be considered as consistent
has been calibrated well for ARD particle measurement in           and accurate. Considering the difficulty of comparing
the factory setting.                                               different color patterns, we left the Foobot and Xiaomi out
                                                                   of the comparison and focused only on the color indicating
Color Indication                                                   function of the AirVisual, Awair, and Wynd.
   Unlike the first group of low-cost monitors, the second            Among the AirVisual, Awair, and Wynd, the Wynd
group of monitors is mainly for residential use. Hence             triggered the alarm ahead of the U.S. AQI for all three
conveying the air quality precisely to users is the first          different sources; hence, the Wynd is qualified as a residential
concern, rather than accurately measuring the PM mass              monitor for generating prompt alarms. The Awair had an
concentration. They all convey the air quality through a           early response to incense particles, almost simultaneous
straightforward color display. Therefore, instead of focusing      response to ARD particles, and a delayed response to sea
on the statistics for data quality, we recorded the color          salt particles. Therefore, the Awair is more sensitive to
change pattern to examine whether each monitor could               combustion particles, and may not be very sensitive to sea
trigger an air quality alarm promptly. The PM2.5 mass              salt particles. The AirVisual demonstrated an early alarm
concentration reported by the GRIMM was selected as the            for incense and sea salt particles, and a late alarm for ARD
reference. The U.S. AQI was calculated based on the                particles. However, as mentioned before, the AirVisual
reference mass concentration; then color was chosen per            measured the PM level and synchronized the data every
the U.S. EPA regulations. The color change of the monitors         5 minutes, which may affect the color display. In general,
was recorded from their user applications and then                 although each monitor has different responses to various

Fig. 10. PM2.5 mass concentration variation against time for different aerosol sources, reported by the reference
instruments (GRIMM and SidePak) and monitors (AirVisual, Awair, Foobot, Wynd, and Xiaomi).
Li et al., Aerosol and Air Quality Research, 20: 254–270, 2020 267
Fig. 11. Pairwise correlation among the monitors (AirVisual, Awair, Foobot, Wynd, and Xiaomi) and the reference
instruments (Grimm and SidePak) for ARD, sea salt, and incense particles. Slope and R2 values were calculated by the
least squares regression for the unsaturated range.
sources, the monitors of the second group, apart from the affecting the measurement. Furthermore, no single calibration
Xiaomi monitor, indicated the air quality moderately well. factor was able to fit all the channels of a monitor,
suggesting that the factor varies depending on the size bin.
CONCLUSIONS Thus, data quality can be guaranteed only with user-defined
bin-by-bin calibration for the target PM. Coincidence
This study selected nine popular low-cost PM monitors, errors, leading to biased size distributions, were observed
classified them into two groups based on their features and at high concentrations but were found to have little impact
working principle, and compared their performance within on the reported mass concentrations.
each group. The first group, which comprised the The second group, which comprised the AirVisual,
Alphasense, APT, Dylos, and PurpleAir monitors, were Awair, Foobot, Wynd, and Xiaomi monitors, were examined
evaluated as potential substitutes for the two reference as reporters of air quality; specifically, we evaluated the
instruments, a GRIMM and a SidePak. Although all four efficacy of their color-coded indexes in communicating air
of the tested monitors demonstrated good linearity with the quality changes promptly and accurately. All of the
reference instruments, prior to calibration, they showed monitors demonstrated good linearity with the reference
poor agreement with the latter in measuring ARD particles. instruments, and four of them (Xiaomi Mi PM2.5 Detector
One reason may be that these monitors were factory- being the exception) displayed the air quality level with
calibrated using other types of PM, the light scattering moderate accuracy.
signatures of which differ from that of ARD, consequently Overall, the monitors we tested provide low-cost sensors268 Li et al., Aerosol and Air Quality Research, 20: 254–270, 2020
Fig. 12. Color display patterns of the monitors (AirVisual, Awair, Foobot, Wynd, and Xiaomi) for different aerosol
sources. The color change for the U.S. AQI column is based on the PM2.5 mass concentration reported by the GRIMM.
The color changes of other monitors were recorded from user applications.
in products that are ready for use. Low-cost PM sensors northern Nigeria. Urban Clim. 26: 51–59.
usually exhibit R2 values above 0.8 in laboratory tests, Allen, G., Sioutas, C., Koutrakis, P., Reiss, R., Lurmann,
although these values are lower in field tests (> 0.5). F.W. and Roberts, P.T. (1997). Evaluation of the TEOM®
Excepting the Alphasense OPC-N3’s measurement of sea method for measurement of ambient particulate mass in
salt particles (R2 = 0.61), the R2 values we obtained with urban areas. J. Air Waste Manage. Assoc. 47: 682–689.
the low-cost monitors following laboratory calibration were Astrua, M., Ichim, D., Pennecchi, F. and Pisani, M. (2007).
larger than 0.82, which is comparable to results reported in Statistical techniques for assessing the agreement
the literature. between two instruments. Metrologia 44: 385.
The current work could be extended as follows. First, Bland, J.M. and Altman, D. (1986). Statistical methods for
the long-term stability of these low-cost PM monitors—a assessing agreement between two methods of clinical
potential issue with longer field deployment—should be measurement. Lancet 327: 307–310.
assessed. As an example, Crilley et al. (2018) applied Bland, J.M. and Altman, D.G. (2003). Applying the right
nonparametric ranking to analyze the drift in the response statistics: Analyses of measurement studies. Ultrasound
of Alphasense OPC-N2 monitors. Second, multiple units Obstet. Gynecol. 22: 85–93.
of the same model should be tested to ensure repeatability of Brook, R.D., Rajagopalan, S., Pope, C.A., Brook, J.R.,
performance. Third, field evaluations should be conducted, Bhatnagar, A., Diez-Roux, A.V., Holguin, F., Hong, Y.,
as monitors may experience complex variations in the target Luepker, R.V. and Mittleman, M.A. (2010). Particulate
PM during real-world conditions, which may compromise matter air pollution and cardiovascular disease: An
their data quality (Manikonda et al., 2016; Castell et al., update to the scientific statement from the American
2017; Sayahi et al., 2019). Heart Association. Circulation 121: 2331–2378.
Burnett, R.T., Pope III, C.A., Ezzati, M., Olives, C., Lim,
ACKNOWLEDGEMENTS S.S., Mehta, S., Shin, H.H., Singh, G., Hubbell, B.,
Brauer, M. and Anderson, H.R. (2014). An integrated
The work was partially supported by a grant from the risk function for estimating the global burden of disease
National Science Foundation (SusChEM: Ultrafine Particle attributable to ambient fine particulate matter exposure.
Formation in Advanced Low Carbon Combustion Environ. Health Perspect. 122: 397–403.
Processes; CBET 1705864). Simar Kaur and Jiayu Li were Castell, N., Dauge, F.R., Schneider, P., Vogt, M., Lerner,
supported by grants from the McDonnell Academy Global U., Fishbain, B., Broday, D. and Bartonova, A. (2017).
Energy and Environmental Partnership (MAGEEP). Can commercial low-cost sensor platforms contribute to
air quality monitoring and exposure estimates? Environ.
REFERENCES Int. 99: 293–302.
Cohen, A.J., Ross Anderson, H., Ostro, B., Pandey, K.D.,
Aliyu, Y.A. and Botai, J.O. (2018). Reviewing the local Krzyzanowski, M., Künzli, N., Gutschmidt, K., Pope,
and global implications of air pollution trends in Zaria, A., Romieu, I. and Samet, J.M. (2005). The globalLi et al., Aerosol and Air Quality Research, 20: 254–270, 2020 269 burden of disease due to outdoor air pollution. J. Ambient and laboratory evaluation of a low-cost particulate Toxicol. Environ. Health, Part A 68: 1301–1307. matter sensor. Environ. Pollut. 221: 491–500. Crilley, L.R., Shaw, M., Pound, R., Kramer, L.J., Price, R., Kim, J.J., Jung, S.K. and Kim, J.T. (2010). Wireless Young, S., Lewis, A.C. and Pope, F.D. (2018). Evaluation monitoring of indoor air quality by a sensor network. of a low-cost optical particle counter (Alphasense OPC- Indoor Built Environ. 19: 145–150. N2) for ambient air monitoring. Atmos. Meas. Tech. 11: Kim, J.Y., Chu, C.H. and Shin, S.M. (2014). ISSAQ: An 709–720. integrated sensing systems for real-time indoor air Dacunto, P.J., Klepeis, N.E., Cheng, K.C., Acevedo- quality monitoring. IEEE Sens. J. 14: 4230–4244. Bolton, V., Jiang, R.T., Repace, J.L., Ott, W.R. and Klepeis, N.E., Ott, W.R. and Switzer, P. (2007). Real-time Hildemann, L.M. (2015). Determining PM2.5 calibration measurement of outdoor tobacco smoke particles. J. Air curves for a low-cost particle monitor: Common indoor Waste Manage. Assoc. 57: 522–534. residential aerosols. Environ. Sci. Processes Impacts 17: Kumar, P., Morawska, L., Martani, C., Biskos, G., 1959–1966. Neophytou, M., Di Sabatino, S., Bell, M., Norford, L. Gao, Q., Liu, J., Li, W. and Gao, W. (2015). Comparative and Britter, R. (2015). The rise of low-cost sensing for analysis and inspiration of air quality index between managing air pollution in cities. Environ. Int. 75: 199– China and America. Huan Jing Ke Xue 36: 1141–1147. 205. Gao, Y., Dong, W., Guo, K., Liu, X., Chen, Y., Liu, X., Leavey, A., Fu, Y., Sha, M., Kutta, A., Lu, C., Wang, W., Bu, J. and Chen, C. (2016). Mosaic: A low-cost mobile Drake, B., Chen, Y. and Biswas, P. (2015). Air quality sensing system for urban air quality monitoring. IEEE metrics and wireless technology to maximize the energy INFOCOM 2016 - The 35th Annual IEEE International efficiency of HVAC in a working auditorium. Build. Conference on Computer Communications, 2016, San Environ. 85: 287–297. Francisco, CA, USA, pp. 1–9. Li, J. and Biswas, P. (2017). Optical characterization Hapidin, D.A., Saputra, C., Maulana, D.S., Munir, M.M. and studies of a low-cost particle sensor. Aerosol Air Qual. Khairurrijal, K. (2019). Aerosol chamber characterization Res. 17: 1691–1704. for commercial particulate matter (PM) sensor evaluation. Li, J., Li, H., Ma, Y., Wang, Y., Abokifa, A.A., Lu, C. and Aerosol Air Qual. Res. 19: 181–194. Biswas, P. (2018). Spatiotemporal distribution of indoor He, H.D., Li, M., Wang, W.L., Wang, Z.Y. and Xue, Y. particulate matter concentration with a low-cost sensor (2018). Prediction of PM2.5 concentration based on the network. Build. Environ. 127: 138–147. similarity in air quality monitoring network. Build. Liu, D., Zhang, Q., Jiang, J. and Chen, D.R. (2017). Environ. 137: 11–17. Performance calibration of low-cost and portable particular Hojaiji, H., Kalantarian, H., Bui, A.A.T., King, C.E. and matter (PM) sensors. J. Aerosol Sci. 112: 1–10. Sarrafzadeh, M. (2017). Temperature and humidity Manikonda, A., Zíková, N., Hopke, P.K. and Ferro, A.R. calibration of a low-cost wireless dust sensor for real- (2016). Laboratory assessment of low-cost PM monitors. time monitoring. 2017 IEEE Sensors Applications J. Aerosol Sci. 102: 29–40. Symposium (SAS), 2017, Glassboro, NJ, USA, pp. 1–6. Morawska, L., Thai, P.K., Liu, X., Asumadu-Sakyi, A., Holstius, D.M., Pillarisetti, A., Smith, K. and Seto, E. Ayoko, G., Bartonova, A., Bedini, A., Chai, F., (2014). Field calibrations of a low-cost aerosol sensor at Christensen, B. and Dunbabin, M. (2018). Applications a regulatory monitoring site in california. Atmos. Meas. of low-cost sensing technologies for air quality Tech. 7: 1121–1131. monitoring and exposure assessment: How far have they Hu, J., Ying, Q., Wang, Y. and Zhang, H. (2015). gone? Environ. Int. 116: 286–299. Characterizing multi-pollutant air pollution in China: Moreno-Rangel, A., Sharpe, T., Musau, F. and McGill, G. Comparison of three air quality indices. Environ. Int. 84: (2018). Field evaluation of a low-cost indoor air quality 17–25. monitor to quantify exposure to pollutants in residential Jeon, Y., Cho, C., Seo, J., Kwon, K., Park, H., Oh, S. and environments. J. Sens. Sens. Syst. 7: 373–388. Chung, I.J. (2018). IoT-based occupancy detection system Papapostolou, V., Zhang, H., Feenstra, B.J. and Polidori, in indoor residential environments. Build. Environ. 132: A. (2017). Development of an environmental chamber 181–204. for evaluating the performance of low-cost air quality Jiang, R.T., Acevedo-Bolton, V., Cheng, K.C., Klepeis, sensors under controlled conditions. Atmos. Environ. N.E., Ott, W.R. and Hildemann, L.M. (2011). 171: 82–90. Determination of response of real-time SidePak AM510 Patel, S., Li, J., Pandey, A., Pervez, S., Chakrabarty, R.K. monitor to secondhand smoke, other common indoor and Biswas, P. (2017). Spatio-temporal measurement of aerosols, and outdoor aerosol. J. Environ. Monit. 13: indoor particulate matter concentrations using a wireless 1695–1702. network of low-cost sensors in households using solid Johnson, K.K., Bergin, M.H., Russell, A.G. and Hagler, fuels. Environ. Res. 152: 59–65. G.S. (2018). Field test of several low-cost particulate Polidori, A., Papapostolou, V., Feenstra, B. and Zhang, H. matter sensors in high and low concentration urban (2017). Field evaluation of low-cost air quality sensors. environments. Aerosol Air Qual. Res. 18: 565–578. South Coast Air Quality Management District, USA. Kelly, K., Whitaker, J., Petty, A., Widmer, C., Dybwad, Pope III, C.A., Burnett, R.T., Thun, M.J., Calle, E.E., A., Sleeth, D., Martin, R. and Butterfield, A. (2017). Krewski, D., Ito, K. and Thurston, G.D. (2002). Lung
You can also read