E APPENDIX E Water Quality Effects Assessment - Deepdell WRS ...
←
→
Page content transcription
If your browser does not render page correctly, please read the page content below
E APPENDIX E Water Quality Effects Assessment
Oceana Gold New Zealand Limited
 Deepdell North Stage III Project
 Receiving Water Quality Analysis

 November 2019
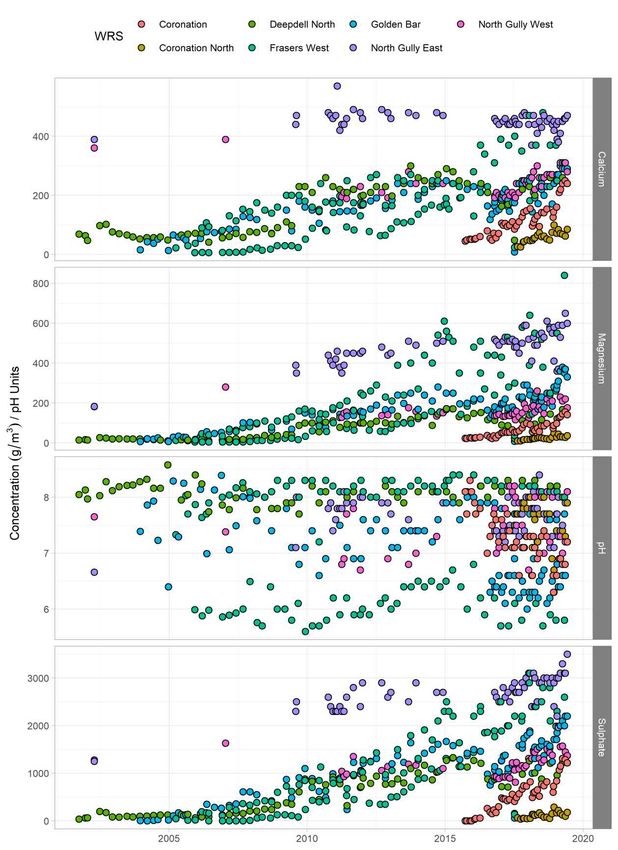
Table of contents
 1. Introduction..................................................................................................................................... 1
 1.1 Introduction .......................................................................................................................... 1
 1.2 Project description ............................................................................................................... 1
 1.3 Limitations ............................................................................................................................ 3
 2. Receiving Waters ........................................................................................................................... 6
 2.1 Overview .............................................................................................................................. 6
 2.2 Hydrology ............................................................................................................................. 8
 2.3 Water quality ...................................................................................................................... 10

 3. Water Balance Model ................................................................................................................... 17
 3.1 Model description ............................................................................................................... 17
 3.2 Water quality inputs ........................................................................................................... 17

 4. WBM Results ............................................................................................................................... 22
 4.1 Analysis assumptions ........................................................................................................ 22
 4.2 Deepdell North pit overflow. ............................................................................................... 22
 4.3 Water quality analysis ........................................................................................................ 23

 5. Potential downstream flow impacts .............................................................................................. 31

 6. Water Quality Monitoring .............................................................................................................. 32
 6.1 Approach ............................................................................................................................ 32

 7. Conclusions .................................................................................................................................. 33

 8. References ................................................................................................................................... 34

Table index
 Table 1 Flow gauge details ..................................................................................................................... 8

 Table 2 Relevant water quality compliance criteria (g/m 3) .................................................................... 10

 Table 3 Projected surface water quality from mine activity –mean values (g/m3)................................. 17

 Table 4 Projected surface water quality for Deepdell East III WRS (g/m3) .......................................... 18

 Table 5 Macraes WRS data summary (compiled by Babbage 2019) ................................................... 19

 Table 6 Projected seepage water quality for Deepdell East WRS (g/m3) ............................................. 21

 Table 7 Key dates ................................................................................................................................. 22

 Table 8 Analysis scenario summary ..................................................................................................... 23

 Table 9 WBM Scenario analysis outputs – Number of model water quality outputs that
 exceed consented values at DC08 .................................................................................... 24

 Table 10 WBM Scenario analysis outputs – Number of model water quality outputs that
 exceed consented values numbers at Loop Road ............................................................ 24

 GHD | Report for Oceana Gold New Zealand Limited - Deepdell North Stage III Project, 125/02848/ | i
Figure index
 Figure 1 Deepdell North Stage III project location plan .......................................................................... 4

 Figure 2 Deepdell North Stage III Project ............................................................................................... 5
 Figure 3 Shag-Waihemo catchment ........................................................................................................ 6

 Figure 4 Macraes mine drainage system and monitoring locations ........................................................ 7

 Figure 5 Flow record comparison for Shag River and Deepdell Creek ................................................... 9
 Figure 6 Specific flow correlation between Deepdell Creek and Shag River catchments ...................... 9

 Figure 7 Relevant water quality compliance points ............................................................................... 11

 Figure 8 Sulphate concentrations in Deepdell Creek at DC08 (2018-2019) g/m3 ................................ 13

 Figure 9 Sulphate concentrations in the Shag River at Loop Road (2018-2019) g/m3 ......................... 13

 Figure 10 Nitrate-N concentrations in Deepdell Creek at DC08 (2018-2019) ...................................... 15

 Figure 11 Nitrate-N concentrations in the Shag River at Loop Road (2018-2019) ............................... 16

 Figure 12 Example of aging function for sulphate ................................................................................. 19

 Figure 13 Derived relationship between WRS average depth, operational duration and
 sulphate concentration (Babbage, 2019) ........................................................................... 20
 Figure 14 Deepdell North Pit lake development .................................................................................... 23

 Figure 15 Predicted Sulphate concentrations over time at DC08 (50 th and 95th percentile
 values) ............................................................................................................................... 26
 Figure 16 Predicted Sulphate concentrations over time at Shag River (50th and 95th
 percentile values) ............................................................................................................... 27

 Figure 17 Predicted Nitrate-N concentrations over time at DC08 (50th and 95th percentile
 values) ............................................................................................................................... 28

 Figure 18 Predicted Nitrate-N concentrations over time at Shag River (50th and 95th
 percentile values) ............................................................................................................... 29
 Figure 19 Highlay Creek in relation to Deepdell East WRS .................................................................. 30

Appendices
 Appendix A – Water balance model description
 Appendix B – Waste rock stack seepage assessment
 Appendix C – Proposed surface water quality monitoring

 ii | GHD | Report for Oceana Gold New Zealand Limited - Deepdell North Stage III Project, 125/02848/
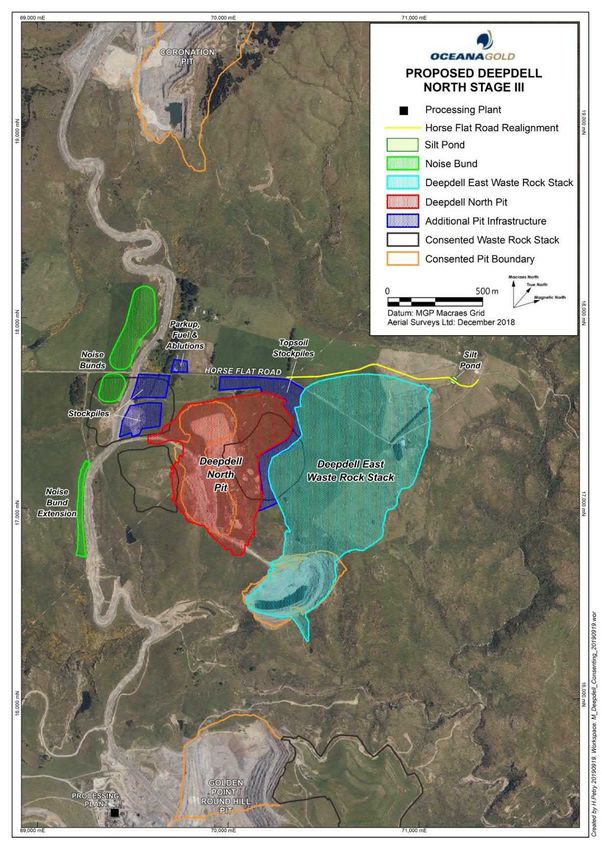
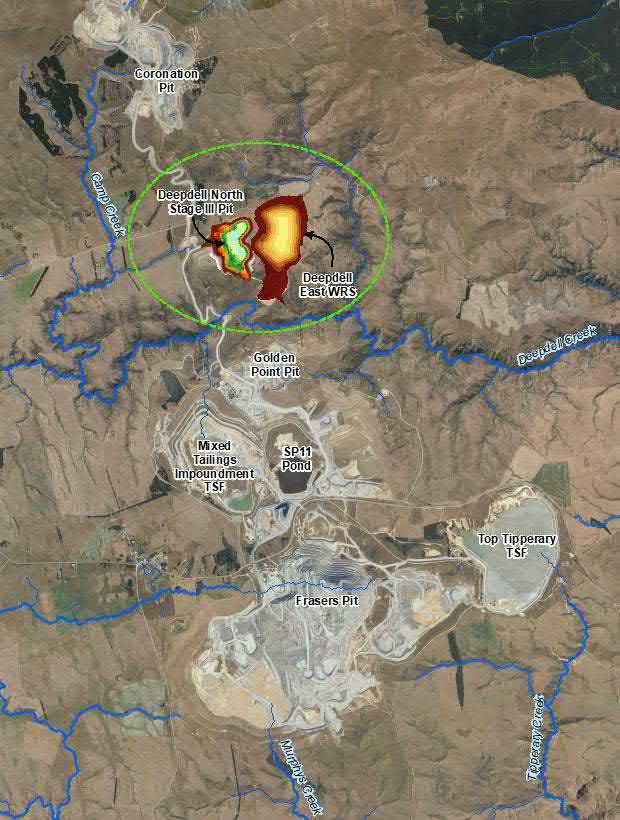
1. Introduction
 1.1 Introduction
 Oceana Gold New Zealand Limited (OGNZL) are planning to expand the Deepdell North pit and
 construct a new waste rock stack (WRS) within the Deepdell catchment at the Macraes mine
 site. Extension of the pit and development of the new WRS is termed the Deepdell North Stage
 III project.
 The Macraes mine site has been operating since 1990 and consists of a number of open pits,
 the Fraser underground mine, tailings storage facilities (TSF’s), ore processing facilities and
 several WRS’s. A plan of the mine site with the new project highlighted, is included as Figure 1.

 The proposed Deepdell East WRS is needed for waste rock coming out of the expansion of the
 Deepdell North pit. The WRS will take an estimated 2 years to construct.

 GHD Limited (GHD) was commissioned to assess whether introduction of this new WRS has
 the potential to cause non-compliance issues with existing downstream water quality resource
 consent conditions (refer 2.3.1), both during operation and post closure.

 GHD developed a site water balance model for OGNZL in 2018 to allow the company to test the
 impact of future mine development on downstream water quality. This report provides a
 description of the water balance model and the model results associated with introducing the
 proposed Deepdell North Stage III Project on downstream receiving water quality.

 1.2 Project description
 OGNZL provided a project description for the Deepdell North Stage III Project and this is
 reproduced in the following sections. The project location in relation to the mine site is shown in
 Figure 1 and a more detailed layout is shown in Figure 2.

 1.2.1 Open pit excavation

 The planned pit extension is described as follows:
 a. Pit footprint 38ha, comprising 18.7ha of disturbed previously mined areas and 19.6ha
 of proposed new disturbance with potential to expand if upcoming exploration is
 successful.
 b. Quantities: Ore 3.5Mt, Backfill waste 9.4Mt, in-situ oxide waste (brown rock) 2.4Mt, in-
 situ fresh waste 41.5Mt. Total movement 57Mt.

 c. Haul roads 30m wide. Roads within pit footprint only.
 d. The top of the pit excavation is at about 520mRL and the base of the pit is at 370mRL,
 making the total pit depth 150m.

 e. Water management during operations will require pumping of stormwater runoff
 (primarily) out of the pit and into the existing drain to the Deepdell North Silt Pond.
 This pond overflows to the Deepdell Creek.

 f. At closure, the pit lake is expected to flood and eventually drain out of the lowest point
 to the south.

 g. Ancillary infrastructure associated with the open pit (park-up areas, smoko and
 ablutions, portable fuel tank etc.) will be located immediately west of the pit in the
 same areas previously used for these purposes.

 GHD | Report for Oceana Gold New Zealand Limited - Deepdell North Stage III Project, 125/02848/ | 1
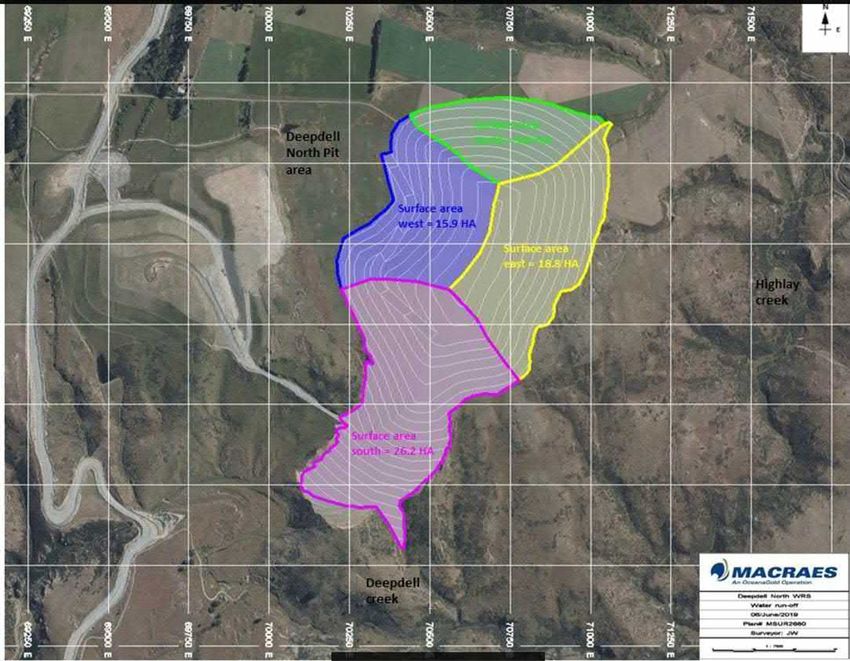
1.2.2 Waste rock disposal – Deepdell East WRS.

 The WRS development includes:

 a. Backfill of the existing Deepdell South Pit (13.2 ha)

 b. Extending north from Deepdell South Pit to beyond Horse Flat Road covering a
 total area of 70.8 ha of which 57.6 ha will be new disturbance.
 c. Storage quantity 21.6 Mm3 to 540 mRL (current design height) but has the
 potential to be constructed to 580 mRL.

 d. A short haul road is required between the Deepdell North Pit and the WRS.

 e. No additional infrastructure will be required.

 1.2.3 Mining method & equipment

 It is proposed to use the same methods and equipment that are applied to existing operations.
 Operations will run 24/7 using two digging units. Peak production will load 67,000t / shift (380
 loads / shift & peak of 42 loads /hour).

 1.2.4 Stockpiles

 Stockpiles for rehabilitation materials are to be formed along the Coronation Haul Road in
 currently disturbed areas and adjacent to the pit, to the north east.

 1.2.5 Roads

 Horse Flat Road will be permanently moved to the north due to the construction of the WRS.
 The realignment of this road will involve the installation of at least one culvert.

 1.2.6 Project closure

 Closure works will include:

 a. Pit: Not backfilled - where possible (i.e. rock is soft or within existing backfill) the
 excavation levels above the final lake level will be shaped to provide aesthetically
 pleasing and suitable areas for vegetation establishment.
 b. Surface and ground water flow to be directed into the pit void to create a lake.
 This lake to drain as per notes above.

 c. Waste disposal. The final landuse will be pastoral, with slopes to be dozed down
 to a 3H:1V slope and rehabilitated back into pasture using standard site
 techniques. Note that this will substantially soften the visual amenity from the
 Golden Point historic reserve.
 d. Site establishment areas and haul roads will be rehabilitated using standard site
 techniques.

 1.2.7 Alternatives considered

 Multiple options have been considered by OGNZL for the WRS location. This has included:

 a. North west of the proposed pit, against Taieri Ridge and adjacent to the current
 Coronation Haul Road.

 b. Immediately north of the proposed pit, against the Taieri Ridge, also known as the
 Horse Flat WRS.

2 | GHD | Report for Oceana Gold New Zealand Limited - Deepdell North Stage III Project, 125/02848/
1.2.8 Project timeline The current OGNZL schedule sees these major project milestones: Site establishment and first overburden mining: October 2020 First ore: November 2020 Mining finished: November 2022 1.3 Limitations This report: has been prepared by GHD for OGNZL and may only be used and relied on by OGNZL for the purpose agreed between GHD and OGNZL. GHD otherwise disclaims responsibility to any person other than OGNZL arising in connection with this report. GHD also excludes implied warranties and conditions, to the extent legally permissible. The services undertaken by GHD in connection with preparing this report were limited to those specifically detailed in the report and are subject to the scope limitations set out in the report. The opinions, conclusions and any recommendations in this report are based on conditions encountered and information reviewed at the date of preparation of the report. GHD has no responsibility or obligation to update this report to account for events or changes occurring subsequent to the date that the report was prepared. The opinions, conclusions and any recommendations in this report are based on assumptions made by GHD described in this report. GHD | Report for Oceana Gold New Zealand Limited - Deepdell North Stage III Project, 125/02848/ | 3
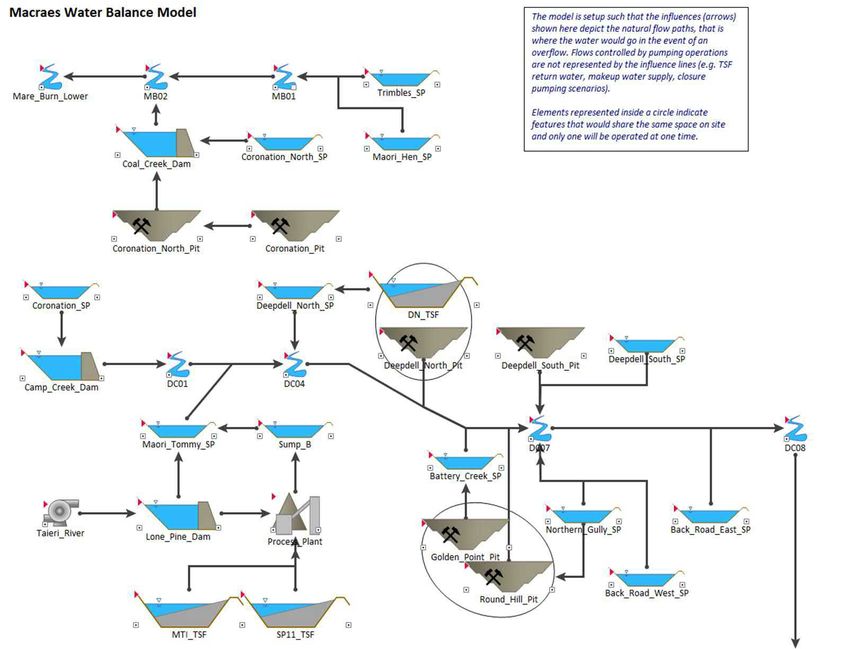
Figure 1 Deepdell North Stage III project location plan

4 | GHD | Report for Oceana Gold New Zealand Limited - Deepdell North Stage III Project, 125/02848/
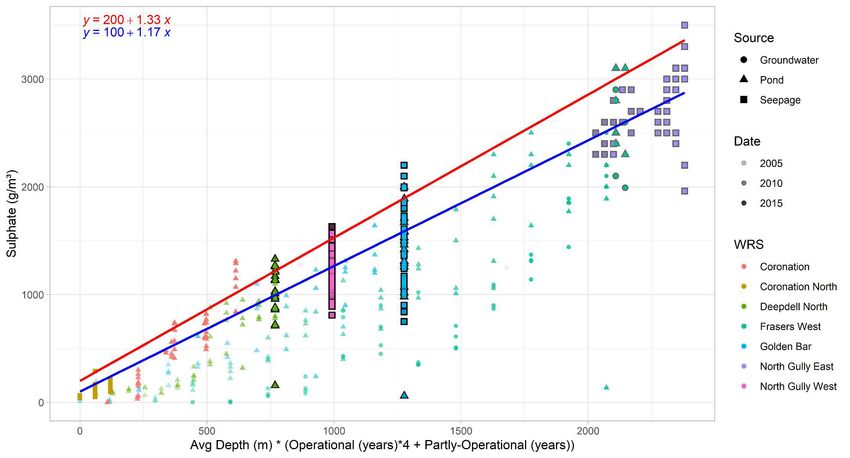
Figure 2 Deepdell North Stage III Project

 GHD | Report for Oceana Gold New Zealand Limited - Deepdell North Stage III Project, 125/02848/ | 5
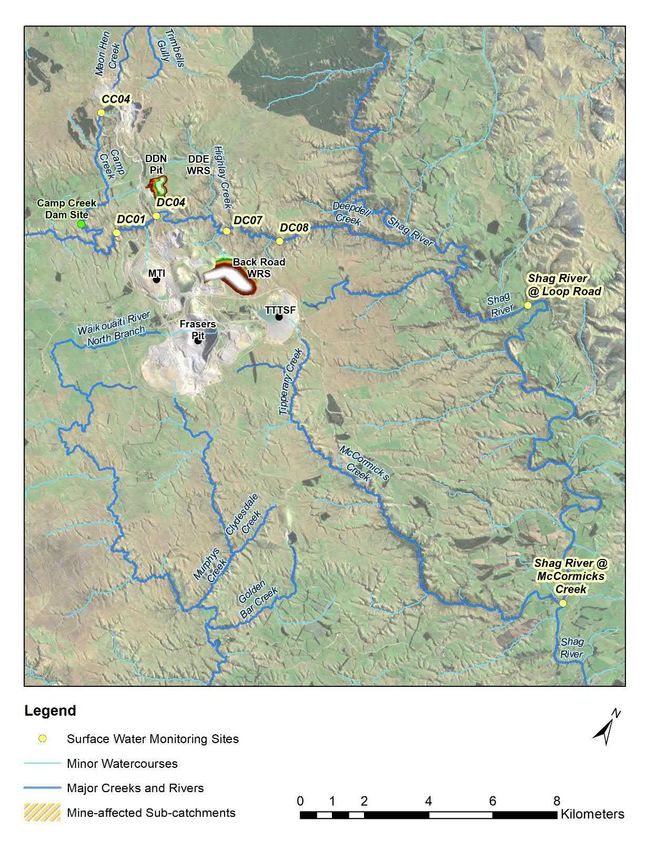
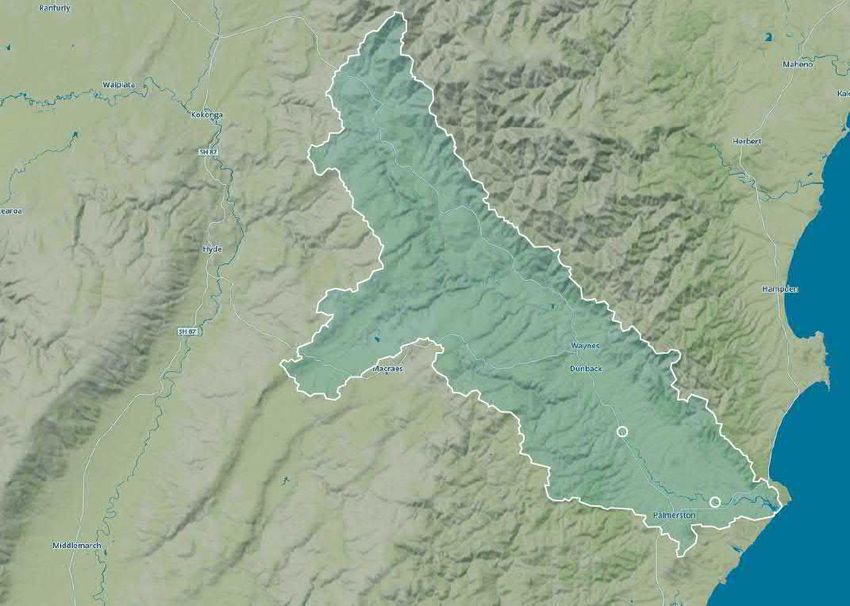
2. Receiving Waters
 2.1 Overview
 The Deepdell North Stage III project is located within the Shag River/Waihemo catchment as
 shown below in Figure 3. The river flows in a south-easterly direction and enters the ocean
 close to Matakaea. The catchment consists primarily of agriculture and forestry.

 Macraes site location

 Figure reproduced from LAWA.org.nz
 Figure 3 Shag-Waihemo catchment

 Discharges from the site ultimately reach the Shag River via a number of tributaries including
 Deepdell Creek. Figure 4 shows the streams that drain the site and the water quality monitoring
 sites referenced in this report.

 6 | GHD | Report for Oceana Gold New Zealand Limited - Deepdell North Stage III Project, 125/02848/
Figure 4 Macraes mine drainage system and monitoring locations

For the Deepdell North III project the relevant tributaries are the Deepdell Creek and its tributary
Highlay Creek. The Highlay Creek covers a catchment of approximately 770 ha.

 GHD | Report for Oceana Gold New Zealand Limited - Deepdell North Stage III Project, 125/02848/ | 7
2.2 Hydrology

 2.2.1 Deepdell Creek

 The Deepdell Creek is characterised by extended periods of low flow, particularly through
 summer months. Flow records show some occasions of no visible surface flow. Flood events
 are generally of a short duration. Highlay Creek is also ephemeral with periods through the
 summer of no visible flow.

 2.2.2 Shag River – The Grange

 The Shag River drains a catchment of approximately 319 km 2 upstream from the Grange flow
 monitoring station, which is operated by the Otago Regional Council (ORC). The Grange is
 located downstream from the water quality compliance monitoring point at Loop Road and
 upstream from the water quality compliance monitoring point at McCormicks. Unlike Deepdell
 Creek the Shag River always has flow.

 2.2.3 Flow gauges

 Synthetic river and stream flow data has been derived for this study using a calibrated
 Australian Water Balance Model (AWBM) (Boughton 20041). This model determines catchment
 runoff based on recent daily rainfall and evaporation records. This approach aligns the
 hydrological behaviour of the model inputs.

 The AWBM model was calibrated to Deepdell Creek and Shag River flow data measured at the
 DC04 and Grange gauges between 31/05/2011 and 30/11/2017; the Shag River gauge and
 Deepdell Creek gauge has additional coverage extending into 2018 and as far back as October
 1989. The coincident flow record is shown in Figure 5 and key metrics for the flow gauges are
 included in Table 1. Figure 6 shows the specific flow correlation between Deepdell Creek DC04
 and Shag River catchments for the available datasets.

 There is no flow gauging in the Highlay Creek, hence flow estimates have been derived based
 on a “pro rata” approach for catchment areas with the flow gauge at DC04.

 Table 1 Flow gauge details

 Metric Highlay Creek Deepdell Shag at the
 at Deepdell Creek at Grange
 confluence DC04
 (Inferred)

 Catchment Area (km 2) 7.7 40.8 319

 95th percentile flow (l/s) 0.7 3.5 101

 50th percentile flow (l/s) 5.7 30 560

 Mean Annual minimum 0.8 4 164
 flow (7 day)

 Minimum Flow 0 0 21

1Boughton, W. 2004. The Australian water balance model, Environmental Modelling & Software.
19(10), 943-956.

8 | GHD | Report for Oceana Gold New Zealand Limited - Deepdell North Stage III Project, 125/02848/
Shag at The Grange Deepdell at DC04

 1,000,000

 100,000

 Measured Flow (L/s) 10,000

 1,000

 100

 10

 1

 Jan-2014
 Jan-2011

 Jan-2012

 Jan-2013

 Jan-2015

 Jan-2016

 Jan-2017

 Jan-2018
 0

 0

Figure 5 Flow record comparison for Shag River and Deepdell Creek

 Grange Mean Min Max

 1000
 Grange Speccific Flow (mm/d)

 100

 10

 1

 0.1

 0.01

 0.001
 0.00001 0.0001 0.001 0.01 0.1 1 10 100
 Deepdell Specific Flow (mm/d)

Figure 6 Specific flow correlation between Deepdell Creek and Shag River
 catchments

 GHD | Report for Oceana Gold New Zealand Limited - Deepdell North Stage III Project, 125/02848/ | 9
2.3 Water quality

 2.3.1 Relevant Resource Consent conditions

 The key surface water compliance points that are relevant to the Deepdell North Stage III
 Project are DC08 and Loop Road. The locations of these are shown in Figure 7.

 Current water quality compliance values specified in existing resource consents are
 summarised in Table 2.

 OGNZL has advised that the consents which relate to these values include:

 • Mixed Tailings Impoundment - 2006.303.V2, 2006.304.V2,
 2006.305.V4 and RM10.351.33 and RM10.351.34 (RM10 - both yet to be activated)
 • Southern Pit 11A Tailings Storage Facility - 2006.306.V2, 2006.307.V2 and
 2006.308.V3

 • Southern Pit 10 Tailings Storage Facility - RM10.351.29.V1 and RM10.351.31.V1 (yet
 to be activated)
 • Coronation Project – RM12.378.05, RM12.378.03, RM12.378.04

 • Back Road Waste Rock Stack – RM10.351.06.V1, RM10.351.04.V2, RM10.351.05.V2
 (yet to be activated)

 • Deepdell WRS – 2010.159.V1, Deepdell South Pit Lake – 2003.640.V2, 2005.341.V2,
 Deepdell North Silt Pond – 2010.158.V1, Deepdell South Silt Pond – 2010.155.V1 05.

 Table 2 Relevant water quality compliance criteria (g/m3)

 Compliance Parameter Deepdell Creek Shag River
 at DC08 at Loop Road

 pH (unitless) 6 – 9.5 7 – 8 .5

 Arsenic 0.15 0.01

 Cyanide WAD 0.1 0.1

 Copper (2) 0.009 0.009

 Iron 1 0.2

 Lead (2) 0.0025 0.0025

 Zinc (2) 0.12 0.12

 Sulphate 1,000 250
 Notes:
 1) All units g/m3 unless otherwise stated.
 2) Metal limits hardness adjusted as per equations 1 to 3 below.
 1. Copper (g/m3) = (0.96exp0.8545[ln(hardness)] – 1.702) / 1000
 2. Lead (g/m3) = (1.46203 – [ln(hardness)(0.145712)]exp1.273[ln(hardness)] -4.705) / 1000
 3. Zinc (g/m3) = (0.986exp0.8473[ln(hardness)] + 0.884) / 1000

10 | GHD | Report for Oceana Gold New Zealand Limited - Deepdell North Stage III Project, 125/02848/
Figure 7 Relevant water quality compliance points 2.3.2 Background studies A number of studies have been undertaken since mine operation commenced to assess the impacts of mining on downstream water quality and to analyse the potential impacts of various extensions during operation and post closure. A substantial extension termed the Macraes Phase III Project was the subject of a number of studies completed by Golder (2011) and the associated technical reports were used to support resource consent applications. The analysis undertaken by Golder included assessment of various mitigations required to maintain compliance with downstream resource consent conditions. The study showed that there was potential for non-compliance and set out a number of mitigations to prevent this occurring. Golder identified that over time sulphate concentrations are likely to exceed receiving water consent values seasonally, with risk increasing over time due to the delayed release associated with geochemical reactions of the waste rock material. Risk of other metals exceeding compliance values was also identified. However, the analysis in this regard was noted as conservative. The Golder report advocated for an adaptive management approach, with various mitigations to be initiated over the mine life based on ongoing review of monitoring results and associated review of the analysis assumptions. The mitigation measures noted by Golder that are most relevant to the Deepdell North III project are reproduced below for reference: Ongoing monitoring to confirm model projections and assess effects. The development of the site-wide Goldsim model (discussed in this report) is the most recent update to site water balance and water quality analysis and follows a number of other updates since 2011 that OGNZL has commissioned. Ongoing pumping of Tailings Storage Facility (TSF) water as well as various collection systems across the mine that intercept water in ponds and drains for process re-use and to prevent release. Pumping of TSF and other water sources to Frasers Pit following cessation of mine operations for up to 20 years following closure of each facility to allow discharge flow rates to decrease to the point where other passive mitigation measures can be installed where deemed necessary. GHD | Report for Oceana Gold New Zealand Limited - Deepdell North Stage III Project, 125/02848/ | 11
Construction of a fresh water dam on Camp Creek to provide a base flow to Deepdell Creek to manage and effectively mitigate sulphate concentrations in Deepdell Creek and in the Shag River as far as the confluence with McCormicks Creek. The dam provides the opportunity also for seasonal or flow matched discharges of freshwater to effectively mitigate the sulphate concentrations in the Shag River. OGNZL holds the appropriate resource consents for the construction of this dam.2 Use of passive water treatment systems in targeted locations. The mitigation measures listed above and the associated adaptive management approach remain applicable to the site and guide OGNZLs approach to site water management. Since 2011 OGNZL has also initiated a number of programs of work to assess improved source control of contaminants and to trial passive treatment systems. In relation to source control, OGNZL has completed a number of studies on waste rock geochemistry, construction methodology and capping. This has resulted in a change to WRS construction in the Coronation North mine area to improve seepage water quality. For the Deepdell WRS OGNZL plan to adopt learnings from these studies including segregation of materials based on sulphur content, paddock dumping on each lift in the WRS to reduce the effects of particle size separation and resulting advection of oxygen into the WRS, a construction methodology that facilitates progressive rehabilitation and additional material on the outer face of the WRS to act as a barrier to oxygen. OGNZL is also currently reviewing a range of passive treatment options so that systems that are effective for site conditions can be applied post closure. Treatment systems currently being trialled include activated passive treatment, constructed wetlands and irrigation of seepage water. 2.3.3 Compliance history OGNZL has advised GHD that compliance has been achieved with resource consent surface water criteria (Table 2) at sites DC07, DC08, Shag River at Loop Road and Shag River at McCormick’s on all but 3 occasions since monitoring began in 1990. An exceedance of sulphate values in Deepdell Creek in 2006 was due to an on-site operational issue that was corrected. Two exceedances reported at the Shag River at McCormicks are the result of an operational issue and are also likely to have been sampled from the wrong sampling point due to an error by the field technician who had been sampling McCormicks Creek itself not the Shag River downstream of the McCormicks Creek confluence. A review by OGNZL indicated the elevated concentrations measured at sites DC07 and DC08 in 2015 were due to very low natural flows in Deepdell Creek at the time and therefore a very low mine water dilution ratio. The main contaminant that has been of concern in terms of approaching compliance values is sulphate. The following graphs show measured values over the last 12 months which have been well below the compliance values of 1000 g/m 3 at DC08 and 250 g/m3 at Loop Road. 2 The dam is consented but has not yet been constructed. 12 | GHD | Report for Oceana Gold New Zealand Limited - Deepdell North Stage III Project, 125/02848/
Figure 8 Sulphate concentrations in Deepdell Creek at DC08 (2018-2019)
 g/m3

Figure 9 Sulphate concentrations in the Shag River at Loop Road (2018-
 2019) g/m3

 GHD | Report for Oceana Gold New Zealand Limited - Deepdell North Stage III Project, 125/02848/ | 13
2.3.4 Emerging contaminants - Nitrates

 Resource consent conditions that apply to site discharges do not currently include any nitrogen
 compounds. However the 2014 Plan Change 6a (Water Quality) to Otago Regional Councils’
 Regional Plan is being implemented and some of the Regional Plan changes relate to the
 management of nitrogen compound loads and concentrations in surface waters around the
 region. In addition the National Policy Statement for Freshwater 2014 (amended 2017) includes
 target values for nitrates. The ORC has committed to a Progressive Implementation Programme
 for implementing NPS policies. Hence it can be expected that the NPS Freshwater will be
 referenced when the ORC is considering consent conditions.

 As a result OGNZL will need to consider the contribution of nitrogen compounds from the
 Macraes site to downstream receiving waters when applying for either new discharge consents
 or consent variations.

 OGNZL commissioned WGA to undertake a study on site sources of nitrogen compounds
 including assessment of the nitrogen loads from existing and potential future mine water
 discharges to the Deepdell and Shag River catchments. The objective of the study was to
 establish whether current site discharges would meet Plan Change 6A and NPS Freshwater
 criteria as they relate to nitrogen compounds; and if required to identify mitigation measures to
 meet these criteria.

 Potential sources of nitrogen identified by WGA that could be entrained in either surface or
 groundwater from the mine site include:

 • Residues from the use of ammonium nitrate explosives.
 • Cyanide in tailings slurry from the ore processing plant.

 • Other nitrogen containing chemicals and reagents used during ore processing –
 eg nitric acid

 • The weathering of freshly exposed minerals in the waste rock.

 • The use of fertiliser for rehabilitation purposes.
 • Nitrogen fixing in the soils through plant growth over rehabilitated areas of the
 mine.

 • Animal wastes where grazing animals may access rehabilitated areas of the
 mine.
 • Natural and anthropogenic nitrogen in the mine site water supply and
 wastewater.

 Following completion of the WGA study OGNZL initiated a number of actions to better
 understand the sources of nitrogen compounds on the Macraes site.

 This includes increased monitoring of site water sources and receiving waters in order to
 increase the sample database.

 In addition, OGNZL commissioned GNS (2019) to undertake a study on mine derived source
 isotopes of NO3 in order to identify the most likely source of nitrates in site runoff and seepage.
 The study identified both unburnt ammonium nitrate from explosives and source rock as nitrate
 sources. This highlighted that mine activity might not be the sole source of nitrates i.e. nitrates
 may also be sourced from country rock. GNS recommended further sampling and analysis to
 resolve ambiguities identified through the study.

 Ryder (2019) has completed a study on the ecological values of the Deepdell Creek and Shag
 River and has recommended that the NPS Freshwater Attribute B is an appropriate target for
 the Deepdell Creek and Shag River. Accordingly, for this report receiving water quality has been

14 | GHD | Report for Oceana Gold New Zealand Limited - Deepdell North Stage III Project, 125/02848/
compared to the Attribute B values for nitrate as an indication of whether compliance with
similar future consent conditions will be an issue. Attribute B values are as follows:
 • Nitrate-N g/m3 (NO3-N) – Annual median [>1.0 and ≤2.4] and Annual 95th percentile
 [>1.5 and ≤3.5]

 • Ammoniacal-N g/m3 (NH4-N) – Annual median [ >0.03 and ≤0.24] and Annual 95th
 percentile [>0.05 and ≤0.40]

For reference measured values for Nitrate-N for the last 12 months are reproduced in the
following graphs.
Ammoniacal-N values measured at DC08 over the same period are recorded at 0.01 g/m 3 with
a single reading of 0.03 g/m 3. All readings at the Shag monitoring point are recorded at 0.01
g/m3.

The data indicates compliance with Attribute B values at both sites.

Figure 10 Nitrate-N concentrations in Deepdell Creek at DC08 (2018-2019)

 GHD | Report for Oceana Gold New Zealand Limited - Deepdell North Stage III Project, 125/02848/ | 15
Figure 11 Nitrate-N concentrations in the Shag River at Loop Road (2018-
 2019)

16 | GHD | Report for Oceana Gold New Zealand Limited - Deepdell North Stage III Project, 125/02848/
3. Water Balance Model
 3.1 Model description
 A water balance model (WBM) was developed by GHD in Goldsim to assess how water gains
 and downstream water quality changes over the life of the Macraes mine. This model essentially
 updates models prepared previously by others (Golder, WGA) used to predict future water
 quality outcomes. A key purpose of the model is to assess how future changes, such as mine
 area extension and/or addition of a new WRS impacts downstream water quality; and what
 mitigations might be needed to stay within consent conditions. The Macraes Goldsim water
 balance model was developed in late 2018 and has been subject to ongoing calibration since
 that time. A model description is provided in Appendix A.

 3.2 Water quality inputs

 3.2.1 Surface water quality

 The surface water quality parameters applied to the WBM are listed in Table 3. These values
 have been derived based on water quality monitoring data provided by OGNZL and represent
 mean values. Within the water balance analysis the model applies a normal distribution from
 mean to each water source by adopting a 20% standard deviation to represent the variances
 observed in the monitoring data. For each day simulated by the model a mass balance is
 derived to calculate downstream water quality. This approach is used to capture the majority of
 likely outcomes, therefore capturing the risk associated with water quality exceedances at the
 compliance point.
 Table 3 Projected surface water quality from mine activity –mean values
 (g/m3)

 1
 Parameter Natural Impacted Rehab Pit Ponds TSF
 Impact

 Ammonia 0.011 0.012 0.012 0.8 0.011 0.012

 Arsenic 0.0018 0.04 0.02 0.2 0.0018 0.04

 Copper 0.001 0.0012 0.001 0.02 0.001 0.0012

 Hardness 65 1200 630 880 65 1200

 Iron 0.05 0.032 0.14 0.9 0.24 0.032

 Lead 0.00015 0.0002 0.00019 0.001 0.00015 0.00022

 Nitrate 0.05 0.094 0.4 2.0 10.5 0.1

 Sulphate 24 930 470 1400 1500 930

 Zinc 0.001 0.001 0.001 0.0056 0.001 0.001

 Notes

 1. Rehab impact – areas other than WRS that have been rehabilitated

 GHD | Report for Oceana Gold New Zealand Limited - Deepdell North Stage III Project, 125/02848/ | 17
For the WRS’s an “initial” and “final” value is applied to recognise that contaminant
 concentrations will change over time. Values are based on monitoring data collected by
 OGNZL.
 Table 4 Projected surface water quality for Deepdell East III WRS (g/m3)

 Parameter Initial Deepdell Final Deepdell Rehab Deepdell
 WRS WRS WRS

 Ammonia 0.5 0.02 0.01

 Arsenic 0.01 0.01 0.01

 Copper 0.0018 0.0013 0.0011

 Hardness 200 1030 220

 Iron 0.08 0.1 0.08

 Lead 0.00015 0.0003 0.00015

 Nitrate 1.0 0.4 0.4

 Sulphate 470 150 150

 Zinc 0.001 0.001 0.0012

 3.2.2 WRS seepage

 Understanding how sulphate concentrations in WRS seepage change over time is key to
 predicting receiving water quality in the future. In low flow conditions the contributions from
 groundwater and seepage make up the receiving water flows; seepage is thus a key contributor
 to the overall water quality.
 OGNZL engaged Babbage to analyse available seepage water quality data from all of their
 WRS’s in order to assess whether the concentrations of certain parameters (in particular,
 sulphate), are at equilibrium (stable) or likely to increase over time. Babbage (2019) approached
 the study by collating the water chemistry monitoring data available from OGNZL, and assessed
 if there were any correlations with time or geographical data, such as WRS volumes or areas.
 The Babbage letter report (2019) is included as Appendix B.
 There were eight WRS for which seepage data was available, either directly from toe drains or
 measured in a silt pond down gradient.
 In assessing the available data Babbage (2019) noted that “Sulphate is the principal element of
 concern, and calcium and magnesium are the principal controls on sulphate in groundwater.
 The results show that the pH of WRS seepage is relatively stable (pH 7-8) over time and
 between WRS. In contrast, the concentrations of calcium, magnesium and sulphate are highest
 in the seepage from Northern Gully East and lowest in the seepage from Coronation North.
 Concentrations of all three parameters have, in general, increased over time in all WRS”

 Babbage noted the variability in the data collected from the different sites and subsequent to
 their initial study have developed a correlation between WRS age, seepage, depth and time.
 This was to provide a means of predicting changes in seepage water quality both during future
 operation and post closure.

18 | GHD | Report for Oceana Gold New Zealand Limited - Deepdell North Stage III Project, 125/02848/
WRS seepage water quality is expected to deteriorate for some contaminants such as sulphate
and nitrate, while others such as lead, iron and ammonia typically stabilise at reduced
concentrations.
Figure 12 shows examples of measured sulphate values against the associated aging functions
applied in the WBM. For sulphate in particular, Babbage (2019) has identified a relationship
between WRS average depth, active duration and typical concentration, which was used to
determine the steady state values for the proposed Deepdell East WRS. The derived
relationship is presented in Figure 13.

 Northern Gully Seep - West Deepdell North Silt Pond SPMP3
 3500

 3000

 2500
 Sulphate Concentration (mg/L)

 2000

 1500

 1000

 500

 0
 Jan-1995 Jan-2000 Jan-2005 Jan-2010 Jan-2015 Jan-2020 Jan-2025

Figure 12 Example of aging function for sulphate

Table 5 summarises key data points.
Table 5 Macraes WRS data summary (compiled by Babbage 2019)

 WRS WRS Partial WRS Average Median 95th
 Start cap completed Depth seepage percentile
 Year Year (m) sulphate seepage
 (g/m3) sulphate
 (g/m3)
 Deepdell North 2001 - 2013 16.3 1,005 1,238

 North Gully West 1995 - 2003 31.3 1,263 1,534

 North Gully East 1990 2003 2019 34.6 2,826 3,326

 Golden Bar 2003 - 2014 29.4 1,602 1,922

 Frasers West 2003 2017 2019 37.1 2,598 3,064

 Coronation North 2017 - 2019 15.2 241 362

 Coronation 2014 - 2019 28.3 757 953

 GHD | Report for Oceana Gold New Zealand Limited - Deepdell North Stage III Project, 125/02848/ | 19
Figure 13 Derived relationship between WRS average depth, operational
 duration and sulphate concentration (Babbage, 2019)

 Based on their analysis Babbage provided the following relationship between “Age”, Average
 WRS depth and sulphate concentrations in seepage:

 ( 3 )
 ℎ = 100 + 1.17 ( ) (4 × ( ) + ( ))
 ( 2 )

 ( 3 )
 95 ℎ % ℎ = 200 + 1.33 ( ) (4 × ( ) + ( ))
 ( 2 )

 These equations were used to generate predicted future sulphate concentrations in seepage
 from the Deepdell East WRS. Values for all parameters used in analysis for seepage water
 quality are summarised in Table 6. The WRS construction period and dimensions provided by
 OGNZL were applied.

20 | GHD | Report for Oceana Gold New Zealand Limited - Deepdell North Stage III Project, 125/02848/
Table 6 Projected seepage water quality for Deepdell East WRS (g/m3)

 Parameter Initial Deepdell Final Deepdell
 WRS WRS

 Ammonia 0.5 0.02

 Arsenic 0.01 0.01

 Copper 0.0018 0.0013

 Hardness 200 1030

 Iron 0.23 0.1

 Lead 0.001 0.0003

 Nitrate 10.5 14

 Sulphate 100 522

 Zinc 0.001 0.001

Sulphate levels for the Deepdell East WRS are calculated by the Babbage formula assuming a
2.1 year operation period and 2 years to rehabilitate the WRS. The other seepage parameters
are projected from water quality monitoring gathered across the mine site.

 GHD | Report for Oceana Gold New Zealand Limited - Deepdell North Stage III Project, 125/02848/ | 21
4. WBM Results 4.1 Analysis assumptions The WBM was modified to represent the introduction of the Deepdell North III Project. The “baseline” for the project in the WBM includes the new Deepdell East WRS, Deepdell North pit development and the Back Road WRS which is already planned and consented for the site. The baseline also assumes that the Camp Creek dam will be constructed by January 2022 and releasing a constant 10 l/s of fresh water to the Deepdell Creek. Key assumptions in summary include: WRS seepage water quality is based on the equations developed by Babbage (section 3.6 and parameters listed in Table 6) Surface water runoff quality as per Table 3 and Table 4 Camp Creek dam constructed and releasing 10 l/s fresh water. Key dates represented in the model are listed in Table 7. Table 7 Key dates Model Input Activity Date Deepdell East III Pit Pump start Nov 2020 Deepdell East III Pit Pump stop. Dec 2022 Deepdell East III WRS Construction starts Nov 2020 Deepdell East III WRS Construction complete Dec 2022 Camp Creek Dam Active Jan 2022 Back Road WRS Construction starts Jan 2021 All mining ceases Rehabilitation Jan 2025 All rehabilitation complete All runoff and seepage in Jan 2045 catchment to Deepdell Creek 4.2 Deepdell North pit overflow. In the 40 year period run through the model, a pit lake begins to form post closure but does not spill within the time period covered. The overflow point is set at RL 465m and the lake is approaching RL 430m in 2060. This is shown in Figure 14. It is estimated that the lake will take a further 60 years to reach the overflow point. This gives ample time for testing of water quality and development of a treatment solution should it be needed. No further analysis was done for this study. 22 | GHD | Report for Oceana Gold New Zealand Limited - Deepdell North Stage III Project, 125/02848/
Figure 14 Deepdell North Pit lake development 4.3 Water quality analysis 4.3.1 Scenarios In addition to the proposed development plan a number of scenarios were included (Table 8). These were to test the benefits of a number of potential mitigations to improve downstream water quality. The scenario elements included: Flow matched or seasonal discharge of 16 l/s from Camp Creek dam With the Back Road WRS removed or reduced in footprint area Combinations of the above These are summarised as follows. Table 8 Analysis scenario summary Scenario Name Baseline 1/2 Back Camp Creek Rd 16 L/s Scenario ID 1 2 3 Deepdell East WRS 70.7 ha 70.7 ha 70.7 ha Footprint Back Road WRS 130 ha 65 ha 130 ha Footprint Camp Creek Dam YES YES YES Active Camp Creek Dam Constant Constant Variable discharge condition 10 L/s 10 L/s to 16 L/s GHD | Report for Oceana Gold New Zealand Limited - Deepdell North Stage III Project, 125/02848/ | 23
4.3.2 Risk based analysis

 As described in Appendix A the WBM uses a risk based Monte Carlo approach. When assigning
 water quality to an element on any given day (e.g. WRS seepage) the model will randomly
 generate a water quality concentration using a normal distribution approach. This means that
 while most of the time water quality values will approach the mean values listed in previous
 tables ( Table 3, Table 4, Table 6); there will be values generated that represent variation and
 uncertainty in the source data, and represent the risk of relatively high concentration inputs. This
 approach is useful for assessing the potential risk of exceeding downstream water quality
 consent compliance values. However, it is a conservative approach and this must be recognised
 when assessing results. Model outputs represented in the following section are for future
 median values and potential 95th percentile results. The median values are considered the most
 likely outcomes and the 95th percentile values are a low probability outcome (i.e 5% chance of
 being met or exceeded).

 4.3.3 Compliance check

 The following tables summarise the number of exceedances the model predicts for arsenic and
 sulphate for the modelled time period which covers 40 years for the baseline project (no
 additional mitigations). The following graphs show outputs over time for sulphate as an
 example of time distribution of outputs.

 Table 9 WBM Scenario analysis outputs – Number of model water quality
 outputs that exceed consented values at DC08

 Scenario Arsenic > Sulphate > Arsenic > Sulphate >
 0.15 g/m3 1000 g/m3 0.15 g/m3 1000 g/m3

 Median 95th percentile

 Baseline Project 0 0 0 0

 Camp Creek 16 0 0 0 0

 ½ Back Rd 0 0 0 0

 Table 10 WBM Scenario analysis outputs – Number of model water quality
 outputs that exceed consented values numbers at Loop Road

 Scenario Arsenic > Sulphate > Arsenic > Sulphate >
 0.01 g/m3 250 g/m3 0.01 g/m3 250 g/m3

 Median 95th percentile

 Baseline Project 0 0
At DC08 sulphate values for the baseline condition are predicted to vary over time around a
median of 100 to 200 g/m 3 (seasonal variation); with 95th percentile results occasionally
reaching 400 to 600 g/m 3 through the post closure period. Predictions through the operational
period and post closure period indicate median concentrations below current measurements
and this represents the dilution effects of the Camp Creek Dam coming online and recent
climatic conditions. Initially a gradual increase in predicted sulphate concentrations from WRS
seepage sources occurs and this aligns with the analysis completed by Babbage.

Values are predicted to remain consistently under the compliance limit. Arsenic and iron
concentrations are predicted well below compliance values.
At Loop Road the median results similarly stay within compliance over the 40 year time period
run in the model. Predictions are similar to those values currently measured which demonstrate
reduced impact of dilution from the Camp Creek Dam at Loop Road due to the relatively higher
base flows.

As shown in Table 10 the Monte Carlo simulation did identify the potential to exceed the 95th
percentile guidance values for both arsenic and sulphate in the long term.
A rise in contaminant concentration is identified from 2045 onwards. Mining ceases by 2025,
and 2045 is the period in the model when direct management of discharges has ceased and it is
assumed that all water generated on the mine is diverted back to natural catchments (i.e. there
is no reuse or water being pumped into the underground workings or pits). This introduces
surface runoff that has been classified in the model as “rehab impacted” as well as WRS runoff
and seepage (refer Table 4 ). This classification covers all mining areas other than the WRS
and that captured within pits (i.e. the TSF’s, roads and restored process area). The classification
is broad and potential water quality improvement from the various sources will likely be better
than assumed in the model.

The mean concentration of sulphate in this type of runoff is assumed to be 470 g/m 3 and the
mean assumed arsenic concentration is 0.02 g/m 3. In a Monte Carlo analysis there will be some
simulations where the upper possible deviation from these values are applied. As noted
previously, the 95th percentile analysis runs are a low probability of occurrence. This risk based
analysis provides useful guidance of risk, however the median values are those that are most
likely to occur.

At both sites a rise in concentrations is indicated between 2055 and 2058, which corresponds
with modelled overtopping of the Golden Point pit. This is considered to be a conservative result
as the pit lake water quality used in the model is based on current measured values. The pit
receives water from a number of poor quality sources that will not contribute post closure.

4.3.4 Nitrates

Figure 17 and Figure 18 show the predicted variation in nitrates over time at DC08 and at Loop
Road. These graphs show the median predicted values are well below the NPS Freshwater
Attribute B range (annual median >1.0 and ≤2.4) over the 40 year period modelled.
The Monte Carlo simulation applied in the WBM did identify the potential to exceed the NPS
Freshwater 95th percentile guidance value, particularly through the first 1 to 2 years of the
project as the Camp Creek Dam is activated. Current measured values at DC08 are below
1 g/m3. The median model outputs align well with current measured values and are thus taken
as most representative of future values. Any future change in source nitrate concentrations (i.e
from site seepage or runoff) will be identified through monitoring.

The Loop Road analysis results fit within the Attribute B median and 95th percentile values for
Nitrate-N over the 40 year period modelled.

 GHD | Report for Oceana Gold New Zealand Limited - Deepdell North Stage III Project, 125/02848/ | 25
Figure 15 Predicted Sulphate concentrations over time at DC08 (50th and 95th percentile values)

26 | GHD | Report for Oceana Gold New Zealand Limited - Deepdell North Stage III Project, 125/02848/
Figure 16 Predicted Sulphate concentrations over time at Shag River (50th and 95th percentile values)

 GHD | Report for Oceana Gold New Zealand Limited - Deepdell North Stage III Project, 125/02848/ | 27
Figure 17 Predicted Nitrate-N concentrations over time at DC08 (50th and 95th percentile values)

28 | GHD | Report for Oceana Gold New Zealand Limited - Deepdell North Stage III Project, 125/02848/
Figure 18 Predicted Nitrate-N concentrations over time at Shag River (50th and 95th percentile values)

 GHD | Report for Oceana Gold New Zealand Limited - Deepdell North Stage III Project, 125/02848/ | 29
4.3.5 Highlay Creek

 Figure 19 shows the Highlay Creek in relation to the new WRS. The figure shows that part of
 the WRS (18.8ha) will drain towards the Highlay Creek. The WRS area is relatively small
 compared to the overall catchment upstream of the Deepdell Creek confluence (2%).

 Samples (#17) taken from the creek at site HC01 indicate median sulphate concentrations
 below 10 g/m3 and a maximum recording of 70 g/m 3. The median Nitrate value (Nitrate-N) is
 0.09 g/m3 and the maximum reading is 0.49 g/m 3.

 A simple mass balance analysis was undertaken to assess what change WRS seepage might
 make to the stream water quality. The analysis showed some elevation in parameters due to the
 introduction of seepage, but not beyond compliance values applicable at DC08. For example
 median sulphate values post closure were predicted to increase from 7 g/m 3 to 59 g/m3 in low
 flow conditions.

 HC01

 Figure 19 Highlay Creek in relation to Deepdell East WRS

30 | GHD | Report for Oceana Gold New Zealand Limited - Deepdell North Stage III Project, 125/02848/
5. Potential downstream flow impacts A high level review of the impact of the project on flows in the Deepdell and Highlay Creek was undertaken. Flows could reduce through the following activities: Excavation and dewatering of the Deepdell North Stage III pit Backfill of the Deepdell South pit Construction of the Deepdell East WRS Construction of silt ponds associated with the Deepdell East WRS. The mechanisms that will affect the flows within the catchment include: Removing an area of the catchment that would normally provide runoff through excavation of the pit Localised drawdown of the groundwater table due to dewatering the pit Affecting the permeability of a portion of the catchment through constructing the WRS Delaying runoff transmission to the streams through construction of silt ponds Adding an additional surface producing runoff area through backfilling the Deepdell South Pit. As a high level assessment the following comments can be made regarding the potential effects of these activities and mechanisms on the flows within the Deepdell and Highlay Creek catchments: The catchment area reporting to DC07 below the Deepdell North pit is 55.6 km2. By comparison, the area affected by the proposed project is 1.1 km2 (0.8 km2 new disturbance) or 2% of the catchment area. The affected catchment area contributing to the monitoring point HC01 is approximately 0.25 km2 within a total catchment of 5.5 km2, corresponding to a 4.5% disturbance. Runoff from this area may be reduced or delayed through the construction of the WRS, however runoff is unlikely to be curtailed completely. Hence, the effect of the activity on this catchment would likely be less than 5% of the base flow. An unknown quantity is the effect that dewatering within the proposed Deepdell North pit would have on the groundwater table and resultant base flow to the stream. Based on anecdotal evidence that the stream flow is very low during dry periods, it is assumed that the groundwater contribution is not significant through this reach. The construction and activation of the Camp Creek Dam would mitigate the expected reduction in direct runoff from the affected areas during low flow periods. Overall the effects on stream flows are expected to be minimal with potential for low flow benefits on activation of the Camp Creek Dam. GHD | Report for Oceana Gold New Zealand Limited - Deepdell North Stage III Project, 125/02848/ | 31
6. Water Quality Monitoring
 6.1 Approach
 OGNZL has a well established water quality monitoring regime for the Macraes mine site which
 already captures data at key sites.

 In addition to the current compliance points in Deepdell Creek and the Shag River (DC08 and
 Loop Road) OGNZL has a comprehensive network of sampling points across that site that they
 have used to build a database of site water source quality. This covers WRS seepage, silt
 ponds and surface water drains and this database has formed the basis for deriving
 representative water quality values used in our analysis.
 The current level of monitoring for the two compliance points is considered appropriate to
 continue with and is reproduced in Appendix C for reference.

 In addition OGNZL propose to obtain representative samples of groundwater seepage from the
 toe of the Deepdell East Waste Rock Stack and the Deepdell Waste Rock Stack at the points
 where the current and future silt ponds (Highlay Silt ponds, Deepdell South and North silt ponds
 are located. This data will serve to validate and check the sulphate predictive equations
 developed by Babbage (refer Appendix B).

 32 | GHD | Report for Oceana Gold New Zealand Limited - Deepdell North Stage III Project, 125/02848/
7. Conclusions This study specifically assessed the potential impact of the Deepdell North project on downstream water quality. The analysis completed with the WBM shows a low potential for future non-compliance with current resource consent conditions. The WBM uses a risk based approach and the median future water quality values predicted by the model (i.e. most likely outcome) do not exceed current resource consent condition values. Worst case (95th percentile) water quality results indicate a future potential (2045 to 2060) for exceedance of sulphate and arsenic values post closure. In the context of the analysis this is a very low probability outcome (less than once per 5 year period). If the NPS Freshwater Attribute B nitrate levels are applied the model also predicts full compliance at both sites for median predicted water quality results. However, at DC08 a low probability to exceed Attribute B maximum values is predicted between 2045 and 2060 (less than once per 5 year period). Based on the model outputs, the current adaptive management approach that OGNZL is applying to site water management is still applicable. No immediate risk of non-compliance is predicted; however, the modelling has identified a very low probability future potential from 2045 onwards. The adaptive management approach OGNZL is currently following includes the following key features: Ongoing monitoring to confirm WBM projections and to identify and track changes in downstream water quality. The monitoring regime proposed by OGNZL is included as Appendix C for reference. Ongoing refinement of WRS construction to improve seepage water quality. Trialling of passive water treatment systems as mentioned in section 2.3.2 so that suitable methods for the site have been tested and can be implemented for the post closure period if deemed necessary at the time. Construction of a fresh water dam on Camp Creek (operating by January 2022) to provide a base flow to Deepdell Creek to manage and effectively mitigate sulphate concentrations in Deepdell Creek and in the Shag River as far as the confluence with McCormicks Creek. Mitigations could also include introduction of localised treatment systems, amending WRS construction practises, delaying the diversion of flows from rehabilitated areas and reducing the footprint of future WRSs. Given there are a range of mitigation options available and OGNZL is actively investigating a number of measures it is not considered necessary at this point in time for OGNZL to commit to a specific mitigation solution. Rather the ongoing adaptive management approach being currently applied should be continued. The study also looked at the potential introduction of a consent limit for nitrates in line with the NPS Freshwater Attribute B values. Based on median outputs these values can be achieved. OGNZL is currently investigating sources of nitrates in runoff and a study completed by GNS showed both country rock and unburnt explosives as potential sources of nitrates. Before any new consent conditions are added for nitrates the sources in the surrounding catchments warrant further investigation. It is recommended that OGNZL focus on establishing monitoring to build up the understanding of the various sources of nitrogen compounds, specifically so that the mine input can be separated out. GHD | Report for Oceana Gold New Zealand Limited - Deepdell North Stage III Project, 125/02848/ | 33
8. References
 GNS 2019, Source identification of NO3 in mine derived discharge waters using stable isotopes.
 Golder 2011c. Macraes Phase III Project. Site wide surface water model. Report produced for
 Oceana Gold (New Zealand) Ltd by Golder Associates (NZ) Limited. Golder report 0978110-
 562 R008 vD. April 2011.
 Golder 2011d. Macraes Phase III Project. Water management summary report. Report
 produced for Oceana Gold (New Zealand) Ltd by Golder Associates (NZ) Limited. Golder report
 0978110-562 R002 vE. April 2011.
 Golder 2011e. Macraes Phase III Project. Water quality effects mitigation options. Report
 produced for Oceana Gold (New Zealand) Ltd by Golder Associates (NZ) Limited. Golder report
 0978110-562 R009 vE. April 2011.
 Otago Regional Council. Shag River/Waihemo catchment water quality and ecosystem.
 November 2014.

 Ryder Environmental Limited, Deepdell North Stage III Project Aquatic Ecology Assessment for
 Deepdell North III Project, 2019.

 WGA 2019, Macraes Gold Project – Mine Site Dissolved Nitrogen Discharges, Draft Report
 April 2019
 WGA 2018, Macraes Gold Project – Mine Water Model Integration, Draft Report May 2018

 34 | GHD | Report for Oceana Gold New Zealand Limited - Deepdell North Stage III Project, 125/02848/
You can also read