Design-Build Utilization - Combined Market Study June 2018 - DBIA
←
→
Page content transcription
If your browser does not render page correctly, please read the page content below
Design-Build Utilization
        Combined Market Study
                   June 2018
FMI forecast methodology

                                                     Quantitative Market Model:
To derive a market forecast, FMI
uses a triangulation method that                     Utilizing multiple sources, both historical and forward
utilizes multiple sources to develop                 looking, FMI generates a baseline forecast for
and validate the market’s size and                   construction put in place spending at a local level for
                                                     each of the various segments examined in this study.
direction. The following diagram                     For example, historical construction spending put in
represents the methodology used                      place is reported by the U.S. Census and is then
                                                     forecast at a local level using local economic
for developing construction put in                   indicators, such as population growth, GDP,
place estimates.                                     unemployment rate, etc.

Anticipated Project Examination:                                               Market-Driven Validation:

                                                                               FMI then validates and adjusts as necessary
Utilizing FMI’s proprietary project databases,   Addressable                   the market sizing and forecast based upon
CMD Reed, Industrial Info Resources, Dodge
and other secondary sources, FMI adjusts
                                                   Market                      primary research conducted with actual
                                                  2018-2021                    market participants and senior FMI
the baseline, quantitative market model to
                                                                               consultants. These industry members can
reflect planned projects over the term of the
                                                                               speak directly to market conditions and
forecast. Projects are vetted on likelihood of
                                                                               direction based upon there intimate
occurring based upon the known and
                                                                               knowledge of the individual market and
anticipated market conditions.
                                                                               segment.

                                                                                                     FMI Corporation Copyright 2018   2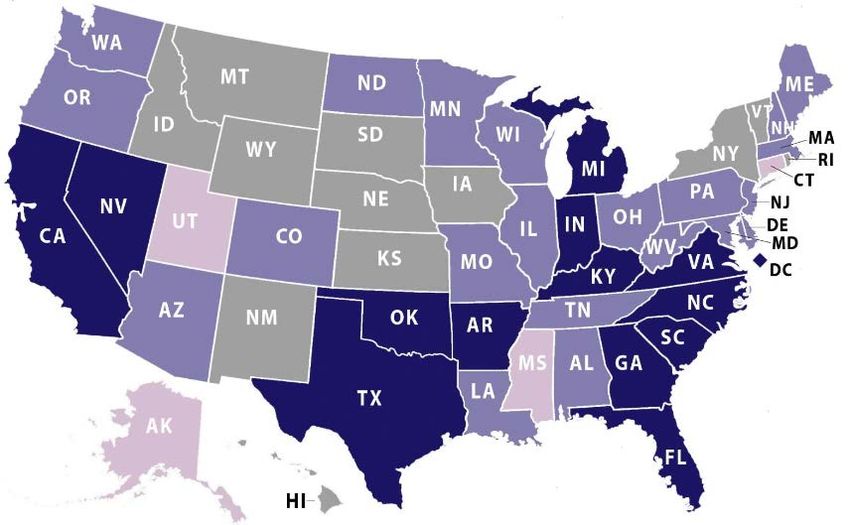
Approach and Sources

Step 1: Construction Put in Place (CPiP)
 Determining total construction put in place (CPiP) for the assessed segments* is the first and most critical step in estimating the design-build market
 opportunity. FMI’s definitions and historical CPiP estimates match reports released by the U.S. Census Bureau. Five-year CPiP forecasts are modeled
 and maintained utilizing various resources:
    • In-house econometric models analyze trends and predict shifts in construction spending against various demographic and economic drivers.
    • Technical in-house publications and subscriptions, including FMI’s own Nonresidential Construction Index (NRCI) and construction project
       databases are utilized to offer insight into each segment considering backlogs, trends influencing demand and various project details.
    • FMI’s industry relationships and staff expertise/review.

Step 2: Design-build Construction Put in Place
 Next, FMI developed custom market-sizing specifically for design-build construction by segmenting spending into various segment types and Census
 divisions. Estimates for design-build construction spending were derived through a combination of historical project databases, planned project lists,
 stakeholder interviews and industry stakeholder surveys.
 For this research, design-build was defined as a method to deliver a project in which the design and construction services are contracted by a single
 entity.
    • The use of consistent design-build terminology varied by construction segment (i.e., manufacturing, commercial, etc.). To account for all design-
        build spending, several variations of design-build were considered and assessed when developing the market-sizing model.
Key research sources include, but are not limited to those listed below:
 United States Census Bureau
    • Construction put in place history
 Various Primary and Secondary Resources
    • Stakeholder interviews/surveys
    • Key secondary resources (e.g., ENR, Dodge, McGraw-Hill, REED, IIR, Global Insights, PWF)
    • Industry focused associations (e.g., DBIA, ARTBA, AWWA, AIAI)
    • Government agency databases (STIP, CIP, project lists)

Study results/findings
 The results of the study were developed through a combination of DBIA provided contacts and FMI internal contacts. In total, 82 interviews were
 conducted and 101 survey responses were collected.
    • Firms of all revenue sizes participated on the study. These ranged from ENR top-10 firms to firms with $10 million in annual revenue. The study
       was unbiased towards firm type, service/product offering or association affiliation.

        *Assessed segments include: religious, public safety, communication, amusement
        and recreation, lodging, health care, transportation, office, commercial,
        manufacturing, educational highway/street, water/wastewater                                                           FMI Corporation Copyright 2018   3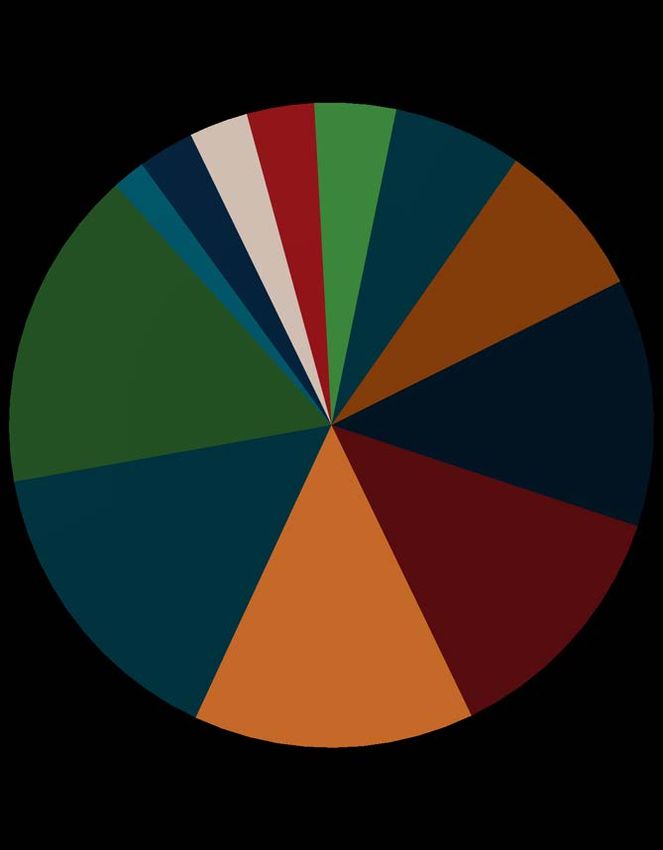
Table of contents

 Section                                      Slide

 Executive Summary                               6

 Combined Market Sizing (Assessed segments)      8

 Nonresidential Market                          15

     Market Sizing                              16

     Trends and Drivers                         25

 Highway/street and Water/Wastewater Market     40

     Market Sizing                              41

     Trends and Drivers                         49

 Appendix                                       59

                                                      FMI Corporation Copyright 2018   4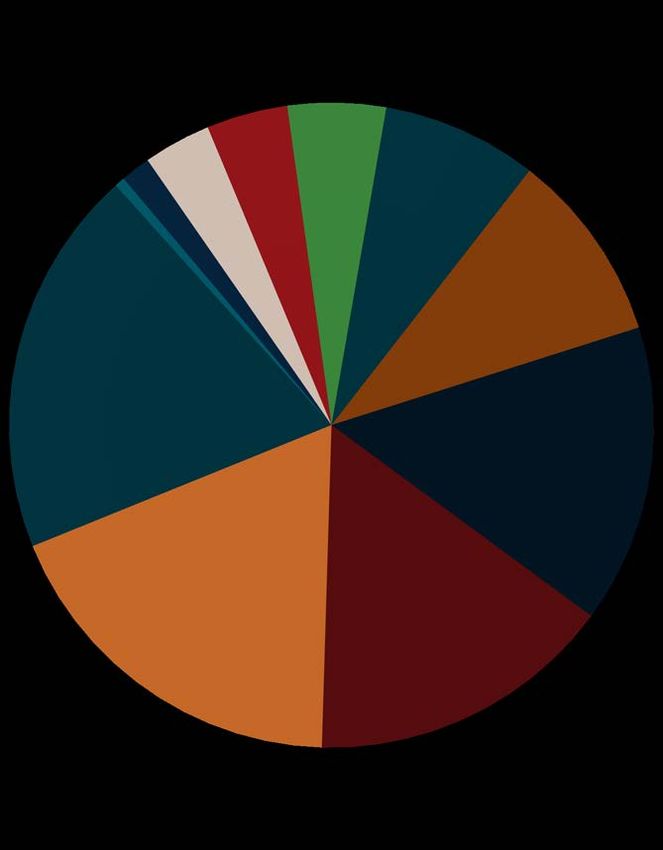
Executive Summar y
Executive Summary

Design-build construction spending in the assessed segments is anticipated to grow 18% from 2018 to 2021 and reach
over $320 billion.
  • Design-build is anticipated to represent up to 44% of construction spending in the assessed segments by 2021. Design-
    build spending in Manufacturing, Highway/Street and Education represent the greatest percentage of design-build
    construction spending by segment over the 2018-2021 period.
  • The Mountain (6.3%), Pacific (6.1%) and South Atlantic (6.2%) census divisions are anticipated to yield the highest growth
    rates over the 2018-2021 period.
Owner’s have traditionally employed design-bid-build as the project delivery method of choice. As owner needs and
project demands have changed, owners have become increasingly likely to assess the option to employ alternative
delivery methods.
  • Owner selection of a project delivery method involves multiple factors. Overall, owners identified “delivery schedule” as the
    greatest influence of project delivery method selection. In addition, owner goals and objectives were identified to be highly
    influential in project delivery method selection.
  • The education process for design-build has continued to expand. A continued emphasis toward educating owners and
    project stakeholders on the process and benefits associated with design-build will facilitate continued adoption and greater
    utilization.
From an industry perspective, alternative project delivery methods have become a more frequent option for both
public and private owners. On the public side, enabling design-build legislation has been put in place to facilitate
increased use. Private owners indicated utilizing design-build on projects presenting unique challenges.
  • Overall, owners indicated receiving significant value from design-build when employed on larger and more complex
    projects. These projects allowed for greater opportunity to provide project innovations and subsequent cost savings.
  • In addition to larger and more complex projects, design-build utilization continues to expand into project sizes
Combined Market
                        Sizing
           (Assessed Segments)

Assessed segments include: religious, public safety, communication,
amusement and recreation, lodging, health care, transportation, office,
commercial, manufacturing, educational, highway/street, water/wastewater
Overall, design-build is anticipated to account for 44% of construction spending in the assessed
segments over the 2018-2021 forecast period.
Market size comparison Distribution of market
Total combined spend, Rollup, 2018-2021 US$ CPiP spending, 2018-2021
Communication
Total U.S. Construction Put in Place (CPiP) *Other, 2% , 3% Water/Wastewater
$5.4 Trillion Manufacturing, , 3%
16%
Amusement
and
Recreation, 3%
Segment breakout
Educational,
Lodging , 4%
15%
Health Care,
6%
U.S. Construction Put in Place (CPiP) Transportation,
Assessed Segments - $2.7 Trillion 8%
Highway/street,
14% Office, 12%
Commercial,
13%
Design-build CPiP
New England,
Assessed Segments - $1.2 Trillion South Atlantic,
4%
20% ESC, 5%
Market breakout
Mountain, 8%
WNC, 9%
Pacific, 17%
WSC, 11%
ENC, 14% Mid-Atlantic,
12%
*Other includes: Public safety and religious
FMI Corporation Copyright 2018 8Design-build construction spending in the assessed segments is anticipated to grow 18% from
2018 to 2021.
Design-build construction put in place (Assessed segments); 2013-2021
Billions of dollars
Source(s): FMI analysis of multiple sources
$350 15%
$324
$307
13.1% 13%
$300 $290
$274
$257
Construction Put in Place; Billions of dollars
11%
$250 $238
$222
9.2% 9%
Year-over-year growth
$196
$200
$180 7.9%
7.2% 7%
6.8%
$150 5.8%
5.6% 5.6%
5%
$100
3%
$50
1%
$0 -1%
2013 2014 2015 2016 2017 2018 2019 2020 2021
FMI Corporation Copyright 2018 9The Mountain, Pacific and South Atlantic census divisions are anticipated to yield the highest
growth rates over the 2018-2021 period.
Design-build construction put in place by census division (Assessed Segments)
Billions of dollars
Source(s): FMI analysis of multiple sources
Billions CAGR
of current dollars 2018e 2021f (18-21)
Mountain $22.0 $26.4 6.3%
WEST
Pacific $45.7 $54.5 6.1%
East North
MIDWEST
Central
$39.1 $45.9 5.5%
West North
Central
$23.7 $27.5 5.1%
NORTHEAST
New England $11.4 $13.1 4.8%
Middle Atlantic $32.7 $37.8 5.0%
South Atlantic $54.7 $65.6 6.2%
SOUTH
East South
Central
$13.6 $16.1 5.6%
West South
Central
$31.2 $36.7 5.5%
U.S. Total $274.2 $323.7 5.7%
FMI Corporation Copyright 2018 10Manufacturing, educational and highway/street hold the largest share of design-build spending
through 2021.
Distribution of forecast spending by segment Distribution of market
Combined CPiP spending, 2018-2021 CPiP spending, 2018, 2021
Source(s): FMI analysis of multiple sources Source(s): FMI analysis of multiple sources
Water/Wastewater
Amusement and
3%
Recreation $53 Manufacturing CAGR: 6.6%
Communication 3%
3%
Other Lodging
2% 4% $44
Health Care $49 Educational CAGR: 5.8%
7%
Transportation $42
8% $46 Highway/street CAGR: 7.0%
Manufacturing $38
16%
Office $41 Commercial CAGR: 4.6%
12%
$36
$40 Office CAGR: 4.9%
$35
Educational $26 Transportation CAGR: 5.6%
15% Commercial $22
13%
$21 Healthcare CAGR: 7.1%
$17
$13 Lodging CAGR: 4.7%
$11 Amusement & Rec. CAGR: 3.9%
Highway/street $11
$10
14% $8 $9 Water/Wastewater CAGR: 4.8%
Communications CAGR: 3.9%
*Other CAGR: 6.7%
1 2
2018 2021
Total spend 2018-2021: $1,193B
$274.2B $323.6B
*Other includes: Public safety and religious
FMI Corporation Copyright 2018 11Design-build is anticipated to continue to gain market share over the 2018-2021 period.
Distribution of delivery method utilization
Source(s): FMI analysis of multiple sources
2018-2021 CPiP: $2,729B
2013-2017 CPiP: $2,779B Other
2%
Other
2%
Design-bid-
build
19%
Design-bid-
build Design-build Design-build
27% 39% 44%
CMGC/CMAR
CMGC/CMAR 35%
32%
• Dissatisfaction with the adversarial nature and limitations of design-bid-build as well as increasingly challenging project characteristics and demands
has resulted in greater interest in and use of design-build and other alternative delivery methods.
• Negative project owner experience and perceptions of design-bid-build are most influenced by limited opportunity for innovation, lack of a fast-track
process and higher risk profile for the project owner.
*Other includes EPC and IPD
**CMGC/CMAR, design-bid-build and Other percentages are based on estimated utilization across construction spending.
FMI Corporation Copyright 2018 12Design-build construction spending is anticipated to account for $1.19 trillion over the 2018-
2021 forecast period.
% of total % of total
Forecast by Spend CAGR Spend CAGR
design-build Forecast by segment design-build
Geography 2018-2021 2018-2021 2018-2021 2018-2021
CPiP CPiP
South Atlantic $240.0 6.2% 20.1% Manufacturing $192.9 6.6% 16.2%
Educational $182.2 5.8% 15.3%
Pacific $199.5 6.1% 16.7%
Highway/Street $167.9 7.0% 14.1%
ENC $169.4 5.5% 14.2%
Commercial $152.4 4.6% 12.8%
Mid Atlantic $141.4 5.0% 11.8% Office $148.5 4.9% 12.4%
Transportation $94.9 5.6% 8.0%
WSC $136.3 5.5% 11.4%
Health Care $77.3 7.1% 6.5%
WNC $102.5 5.1% 8.6%
Lodging $48.7 4.7% 4.1%
Mountain $96.3 6.3% 8.1% Amusement and
$40.4 3.9% 3.4%
Recreation
ESC $59.2 5.6% 5.0% Water/Wastewater $33.6 3.9% 3.0%
Communication $33.6 3.9% 2.8%
New England $49.4 4.8% 4.1%
*Other $5.1 4.0% 1.7%
Total $ 1,193.9 5.7% 100% Total $ 1,193.9 5.7% 100%
*Other includes: Public safety and religious
FMI Corporation Copyright 2018 13Nonresidential Market Nonresidential segments include: religious, public safety, communication, amusement and recreation, lodging, health care, transportation, office, commercial, manufacturing, educational
Market Sizing
Total U.S. nonresidential construction spending is anticipated to reach over $550 billion by
                                                 2020.
                                                 U.S. nonresidential construction put in place; 2013-2021
                                                 Billions of dollars
                                                 Source(s): FMI

                                                 $700                                                                                                              30%

                                                 $600                                                                                              $586
                                                                                                                                 $565                              25%
                                                                                                                          $543
Construction Put in Place; Billions of dollars

                                                                                                                   $523
                                                                                                            $500
                                                 $500
                                                                                                  $470
                                                                                     $445                                                                          20%

                                                                                                                                                                         Year-over-year growth
                                                                        $392
                                                 $400
                                                               $360
                                                                                                                                                                   15%
                                                                                     13.4%
                                                 $300

                                                                                                                                                                   10%
                                                 $200                   8.8%

                                                                                                            6.5%
                                                                                                  5.6%
                                                                                                                                                                   5%
                                                 $100                                                              4.5%
                                                                                                                          4.0%   3.9%             3.8%

                                                    $-                                                                                                             0%
                                                               2013     2014         2015         2016      2017   2018   2019   2020              2021

                                                                                                                                        FMI Corporation Copyright 2018   16
Overall, design-build is anticipated to account for 45% of nonresidential construction spending
over the 2018-2021 forecast period.
Market size comparison Distribution of market
Total combined spend, Rollup, 2018-2021 US$ CPiP spending, 2018-2021
Public Safety,
Total U.S. Construction Put in Place (CPiP) 1% Amusement and
Religious, 1%
$5.4 Trillion Recreation, 4%
Educational,
18% Communication
, 3%
Segment breakout
Lodging , 5%
Health Care,
8%
Transportation,
Manufacturing, 10%
U.S. Nonresidential Construction Put in Place (CPiP) 19%
Target Segments - $2.2 Trillion
Commercial, Office, 15%
15%
Design-build CPiP New England,
$990 Billion South Atlantic,
4% ESC, 5%
20%
Market breakout
Mountain, 7%
WNC, 9%
Pacific, 17%
WSC, 10%
Mid Atlantic,
ENC, 15% 12%
FMI Corporation Copyright 2018 17Design-build is anticipated to continue to gain market share over the 2018-2021 period.
Distribution of delivery method utilization
Source(s): FMI analysis of multiple sources
2018-2021 CPiP: $2,217B
2013-2017 CPiP: $2,167B
Design-build
Design-build 45%
42%
Other
Other
58%
55%
*Other includes: CMAR/CMGC, Design-bid-Build, IPD, EPC
FMI Corporation Copyright 2018 18Design-build spending for nonresidential construction is anticipated to grow 17% from 2018 to
2021.
U.S. nonresidential design-build construction put in place; 2013-2021
Billions of dollars
Source(s): FMI analysis of multiple sources
$300 30%
$268
$254
$250 $241 25%
$228
Construction Put in Place; Billions of dollars
$214
$197
$200 20%
$184
Year-over-year growth
$161
$150 $146 15%
14.3%
$100 10.2% 10%
8.4%
7.3%
6.7%
5.4% 5.5% 5.6%
$50 5%
$0 0%
2013 2014 2015 2016 2017 2018 2019 2020 2021
FMI Corporation Copyright 2018 19The Mountain census division is anticipated to yield the highest growth rate over the 2018-2021
period.
U.S. nonresidential design-build construction put in place by census division
Billions of dollars
Source(s): FMI analysis of multiple sources
Billions CAGR
of current dollars 2018e 2021f (18-21)
Mountain $16.8 $20.1 6.1%
WEST
Pacific $38.4 $45.6 5.9%
East North
MIDWEST
$34.1 $39.8 5.2%
Central
West North
$19.8 $22.8 4.8%
Central
NORTHEAST
New England $10.1 $11.6 4.7%
Middle Atlantic $27.9 $32.4 5.0%
South Atlantic $45.9 $54.6 5.9%
SOUTH
East South
$11.5 $13.5 5.4%
Central
West South
$23.7 $27.8 5.6%
Central
U.S. Total $228.2 $268.0 5.5%
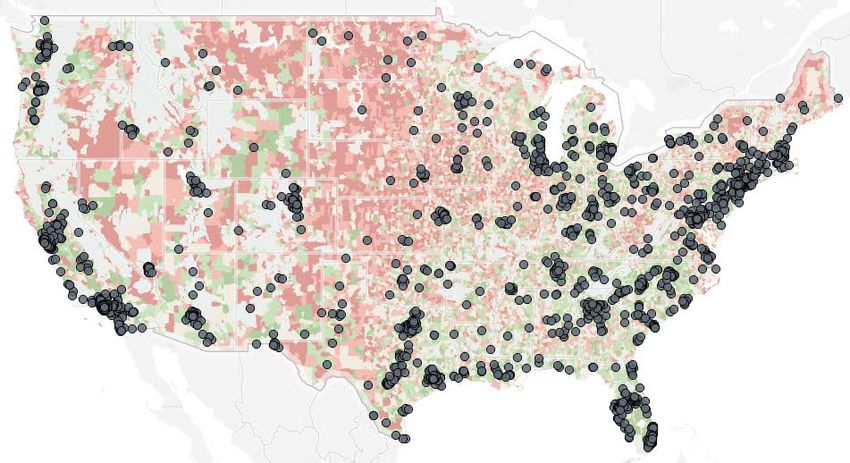
FMI Corporation Copyright 2018 20Construction activity is increasingly concentrated in a limited number of markets.
Nonresidential project locations across U.S. megapolitans
Projects completed, under construction or planned in past 12 months
Source(s): FMI analysis of multiple sources
Cascadia
Twin Cities
Great Lakes
Mountain
Sierra Pacific
Megalopolis
Texas Triangle
Project
Southwest
Piedmont
Florida
FMI Corporation Copyright 2018 21At 19%, manufacturing holds the largest share of design-build spending through 2021.
Distribution of forecast spending by segment Distribution of market
Combined CPiP spending, 2018-2021 CPiP spending, 2018, 2021
Source(s): FMI analysis of multiple sources Source(s): FMI analysis of multiple sources
Communication Amusement and
3% Recreation $53 Manufacturing CAGR: 6.6%
4%
Public Safety
2% Lodging
5%
Religious $44
Health Care
1%
8%
$49 Educational CAGR: 5.8%
Transportation $42
10%
$41 Commercial CAGR: 4.6%
Manufacturing
19% $36
Office $40 Office CAGR: 4.9%
15%
$35
$26 Transportation CAGR: 5.6%
$22
$21 Healthcare CAGR: 7.1%
Educational $17
18% Commercial $13 Lodging CAGR: 4.7%
15% $11
$11 Amusement & Rec. CAGR: 3.9%
$10
$8 $9 Communications CAGR: 3.9%
Public safety CAGR: 6.7%
1 2 Religious CAGR: 4.0%
2018 2021
Total spend 2018-2021: $990B
$228.2B $268.0B
FMI Corporation Copyright 2018 22Nonresidential design-build construction spending is anticipated to account for $990 billion
over the 2018-2021 forecast period.
% of total % of total
Forecast by Spend CAGR Spend CAGR
design-build Forecast by segment design-build
Geography 2018-2021 2018-2021 2018-2021 2018-2021
CPiP CPiP
South Atlantic $200.5 5.9% 20.2% Manufacturing $192.9 6.6% 19.5%
Educational $182.2 5.8% 18.4%
Pacific $166.9 5.9% 16.8%
Commercial $152.4 4.6% 15.4%
ENC $147.1 5.2% 14.8%
Office $148.5 4.9% 15.0%
Mid Atlantic $121.1 5.0% 12.2%
Transportation $94.9 5.6% 9.6%
WSC $103.0 5.6% 10.4% Health Care $77.3 7.1% 7.8%
WNC $85.2 4.8% 8.6% Lodging $48.7 4.7% 4.9%
Amusement and
$40.4 3.9% 4.1%
Mountain $79.6 6.1% 7.4% Recreation
Communication $33.6 3.9% 3.4%
ESC $49.7 5.4% 5.0%
Public Safety $14.8 6.7% 1.5%
New England $43.5 4.7% 4.4%
Religious $5.1 4.0% 0.5%
Total $ 990.8 5.5% 100% Total $ 990.8 5.5% 100%
FMI Corporation Copyright 2018 23Trends and Drivers
Delivery schedule, owner goals and objectives, contractor experience and initial cost were
  indicated to be extremely influential in the selection of a project delivery method.
  Characteristics that were indicated to be extremely influential in the selection of a project delivery method.
  Questions were answered on a 1 to 5 scale (1=not influential, 5=extremely influential)
  Source(s): FMI Survey

    Percentage of respondents that indicated extremely influential

                                                                                                       The critical nature of the project has a major
                   Delivery schedule                                                         48%
                                                                                                       impact to selection, and owner’s want to ensure
                                                                                                       that a timely delivery schedule is understood and
        Owner goals and objectives                                                          46%        provides adequate time to successfully deliver
                                                                                                       the project.
              Contractor experience                                                        45%         Initial cost is always a key factor in project
                                                                                                       delivery selection. The use of alternative delivery
                           Initial cost                                              41%               methods was indicated to provide the best
                                                                                                       avenue to achieve the originally identified cost.

  Project complexity and innovation                                    29%           Understanding the needs of owners is highly important for industry
                                                                                     participants. The ability to get in early and develop strong
Staff experience/ availability (owner)                        21%
                                                                                     communication and understanding of what the owner values
                                                                                     provides a solid foundation for successful project delivery.
                                                                                     Alternative delivery methods provide the ability to work with the
                         Project type                        20%                     owner early on and identify key areas of importance.

                                                                                     Experience is also a key factor in project delivery method selection.
         Level of design completion                         18%
                                                                                     Having a stable of available firms to perform the work allows the
                                                                                     owner to achieve the greatest results. A limited pool of experienced
       Initial project risk assessment                 15%                           firms does not provide the owner with the added advantages of
                                                                                     early firm involvement.
                Legal and regulatory                  13%

                       Life-cycle cost           9%

             Third-party agreements        4%

                                                                                                                                FMI Corporation Copyright 2018   25
Delivery schedule was the most influencing factor for owners when selecting a project delivery
method.
Project delivery method influencing characteristics
Weighted average of responses
Source(s): FMI Survey
Extremely 5
influential Questions were answered on a 1 to
5 scale (1=not influential,
5=extremely influential)
4.5 Delivery schedule Primary
Owner
Owner goals and influencers
objectives
Owner identified influencers
4 Contractor
Project type experience
Project complexity
Level of design Secondary
And innovation
completion owner
Initial cost influencers
Initial project risk Staff experience/
assessment availability
3.5
Life-cycle cost
3 Legal and regulatory Tertiary
Owner
influencers
Third-party agreements
2.5
Slightly
influential 2
2 2.5 3 3.5 4 4.5 5
Slightly Extremely
influential Non-owner identified influencers influential
FMI Corporation Copyright 2018 26The majority of project delivery methods are selected during project programming.
When does your organization typically make its project delivery method decision?
Source(s): FMI Survey
• During this phase few decisions are made regarding which project delivery method will be used.
Project development
• Typically during this phase owners define the projects goals and objectives. In addition, owners will
13% of selections
identify potential constraints/issues associated with the project. This process allows owners to review
the project delivery methods available for their specific project type.
• During this phase the majority of project delivery methods are selected.
• Owners can conduct a thorough assessment of the risks associated with the project and the resulting
Project programming advantages/disadvantages of each project delivery method.
74% of selections
• The challenge is that a minority of owners have a formal risk management process, and most do not
demonstrate a strong commitment to conducting a formal risk assessment. This is often due to the
complexity of conducting a formal risk assessment.
• Owners do not typically select a project delivery method at the end of final design. If they are aiming to
End of final design
utilize an alternative delivery method they will involve other stakeholders earlier in the process.
3% of selections
Other • Depending on the needs and circumstances an owner faces, project delivery method selection may
12% of selections take place outside of the above mentioned times.
FMI Corporation Copyright 2018 27Familiarity with design-build is increasing as owners have become more knowledgeable on the
process.
Design-build education process
Market commentary
• The education process for design-build has continued to expand.
However, the lack in owner knowledge and understanding of the • “It seems that some of the user community has
design-build process is a limiting factor for greater utilization. design-bid-build engrained in their delivery method
selection.”
• Once owners get a full understanding of the process and benefits
associated with design-build they are more likely to continue to employ • “We are seeing design-build used more frequently
it as a preferred delivery method. across public projects. It is nice to see this
flexibility.”
• DBIA is recognized as pushing the industry and increasing overall
awareness of the process. It was stated that in the past five years • “There are challenges with having owners that are
there has been significant improvement in the push towards greater in the education process. They need to learn to
design-build utilization. trust the process.”
“DBIA has done a good job at getting all stakeholders involved for • “We don’t see a lot of the small municipalities
the industry.” taking advantage of design-build, but they might
not be the best fit for that delivery method.”
• Although DBIA is pushing the industry in the right direction, one-third
of respondents identified DBIA as the source for project delivery • “Once you have lived through the low bid
methods and one-third of respondents rely on legacy information. environment, it is not hard to see the benefits of
design-build.”
40% • “Firms that are arguing for design-bid-build are the
33% 34% ones that don’t understand the process and the
35%
benefits of other methods.”
30%
• “Design-build is not for everyone. If there is an
25%
owner that doesn’t understand it they should think
20% twice before using it.”
15% 12% 12% • “Design-build is a great tool to use. I don’t think the
9% construction community at large understands it or
10%
realizes how often it is used.”
5%
0%
Other AIA AGC Legacy DBIA
FMI Corporation Copyright 2018 28Over half of owners indicated using or anticipate using design-build in the next five years.
Which of the following project delivery methods has your organization used, or anticipates using in the next five years?
Owner respondents
Source(s): FMI Survey
Owner’s have traditionally employed
design-bid-build as the project delivery
method of choice. As owner needs and
Design-bid-build 82% project demands have changed, owners
have become increasingly likely to
employ an alternative delivery method.
Design-build 58% Alternative project delivery methods have become a
more frequent option for both public and private
owners. On the public side, legislation has been put
in place to facilitate increased use. These methods
allow owners to address specific project/program
needs. Owners indicated that moving forward over
the next five years their use of these methods will
CMAR/CMGC 50% continue.
EPC 6% The use of IPD and EPC delivery methods are more
specific to select segments. IPD was indicated to be
used to a greater extent in the health care market,
whereas EPC is consistently employed in the heavy
industrial market. Stakeholders believe this will
remain the norm moving forward. IPD in specific has
not gained the traction originally assumed.
IPD 3%
FMI Corporation Copyright 2018 29The majority of owners indicated design-build utilization will increase in the next 5 years.
From an industry perspective, how will the use of the following delivery methods change in the next 5 years?
Owner respondents; (1=significant decrease, 5=significant increase)
Source(s): FMI Survey
100% 4% Significant increase
8%
11% Slight increase
90% 19%
Stay the same
Slight decrease
80%
Significant decrease
38%
70%
• Sixty-seven percent of owner respondents
indicated an increase in the use of design-build
60% 54%
48% in the next 5 years.
• Forty-six percent of owner respondents indicated
50%
an increase in the use of CMGC/CMAR in the
next 5 years. However, 16% of owners see a
40% decrease.
38% • Over 50% of owners believe the use of design-
30% bid-build will remain the same. However, 32%
believe there will be a decrease in use.
20% 29%
29%
10% 8%
8% 5%
4%
0%
Design-bid-build CMGC/CMAR Design-build
FMI Corporation Copyright 2018 30Experience with design-build was rated highest across all project delivery methods.
Experience with various delivery methods
Weighted average of responses; (1=poor, 5=excellent)
Source(s): FMI Survey
Poor Fair Good Very Good Excellent
Market commentary:
Design-build 8% 14% 35% 41% 4.07 • “We’ve found the use of design-
build to be a good experience. It
reduces our risk and the issues
can be defined to the design-build
team.”
CMGC/CMAR 4% 27% 40% 28% 3.93 • “CMAR seems to be less
challenging from a legislative point
of view. It doesn’t have the
requirements that design-build
does.”
IPD 9% 35% 22% 30% 3.65 • “In the Northeast CMAR is the
dominant delivery method. Every
once in a while we will have a
design-build project come along.”
• “CMAR is beneficial when we want
EPC 22% 39% 22% 11% 3.11 to have more oversight of the
project. We can reach out directly
to the architect.”
• “IPD doesn’t seem to have picked
up or caught on outside of a few
Design-bid-build 22% 35% 23% 11% 3.06 healthcare projects.”
Poor Excellent
FMI Corporation Copyright 2018 31Opportunities to innovate and the ability to fast track a project were identified as top benefits
associated with design-build.
Which project delivery method do you most associate the following benefits with? Associated benefit
Source(s): FMI Survey Least Most
Ability to achieve design excellence
More collaborative process for the
Least project risk (for the owner)
Most qualified service providers
More opportunities to innovate
Greater project/ design control
More predictable/ manageable
Shorter procurement period
Final cost closest to budget
Ability to fast track project
Early knowledge of cost
Fewer disputes
Highest quality
schedule
owner
Design-bid-build
Design-build
CMGC/CMAR
Other (EPC, IPD)
*Progressive
Design-build
*Progressive Design-build: Analysis of benefits associated with progressive design-build were collected through
stakeholder interviews. Its benefits were indicated to include the best attributes from design-build and CMAR. FMI Corporation Copyright 2018 32Progressive design-build is steadily growing in use.
Progressive design-build
Market commentary
• The progressive design-build process was seen favorably by
• “We’ve seen more projects using the collaborative design-
stakeholders due to its qualifications-based selection process.
build model.”
• Selection for progressive design-build is driven by contractor
• “During the design phase on a progressive design-build
qualifications and fee. The limited design component during selection
project you are not designing in a vacuum. You are
was indicated to significantly reduce the cost of pursuit.
designing with the owner at the table.”
‒ Although limiting design during the pursuit phase reduces cost for
• “We’ve seen a couple different ways that the contract
pursuing teams, it also leaves the owner with less certainty around
process is done. One was a qualification based selection,
design. To address this, some owners have employed a hybrid
one was purely negotiated, and others have been a mix.”
approach that incorporates a preliminary design component in the
selection process. • “It is difficult to justify picking a team in a fair competitive
way when you are dealing with public money.”
• Once a team is selected for the project the design component is pushed
forward. The design-build team meets with the owner after they are • “Progressive design-build is the natural next step for
selected and begins the design process. This was indicated to facilitate owners using CM/GC.”
greater involvement from all parties involved on the project. • “We see more and more owners trying to wrap their heads
• Although progressive design-build is growing in use, there is limited around progressive design-build. Water/wastewater
legislation addressing the selection of design-build teams strictly on owners are a little further down the road on this.”
qualifications.
Traditional design-build Design-build selection process
• Compared to progressive design-build, design-build was indicated to be
more cost intense for pursuing teams due to the design component. Best-value 50%
• However, the selection of a design-build team was indicated to be on a
best value or qualifications basis over 80% of the time.
Qualifications based 32%
• Various agencies provide a stipend to teams not selected on a design-
build pursuit. The stipend aims to alleviate the cost burden of pursuit for
teams that are not successful. Low price 17%
Other 2%
FMI Corporation Copyright 2018 33Progressive design-build is particularly interesting
to us. We see this as a continued trend moving
forward.”
-Public Owner
34Design-build utilization continues to expand into project sizes
A significant percentage of project spending aligns well with project size characteristics suited
             for design-build.
           Distribution of nonresidential projects by count and spend
           Projects completed, under construction or planned in past 12 months; not representative of yearly spending
           Source: FMI Analysis of multiple sources

                   80%

                                                                                                                  • Forty-nine percent of project spending is
                                                                                                                    on projects >$250M, where design-build
                   60%
Percent of Spend

                                                                                                                    was identified to have a 60%-80% of
                                                                                             47%                    being employed. However, this only
                                                                                                                    represents 2% of project count.
                   40%
                                                                                                                        “A lot of times projects under $10
                                                                                                                        million don’t have the complexity or
                                                                                19%
                   20%                                                                                                  rigorous time commitment that would
                                                                    13%
                                                       10%                                                              drive them towards design-build.”
                              5%           7%
                                                                                                                  • Other delivery methods (e.g., CMAR) are
                   0%
                                                                                                                    more common due to a consistent use on
                                         $10 to     $25M to total$50M to      $100M to
                           $250M                   projects
Five factors were identified as being important when assessing a design-build project pursuit.
Design-build project pursuit factors
Source(s): FMI analysis of multiple sources
Personnel Personnel
• Continuously stated by design-build market participants was the importance of key individuals
involved on the project pursuit. One of the greatest challenges was said to be the availability of
the right team with the needed capabilities and experience to align most successfully with the
Characteristics of increasing importance when pursuing a
owner's needs.
Experience Experience
• Proven past experience successfully delivering design-build projects and the ability of the team to
bring their collective knowledge to the current project was indicated as a vital component in
selecting a potential partner.
design-build project
Local Local presence
presence
• Depending on the political environment of the agency and community, local presence can play a
significant contributing factor to successful project pursuits. Establishing local offices that are
strategically aligned with community stakeholders and invested in educating the public on the
benefits of the project are important factors in partner selection.
Owner
relationship Owner relationship
• Extensive experience and a strong relationship with a particular owner can provide tremendous
value. Having an understanding of the owner’s knowledge and sophistication of the design-build
process will assist in shaping the project approach.
Past
relationship Past relationship
• Participants prefer to team with partners they have a high level of comfort with and feel there is a
symbiotic relationship that offers complimentary skills. It is increasingly important for owners to
know there has been a successful relationship between team members and not necessarily on
design-build projects.
FMI Corporation Copyright 2018 37Despite limited construction growth, the nonresidential public construction market continues
to increase its utilization of design-build.
Historical public construction spending
Billions of dollars
Source(s): FMI analysis of multiple sources
$120
• Public projects were indicated to be
Other increasing utilization of design-
Commercial build. The education market in
$10
$100 $8 Public safety particular is experience greater
$8 utilization of design-build.
$9 $9
Construction Put in Place; Billions of dollars
$10 $8 Office
$8 “Recently, we’ve been involved on
$8 $8 $9 Healthcare more large public institutional
$11 $9
$80 projects utilizing design-build.”
$11 $10 Amusement
$10
$9 $10 and recreation • In the federal market, utilization of
$8 $9 design-build allows agencies to
capture dollars in the current year
$60
rather than needing to wait a full
budget year to receive funding for a
project.
$40 “On the federal side, we have seen
$69 Education a significant trend in the shift
$68 $67
$62 $63 toward design-build.”
“NAVFAC and the Army Corp are
$20 the two largest DOD builders that
utilize design-build.”
$-
2012 2013 2014 2015 2016
FMI Corporation Copyright 2018 38Highway/Street and
Water/Wastewater
MarketMarket Sizing
Construction spending in highway/street and water/wastewater is anticipated to grow at an
                                                 annual growth of 4% over the forecast period.
                                                 Total U.S. highway/street and water/wastewater construction put in place
                                                 Billions of dollars
                                                 Source(s): FMI

                                                  $140                                                                                                                           15%

                                                                                                                                                              $130
                                                  $130                                $128
                                                                                                   $127                                     $127
                                                                                                                                    $123
                                                                         $121                                               $121
                                                                                                                $120                                                             10%
Construction Put in Place; Billions of dollars

                                                  $120          $117

                                                  $110

                                                                                                                                                                                       Year-over-year growth
                                                                                      5.7%
                                                                                                                                                                                 5%
                                                  $100
                                                                         3.3%                                                               3.0%
                                                                                                                                    2.0%                     2.3%
                                                   $90          1.2%                                                        0.9%
                                                                                                                                                                                 0%
                                                                                                  -1.1%
                                                   $80

                                                   $70
                                                                                                                                                                                 -5%
                                                                                                               -5.6%

                                                   $60

                                                   $50                                                                                                                           -10%
                                                                2013     2014         2015         2016        2017*        2018*   2019*   2020*            2021*

                                                                                                                                                FMI Corporation Copyright 2018         41
Design-build construction spending in the highway/street segment will account for the majority
of spending over the forecast period.
Market size comparison Distribution of market
Total combined spend, Rollup, 2018-2021 US$ CPiP spending, 2018-2021
Source(s): FMI analysis of multiple sources Source(s): FMI analysis of multiple sources
Total U.S. Construction Put in Place (CPiP) Water/Wastewater, 17%
$5.4 Trillion
Segment breakout
U.S. highway/street and water/wastewater Put in Place (CPiP)
$512 Billion
Highway/Street
, 83%
Design-build CPiP New England,
$203 Billion South Atlantic,
3% ESC, 5%
19%
Market breakout
WNC, 8%
Mid-Atlantic,
10%
WSC, 16%
ENC, 11%
Pacific, 16% Mountain,
11%
FMI Corporation Copyright 2018 42Design-build spending in highway/street and water/wastewater is anticipated to grow 21%
from 2018 to 2021.
Design-build highway/street and water/wastewater construction put in place
Billions of dollars
Source(s): FMI analysis of multiple sources
$60 10%
$56
$53 9%
$50 $49
8%
Construction Put in Place; Billions of dollars
$46
7.6%
$43
7.3%
$41 7.0% 7%
$40 6.8%
Year-over-year growth
$38
6.5%
$36
$34 6%
5.7%
5.4%
$30 5%
4.9%
4%
$20
3%
2%
$10
1%
$- 0%
2013 2014 2015 2016 2017* 2018* 2019* 2020* 2021*
FMI Corporation Copyright 2018 43Design-build is anticipated to yield a compound annual growth rate (CAGR) of 6.7% over the
2017 to 2021 period.
Distribution of spending over forecast period
Billions of dollars
Source(s): FMI analysis of multiple sources
$60
+$1.6 $56.0
Outlook for design-build spending (Billions)
$55 +$12
$50
$45 $42.9
$40
$35 2017-2021
CAGR: 6.7%
$30
$25
$0
2017 Highway/street Water/wastewater 2021
FMI Corporation Copyright 2018 44Design-build continues to gain share as a delivery method of choice in the highway/street and
water/wastewater segments.
Design-build as a percentage of total highway/street and water/wastewater construction spending
Billions of dollars
Source(s): FMI analysis of multiple sources
2018-2021
2013-2017 CPiP: $512B
CPiP: $613B
Design-build
31% Design-build
Other 40%
60%
Other
69%
*Other includes CMGC/CMAR, design-bid-build
**Please see appendix for specific segment breakout
FMI Corporation Copyright 2018 45The South Atlantic census division is anticipated to yield the highest growth rate over the 2018-
2021 period.
U.S. highway/street and water/wastewater design-build construction put in place by census division
Billions of dollars
Source(s): FMI analysis of multiple sources
Billions CAGR
of current dollars 2018e 2021f (18-21)
Mountain $5.19 $6.29 6.6%
WEST
Pacific $7.31 $8.98 7.1%
East North
MIDWEST
Central
$4.97 $6.13 7.2%
West North
Central
$3.92 $4.77 6.7%
NORTHEAST
New England $1.34 $1.59 5.9%
Middle Atlantic $4.74 $5.43 4.6%
South Atlantic $8.78 $10.99 7.8%
SOUTH
East South
Central
$2.13 $2.60 6.9%
West South
Central
$7.54 $8.84 5.4%
U.S. Total $45.93 $55.62 6.6%
FMI Corporation Copyright 2018 46Design-build construction spending in the highway/street and water/wastewater is anticipated
to yield favorable annual growth rates over the forecast period.
Distribution of forecast spending by segment Distribution of market
Combined CPiP spending, 2018-2021 CPiP spending, 2018, 2021
Source(s): FMI analysis of multiple sources Source(s): FMI analysis of multiple sources
Water/Wastewater
$9
CAGR: 4.8%
Water/Wastewater
17%
$8
$7
Highway/Street
$46 CAGR: 7.0%
Highway/street $38
83%
$28
1
2014 2
2018 3
2021
Total spend 2018-2021: $203B $35.5B $45.9B $55.6B
FMI Corporation Copyright 2018 47Trends and Drivers
Design-build is no longer an alterative method. It is
a main part of how we delivery our program.”
-Public Owner
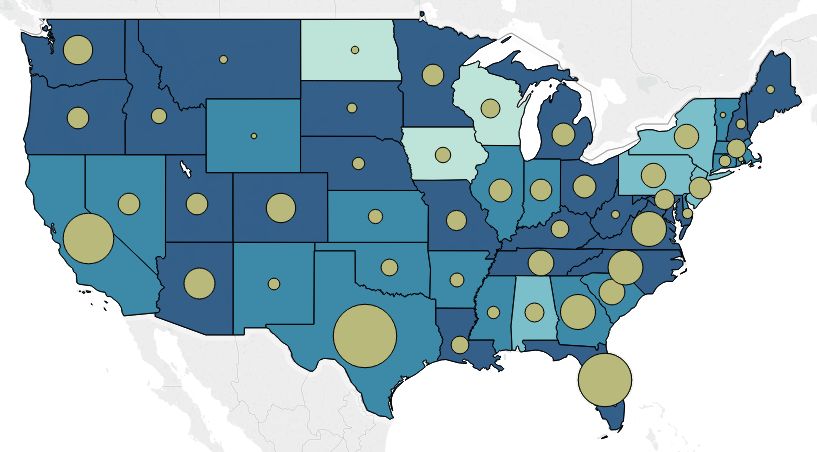
49Forty-three states have full or widely permitted authorization to utilize design-build for public
agency projects.
Design-build authorization and construction spending by state
Combined spending for highway/street and water/wastewater
Source(s): FMI analysis of multiple sources
• Forecast highway/street
and water/wastewater
construction spending
through 2021 is
concentrated in states
permitted to utilize
design-build.
• Three states indicated
limited use of design-
build for construction
project delivery.
Design-build is permitted by all agencies
Design-build is widely permitted
Design-build is a limited option
Design-build is limited to one political
subdivision, agency or project
FMI Corporation Copyright 2018 50Five factors were identified as significant drivers of design-build utilization for highway/street
and water/wastewater projects.
Factors influencing design-build utilization
Source(s): FMI analysis of multiple sources
“Acceleration is one of the more
Project Schedule governing factors for selecting
design-build. We want to get the
work out on the street fast and
create jobs.”
Project Complexity
“Design-build projects are
typically larger and more
complex, which requires risk
Project Size management.”
“New construction for design-
build is more challenging and
requires greater risk. They tend to
Outside Expertise be bigger cost projects.”
Staff Experience
FMI Corporation Copyright 2018 51Owners consistently employing design-build are more likely to select project teams based on
value and innovation.
Design-build experience/learning curve
Source(s): FMI analysis of multiple sources
Consistent use of
design-build
• Alignment on critical
success factors.
• Strong understanding
of what risks can be
transferred and which
can be internally
managed.
• Internal champion of
Process experience
the design-build
process.
First time user of
design-build
• Require guidance and
education on the
benefits and values
associated with the
process.
• Illustrating the
appropriate level of
risk to be transferred
and managed is
important for these
Number of projects owners to understand.
FMI Corporation Copyright 2018 52Despite frequent QBS practices for design-build projects, state highway/street agencies make
the majority of their selection on price.
Distribution of successful pursuits by price and technical score
Highway/street projects: 115 projects
Source(s): FMI analysis of multiple sources
Eighty-seven percent of projects that won had the lowest price
Interviewee comments
“Price is still a main driver on the selection and
you have to be able to sell why you are paying
more for a project. ATCs help the design-build
team lower their cost and helps them win the
project.”
“There are very few things that can be written
differently compared to competitors, that will
Lowest price offset the 85% price component.”
38%
Both “The teams either bring innovations that drive
49% down the price or the team has a shorter
schedule than the others.”
“More often than not it is price that is driving
these. If the price is fairly close the technical
score will win.”
“The team we selected had the lowest price
Highest and best technical score. It’s the best outcome
technical score we can ask for.”
13%
FMI Corporation Copyright 2018 53Thirty-eight states have legislation enabling the use of Public-Private-Partnerships.
Public-Private-Partnership (P3) State Laws
Incudes vertical and horizontal construction segments
Source(s): FMI, DBIA, NCSL, PW Financing
Recent transportation P3 project
PANYNJ -
LGA Terminal:
Colorado
2016
DOT- Central
I-70: 2017
Maryland
DOT- Purple
LAX - APM
Line: 2016
Project: 2018
Virginia DOT-
I-66 Express:
2017
P3s are widely authorized
P3s are authorized in one primary sector
Texas DOT-
P3s are limited or project specific SH288: 2016
P3s are not authorized
FMI Corporation Copyright 2018 54The use of Public Private Partnerships is a unique driver of design-build projects.
Public Private Partnership (P3) project spending and count by year
Includes only transportation DBFOM projects
Source(s): FMI analysis of multiple sources
Total P3 spending
by financial close year
$9,185
$4,523 $4,669 $4,855
$3,629 $4,059
$3,134
$2,313 $2,302
$1,256
2008 2009 2010 2011 2012 2013 2014 2015 2016 2017
2 2 2 2 2
3 3 3 3 3
Total P3 projects
by financial close year
FMI Corporation Copyright 2018 55Total design-build firm revenue increased 33% from 2012 to 2016.
Top-100 design-build firm revenue
Domestic design-build revenue
Source(s): FMI, ENR
2016
2012 $72 billion
$54 billion
14%
15%
49%
51%
34%
37%
Top-10 firm revenue Firms 11-50 revenue Firms 51-100 revenue
Growth 2012-2016 28% 45% 24%
Market share change -1% 3% -2%
FMI Corporation Copyright 2018 56Although the FAST Act provides highway transportation funding through 2020, in comparison
with 1992 dollars, funding levels are not properly adjusted for sufficient growth.
Federal highway spending
Source(s): FMI, FHWA
“Design-build allows for us [DOT] to capture federal dollars sooner. On a
typically job we get federal approval once we have packaged the whole
set of plans and specifications. On design-build we can write an RFP and
write the contract faster and develop a set of concept plans to get federal
$50 approval for funding.”
1992 Constant Dollars
$45
Extension
Extension
$40
Billions of Current Dollars
$35 Extension
$30
$25
$20
$15
ISTEA TEA-21 SAFTEA-LU MAP-21 FAST ACT
$10
$5
$0
1992
1993
1994
1995
1996
1997
1998
1999
2000
2001
2002
2003
2004
2005
2006
2007
2008
2009
2010
2011
2012
2013
2014
2015
2016
2017
2018
2019
2020
FMI Corporation Copyright 2018 57Appendix
Design-build spending in highway/street and water/wastewater is anticipated to grow at an
                                                 annual growth of 6.6% over the forecast period.
                                                 Design-build highway/street Put in Place
                                                 Source(s): FMI analysis of multiple sources

                                                 $50                                                                                                                   10%

                                                 $45                                                                                                                   9%
Construction Put in Place; Billions of dollars

                                                 $40                                                                                                                   8%

                                                                                                                                                                              Year-over-year growth
                                                 $35                                                                                                                   7%

                                                 $30                                                                                                                   6%

                                                 $25                                                                                                                   5%

                                                 $20                                                                                                                   4%

                                                 $15                                                                                                                   3%

                                                 $10                                                                                                                   2%

                                                   $5                                                                                                                  1%

                                                   $-                                                                                                                  0%
                                                             2013            2014              2015   2016   2017*   2018*   2019*   2020*            2021*

                                                                                                                                             FMI Corporation Copyright 2018     59
Highway/street breakout
Highway/Street distribution of delivery method utilization
Billions of dollars
Source(s): FMI analysis of multiple sources
2018-2021
2013-2017 CPiP: $387B
CPiP: $436B
Other
Design-build 57%
35% Design-build
43%
Other
65%
*Other includes CMGC/CMAR, design-bid-build
FMI Corporation Copyright 2018 60Design-build spending in highway/street and water/wastewater is anticipated to grow at an
annual growth of 6.6% over the forecast period.
Design-build water/wastewater Put in Place
Source(s): FMI analysis of multiple sources
$10 6%
$9
Construction Put in Place; Billions of dollars
5%
$8
Year-over-year growth
$7
4%
$6
$5 3%
$4
2%
$3
$2
1%
$1
$- 0%
2013 2014 2015 2016 2017* 2018* 2019* 2020* 2021*
FMI Corporation Copyright 2018 61Water/wastewater breakout
Water/Wastewater distribution of delivery method utilization
Billions of dollars
Source(s): FMI analysis of multiple sources
2018-2021
CPiP: $125B
2013-2017
CPiP: $176B
Design-build
Design-build 28%
21%
Other
72%
Other
79%
*Other includes CMGC/CMAR, design-bid-build
FMI Corporation Copyright 2018 62Definitions and terminology
Construction Put in Place (CPiP): Dollar value of construction spending. CPiP reports the portion of the
construction installed or erected at the site during a given period. The total value-in-place for a given period is the
sum of the value of work done on all projects underway during this period, regardless of when work on each
individual project was started or when payment was made to the contractors.
Construction spending includes the following:
• New buildings and structures.
• Additions, alterations, conversions, expansions, reconstruction, renovations, rehabilitations, and major
replacements (such as the complete replacement of a roof or heating system).
• Mechanical and electrical installations such as plumbing, heating, electrical work, elevators, escalators, central
air-conditioning, and other similar building services.
• Site preparation and outside construction of fixed structures or facilities such as sidewalks, highways and
streets, parking lots, utility connections, outdoor lighting, railroad tracks, airfields, piers, wharves and docks,
telephone lines, radio and television towers, water supply lines, sewers, water and signal towers, electric light
and power distribution and transmission lines, petroleum and gas pipelines, and similar facilities that are built
into or fixed to the land.
• Installation of the following types of equipment: boilers, overhead hoists and cranes and blast furnaces.
• Fixed, largely site-fabricated equipment not housed in a building, primarily for petroleum refineries and
chemical plants, but also including storage tanks, refrigeration systems, etc.
• Cost and installation of construction materials placed inside a building and used to support production
machinery; for example, concrete platforms, overhead steel girders, and pipes to carry paint, etc., from storage
tanks.
Compound Annual Growth Rate (CAGR): Average annual growth rate over multiple time periods.
FMI Corporation Copyright 2018 63United States Census Regions and Divisions
FMI Corporation Copyright 2018 64Segment definitions: Commercial, office, lodging
Segments
1. Commercial
1. Includes buildings and structures used by the retail, wholesale and selected service industries.
2. Automotive retail
1. Includes the following:
2. "Sales – includes auto dealerships, motorcycle dealerships, auto showrooms, and truck dealerships. Service/parts – includes auto service centers, auto parts centers, auto repair centers, tire
service centers, car washes, car rental centers, gas stations and emissions testing centers. Parking – includes commercial parking lots and garages. "
3. Food/beverage
1. Includes the following:
2. "Food – includes supermarkets, bakeries, dairies, markets, convenience stores and delicatessens. Dining/drinking – includes liquor stores, bars, nightclubs, cafés, diners, restaurants, cafeterias,
taverns, inns (eat & drink only), and bistros. Fast food – includes drive-in restaurants and fast food restaurants. "
4. Multi-retail
1. In addition to the types of multi-retail establishments listed below, it also includes warehouse-type retail stores.
2. "General merchandise – includes department stores and variety stores. Shopping center – includes shopping centers, shopping plazas and town centers. Shopping mall – includes shopping malls.
"
5. Other commercial
1. In addition to the types of stores listed below, it also includes beauty salons, nail shops, crematories, funeral homes, animal shelters, kennels, veterinary clinics, florists, nurseries, pawnshops,
photo shops, dance schools, dry cleaners, laundromats, and post offices.
2. "Drug store – includes drug stores and pharmacies. Building supply store – includes hardware stores and lumberyards. Other stores – includes clothing stores, jewelry stores, salesrooms (non-
auto), furniture stores, office supply stores, storerooms, and electronics stores. "
3. Warehouse
6. Warehouses and storage buildings, cold storage plants, grain elevators, and silos located at manufacturing sites are included in the manufacturing category.
1. In addition to the types of warehouses listed below, it also includes grain elevators and greenhouses.
2. "General commercial – includes commercial warehouses, storage warehouses and distribution buildings. Mini-storage – includes mini-storage centers and self-storage centers. "
2. Office
1. In addition to the types of offices listed below, it also includes motion picture, television, and radio offices.
2. Office buildings at manufacturing sites are classified as "manufacturing"; however, an office building owned by a manufacturing company and not located at a
manufacturing site is classified as "office."
3. Includes administration buildings, computer centers, office buildings and professional buildings.
4. State and local and federal also includes city halls, borough halls, municipal buildings, courthouses, and state capitol buildings.
5. Includes banks, financial institutions, building & loans, saving & loans and credit unions.
3. Lodging
1. Includes hotels, motels, resort lodging, tourist courts and cabins and similar facilities.
FMI Corporation Copyright 2018 65Segment definitions: Healthcare, educational
Segments
1. Healthcare
1. Hospital
1. Includes hospitals, mental hospitals, infirmaries and infrastructure.
2. Medical building
1. Includes clinics, medical offices, medical labs, doctor & dentist offices, outpatient clinics, and research labs (non-manufacturing, non-educational, or non-hospital).
3. Special care
1. Includes nursing homes, hospices, orphan homes, sanatoriums, drug clinics, rehabilitation centers, rest homes and adult day-care centers.
2. Educational
1. In addition to the types of educational facilities listed below, it also includes nursing schools, cosmetology and beauty schools, trade schools, military training
facilities, schools for the handicapped, and modeling schools.
2. Schools on Indian reservations are included in federal construction.
3. Preschool
1. Includes childcare and day-care centers, nurseries and preschools.
4. Primary/secondary
1. In addition to the types of primary and secondary schools listed below, it also includes academies, parochial schools and vocational schools.
2. "Elementary – includes elementary schools. Middle/junior high – includes middle and junior high schools. High – includes high schools. "
5. Higher Education
1. In addition to the types of higher education facilities listed below, it also includes health centers and clinics located at colleges (including junior and community colleges) and universities.
2. Instructional – includes instructional buildings and laboratories.
3. Parking – includes parking lots and garages.
4. Administration – includes administration buildings.
5. Dormitory – includes dormitories, living/learning centers and residence halls.
6. Library – includes libraries (school).
7. Student union/cafeteria – includes student union buildings and cafeterias.
8. Sports/recreation – includes gymnasiums and athletic field houses, arenas, coliseums and stadiums, outdoor courts or fields, racquetball courts, rinks, tennis courts, and swimming pools.
9. Infrastructure – includes power plants, water supply facilities, sewage and other infrastructure.
6. Other educational
1. In addition to the types of facilities listed below, it also includes zoos, arboreta, botanical gardens, planetariums and observatories.
2. Gallery/museum – includes art galleries, cultural centers and museums.
3. Library/archive – includes libraries (nonschool) and archives.
FMI Corporation Copyright 2018 66You can also read