Growing agricultural investment opportunities in Chile

Page created by Steven Espinoza
 
CONTINUE READING
Growing agricultural investment opportunities in Chile
Growing agricultural
investment opportunities
in Chile
Executive Summary

    Chile is a leading producer and                 meet the needs of a population that
exporter of a wide range of high-value              erupted into protests in fall 2019,
crops, with its Southern Hemisphere                 with drafting of a new constitution
location enabling harvest when few regions          underway as of spring 2021.
of the world provide fresh supplies. Chile’s   •    Natural resources—Chile’s land,
key features supporting its competitive             water, range of latitudes, and
advantage in agriculture include:                   geographic isolation from pests and
•   Deep competitive agricultural                   diseases help increase crop prices
    industry position—Chile has key                 and keep input costs lower.
    competitive advantages in crop             •    Macroeconomic climate and
    production and export, including                currency—Chile has among the
    its Southern Hemisphere location,               strongest credit ratings and most
    infrastructure, human capital and               stable currencies in Latin America.
    production scale.                          In this review, we outline Chile’s macro
•   Global market access—Chile has             environment and explore the country’s
    free trade agreements with over            competitive positions in key crop markets
    90% of the world’s economy, and            where we believe Chile’s role in supplying
    exports are a strategic priority for the   global consumers will likely continue
    government. Chile’s overall economy        to grow, including cherries, apples,
    is export-oriented, providing strong       avocados, citrus and tree nuts. Chile’s
    benefits to the agricultural sector.       competitive advantages in agricultural
    Chile plays a leading global role          production include natural resources,
    exporting products to China, the U.S.,     logistics, infrastructure and government
    EU, and Latin America.                     policy.
•   Favorable legal and political                   Trade and logistics infrastructure,
    institutions—Chile’s democracy             supported by Chile’s wide range of export
    is ranked favorably by international       sectors, facilitates the cost-effective,
    institutions and has adapted to            reliable, and timely movement of goods
Growing agricultural investment opportunities in Chile
from producing regions to key ports and onward to global                            Extensive copper reserves and the mining sector are a key
customers, with major producing regions within 150 miles of the             component of Chile’s economy, accounting for 20% of GDP and
coast. Transportation advantages over other Southern Hemisphere             50% of exports by value.8 Leading imports include petroleum and
producers into North America and South America combine with                 vehicles, and in recent years, Chile has run a trade balance near
significant tariff advantages from free trade agreements in these           parity. With free trade agreements with countries representing
markets, as well as major markets in Asia and Europe. Growing               nearly 90% of global GDP, Chile has excellent commercial
bargaining power of Chilean exporters engaged in supply contracts           access around the world. Despite recent volatility due to social
with foreign buyers reflects product quality and reliability.               and political change and COVID-19, the Chilean Peso remains
Development of supporting industries, including machinery and               one of the most stable currencies in Latin America, with lower
crop chemicals, has encouraged price-competitive inputs and                 depreciation and volatility. Chile’s currency is reflective of a
product innovation.                                                         commodity-producing, export-oriented country, but relative to other
     Chile’s agricultural subsidies are limited, just 2.7% of farm          developing countries, it shows more moderate changes in value.
cash receipts in 2019 compared to the OECD average of 17.8%.            1
                                                                                    With its small population, domestic demand is limited, and
Chile’s policies generally create minimal market distortion and are         Chile’s agricultural sector is export-oriented. Over two-thirds of
mainly aimed at improving the productivity and competitiveness              Chilean fruit production is exported, and agricultural products
of small-scale farmers, with more than 50% of budgetary                     are the second largest export category after copper. The Chilean
allocations to the ag sector spent on general services, mainly              government has focused on liberalizing trade as an economic
directed towards infrastructure, R&D and inspection services.       2
                                                                            growth driver. Chile has free trade agreements with 65 countries
This leads larger farmers to compete based on market conditions             representing 90% of the world’s GDP and its average tariff into
and incentivizes innovation to adapt with new technologies and              these countries is 1.8%.9 Free trade agreements cover all the major
varieties to maintain competitiveness. While direct subsidies are           fruit and tree nut destination markets except for Russia. These
low, developing commercial agriculture is a strategic priority for          agreements enable Chile to compete in distant markets where
the government given the sector’s important contribution to GDP             it lacks transportation advantages. With most crop production
and rural employment. Chile features a well-educated agricultural           exported, most revenues for Chilean agricultural production are
workforce and a more developed university system compared to                generated in USD.
most of Latin America. The government also supports the creation            CHART 1: USD PER CURRENCY OF MAJOR EMERGING MARKET
of public-private partnerships to vertically integrate farmers to           AGRICULTURE EXPORTERS (INDEX 2006=1)
                                                                             1.50
markets. A strong emphasis is placed on water access and use,                                                                                                 Brazil
                                                                                                                                                              Argentina
specifically irrigation. Over 20% of the public budget allocated to                                                                                           Russia
                                                                                                                                                              Chile
the agricultural sector is invested in irrigation infrastructure.            1.00

Macroeconomic Overview
                                                                            0.50
     Chile has a small population (19 million),3 ranked 65th globally,
yet with a large land area (743,000 km,2 slightly larger than Texas)
                                                                            0.00
relative to its population. Chile’s annual GDP of USD$245 billion in
                                                                                                           11
                                                                                                      10

                                                                                                                12

                                                                                                                      13

                                                                                                                            14

                                                                                                                                  15

                                                                                                                                        16

                                                                                                                                                    18

                                                                                                                                                          19
                                                                               06

                                                                                           08

                                                                                                09

                                                                                                                                                                20
                                                                                                                                              17
                                                                                      07

                                                                                                           20
                                                                                                     20

                                                                                                                20

                                                                                                                     20

                                                                                                                           20

                                                                                                                                 20

                                                                                                                                       20

                                                                                                                                             20

                                                                                                                                                   20

                                                                                                                                                         20
                                                                             20

                                                                                    20

                                                                                         20

                                                                                              20

                                                                                                                                                              20

2020 was comparable to New Zealand.4 Over the past 25 years,
                                                                            Source: Macrobond, March 31, 2021
the country’s GDP and GDP per capita have grown faster than
                                                                            Investment Risks
neighboring countries, and it is regarded as one of the easiest
places to ‘do business’ according to the Heritage Foundation.5                      Investment in Chilean agriculture faces multiple risks related
Chile was designated a ‘high income’ country by the United                  to Chile’s business environment, and specific to the agricultural
Nations in 2013, and 2019 GDP per capita was USD$14,896.            6
                                                                            sector. Country risks include economic growth and currency,
Since 2008, Chilean GDP (in current USD) has grown at an                    the pending new constitution, social reforms, and regulatory
annualized 4.4%, slightly lower than Uruguay (6.3%) and compares            and tax. Within the agricultural sector, Chilean producers face
favorably to Brazil (1.9%). Chile’s GDP per capita has been growing         risks common to producers globally, including crop yield, prices,
at a similar pace, of 3.6% over the period.  7
                                                                            water, and labor availability and cost. Major risks to investing in

                                                                                                                Growing agricultural investment opportunities in Chile | 2
Growing agricultural investment opportunities in Chile
permanent cropland in Chile include enactment of laws that could                          TABLE 1: CHILE FARMLAND MARKET

modify the availability and cost of labor, and future macroeconomic                                                                               Farmland      20y-CAGR        Key Crops

trends centered around the price of copper. If global demand for                                                       North (III, IV)            40k HA        3.2%            Table grapes,
                                                                                                                                                                                citrus, olives,
copper declines, prices could deteriorate, leading to pressure on the                                                                                                           avocados

                                                                                                                       Central (V – VII)          264k HA       2.6%            Tree nuts, table
Chilean economy.                                                                                                                                                                grapes, cherries,
                                                                                                                                                                                stone fruit, apples

Current Political, Social and Economic Environment                                                                     South (VIII – XVI)         41k HA        9.1%            Blueberries, tree
                                                                                                                                                                                nuts, apples,
                                                                                                                                                                                cherries
      Chile has a favorable legal and political climate for investment,
ranking 25 out of 179 countries on the Transparency International
Corruption Perceptions 2020 Index10 and 19 out of 178 countries                           Source: ODEPA, March 31, 2021

on the Economic Freedom Index from the Heritage Foundation.11
                                                                                          CHART 3: COPPER PRICE S&P INDEX AND QUARTERLY CHILE COPPER
Chile ranks fifth among the principal agricultural production
                                                                                          EXPORTS (BILLIONS USD)
countries in the World Economic Forum’s Global Competitiveness
                                                                                                             800                                                                                  15
Report, behind the U.S., Canada, Australia and China, and 33rd                                                         World Copper Price
                                                                                                                       Chile Copper Exports
globally.12
      In late 2019, Chile experienced extensive social unrest with                                           600

                                                                                        Copper Price Index
                                                                                                                                                                                                  10
demands for increased public services, larger pensions, and

                                                                                                                                                                                                       Copper Exports
lower-cost education.13 Chile has among the highest income
                                                                                                             400
and education inequality in the OECD,14 and a public referendum
in October 2020 was overwhelmingly passed, with 80% of                                                                                                                                            5

voters choosing to write a new constitution to replace the 1980                                              200

Constitution written under Augusto Pinochet. A constitutional
convention comprised of citizens is scheduled to be elected in
                                                                                                              0                                                                               0
                                                                                                              2000   2003      2006         2009        2012       2015       2018         2021
2021, and the completed constitution will face a referendum
                                                                                          Source: Macrobond, November 18, 2020
scheduled for 2022. The Constitutional Assembly is expected
to create fundamental reforms in areas like public services while                         from the virus. China was the only major global economy to
helping retain elements that have enabled Chile to maintain the                           register positive economic growth in 2020. The rebound in China
highest credit rating of any country in Latin America.             15
                                                                                          and other global economies led to rising global copper prices and
                                                                                          increased copper exports from Chile during the second half of
CHART 2: CHILE REAL GDP, % CHANGE ANNUALIZED
15                                                                                        2020. At the end of Q1 2021, the price of copper was 78% higher

10
                                                                                          than at the end of Q1 2020, and Chilean copper exports were 46%
                                                                                          higher in Q1 2021 than in Q1 2020.
 5

 0

-5

-10

-15
   1998   2000   2002   2004    2006   2008   2010   2012   2014   2016   2018   2020
Source: Macrobond, March 31, 2021

Chile in the COVID-19 Crisis

      Chile enacted swift and strict controls to mitigate the spread
of COVID-19, which led to a sharp contraction in the economy in
Q2 and Q3 2020, before stabilizing in Q4 and likely beginning
to grow in Q1 2021. In early 2021, an extensive vaccine program
should also support the pace of the economic recovery. Another
major driver for Chile’s economic rebound was China’s recovery

                                                                                                                                           Growing agricultural investment opportunities in Chile | 3
Growing agricultural investment opportunities in Chile
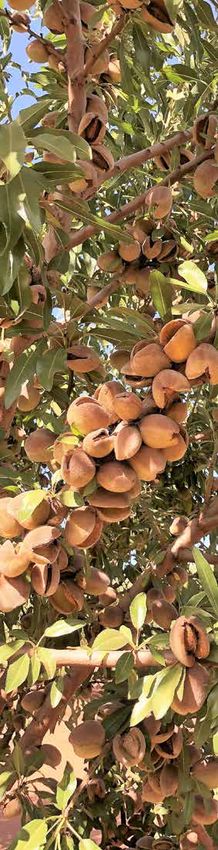
Chile Agriculture Overview

    Chile’s geography and climate offer distinct advantages for          CHART 4: 2018 CHILE CULTIVATED LAND USE (000 HECTARES)

agricultural production, as it is one of the world’s few regions         800
                                                                                       696
with a Mediterranean climate ideal for high-value fruit and tree
                                                                         600
nut production. Chile’s length enables long production windows
                                                                         400                                322
counter-seasonal to the Northern Hemisphere, allowing producers
to receive crop price premiums in the early and late seasons when        200                                                      144
                                                                                                                                                         77
supply is low and prices are high. Bordered by the Pacific Ocean,
                                                                           0
Andes Mountains, Atacama Desert and Antarctica, the location                    Annual Row Crops    Permanant Fruits and
                                                                                                         Tree Nuts
                                                                                                                              Wine Grapes            Vegetables

makes it difficult for pests to enter the country. While water is        Source: ODEPA, March 28, 2021

scarcer in some of the northern climates, it is more abundant            led by sweet corn, lettuce and tomatoes, totaled 69,845 hectares.
in the southern portions of the country, fed by runoff from the          Compared to Chile's 388,350 hectares of fruits, tree nuts and
Andes and significant levels of rain. Chile is the largest Southern      vegetables, California has 1.7 million irrigated hectares of these
Hemisphere exporter of fruit and walnuts and competes with
                                           16
                                                                         crops.19 Over the past ten years, the fastest growing crops
Argentina, Australia, New Zealand, Peru and South Africa in fruit        were hazelnuts, walnuts, cherries, blueberries, mandarins and
and tree nut export markets. Of the country’s 76 million hectares,       avocados, while other crops remained flat to gradually declining
2.1 million are cultivated, with 1.3 million hectares used for annual    (apples, table grapes). Table grapes were one of Chile’s first
and permanent crops, and the balance for forage or fallow.    17
                                                                         major permanent crops oriented to export markets; however, the
    Fruit and tree nut area totaled 321,590 hectares in 2018,       18
                                                                         market has matured, and Chile now faces increased competition
up from 249,544 hectares in 2008, a 3.5% CAGR. Five crops                from Peru. Permanent cropland represents about 20% of total
comprise 55% of fruit and tree nut area: grapes (15%), walnuts           agricultural land and has an estimated market value of about
(12%), apples (11%), cherries (9%), and avocados (9%). Vegetables,       USD$13 billion across 350,000 hectares.20

                                                                                                            Growing agricultural investment opportunities in Chile | 4
Growing agricultural investment opportunities in Chile
CHART 5: PRODUCTIVE AREA OF SELECTED PERMANENT CROPS IN                                              CHART 7: 2018 CHILEAN AGRICULTURAL EXPORTS ($1,000 USD FOB)
CHILE (000 HECTARES)
                                                                                                                                                    17%                     Wine
400                                                                                                               26%                                                       Table Grapes
                                                                                  Other                                                                                     Processed Fruits & Vegetables
                                                                                  Almonds                                                                                   Fresh Cherries
300                                                                                                                                                          10%
                                                                                  Plums                                                                                     Fresh Apples
                                                                                  Blueberries                                                                               Fresh Blueberries
200                                                                               Olives                  3%                                                                Pork
                                                                                  Hazelnuts                                                                                 Walnuts
                                                                                                              3%
                                                                                                                                                            10%             Seeds
                                                                                  Apples                          3%
100
                                                                                  Avocados                                                                                  Poultry
                                                                                                                       4%
                                                                                  Cherries                                                                                  Fresh Avocados
                                                                                                                            4%                     9%
  0                                                                               Walnuts                                          5%                                       Other
                                                                                                                                            6%
                                                                                  Table Grapes
                   11
             10

                         12

                                13

                                         14

                                                15

                                                       16

                                                                     18

                                                                          19
      09

                                                              17
                  20
             20

                        20

                               20

                                     20

                                              20

                                                     20

                                                             20

                                                                    20

                                                                          20
                                                                                                     Source: ODEPA, Panorama de la Agricultura Chilena 2019, as of March 31, 2021
     20

Source: ODEPA, January 26, 2021
                                                                                                                   In 2018, Chilean agricultural exports totaled USD$18 billion
       Agriculture comprises 3% of Chilean GDP, and 24% of                                           (24% of Chile’s total exports)25. Fresh fruit and tree nut exports
exports, making it the country’s second largest source of exports                                    are the largest category, followed by wine, and processed fruits.
after copper. Including food and beverage processing, agriculture
                  21
                                                                                                     By comparison, 2017 agriculture exports from California were
accounts for 8% of the economy. Chile is the largest Southern                                        USD$23 billion.26 Chile’s agricultural export value grew at a 7.4%
Hemisphere fruit exporter, and fruits comprise 38% of farm                                           CAGR from 2000 to 2018, with exports to China driving the
production, followed by livestock at 21%.                     22
                                                                   Production agriculture,           growth. After growing at a 19.4% CAGR from 2000 to 2018,
excluding other portions of the value chain, employed 774,000                                        China surpassed the U.S. and became the top export destination
in 2019, 9% of Chilean employment.                     23
                                                            Including agribusiness, the              for Chile’s agricultural products.
employment total is closer to 20%, and agribusiness accounts                                                       Chile is the world’s largest exporter of table grapes and
for 57% of Chile’s manufacturing output.                      24
                                                                                                     cherries, and is a top 5 exporter of apples, walnuts and almonds.
                                                                                                                   From 2000 to 2017, Chilean fruit and tree nut export volumes
CHART 6: TOP CHILE AGRICULTURAL EXPORT DESTINATIONS
(USD BILLIONS)                                                                                       grew at a 2.0% CAGR. Most of the growth occurred from 2000 to
$5                                                                                                   2009, with relatively stable levels thereafter.
                  China
                  U.S.
                  Japan                                                                              CHART 8: CHILE FRUIT, VEGETABLE AND TREE NUT EXPORTS
                  Mexico
$4                South Korea                                                                        (MILLION MT) AND % EXPORTED
                  EU
                  Brazil                                                                                      4                                                                                       80%
                  Peru

$3                                                                                                            3                                                                                      60%

                                                                                                                                                                                                           % Exported
                                                                                                    Exports

                                                                                                              2                                                                                      40%
$2

                                                                                                              1                                                                                      20%

$1
                                                                                                              0                                                                                      0%
                                                                                                                  00

                                                                                                                      01
                                                                                                                      02

                                                                                                                      03

                                                                                                                      04

                                                                                                                      05

                                                                                                                      06

                                                                                                                      08

                                                                                                                      09

                                                                                                                      10

                                                                                                                       11
                                                                                                                      12

                                                                                                                      13

                                                                                                                      14

                                                                                                                      15

                                                                                                                      16
                                                                                                                      07

                                                                                                                      17
                                                                                                                    20
                                                                                                                   20

                                                                                                                   20

                                                                                                                   20

                                                                                                                   20

                                                                                                                   20

                                                                                                                   20

                                                                                                                   20

                                                                                                                   20
                                                                                                          20

                                                                                                                   20

                                                                                                                   20

                                                                                                                   20

                                                                                                                   20

                                                                                                                   20

                                                                                                                   20
                                                                                                                   20

                                                                                                                   20

                                                                                                                            Fruit, Vegetable and        Fruit, Vegetable and                 % Exported
$0                                                                                                                          Tree Nut Production         Tree Nut Exports
      2000    2002      2004      2006        2008     2010        2012   2014   2016       2018
Source: ODEPA, March 24, 2021                                                                        Source: USDA PSD, March 26, 2021

TABLE 2: CHILE’S GLOBAL RANKING IN MAJOR PERMANENT CROPS

                     Production 2019                 Production Average 2014-2019 (MT)             Exports 2019                         Export Average 2014-2019 (MT)               Average Exported
       Apples                            8                                         1,314,167                                 4                                    752,133                             57%
       Grapes                            8                                           981,531                                  1                                   748,817                             76%
     Cherries                            8                                              117,315                               1                                    97,417                             83%
      Walnuts                            5                                              81,856                               2                                     79,167                             97%
     Almonds                             6                                                 7,233                             5                                      6,183                             85%
Source: USDA PSD Online, March 26, 2021

                                                                                                                                                   Growing agricultural investment opportunities in Chile | 5
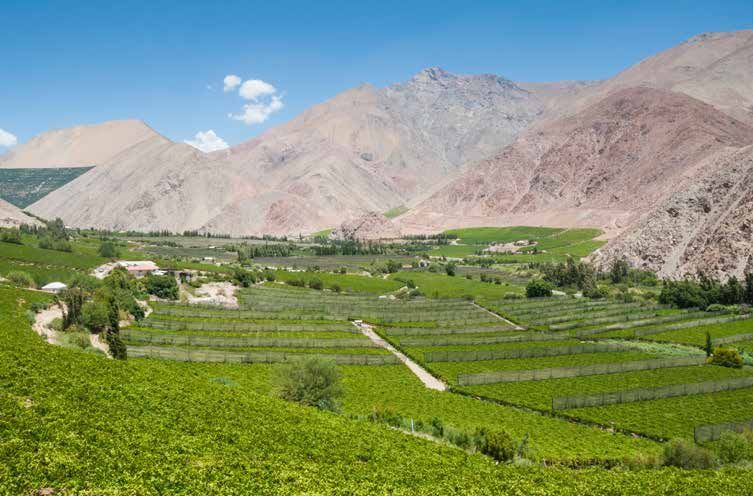
Growing agricultural investment opportunities in Chile
Key Chilean Crops
    In Chile’s diverse permanent crop sector, several key crops        time, the grape industry has matured and is confronting slowing
have the scale, competitive position and growth opportunity            global demand growth. Chile also faces increased competition in
that make them especially suitable for long-term institutional         export markets, especially from Peru. These pressures have led to
investors. The largest permanent crop in Chile, the grape sector,      squeezed margins and encouraged shifting to other crops that offer
both for wine grapes and table grapes, is in a period of transition.   higher profits and greater growth potential. The redevelopment
Collectively, wine grapes and table grapes account for 42% of          of vineyard land and water resources to crops with more rapidly
Chile’s permanent crop area. One of Chile’s first major export         growing demand and where Chile sustains greater competitive
fruits, grapes were aggressively developed in the 1980s and            advantages is a major growth opportunity, as many of Chile’s
1990s. Grapes remain a staple crop in Chile; however, at this          grapes are grown in some of the most favourable climates in Chile.

                                                                                                 Growing agricultural investment opportunities in Chile | 6
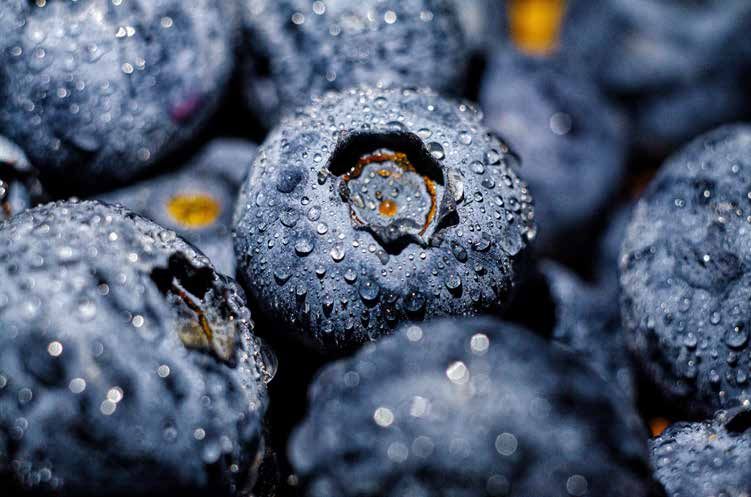
Growing agricultural investment opportunities in Chile
Cherries

         Global cherry production grew from 1.9 million MT in 2001 to   CHART 10: GLOBAL FRESH CHERRY IMPORTS (000 MT)

3.9 million MT in 2019, a 4.1% CAGR. The top producing regions          500
                                                                                    China
are the EU, the U.S., Turkey and China.                                             Russia
                                                                        400
                                                                                    EU
CHART 9: GLOBAL CHERRY PRODUCTION (MILLION MT)
                                                                                    Rest of World
                                                                        300
5
          Turkey        EU
4         U.S.          China                                           200
          Ukraine       Russia
          Chile         Rest of World
3
                                                                        100

2
                                                                          0
1
                                                                                   02

                                                                                           03

                                                                                           04

                                                                                           05

                                                                                           06

                                                                                           08

                                                                                           09
                                                                              01

                                                                                           10

                                                                                           12

                                                                                           13

                                                                                           14

                                                                                           15

                                                                                           16

                                                                                           18

                                                                                           19
                                                                                            11
                                                                                           07

                                                                                           17
                                                                                         20
                                                                          20

                                                                                        20

                                                                                        20

                                                                                        20

                                                                                        20

                                                                                        20

                                                                                        20

                                                                                        20

                                                                                        20

                                                                                        20
                                                                               20

                                                                                    20

                                                                                        20

                                                                                        20

                                                                                        20

                                                                                        20

                                                                                        20

                                                                                        20

0                                                                       Source: USDA PSD Online, March 23, 2021

                                                                              Chile is the largest cherry exporter and its primary
         02

                03

                 04

                 05

                 06

                 08

                 09

                 10

                 12

                 13

                 14

                 15

                 16

                 18

                 19
    01

                  11
                 07

                 17
               20
              20

              20

              20

              20

              20

              20

              20

              20

              20
20
     20

           20

              20

              20

              20

              20

              20

              20

Source: USDA PSD Online, March 23, 2021                                 competitors in the global fresh cherry market are the U.S. and
         Global cherry trade has grown at a 9.8% CAGR from 2001 to      Turkey. Chile’s production, however, has minimal overlap with that
2019, faster than production or consumption. In the last five years,    from Turkey and the U.S., and cherries are a perishable crop,
China has become the dominant fresh cherry importer, with a 50%         with a two-month shelf life, with the result that Chile has a 90%
share in 2019, although this growth rate may be tempered in the         share of Southern Hemisphere cherry exports. In the last decade,
future as China expands its own cherry growing.                         Chile’s share of the export market has more than doubled. Unlike

                                                                                                            Growing agricultural investment opportunities in Chile | 7
Growing agricultural investment opportunities in Chile
with many other fresh fruits grown in Chile, Peru is not a significant                 CHART 12: CHILE CHERRY AREA (000 HECTARES)

cherry producer or exporter and does not compete with Chile.                            50

CHART 11: GLOBAL FRESH CHERRY EXPORTS (000 MT)                                                            South        Central
                                                                                        40
600

500           Chile     U.S.       Turkey     Rest of World                             30

400
                                                                                        20

300
                                                                                          10
200

                                                                                            0
100                                                                                                       2000                2006             2012              2016               2019

  0                                                                                    Source: ODEPA, November 18, 2020
    02

     03

     04

     05

     06

     08

     09
     01

     10

     12

     13

     14

     15

     16

     18

     19
      11
     07

     17
   20
  20

  20

  20

  20

  20

  20

  20

  20

  20

  20
  20

  20

  20

  20

  20

  20

  20

  20

                                                                                       highest prices for Chilean cherries, which has made China
Source: USDA PSD Online, March 23, 2021
                                                                                       the dominant export destination. If markets shift, many other
Chile Cherry Market
                                                                                       markets would be willing cherry buyers, albeit at potentially
      Total cherry tree area has grown rapidly, expanding at a                         slightly lower prices.
12.4% CAGR 2000-2019. The most rapid future expansion is                                             The expansion in cherry production in recent years has been
likely to take place in the Southern region, where lower land prices,                  driven primarily by the additional planted hectares, rather than
abundant water resources and late season varietal production                           rising yields.
encourage development. Late season cherries are ideal for                              CHART 13: CHILE CHERRY AREA (000 HECTARES)
shipment for Chinese New Year, a major cherry consumption                              35

occasion, when Chile has virtually no competitors in the global                        30

cherry export market.                                                                  25

      Increased profitability of cherry production has attracted                       20

new companies; however, top players continue to lead the                                 15

                                                                                         10
TABLE 3: CHILE CHERRY CROPLAND BY REGION
                                                                                            5
                 Farmland (Ha)              20y-CAGR          Commentary
                                                                                            0
  Central        33,811                     11.5%             • Largest production
                                                                                                       13

                                                                                                       14

                                                                                                       15

                                                                                                       16

                                                                                                       18
                                                                                                       01

                                                                                                       10

                                                                                                       12
                                                                                                        11
                                                                                                      07

                                                                                                       17
                                                                                                     00

                                                                                                      02

                                                                                                      03

                                                                                                      04

                                                                                                      05

                                                                                                      06

                                                                                                      08

                                                                                                      09

                                                                                                    20

                                                                                                    20

                                                                                                    20

                                                                                                    20

                                                                                                    20

                                                                                                    20
                                                                                                    20

                                                                                                    20

                                                                                                    20

                                                                                                    20
                                                                                                   20
                                                                                           20

                                                                                                   20

                                                                                                   20

                                                                                                   20

                                                                                                   20

                                                                                                   20

                                                                                                   20

                                                                                                   20

  (V—VII)                                                       region is Maule
                                                                where most             Source: ODEPA, as of March 23, 2021
                                                                competitive
                                                                producers are based    CHART 14: CHILE CHERRY PRODUCTION (000 MT) AND YIELD (MT/HECTARE)

                                                              • Relatively tapered                 250                                                                                     10
                                                                growth expected
                                                                                                                       Production            Yield
                                                                in O’Higgins due
                                                                                                   200                                                                                     8
                                                                to competition for
                                                                acreage and water
                                                                constraints                        150                                                                                     6
                                                                                      Production

                                                                                                                                                                                                Yield

  South          4,299                      9.4%              • Rapidly growing
  (VIII—                                                        market with pro-                   100                                                                                     4
  XVI)                                                          ducers looking for
                                                                expansion                           50                                                                                     2
                                                                opportunities
                                                              • Areas support                        0                                                                                     0
                                                                late variety
                                                                                                         02

                                                                                                                  03

                                                                                                                       04

                                                                                                                            05

                                                                                                                                 06

                                                                                                                                      08

                                                                                                                                      09
                                                                                                         01

                                                                                                                                      10

                                                                                                                                      12

                                                                                                                                      13

                                                                                                                                      14

                                                                                                                                      15

                                                                                                                                      16
                                                                                                                                       11
                                                                                                                                      07

                                                                                                                                      17
                                                                                                                                    20
                                                                                                     20

                                                                                                                                   20

                                                                                                                                   20

                                                                                                                                   20

                                                                                                                                   20

                                                                                                                                   20

                                                                                                                                   20

                                                                                                                                   20
                                                                                                          20

                                                                                                               20

                                                                                                                    20

                                                                                                                         20

                                                                                                                              20

                                                                                                                                   20

                                                                                                                                   20

                                                                                                                                   20

                                                                production with
                                                                price premiums         Source: ODEPA, USDA PSD, as of March 23, 2021

Source: ODEPA, November 18, 2020                                                                     Chile maintains a dominant position in global cherry exports,
market. To manage risks in the cherry sector, competitive                              with a 47% share in the 2019 marketing year. Turkey and the
Chilean producers are investing in protective roofing and other                        U.S. trail, showing lower shares and slower growth the last 10
infrastructure on cherry properties. China consistently offers the                     years. Chile’s cherry exports are highly concentrated to China and

                                                                                                                                      Growing agricultural investment opportunities in Chile | 8
Growing agricultural investment opportunities in Chile
TABLE 4: CHILE CHERRY MARKET RISKS                                       CHART 15: CHILE SWEET CHERRY EXPORTS (000 MT)
                                                                         300
 Description           Potential Mitigation Strategy
                                                                                   China              U.S.

                                                                                   South Korea        Brazil
                                                                         250
 Exposure to           •    Diversify into other profitable markets
                                                                                   Taiwan             Rest of World
 Chinese market             including South Korea and India
                       •    Collaborate with industry                    200
                            associations and producers to
                            encourage low trade barriers                 150

                                                                         100
 Weather shocks        •    Invest in roofing and other farm
 in Chile’s southern        infrastructure to protect crop from
 growing region             frost and rain                                50

                       •    Identify and grow varieties more
                            resistant to weather shocks
                                                                           0
                                                                                 2012       2013    2014         2015     2016       2017      2018      2019      2020

                                                                         Source: ITC Trade Map, March 28, 2021
 Major ramp-up of      •    Focus on producing high-quality,
 Chilean production         highly in-demand varieties to ensure         harvest occurs six months before the Chilean harvest. Production
 in coming years            premium prices
                                                                         in China may increase, but the window will be the same, leaving a
                       •    Build brand in key markets and develop
                            long-term relationships with retail buyers   gap for Chile to supply.
                                                                               Chilean producers’ key competitive advantages include
Hong Kong, together accounting for 91% of Chilean 2020 cherry            relatively low labor costs and higher crop prices as a Southern
exports. Chile’s growth in total fresh cherry exports results
        27
                                                                         Hemisphere country. Producers with developed brands benefit
almost exclusively from higher exports to greater China, as growth       from sustained pricing power among retailers, with grocers paying
into other markets has been more modest.                                 higher, more stable prices and sometimes providing grower
    Cherries are among the most profitable crops in Chile, with          financing for branded cherries. Key growth areas include high-end
gross profit margins on the farm estimated at about 50%-60%,             brands with retailers (particularly in China) and increasing early
with higher margins for early and late season varietal production.       and late season varieties when supplies are more limited, resulting
The perishability of the crop has market implications, as fresh          in price premiums. Cherry producers are also growing market
cherries cannot be stored more than two months and the Chinese           share outside China, including India, Vietnam and Thailand.

                                                                                                                 Growing agricultural investment opportunities in Chile | 9
Growing agricultural investment opportunities in Chile
Apples

      Global fresh apple production increased from 48 million MT in            Global apple exports have grown from 3.1 million MT in 2001
2001 to 79 million MT in 2019 (CAGR 2.8%). China is the largest       to 5.9 million MT in 2019 (CAGR 3.6%). The EU and China are the
driver behind expanded global apple production. China’s fresh         two largest exporters of fresh apples. Chile is the world’s fourth
apple production more than doubled from 20 million MT in 2001         largest fresh apple exporter (and the largest in the Southern
to 42 million MT in 2019 (CAGR 4.2%). In 2019, China accounted        Hemisphere), behind the EU, China and the U.S. In 2019, Chile
for 53% of global apple production. The EU, the U.S., Turkey          exported 650,000 MT of fresh apples, 59% of its apple production
and Iran are other major producers of fresh apples. Chile’s apple     and 11% of global exports.
production has remained largely stable in recent years, and in
                                                                      CHART 17: GLOBAL FRESH APPLE EXPORTS (MILLION MT)
2019, Chile produced 1.1 million MT, 1.4% of global production.
                                                                      8
                                                                                China              EU               U.S.
CHART 16: GLOBAL FRESH APPLE PRODUCTION (MILLION MT)
                                                                                Chile              South Africa     New Zealand
100                                                                             Rest of World
            China             EU          U.S.            Turkey      6
            India             Iran        Russia          Ukraine
80          Brazil            Chile       Rest of World

                                                                      4
60

40
                                                                      2

20

  0                                                                   0
                                                                               02

                                                                                    03

                                                                                         04

                                                                                              05

                                                                                                      06

                                                                                                      08

                                                                                                      09
                                                                          01

                                                                                                      10

                                                                                                      12

                                                                                                      13

                                                                                                      14

                                                                                                      15

                                                                                                      16

                                                                                                      18

                                                                                                      19
                                                                                                       11
                                                                                                      07

                                                                                                      17
            07

             17
            02

            03

            04

            05

            06

            08

            09
    01

            10

            12

            13

            14

            15

            16

            18

            19
             11

                                                                                                    20
                                                                      20

                                                                                                   20

                                                                                                   20

                                                                                                   20

                                                                                                   20

                                                                                                   20

                                                                                                   20

                                                                                                   20

                                                                                                   20

                                                                                                   20
          20
          20

                                                                           20

                                                                                 20

                                                                                        20

                                                                                             20

                                                                                                  20

                                                                                                   20

                                                                                                   20

                                                                                                   20
         20

         20
  20

         20

         20

         20

         20

         20

         20

         20
      20

         20

         20

         20

         20

         20

         20

Source: USDA PSD Online, March 23, 2021                               Source: USDA PSD Online, March 23, 2021

                                                                                                             Growing agricultural investment opportunities in Chile | 10
CHART 18: GLOBAL FRESH APPLE IMPORTS (MILLION MT)                                  TABLE 5: CHILE APPLE PRODUCTION BY REGION

6                                                                                                      Farmland         20y-CAGR             Commentary
                                                                                     Central           22,239           (0.9%)               Production mainly
                                                                                     (V—VII)                                                 concentrated in Maule,
                                                                                                                                             but increased competi-
                                                                                                                                             tiveness of other crops
4                                                                                                                                            limits apple growth
                                                                                                                                             Leading apple producers
                                                                                                                                             based in Maule
                                                                                     South             3,424            4.3%                 Favorable climatic
                                                                                     (VIII—XVI)                                              conditions, ample water
2
                                                                                                                                             supplies and attractive
                                                                                                                                             land pricing drive apple
                                                                                                                                             expansion in areas near
                                                                                                                                             Araucania

0                                                                                  Source: ODEPA, November 18, 2020
                03

                 04

                 05

                 06

                 08

                 09

                 10

                  11

                 12

                 13

                 14

                 15

                 16

                 18

                 19
    01

         02

                 07

                 17
               20
              20

              20

              20

              20

              20

              20

              20

              20

              20
20

     20

           20

              20

              20

              20

              20

              20

              20

                                                                                         Chile’s apple market is relatively mature, and the top ten
              Russia     EU           Bangladesh      Mexico      Egypt
              Vietnam    Canada       Saudi Arabia    India       Rest of World    players account for over half the market volume. The top three
Source: USDA PSD Online, March 23, 2021
                                                                                   producers are Dole, Unifruit and Frusan, and these companies
         Global apple imports increased from 2.9 million MT in 2001                have maintained their market share over the past five years.
to 5.9 million MT in 2019 (CAGR 4.0%). The Middle East (15%),                      Chile ranks fourth in apple exports after China, the EU and the
Russia (14%), Southeast Asia (12%) and North America are the                       U.S. However, Chile has lost market share in commodity apples in
largest importing regions. Russia was the world’s leading importer                 recent years to New Zealand and South Africa, where production
until 2014, when the Middle East became the world’s largest fresh                  is growing more rapidly. Key headwinds and risks for Chilean
apple destination. The Middle East collectively imported over                      apple producers include lower pricing for traditional varieties and
891,000 MT in 2019, up from less than 180,000 MT in 2001                           increased manual labor costs.
(CAGR 10%). In the Middle East, Iraq, Egypt, Saudi Arabia and the
                                                                                   TABLE 6: CHILE APPLE MARKET RISKS
UAE are the top importers. In North America, imports have moved
lower as apples are able to last longer with increased use of                        Description                        Potential mitigation strategy

controlled atmosphere storage.                                                       Depressed profitability of         •     Focus on patented, higher-value
                                                                                     traditional varieties                    varieties like Ambrosia

Chile Apple Market                                                                                                      •     Develop an organic portion
                                                                                                                              of apple portfolio
CHART 19: CHILE APPLE AREA (000 HECTARES)
                                                                                                                        •     Diversify offering across
30                                                                                                                            high-income destination
                                                                                                                              markets like the EU and U.S.

                                                                                     Manual labor-                      •     Actively manage seasonal labor pool
                                                                                     intensive crop
20                                                                                                                      •     Explore labor-saving technologies

                                                                                         Apple profitability varies widely by varietal, and commodity
10
                                                                                   apples face margins that can be only half that of their patented
                                                                                   counterparts. Leading producers of patented varieties can receive

 0                                                                                 prices 30-50% higher than commodity apples.
           2000            2006            2012            2016             2019
                                      South Central                                      Chile’s key differentiation areas for apples include lower labor
Source: ODEPA, November 18, 2020                                                   and input costs relative to the U.S., and a well-diversified customer
         Despite lower average apple prices in recent years, Chilean               base across North America, the EU and Asia. As the global apple
apple producers have generated attractive returns by developing                    market continues to transition to newer, higher-priced varieties,
new blocks of patented apple varieties in the country’s South.                     trends in Chile are similar. The combination of newer varieties,
Overall apple area has remained mostly flat, driven by lower                       such as Ambrosia and Sunrise Magic, reasonable land and water
profitability of traditional varieties and increased competitiveness               costs, and a variety of growing regions enable Chile to serve as
of other permanent crops.                                                          the largest apple exporter in the Southern Hemisphere.

                                                                                                                      Growing agricultural investment opportunities in Chile | 11
Apple planted area in Chile reached its peak in 1997 at nearly
 40,000 ha, up from 23,000 ha in the early 1990s. Though apple
 planted area has stabilized in the last decade, yields increased
 from 31 MT/ha in 2000 to 36 MT/ha in 2018.

 CHART 20: CHILE APPLE PRODUCTION (MILLION MT) AND YIELD (MT/HECTARE)

             1.6              Production          Exports             Yield                   45

                                                                                              36
             1.2
Production

                                                                                              27

                                                                                                   Yield
             0.8

                                                                                              18

             0.4
                                                                                              9

             0.0                                                                              0
                 06
                00

                 02
                 03
                 04
                 05

                 08
                 09
                 10
                 01

                 12
                 13
                 14
                 15
                 16

                 18
                  11
                 07

                 17
               20
              20
              20

              20
              20
              20
              20
              20
              20
              20
              20

              20
              20
              20
              20
              20
              20
              20
              20

 Source: USDA PSD Online, ODEPA, March 23, 2021

 CHART 21: CHILE APPLE EXPORTS (MILLION MT)

 0.9

 0.8

  0.7

 0.6

 0.5

 0.4

 0.3

 0.2

   0.1

 0.0
                       20
                      02
                       03
                       04
                       05
                       06

                       08
                       09

                       10

                       12
                       13
                       14
                       15
                       16

                       18
                       19
              01

                        11
                       07

                       17
                     20
                    20

                    20
                    20
                    20
                    20
                    20

                    20
                    20
                    20
        20

                    20
                   20
                    20
                    20
                    20
                    20

                    20
                    20
                    20

                   Colombia         U.S.                    Ecuador           Saudi Arabia
                   Brazil           Netherlands             Peru              Taiwan
                   U.K.             Russia                  Germany           India
                   Bolivia          France                  China             Rest of World

 Source: ITC Trade Map, March 28, 2021

                   About 58% of fresh apples produced in Chile are exported.
 The largest market for Chilean apples is Latin America, comprising
 285,000 MT and 40% of all Chilean apple exports in 2018. The EU
 is another major export market for Chilean apples, importing nearly
 124,000 MT and accounting for 17% of Chilean apple exports.

                                                                                                           Growing agricultural investment opportunities in Chile | 12
Blueberries

CHART 22: GLOBAL BLUEBERRY PRODUCTION (000 MT)                          CHART 23: GLOBAL BLUEBERRY IMPORTS (000 MT)

800
                                                                        800
           U.S.              Chile            Peru
           Canada            Mexico           Rest of World                           U.S.                  Netherlands            Canada
                                                                                      Germany               U.K.                   China
600
                                                                                      Spain                 Hong Kong              France
                                                                        600           Poland                Rest of World

400

                                                                        400
200

  0
                           2010                                  2019   200

Source: International Blueberry Organization, January 11, 2021

      Chile’s blueberry production has expanded rapidly over the
                                                                           0
past two decades in response to increasing year-round demand
                                                                              07

                                                                               17
                                                                              02

                                                                              03

                                                                              04

                                                                              05

                                                                              06

                                                                              08

                                                                              09
                                                                              01

                                                                              10

                                                                              12

                                                                              13

                                                                              14

                                                                              15

                                                                              16

                                                                              18

                                                                              19
                                                                               11
                                                                            20

                                                                            20
                                                                           20

                                                                           20

                                                                           20

                                                                           20

                                                                           20

                                                                           20

                                                                           20

                                                                           20

                                                                           20

                                                                           20
                                                                           20

                                                                           20

                                                                           20

                                                                           20

                                                                           20

                                                                           20

                                                                           20

for blueberries in the U.S., Europe and Asia. The Southern
                                                                        Source: ITC Trade Map, January 9, 2021
portion of Chile is especially well-poised to continue to expand,
as Northern Chile faces increasing competition from Peru’s              time of year. Continued increases in labor costs and land prices
growing blueberry sector.                                               will likely support this trend in the near term. The three largest
      Many of the leading blueberry producers in Northern Chile         blueberry producers (Hortifruit, Agroberries and Giddings Berries)
have lost market share as they have sought new, more profitable         represent 25% of Chile’s production. Organic is a key market for
opportunities in Peru, where blueberry harvest occurs at a similar      blueberries, providing demand for new blueberry development.

                                                                                                             Growing agricultural investment opportunities in Chile | 13
TABLE 7: CHILE BLUEBERRY                                                        TABLE 8: CHILE BLUEBERRY RISKS
                    Farmland         20y-CAGR       Commentary                   Description            Potential Mitigation Strategy
  Central           5,943            20.4%          •   Strong historical        Loss of competitive-   •      Differentiating quality by growing
                                                        acreage growth,          ness to Peru and              high-value varieties and organics
  (V—VII)
                                                        but limited room for     Mexico
                                                                                                        •      Produce in areas that harvest outside
                                                        expansion given water
                                                                                                               of competitors’ marketing windows
                                                        scarcity issues and
                                                        competition from                                •      Grow presence in newer markets like
                                                        other crops                                            the EU and Asia
                                                    •   Wide dispersion of       Relatively frag-       •      Increase share of captive production to
                                                        farm sizes with most     mented production             better control quality and traceability
                                                        between 10-50 HA         market with varying
                                                                                                        •      Develop compensation and financing
  South             10,708           13.7%          •   Largest market           quality
                                                                                                               incentives to attract high-quality growers
                                                        segment with
  (VIII—XVI)
                                                        continued growth
                                                        expected through            Chile’s blueberry production is most competitive in areas
                                                        greenfield
                                                        development             where harvest timing overlaps minimally with Peru’s blueberry
                                                    •   Larger-scale farms      harvest. Leading blueberry producers have a footprint across
                                                        concentrated in
                                                                                several growing regions to reduce weather and water risk. The
                                                        Southern regions
Source: ODEPA, November 18, 2020
                                                                                Southern region has the strongest potential for future growth
                                                                                on higher profit potential. Producers are aligning with consumer
      Chile’s blueberry margins have eroded over time as Peru’s
                                                                                markets by developing a reputation for quality and an ability
increasing production puts price pressure on Chile’s blueberry
                                                                                to adapt to consumer preferences, such as increasing organic
prices, especially in the Northern and Central regions. Growers
                                                                                demand. Leading producers also have established brands. As a
of newer varieties such as Legacy and Duke are most competitive
                                                                                Southern Hemisphere producer, Chile continues to be a leading
in quality and yield. Labor expenses represent about 77% of total
                                                                                blueberry exporter, with increasing consumption in the U.S.,
production costs, with most labor resources required for hand-
                                                                                Europe and Asia.
harvesting, and for pruning and thinning.

CHART 24: GROWTH IN CHILE'S BLUEBERRY AREA (000 HECTARES)

20

          Central            South
15

10

 5

 0
          2000              2006             2012       2016          2019

Source: ODEPA, November 18, 2020

                                                                                                            Growing agricultural investment opportunities in Chile | 14
Citrus

      Chile’s citrus area has grown at a 9.6% CAGR from 2000          CHART 26: GLOBAL CITRUS (ORANGE, LEMON, LIME, MANDARIN,
                                                                      GRAPEFRUIT) PRODUCTION (MILLION MT)
to 2019. Citrus represents an attractive growth opportunity in        120
                                                                                China     Brazil    EU       Mexico      U.S.      Turkey      Rest of World
Chile given its lower water requirements and growing global
                                                                      100
consumption. Given the overlap in growing areas, Chile’s leading
                                                                      80
producers of citrus are the same as those for avocados. The top
                                                                      60
three producers comprise 35% of the overall market.
      While Chile is a minor citrus exporter, it plays a major role   40

among Southern Hemisphere producers and is a major supplier to        20

the U.S., during the Northern Hemisphere citrus off-season, and         0

the opening of Asian markets provides further avenues for growth.
                                                                          00

                                                                          02

                                                                          03

                                                                          04

                                                                          05

                                                                          06

                                                                          08

                                                                          09
                                                                          01

                                                                          10

                                                                          12

                                                                          13

                                                                          14

                                                                          15

                                                                          16

                                                                          18

                                                                          19
                                                                           11
                                                                          07

                                                                          17
                                                                        20
                                                                       20

                                                                       20

                                                                       20

                                                                       20

                                                                       20

                                                                       20

                                                                       20

                                                                       20
                                                                       20

                                                                       20
                                                                       20

                                                                       20

                                                                       20

                                                                       20

                                                                       20

                                                                       20

                                                                       20
                                                                       20

                                                                       20

                                                                      Source: USDA PSD, March 23, 2021
CHART 25: GLOBAL CITRUS PRODUCTION BY TYPE (MILLION MT)
                                                                      the Northern region. Export prices across all citrus varieties are
120         Oranges                                                   usually higher than domestic. Yields vary by citrus variety, with
            Mandarins/Tangerines
100         Lemons & Limes                                            easy peelers in the range of 30,000-40,000 kg per hectare. Most
            Grapefruit
80                                                                    direct cost expense is labor, for harvesting, pruning and thinning.

60                                                                          Chile’s top citrus producers are clustered in the Coquimbo

40
                                                                      region where growing conditions are favorable for early-season

20
                                                                      mandarin varieties, which are in strong demand in export markets.
                                                                      Given the water available in key citrus regions, having multiple
 0
                                                                      water sources and efficient irrigation systems are important
         00

         02

         03

         04

         05

         06

         08

         09
         01

         10

         12

         13

         14

         15

         16

         18

         19
          11
        07

         17
       20
      20

      20

      20

      20

      20

      20

      20

      20
      20

      20
 20

      20

      20

      20

      20

      20

      20
      20

      20

                                                                      for managing water risk and cost. The potential opening of the
Source: USDA FAS, March 23, 2021
                                                                      Chinese market for Chile could offer growth opportunities to supply
      Based on recent prices and costs, citrus is among the           Chinese consumers during months when China’s citrus production
highest-margin crops in Chile, most notably for easy peelers in       is low.

                                                                                                         Growing agricultural investment opportunities in Chile | 15
CHART 27: GLOBAL CITRUS EXPORTS (MILLION MT)                                           CHART 28: CHILE CITRUS AREA (000 HECTARES)
20                                                                                     6
          Spain     South Africa
          Egypt     Turkey                                                                    Central    North
          China     Netherlands                                                        5
          U.S.      Rest of World
15

                                                                                       4

10
                                                                                       3

                                                                                       2
 5

                                                                                       1

 0
                                                                                       0
          02

                  03

                  04

                  05

                  06

                  08

                  09
     01

                  10

                  12

                  13

                  14

                  15

                  16

                  18

                  19
                   11
                  07

                  17
                20

                                                                                               2000              2006              2012               2016              2019
 20

               20

               20

               20

               20

               20

               20

               20

               20

               20
      20

           20

               20

               20

               20

               20

               20

               20

Source: ITC Trade Map, March 23, 2021                                                  Source: USDA FAS, March 23, 2021

TABLE 9: CHILE CITRUS CROPLAND BY REGION
                                        Farmland                 20y-CAGR                     Commentary

  North                                 3,784                    8.8%                         •       Mandarin production concentrated in Coquimbo
  (III, IV)                                                                                   •       Citrus relatively water-efficient

  Central                               1,910                    11.8%                        •       Mandarins, lemons and oranges
  (V—VII)                                                                                     •       Most productive areas located away from coast

Source: ODEPA, November 18, 2020

TABLE 10: CHILE CITRUS RISKS

                                        Potential Mitigation Strategy

  Production concentrated               •   Develop farms with multiple sources of water and efficient irrigation technology
  in highly drought-prone
                                        •   Grow water-efficient varieties
  regions

  Concentrated export                   •   Diversify into new markets such as Asia, which recently opened its borders to Chilean citrus
  market in the U.S.
                                        •   Develop sweeter, seedless varieties favored in Asian markets such as Tango and Orri

                                                                                                                          Growing agricultural investment opportunities in Chile | 16
Avocados

         Chile’s avocado production has steadily increased; however,                                  Avocados yield an attractive margin supported by growing
planted area in recent years has been curtailed by the crop’s                                   domestic and export market prices. Labor accounts for the largest
intensive water needs in drought-prone regions. Chile’s avocado                                 share of farming costs, about 35%, including harvest, chemical
yields are among the highest globally.                                                          application and irrigation maintenance.
         Chile’s avocado sector is relatively saturated, with the leading                             Chile’s top avocado growers are in the Valparaiso region
three producers (Propal, Agricorn and Santa Cruz) comprising 56%                                where the climate is most favorable for avocado production and
of the total market. With strong global demand growth, producers                                closer to the port. Most Chilean avocados are exported to the
such as Mexico and Peru are likely to erode Chile’s share of the                                EU, where demand is growing. Key factors for profitability include
global export market. Mexico dominates the global avocado                                       multiple water sources and efficient irrigation technology. Chile
market, accounting for half of the total.                                                       features counter-seasonal production to serve growing avocado
                                                                                                markets such as Asia, especially China and Korea.
CHART 29: GLOBAL AVOCADO PRODUCTION (MILLION MT)
                                                                                                CHART 30: GLOBAL AVOCADO EXPORTS (MILLION MT)
8

          Mexico               Dominican Republic        Peru                                   3
          Indonesia            Colombia                  Brazil                                          Mexico         Peru                 Netherlands
6
          Rest of World                                                                                  Chile          Spain                South Africa
                                                                                                         U.S.           Rest of World
                                                                                                2
4

                                                                                                1
2

0                                                                                               0
                                                            11
    01

                                                    10

                                                                  12

                                                                       13

                                                                            14

                                                                                 15

                                                                                      16
         02

              03

                   04

                          05

                               06

                                          08

                                               09

                                                                                           17
                                     07

                                                                                                  02

                                                                                                  03

                                                                                                  04

                                                                                                   05

                                                                                                   06

                                                                                                   08

                                                                                                   09
                                                                                                   01

                                                                                                   10

                                                                                                   12

                                                                                                   13

                                                                                                   14

                                                                                                   15

                                                                                                   16

                                                                                                   18
                                                                                                    11
                                                                                                   07

                                                                                                   17
                                                          20

                                                                                                 20
20

                                                    20

                                                                  20

                                                                       20

                                                                            20

                                                                                 20

                                                                                      20

                                                                                           20

                                                                                                20

                                                                                                20

                                                                                                20

                                                                                                20

                                                                                                20

                                                                                                20

                                                                                                20

                                                                                                20

                                                                                                20
     20

           20

                 20

                      20

                           20

                                   20

                                        20

                                             20

                                                                                                20

                                                                                                20

                                                                                                20

                                                                                                20

                                                                                                20

                                                                                                20

                                                                                                20

                                                                                                20

Source: USDA FAS, March 22, 2021                                                                Source: ITC Trade Map, March 22, 2021

                                                                                                                                    Growing agricultural investment opportunities in Chile | 17
TABLE 11: CHILE AVOCADO PRODUCTION BY REGION

                                   Farmland                     20y-CAGR                   Commentary
  North                            4,135                        6.1%                       •     Production focused in Coquimbo but water issues and
  (III, IV)                                                                                      increasing attractiveness of citrus will likely limit expansion

  Central                          23,628                       3.8%                       •     Largest segment of market is in Valparaiso where most
  (V—VII)                                                                                        commercial producers are based
                                                                                           •     RM production catered to domestic market
                                                                                           •     Relatively average farm sizes (38% of farms 100+ HA)

Source: ODEPA, November 18, 2020

TABLE 12: CHILE AVOCADO SECTOR KEY RISKS

  Description                                 Potential Mitigation Strategy

  Water-intensive crop limits                 •    Develop farms with multiple sources of water and efficient irrigation technology
  expansion opportunities and
                                              •    Showcase sustainability water use
  creates reputational risk

  Increased competitive pressure              •    Focus on production of higher-quality varieties
  from other producers like Mexico
                                              •    Grow presence in non-U.S. markets like EU and Asia

CHART 31: CHILE AVOCADO AREA (000 HECTARES)
40
         Central     North

30

20

10

 0
          2000            2006              2012         2016           2019

Source: ODEPA, November 18, 2020

                                                                                                                       Growing agricultural investment opportunities in Chile | 18
Tree Nuts

       Chilean tree nut area has grown rapidly, increasing at a 10.4%    The U.S. is the global leader in tree nut exports, accounting for
CAGR 2000 to 2019. Walnuts are the leading tree nut in the               half of all tree nuts exported globally.29
Central and Northern regions, while hazelnuts dominate growth in               Compared to fruits, tree nut production typically has lower
the Central and South regions. Walnuts are the leading tree nut in       capex needs and lower production costs (mainly due to mechanical
Chile by area, production volume and exports.                       28
                                                                         harvesting). Capex expenditures per hectare are generally
       Chilean tree nut production is relatively small and fragmented;   lower than most tree fruits and are led by irrigation and orchard
however, the sector has strong growth drivers, as consumption of         infrastructure. Chile’s tree nut sector is poised for growth as Chile’s
tree nuts increases globally and Chile is able to leverage strengths     natural resources support expansion, and consumption growth
similar to its more traditional agricultural exports. The top three      enables Chile to export tree nuts to many of the markets where the
Chilean tree nut producers account for 20% of the market by              country’s producers sell other permanent crops.
volume, a lower share compared to other Chilean crop sectors.            CHART 33: GLOBAL TREE NUT PRODUCTION BY COUNTRY 2019/2020
                                                                         MARKETING YEAR
CHART 32: GLOBAL TREE NUT PRODUCTION BY TYPE (MILLION MT)
5                                                                                                                                                    U.S.
        Almonds             Walnuts            Cashews
        Pistachios          Hazelnuts          Pecans                               28%
                                                                                                                                                     Turkey
4       Macadamias          Brazil Nuts        Pine Nuts
                                                                                                                                         38%
                                                                                                                                                     China
3
                                                                                                                                                     Iran

2                                                                                                                                                    India
                                                                                 3%
1                                                                                                                                                    Côte d'Ivoire
                                                                                    4%
                                                                                                                                                     Rest of World
0                                                                                         6%
  04

        05

                  6

                          08

                                09

                                       10

                                                   12

                                                   13

                                                   14

                                                   15

                                                   16

                                                   18

                                                   19
                                              11
                 07

                                                   17

                                                                                                                         11%
               0

                                            20
                                     20

                                                20

                                                20

                                                20

                                                20

                                                20

                                                20

                                                20

                                                20
20

      20

            20

               20

                        20

                              20

                                                                                                     10%
Source: International Nut and Dried Fruit Council, March 31, 2021        Source: International Nut and Dried Fruit Council, March 31, 2021

                                                                                                                Growing agricultural investment opportunities in Chile | 19
CHART 34: GLOBAL TREE NUT TRADE (MILLION MT)                                                           CHART 35: CHILE TREE NUT AREA: WALNUTS, HAZELNUTS
                                                                                                       AND ALMONDS (000 HECTARES)
3        Almonds           Cashews           Pistachios                                                80
         Walnuts           Hazlenuts         Pecans
                                                                                                                 South       Central       North
         Macadamias        Pine Nuts         Brazil Nuts

                                                                                                       60
2

                                                                                                       40

1

                                                                                                       20

0
                                                                                                        0
   04

   05

   06

   08

  09

                                         10

                                                       12

                                                              13

                                                                      14

                                                                             15

                                                                                    16

                                                                                                  18
                                                11
   07

                                                                                           17
                                              20
                                       20

                                                     20

                                                            20

                                                                    20

                                                                           20

                                                                                  20

                                                                                         20

                                                                                                20
                                                                                                                2000             2006               2012              2016               2019
20

20

20

20

20

20

Source: International Nut and Dried Fruit Council, March 31, 2021                                      Source: ODEPA, November 18, 2020

TABLE 13: CHILE TREE NUT AREA BY REGION

                                  Farmland            20y-CAGR               Commentary
    North (III, IV)               2,501               9.2%                   •      Walnuts account for most of Northern acreage in Coquimbo

    Central (V—VII)               49,666              8.8%                   •      Walnuts are most competitive in Región Metropolitana, followed by O’Higgins and Maule.
                                                                             •      Most almond acreage limited to Región Metropolitana.

    South (VIII—XVI)              16,502              34.4%                  •      Rapid growth of hazelnut acreage due to favorable growing conditions.
                                                                             •      Pockets of walnut growth limited to Biobio and Nuble.

Source: ODEPA, November 18, 2020

TABLE 14: CHILE TREE NUT SECTOR RISKS

    Description                                       Potential Mitigation Strategy

    Relatively fragmented production                  •      Increase share of captive production to better control quality and traceability
    market with varying quality
                                                      •      Develop compensation and financing incentives to attract high-quality growers

    Long storability periods create                   •      Develop competitive marketing programs that time sales during high-pricing periods
    direct competition with U.S.
                                                      •      Focus on production of high-quality tree nut varieties that are favored by buyers

                                                                                                                                          Growing agricultural investment opportunities in Chile | 20
Sustainability and Responsible Investing
Environment in Chile
    Both Chile’s government and the agricultural sector have taken          Fruits, nuts and vegetables tend to have organic comprising a
steps towards enhancing the environmental and social contribution           greater share of global production compared to annual row crops
of agriculture, aligning with broader global and national goals             such as grains and oilseeds.
around sustainability.   30
                              Key areas include soil health, organic            Within the tree fruit sector, the leading trade association,
production, water, climate change and diversity.                            ASOEX, has established the Guide of Good Practices for the
    To meet increased demand for sustainably produced products,             Sustainability of the Chilean Fruit Industry including aspects
Chilean agriculture has adopted increased soil conservation                 of food safety, respect for the environment, corporate social
practices and increasingly certified cropland as organic. Chile’s           responsibility, and economic sustainability.33 More than 90% of the
Ministry of Agriculture administers a soil conservation and                 tree fruit orchards use localized irrigation (such as drip and micro
restoration financial incentive program, SIRDS-S. Farmers submit            sprinklers), rather than taking prior flood irrigation approaches.34
proposals and compete against other growers for funding for                 ASOEX has also coordinated the training of more than 264,000
activities that enhance soil health and improve farm sustainability,        workers since 2000 in areas of food safety, pesticide use and
with an average of 151,000 hectares funded each year from 2011              good farming practices. Finally, ASOEX invests in local rural
to 2018. In Chile, organic agriculture totals 113,000 hectares as
        31
                                                                            communities, notably through school and home construction
of 2019 (up from 80,000 in 2014), including more than 14,000                following earthquakes in 2010 and 2015.35
hectares of permanent fruits and tree nuts, with organic exports                With the Andes mountains receiving moisture from the Pacific
reaching USD$274 million, up from USD$217 million in 2015.             32
                                                                            Ocean, Chile has among the largest freshwater resources in the

                                                                                                       Growing agricultural investment opportunities in Chile | 21
world (922 cubic kilometers annually), ranking 14th globally and        comprising 56% of all greenhouse gas emissions.40 As Chile faces
fifth in Latin America.36 In Chile, water is a basic right protected    and adapts to climate change, the country’s span across latitudes
by federal laws. The 1981 Water Code, augmented and updated             and healthy water availability should provide resiliency, with the
in 2005, established water basins with tradeable water rights.     37
                                                                        potential for the gradual movement of crop types southward.
To meet the needs of providing water to the full spectrum of                 Chile includes nine indigenous groups, who represent nearly
the country, including agriculture, Chile is evolving, from water       12% of the country’s population and the country has incorporated
code reforms and increased funding for water infrastructure to          minimum levels of participation in the 2021 Constitutional
incentives for adoption of water efficiency technology.   38
                                                                        Assembly for indigenous populations. Recognizing rights of
    Chile’s approach to climate change includes a national              indigenous communities is an important part of agriculture
commitment to reducing the intensity of its carbon dioxide              investment in Chile. Chile’s agriculture sector includes 49,000
emissions (30% reduction by 2030 from 2010 levels), increased           indigenous-owned farms covering 1.2 million hectares.41 The new
use of renewable energy, and reforesting 100,000 hectares of            Chilean Constitution is expected to add recognition of indigenous
land.39
          Joining global climate change mitigation efforts, Chile is    rights, which will likely contribute to the overall stability and growth
a signatory to the Paris climate agreements. In 2016, with the          of the country, and fall 2019 demonstrations in the South of Chile
latest available data, the agriculture sector accounted for 10.6%       highlight the pressing need for reform as a benefit to all citizens
of the country's greenhouse gas emissions, at 11,802 kt of              of Chile.42
carbon dioxide equivalent, with methane from the livestock sector

                                                                                                    Growing agricultural investment opportunities in Chile | 22
Looking Forward
Chile plays a leading role in the export        opportunities for all Chileans, the overall
of high-value fruit, nut and vegetable          open market economy aspects of free
crops globally. As global incomes rise,         trade and openness to investment are
consumers are seeking higher-quality            expected to continue. The drivers that
foods and enhanced nutrition.  43
                                    While the   underpin Chile’s competitive advantage
country faced internal political changes        in producing and exporting high-value
and the COVID-19 pandemic in 2020,              crops will further enable development in
the agriculture sector remained one of          growing markets as global demand grows,
the world’s top suppliers of high-value         and Chile is poised to supply sustainably
crops. Chile’s political climate in 2021        produced foods.
will be guided by the process of writing
the new constitution, which could lead
to substantial policy shifts in terms of
government services and water rights
legislation. As the country seeks more
equitable access to economic and social

                                                 Growing agricultural investment opportunities in Chile | 23
Endnotes
1.    OECD, https://data.oecd.org/agrpolicy/agricultural-support.htm, accessed       24.   ODEPA, Panorama de la Agricultura Chilena 2019, accessed 3/28/2021

      3/23/2021                                                                      25.   ODEPA, Datos Macroeconomicos y del sector silvoagropecuario, Octubre 2018

2.    Panorama de la Agricultura Chilena 2019, https://www.odepa.gob.cl/wp-          26.   USDA ERS, https://www.ers.usda.gov/data-products/state-agricultural-trade-

      content/uploads/2019/09/panorama2019Final.pdf, accessed 3/25/2021                    data/annual-state-agricultural-exports/, accessed 4/12/2021

3.    The World Bank, https://data.worldbank.org/indicator/SP.POP.                   27.   ITC Trade Map, accessed 3/28/2021

      TOTL?locations=CL, accessed 3/25/2021                                          28.   ODEPA, Panorama de la Agricultura Chilena 2019, accessed 4/09/2021
4.    International Monetary Fund, March 2021, accessed 3/25/2021                    29.   International Nut and Dried Fruit Council, March 2021
5.    Heritage Foundation, https://www.heritage.org/index/country/chile, accessed    30.   ODEPA, Agricultura Chilena Reflexiones y Desafíos al 2020, accessed
      3/25/2021                                                                            4/5/2021
6.    The World Bank, https://data.worldbank.org/indicator/NY.GDP.PCAP.              31.   ODEPA, Panorama de la Agricultura Chilena, https://www.odepa.gob.cl/wp-
      CD?locations=CL, accessed 3/24/2021                                                  content/uploads/2019/09/panorama2019Final.pdf, acessed 4/11/2021
7.    The World Bank, https://data.worldbank.org/indicator/NY.GDP.MKTP.CD,           32.   ODEPA, Agricultura orgánica, Cambio climático, Mercado Internacional y
      accessed 3/28/2021
                                                                                           Nacional, accessed 4/5/201
8.    The World Bank, https://data.worldbank.org/country/CL, accessed 4/21/2021
                                                                                     33.   Chilean Fruit Exporters Association (ASOEX), https://www.asoex.cl/images/
9.    World Trade Organization, https://www.wto.org/english/thewto_e/countries_e/
                                                                                           documents/guiasBPA/sr/mobile/index.html#p=1, accessed 4/21/2021
      chile_e.htm,accessed 3/22/2021
                                                                                     34.   Chilean Fruit Exporters Association (ASOEX), https://www.asoex.cl/images/
10.   Transparency International, https://www.transparency.org/en/cpi/2020/index/
                                                                                           documents/guiasBPA/sr/mobile/index.html#p=1, accessed 4/21/2021
      nzl, accessed 3/25/2021
                                                                                     35.   Chilean Fruit Exporters Association (ASOEX), https://www.asoex.cl/images/
11.   2020 Index of Economic Freedom, https://www.heritage.org/index/, accessed
      3/25/2021                                                                            documents/guiasBPA/sr/mobile/index.html#p=1, accessed 4/21/2021

12.   World Economic Forum, http://www3.weforum.org/docs/WEF_                        36.   ODEPA, Agricultura Chilena Reflexionces y Deasafios al 2030, accessed

      TheGlobalCompetitivenessReport2019.pdf, accessed 3/22/2021                           4/12/2021
13.   The Washington Post, https://www.washingtonpost.com/politics/2020/10/30/       37.   ODEPA, Agricultura Chilena Reflexiones y Desafíos al 2020, accessed
      chile-voted-write-new-constitution-will-it-promise-more-than-government-can-         4/5/2021
      deliver/, accessed 3/28/2021                                                   38.   ODEPA, Panorama de la Agricultura Chilena, https://www.odepa.gob.cl/wp-
14.   OECD, http://www.oecd.org/education/ceri/Spotlight8-Inequality.pdf, accessed         content/uploads/2019/09/panorama2019Final.pdf, acessed 4/11/2021
      3/29/2021                                                                      39.   ODEPA, Agricultura orgánica, Cambio climático, Mercado Internacional y
15.   Bloomberg, https://www.bloomberg.com/news/articles/2021-03-02/
                                                                                           Nacional, accessed 4/5/201
      moderates-poised-to-hold-sway-over-chile-s-new-constitution, accessed
                                                                                     40.   Chilean Fruit Exporters Association (ASOEX), https://www.asoex.cl/images/
      3/29/2021
                                                                                           documents/guiasBPA/sr/mobile/index.html#p=1, accessed 4/21/2021
16.   USDA Production, Supply and Distribution, https://apps.fas.usda.gov/
                                                                                     41.   Chilean Fruit Exporters Association (ASOEX), https://www.asoex.cl/images/
      psdonline/app/index.html#/app/home, accessed 3/25/2021
17.   Panorama de le Agricultura Chilena 2019, https://www.odepa.gob.cl/wp-                documents/guiasBPA/sr/mobile/index.html#p=1, accessed 4/21/2021

      content/uploads/2019/09/panorama2019Final.pdf, accessed 3/24/2021              42.   Chilean Fruit Exporters Association (ASOEX), https://www.asoex.cl/images/

18.   Panorama de la Agricultura Chilena 2019, accessed 3/28/2021                          documents/guiasBPA/sr/mobile/index.html#p=1, accessed 4/21/2021
19.   2017 Census of Agriculture, accessed 3/24/2021                                 43.   ODEPA, Agricultura Chilena Reflexionces y Deasafios al 2030, accessed
20.   HNRG estimate, March 2021, based on ODEPA data                                       4/12/2021
21.   ODEPA, Panorama de la Agricultura Chilena 2019, https://www.odepa.gob.cl/
      wp-content/uploads/2019/09/panorama2019Final.pdf, accessed 3/28/2021
22.   ODEPA, Panorama de la Agricultura Chilena 2019, accessed 3/28/2021
23.   ODEPA, Panorama de la Agricultura Chilena 2019, https://www.odepa.gob.cl/
      wp-content/uploads/2019/09/panorama2019Final.pdf, accessed 3/28/2021

                                                                                                                      Growing agricultural investment opportunities in Chile | 24
HNRG Research Team

Keith Balter                                        Mary Ellen Aronow               Daniel V. Serna
Managing Director,                                  Director,                       Associate Director,
Economic Research                                   Forest Economics                Senior Portfolio Manager

kbalter@hnrg.com                                    maronow@hnrg.com                dserna@hnrg.com

Elizabeth Shestakova                                Weiyi Zhang, Ph.D
Economic Research Analyst                           Senior Agricultural Economist

eshestakova@hnrg.com                                wzhang@hnrg.com

About Hancock Natural Resource Group

Hancock Natural Resource Group, Inc. is a registered investment
adviser and part of Manulife Investment Management’s Private
Markets platform. We specialize in global farmland and timberland
portfolio development and management on behalf of our investors
worldwide. Our timber division manages approximately 5.4 million
acres of timberland across the United States and in Canada, New
Zealand, Australia and Chile. Our agricultural investment group
oversees approximately 474,000 acres of prime farmland in major
agricultural regions of the United States and in Canada and Australia.

About Manulife Investment Management

Manulife Investment Management is the global wealth and asset
management segment of Manulife Financial Corporation. We draw
on more than a century of financial stewardship to partner with
clients across our institutional, retail and retirement businesses
globally. Our specialist approach to money management includes
the highly differentiated strategies of our fixed-income, specialized
equity, multi-asset solutions, and private markets teams—along
with access to specialized, unaffiliated asset managers from
around the world through our multimanager model.

                                                                                      Growing agricultural investment opportunities in Chile | 25
You can also read