First quarter 2021 - Scatec
←
→
Page content transcription
If your browser does not render page correctly, please read the page content below
First quarter 2021

2 First quarter 2021
About Scatec
Scatec is a leading renewable power producer, delivering affordable and clean energy worldwide. As a long- term player,
Scatec develops, builds, owns and operates solar, wind and hydro power plants and storage solutions. Scatec has more
than 3.5 GW in operation and under construction on four continents and more than 500 employees. The company is
targeting 15 GW capacity in operation or under construction by the end of 2025. Scatec is headquartered in Oslo, Norway
and listed on the Oslo Stock Exchange under the ticker symbol ‘SCATC’. To learn more, visit www.scatec.com.
Asset portfolio 1) Segment overview
Capacity Economic Development & Construction
Technology MW interest 2)
The Development & Construction segment derives its
In operation revenues from the sale of development rights and con-
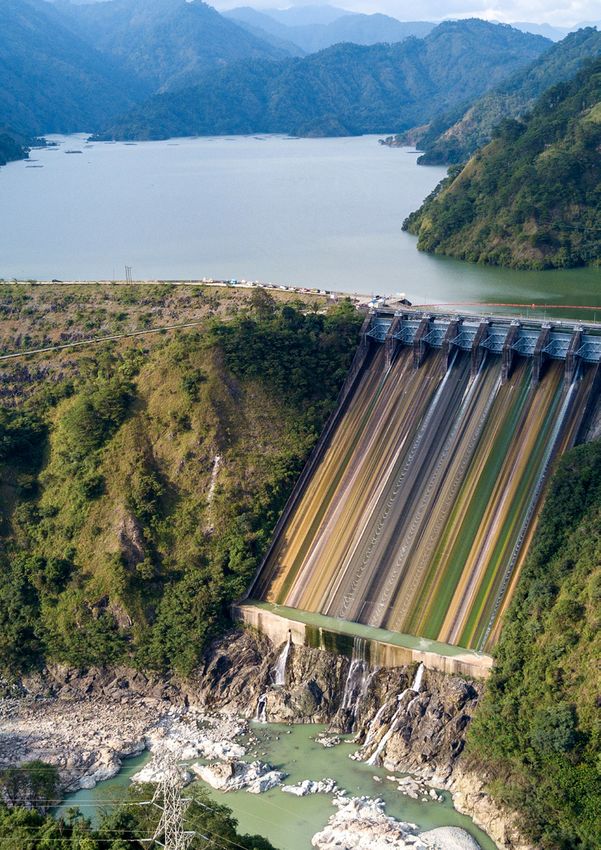
Philippines 642 50% struction services delivered to power plant companies
Laos 525 20% where Scatec has economic interests.
South Africa 448 45%
Egypt 380 51% Power Production
Uganda 255 28% The power plants produce electricity for sale primarily
Malaysia 244 100%
under long term power purchase agreements (PPAs),
Brazil 162 44%
with state owned utilities or corporate off-takers, or
Ukraine 133 73%
under government-based feed-in tariff schemes. The
Honduras 95 51%
Jordan 43 62% average remaining PPA duration for power plants in
Mozambique 40 53% operation is 18 years. The electricity produced from
Vietnam 39 100% the power plants in the Philippines is sold on bilateral
Czech Republic 20 100% contracts and the spot market, under a renewable
Rwanda 9 54% operating license. Also, ancillary services make up a
Total 3,035 48% significant part of the total revenues in the Philippines.
Under construction Services
Ukraine 203 100%
The Services segment comprises Operations &
Pakistan 150 75%
Maintenance (O&M) and Asset Management services
Argentina 117 50%
provided to power plants where Scatec has economic
Mexico 9 100%
Total 479 78%
interests. O&M revenues are generated on the basis of
fixed service fees with additional profit-sharing arrange-
Projects in backlog ments. Asset Management services typically include
Tunisia 360 55% financial reporting to sponsors and lenders, regulatory
Brazil 101 40% compliance, environmental and social management, as
Ukraine 65 65% well as contract management on behalf of the power
Bangladesh 62 65% plant companies.
Mali 33 64%
Lesotho 20 48% Corporate
Total 641 55%
Corporate consists of activities of corporate services,
management and group finance.
Grand total 4,155 53%
Projects in pipeline 11,098
1) Asset portfolio as per reporting date.
2) Scatec’s share of the total estimated economic return from its subsidiaries. For projects under development the economic interest may be subject to change.Scatec ASA 3
Q1’21 – Strong growth and solid cash flow generation
• Acquistion of SN Power completed Proportionate revenues and EBITDA
– the hydro assets contributing to strong growth NOK million
• Power production of 854 (349) GWh and EBITDA
1)
1,200
of NOK 636 (346) million.
1,000
• Power Production cash flow to equity NOK 681 (107)
800
million including refinancing proceeds
600
• Start construction of 150 MW solar plant in Pakistan
400
• 2025 growth target announced – 15 GW capacity
200
and investments of NOK 100 billion
0
Q1 2020 Q2 2020 Q3 2020 Q4 2020 Q1 2021
Revenues EBITDA
Key figures
NOK million Q1 2021 Q4 2020 Q1 2020 FY 2020
Proportionate Financials 2)
Revenues and other income 1,010 497 866 2,844
Power Production 924 402 391 1,708
Services 56 45 52 232
Development & Construction 24 46 414 873
Corporate 6 5 8 33
EBITDA 2) 636 223 346 1,306
Power Production 704 320 331 1,404
Services 17 10 16 82
Development & Construction -60 -38 15 -28
Corporate -25 -69 -16 -153
Operating profit (EBIT) 406 63 206 690
Net interest- bearing debt 2)
14,934 1,851 8,139 1,851
Scatec proportionate share of cash flow to equity 2) 571 -22 107 324
Power Production (GWh) 854 407 349 1,602
Power Production (GWh) 100% 3)
2,147 756 623 2,911
Consolidated Financials
Revenues and other income 831 679 625 2,754
EBITDA 2) 631 448 503 2,069
Operating profit (EBIT) 444 244 328 1,292
Profit/(loss) 42 -561 299 -368
Net interest- bearing debt 2)
14,744 5,223 12,038 5,223
Basic earnings per share 0.11 -4.10 1.87 -3.51
1) Amounts from same period last year in brackets
2) See Alternative Performance Measures appendix for definition
3) Production volume on a 100% basis from all entities, including JV companies.4 First quarter 2021
Group – Proportionate financials
Q1 Q4 Q1 FY
The Group’s revenues increased compared to the same
NOK million 2021 2020 2020 2020 quarter last year, from inclusion of the SN Power assets
in January 2021 combined with new solar plants in
Revenues and other income 1,010 497 866 2,844 operations, partly offset by lower construction activity.
Gross Profit 907 457 497 2,080
Operating expenses -271 -234 -151 -775
The increase in operating expenses and depreciation
EBITDA 1) 636 223 346 1,306
compared with same quarter last year is mainly driven
EBITDA margin 1) 63% 45% 40% 46%
by the new power plants in the portfolio.
D&A and impairment -230 -160 -140 -615
EBIT 406 63 206 690
Cash flow to equity 1) 571 -22 107 324 With a larger portfolio of power plants in operation, both
revenues and EBITDA increased in the Power Production
segment, while decreasing in the Development &
Proportionate revenues and EBITDA Construction segment due to low construction activity in
NOK million
the quarter. This segment mix resulted in a higher EBITDA
1,200 80% margin for the Group compared with the previous quarter.
900 60%
Cash flow to equity increased compared to the same
600 40%
quarter last year, primarily explained by the factors above
300 20% in addition to NOK 397 million from refinancing of assets in
0 0% the Philippines. See page 10 for further comments on cash
Q1 2020 Q2 2020 Q3 2020 Q4 2020 Q1 2021 flow to equity.
Revenues EBITDA EBITDA margin
1) See Alternative Performance Measures appendix for definition.
Power Production – Proportionate financials
Q1 Q4 Q1 FY The capacity increased by 1,461 MW (including the SN Power
NOK million 2021 2020 2020 2020
assets) from year end 2020, and increased production is the
main reason for higher revenues and EBITDA. Cash flow to
Revenues and other income 924 402 391 1,708 equity also includes NOK 397 million that stems from debt
Gross profit 844 402 391 1,708
refinancing of assets in the Philippines.
Operating expenses -140 -81 -60 -304
EBITDA 1) 704 320 331 1,404
Power production reached 854 GWh in the first quarter
EBITDA margin 1) 76% 80% 85% 82%
compared to 349 GWh in the same quarter last year, while
D&A and impairment -221 -149 -125 -566
EBIT 483 171 206 838 revenues and EBITDA increased by NOK 532 million and
Cash flow to equity 1) 681 53 105 427 NOK 373 million respectively.
The financial performance of the hydropower plants was
Proportionate revenues and EBITDA strong in the quarter with production above median expec-
NOK million GWh
tiation, mainly due to favorable hydrology and higher power
1,000 1,000 prices in the Philippines.
800 800
600 600 Revenues and EBITDA from solar plants remained stable
400 400 compared to the same quarter last year, somewhat offset
200 200 by increased asset ownership costs.
0 0
Q1 2020 Q2 2020 Q3 2020 Q4 2020 Q1 2021 See page 15 for a specification of financial performance for
Revenues EBITDA Power production (GWh) each country in the portfolio.
1) See Alternative Performance Measures appendix for definition.Scatec ASA 5
Services – Proportionate financials
Q1 Q4 Q1 FY
The revenues in the Services segment increased from the
NOK million 2021 2020 2020 2020 previous quarter due to the inclusion of revenues related to
services rendered to the hydropower plant in Laos.
Revenues and other income 56 45 52 232
Operating expenses -39 -35 -36 -150 Operating expenses in the segment mainly constitute fixed
EBITDA 1) 17 10 16 82
expenses such as personnel and recurring maintenance
EBITDA margin 1) 30% 22% 31% 35%
cost reflecting fixed maintenance schedules. As such the
D&A and impairment -1 -1 -1 -3
operating expenses are broadly in line with the previous
EBIT 16 9 15 79
Cash flow to equity 1) 14 8 13 65
quarter.
Proportionate revenues and EBITDA
NOK million
80
60
40
20
0
Q1 2020 Q2 2020 Q3 2020 Q4 2020 Q1 2021
Revenues EBITDA
1) See Alternative Performance Measures appendix for definition.
Development & Construction (D&C) – Proportionate financials
Q1 Q4 Q1 FY In February 2021, Scatec achieved financial close for the 150
NOK million 2021 2020 2020 2020
MW Sukkur project in Pakistan and development revenues
have been recorded in the first quarter.
Revenues and other income 24 46 414 873
Gross Profit - 6 46 109
The total construction activity and revenues in the quarter
Gross Margin 1) 1% 12% 11% 12%
was low compared with the same quarter last year as only
Operating expenses -60 -43 -31 -137
minor activities are remaining in Argentina and Ukraine.
EBITDA 1) -60 -38 15 -28
These plants are estimated to be completed in the second
D&A and impairment -2 -5 -10 -26
EBIT -62 -43 5 -54 quarter.
Cash flow to equity 1) -51 -27 13 -15
The increase in operating expenses reflects the new scope
of pursuing hydropower project development after the
Proportionate revenues and EBITDA acquisition of SN Power. Operating expenses is comprised
NOK million
of approximately NOK 49 million for early stage project
500 development and NOK 11 million related to the construc-
400 tion business. In addition project development spending
300 (including amounts capitalised) reached NOK 60 million in
200
the quarter. The company continued to mature a wide range
100
of projects, resulting in 13% pipeline growth, see page 13 for
0
-100 further details
Q1 2020 Q2 2020 Q3 2020 Q4 2020 Q1 2021
Revenues EBITDA
1) See Alternative Performance Measures appendix for definition.6 First quarter 2021
Corporate – Proportionate financials
Q1 Q4 Q1 FY Revenues in the corporate segment are earned through
NOK million 2021 2020 2020 2020
corporate services rendered to the Groups subsidiaries.
Revenues and other income 6 5 8 33 Operating expenses increased by NOK 7 million compared
Operating expenses -31 -74 -24 -186
with the same quarter last year, mainly related to the inte-
EBITDA 1) -25 -69 -16 -153
gration of SN Power and a strengthened corporate function
D&A and impairment -6 -5 -5 -20
to support the Company’s growth targets.
EBIT -31 -74 -21 -173
Cash flow to equity 1) -72 -55 -24 -153
1) See Alternative Performance Measures appendix for definition.
Short term guidance
Scatec updated its financial and operational targets at its Services
Capital Markets Update 23 March 2021. Refer to the Revenues in the Services segment are expected to reach
complete presentation material for further details. approximately NOK 280 million in 2021 with an EBITDA
margin of 30-35%.
Power Production
The estimated production for second quarter and full Development & Construction
year 2021 is based on production from the portfolio with a D&C revenues and margins are dependent on progress on
capacity of 3,035 MW in operation at the end of first development and construction projects.
quarter 2021.
At the end of first quarter the remaining, not booked,
GWh Q1 2021 Q2 2021E 2021E
construction contract value was about NOK 513 million.
Proportionate 854 815 – 865 3,500 – 3,700
100% basis 2,147 2,050 – 2,150 9,000 – 9,400
D&C revenues will further increase when new projects
move into construction.
Corporate
Full year 2021 EBITDA for Corporate is expected to be
NOK -110 million.
COVID-19 The transaction is structured so that the economic risk
Scatec has not experienced any material effects related to of the acquired companies was transferred to Scatec 1
COVID-19 on its operations in first quarter 2021. January 2021, and SN Power is consequently included in
the proportionate segment financials from 1 January 2021.
Acquistion of SN Power In the groups consolidated IFRS financials the date of
In January 2021, Scatec ASA completed the acquisition of inclusion is 29 January 2021, which is the date of comple-
100% of the shares of SN Power AS, a leading hydropower tion of the transactions, defined by IFRS as the point in
developer and Independent Power Producer (IPP), from time Scatec obtained control over the project companies.
Norfund for a total consideration of USD 1,200 million A full reconciliation between the proportionate and the
(NOK 10,371 million). IFRS financials including the effect of January 2021 is
provided in Note 2 Operating Segments.Scatec ASA 7
See note 1 regarding basis for preparation and note 8 Outlook
Business combination for further information about the Despite the pandemic, global investment in low-car-
acquisition and the fair value of the identifiable assets and bon energy transition reached USD 500 billion in 2020
liabilities of SN Power and the Purchase Price Allocation. according to Bloomberg New Energy Finance (BNEF), a
9% increase from previous year. This level is expected to
remain in 2021.
ESG performance
Sustainability and Climate Reports BNEF expects global solar new build to accelerate, seeing
Scatec’s Annual Sustainability Report was published at new installations between 160-209 GW in 2021, up from
the end of first quarter 2021. The report summarises key an estimated 141 GW in 2020. For wind, new installations
performance, results and targets related to the Company’s reached more than 70 GW for the first time in 2020 with
most material ESG risks and opportunities. The full report further growth to 84 GW expected in 2021. The global
can be downloaded under “Sustainability Reports”. energy storage market also set new records in 2020 with
5.3 GW in new capacity, expected to reach 9.7 GW in 2021.
The Company also published its first TCFD (Task Force on Global hydropower new-build reached approximately
Climate-Related Financial Disclosure) Report at end of first 18 GW in 2020, and the International Energy Agency fore-
quarter, 2021. TCFD encourages standardised reporting of casts an increase of 28 GW in 2021.
financially material climate-related risks and opportunities.
The reporting guidelines are grouped into four areas of Long term, all renewables are expected to see massive
disclosure that represent core elements of how organisa- growth, with solar, hydro, wind and storage covering 73% of
tions operate: governance, strategy, risk management, and global energy needs by 2050.
metrics and targets. The TCFD report is available under
“Climate Reporting”. In March 2021, Scatec announced a NOK 100 billion invest-
ment plan towards 2025 and updated its financial and
All ESG-related reports, policies and other documentation operational targets. The current 4.5 GW capacity target for
are published under ESG resources on the Company’s 2021 (excluding new hydro capacity) was reconfirmed and
website. a new target of 15 GW by the end of 2025 was announced.
The business plan is supported by Scatec’s track record
ESG Committee of strong growth and a solid project pipeline across solar,
In fourth quarter 2020, Scatec established an ESG wind, hydro and storage in high-growth markets globally.
Committee consisting of three Board members, elected for The 15 GW target implies 12 GW of new capacity, that will
a period of two years. require an estimated NOK 100 billion in investments, of
which NOK 15-20 billion will be funded by Scatec equity.
The purpose of the ESG Committee is to guide and Solid long term cash flows from operating power plants
support the Company’s work and commitment towards and margins from development and construction of new
Environmental, Social and Governance matters. For further plants are expected to fund a major part of Scatec’s equity
information about the ESG Committee, visit Board of investments.
Directors - Scatec
Bi-annual ESG reporting
From second quarter 2021, Scatec will start reporting on
a set of environmental, social and governance indicators
on a bi-annual basis. The reporting will cover results and
performance across material ESG topics.8 First quarter 2021
Consolidated statement of profit and loss
Profit and loss Net financial items
Q1 Q4 Q1 FY Q1 Q4 Q1 FY
NOK million 2021 2020 2020 2020 NOK million 2021 2020 2020 2020
Revenues 693 688 630 2,771 Financial income 22 18 12 57
Net income/(loss) from JVs and Financial expenses -357 -363 -250 -1,189
associated 138 -8 -5 -16 Foreign exchange gains/(loss) -9 -480 320 -398
EBITDA 631 448 503 2,069 Net financial items -344 -825 82 -1,530
Operating profit (EBIT) 444 244 328 1,292
Net financial items -344 -825 82 -1,530
Profit before income tax 100 -581 410 -238
Financial expenses in the first quarter mainly consist of
Profit/(loss) for the period 42 -561 299 -368 interest expenses, which comprise of primarily interest
Profit/(loss) to Scatec 18 -558 235 -478 on non-recourse financing of NOK 242 million (209), and
Profit/(loss) to non-controlling corporate funding of NOK 82 million (17). See note 4 and 5
interests 24 -3 64 110 for further information on financing.
Revenues The quarter’s net foreign currency loss decreased from
Revenues from power sales were up 10% compared to NOK 320 million in the first quarter of 2020 to NOK -9 mil-
the same quarter last year. The increase in revenues lion in the first quarter of 2021. The change is primarily
is explained by the commercial operation of new solar explained by change of functional currency in Scatec ASA
parks at Upington (South Africa), Boguslav (Ukraine) and from NOK to USD from 1 January 2021, which has reduced
Kamianka (Ukraine), and the acquisition of the Dam Nai the currency exposure of Scatec ASA’s shareholder loans
Wind power plant in Vietnam. to project companies which are provided in the respective
projects’ currencies.
The increase in net income from joint venture investments
and associated companies was NOK 143 million compared Profit before tax and net profit
to same quarter last year. The increase relates to the share The Group recognised a tax expense of NOK 59 million (111)
of net income from the joint ventures in Philippines (50% in the first quarter, corresponding to an effective tax rate of
ownership), Laos (20% ownership) and Uganda (28.3% own- 59% (27%). The difference between the actual tax expense
ership), all part of the SN Power acquisition. Net income for for the quarter and a calculated tax expense based on
February and March 2021 from the joint ventures acquired the Norwegian tax rate of 22% is primarily explained by
are included in the consolidated figures for the first quarter withholding taxes paid on dividends received from sub-
2021. See note 9 for further description and break-down sidiaries in addition to currency effects in countries with
per country. a tax reporting currency that deviates from the functional
currency. For further details, refer to note 6.
Operating profit
Following the enlarged portfolio from the acquisition of Non-controlling interests (NCI) represent financial investors
SN Power, the EBITDA increased 26% compared to the in the power plants. The allocation of profits between NCI
same quarter last year. The growth in operating expenses and Scatec is impacted by the fact that NCI only have
compared to first quarter last year is also explained by the shareholdings in the power plants, while Scatec also
increased asset base in operation. carries the cost of project development, construction,
operation & maintenance and corporate functions.
Consolidated operating expenses amounted to
NOK 200 million (123) in the first quarter. This consists Impact of foreign currency movements
of approximately NOK 119 million (72) for operation of in the quarter
existing power plants, NOK 46 million (22) for early stage During the first quarter of 2021 NOK appreciated against
development of new projects, NOK 11 million (8) related to all relevant currencies compared to the average rates
construction and NOK 23 million (21) of corporate expenses for the forth quarter of 2020. On a net basis this nega-
(excluding eliminated intersegment charges). tively affected consolidated revenues by approximately
NOK 25 million, while the net impact on net profit in the
quarter was negative NOK 2 million.Scatec ASA 9
Following the movements in currencies in the first quarter, Scatec has not hedged the currency exposure on the
the Group has recognised a foreign currency translation expected cash distributions from the power plant
loss of NOK 64 million (343) in other comprehensive companies.
income related to the conversion of the subsidiaries’ state-
ments of financial position from the respective functional
currencies to the Group’s reporting currency.
Consolidated statement of financial position
Assets Equity and liabilities
NOK million Q1 2021 Q4 2020 NOK million Q1 2021 Q4 2020
Property, plant and equipment 16,316 16,086 Equity 9,637 9,467
Investments in JVs and Non-current non-recourse project
associated companies 9,750 612 financing 10,533 11,350
Other non-current assets 1,118 891 Corporate financing 7,114 -
Total non-current assets 27,184 17,590 Other non-current liabilities 2,112 2,351
Other current assets 1,586 1,286 Total non-current liabilities 19,760 13,701
Cash and cash equivalents 4,783 7,788 Corporate financing - 748
Total current assets 6,369 9,074 Current non-recourse project
Total assets 33,553 26,663 financing 1,880 913
Other current liabilities 2,276 1,834
Total current liabilities 4,156 3,495
The 54% net increase of non-current assets in the first Total liabilities 23,916 17,196
quarter is mainly driven by the acquisition of SN Power and Total equity and liabilities 33,553 26,663
increase in investments in joint ventures and associated Book equity ratio 28.7% 35.5%
companies. See note 9 for an overview of investments
in joint ventures and associated companies and split per Total equity increased by NOK 170 million compared
country. to fourth quarter 2020, driven by the profit and other
comprehensive income in the period. The decreased
Other current assets increased by 23% compared to fourth book equity ratio is explained by the effect above, offset
quarter 2020, mainly driven by working capital changes by increased total balance sheet value related to the
related to construction projects. The cash balance has acquisition of SN Power. The net increase in current and
decreased with NOK 3,005 million since fourth quarter non-current non-recourse project finance debt of NOK
2020, primarily following the acquisition of SN Power. In 150 million from the fourth quarter 2020 is mainly related
addition, the Group had NOK 1,580 million in available to the SN Power acquisition and the fully consolidated
undrawn credit facilities at the end of the first quarter. entity Dam Nai Wind. In addition has NOK 921 million of the
See note 5 for a detailed breakdown of cash balances as non-current non-recourse debt in Ukraine been presented
well as an overview of movement of cash at the Recourse as current in the statement of financial postition since the
Group level. projects failed to meet certain loan covenants measured at
the end of the quarter. Refer to note 4 for further details.
In the consolidated statement of financial position, the
power plant assets are valued at the Group’s cost, reflect- The NOK 6,366 million increase in corporate financing from
ing elimination of gross margins generated through the the fourth quarter 2020 mainly relates to financing of the
project development and construction phase. At the same acquisition of SN Power which, at closing date of the ac-
time, the ring-fenced non-recourse debt held in power quisition, comprised of a USD 400 million bridge to bond
plant assets is consolidated at full value, which reduce the facility, a USD 150 million Green Term Loan and a USD
consolidated book equity ratio. 200 million Vendor Financing. Subsequently in the quarter,
Scatec successfully completed a EUR 250 million senior
unsecured green bond issue with maturity in August 2025.10 First quarter 2021
Proceeds from the bond issue were used for repayment NOK 397 million that stems from debt refinancing of assets
of USD 207 million of the bridge to bond facility, redemp- in the Philippines. The refinancing is part of a long-term
tion of the NOK 750 million senior unsecured green bond financing strategy for the Philippines that secures an
issued in 2017, and other eligible activities as set out in attractive average leverage, and was successfully con-
Scatec’s Green Financing Framework. See note 5 for fur- cluded in the local banking market at favorable terms.
ther details
The cash flow to equity in Services is stable compared to
same quarter last year.
Consolidated cash flow
The cash flow to equity in the D&C segment is impacted by
Net cash flow from consolidated operating activities low construction activtiy and limited revenues.
amounted to NOK 239 million (729) in the first quarter of
2021, compared to the EBITDA of NOK 631 million. The dif- The cash flow to equity for the Corporate segment primar-
ference is primarily explained by changes in other current ily relates to operating expenses and interest expenses on
liabilities. corporate funding.
Net cash flow from consolidated investing activities was In the first quarter of 2021, the power plant companies
NOK -7,624 million (-723), driven by the acquisition of SN distributed a total of NOK 723 million to Scatec ASA.
Power.
Net cash flow from financing activities was NOK 4,386 Risk and forward-looking statements
million (213), driven primarily by the loan proceeds to fund
the transaction of SN Power. Scatec has extensive policies and procedures in place
as part of its operating system to actively manage risks
See also note 5 for a detailed cash overview. related to the various parts of the Company’s operations.
Key policies are reviewed and approved by the Board of
Directors annually. The regular follow up of these policies is
Proportionate cash flow to equity carried out by Scatec’s Management Team, Finance, Legal
and other relevant functions. For further information refer
Scatec’s “proportionate share of cash flow to equity” 1), is to the 2020 Annual Report (the Board of Directors’ report
an alternative performance measure that seeks to esti- and note 5).
mate the Group’s ability to generate funds for equity
investments in new power plant projects and/or for Forward-looking statements reflect current views about
shareholder dividends over time. future events and are, by their nature, subject to significant
risk and uncertainties because they relate to events and
Q1 Q4 Q1 FY
NOK million 2021 2020 2020 2020
depend on circumstances that will occur in the future.
Although Scatec believes that these assumptions were
reasonable when made, the Group cannot assure that the
Power Production 681 53 105 427
Services 14 8 13 65 future results, level of activity or performances will meet
Development & Construction -51 -27 13 -15 these expectations.
Corporate -72 -55 -24 -153
Total 571 -22 107 324
The cash flow to equity in the Power Production segment
have increased compared to the same quarter last year,
primarily explained by new power plants included following
the acquisition of SN Power. Cash flow to equity includes
1) See Alternative Performance Measures appendix for definition.Scatec ASA 11
Project overview
Q1 2021 Q4 2020
Capacity 1) Capacity
Project stage (MW) (MW)
In operation 3,035 1,574
Under construction 479 320
Project backlog 2)
641 670
Project pipeline 2)
11,098 9,790
Total 15,253 12,354
Total annual production and revenues from the 4,155 MW in operation, under construction and in backlog is expected
to reach about 11,700 GWh (on 100% basis) and NOK 9,700 million (on 100% basis) based on 10-25-year Power Purchase
Agreements (PPAs).
Projects under construction and backlog 1)
Project backlog is defined as projects with a secure off-take agreement and assessed to have more than 90% likelihood of
reaching financial close and subsequent realisation.
The table below shows the projects under construction and in backlog with details on capital expenditure and annual
production. For extensive information about the projects under construction and in backlog, refer to our website
www.scatec.com/asset-portfolio-overview/.
Annual Scatec
CAPEX production economic
Location Capacity (MW) Currency (100%, million) (100%, GWH) Debt leverage interest
Under construction
Ukraine portfolio 203 EUR 177 248 65% 100%
Sukkur, Pakistan 150 USD 100 300 75% 75%
Guanizuil, Argentina 117 USD 103 310 60% 50%
Torex Gold, Mexico ³⁾ 9 USD N/A N/A N/A 100%
Total under construction 479 NOK 4) 3,581 858 78%
Backlog
Tunisia 360 EUR 240 900 70% 55% 4)
Brazil 101 BRL 356 220 60% 40%
Ukraine 65 EUR 74 90 70% 65% 5)
Bangladesh 62 USD 68 85 70% 65% 5)
Mali 33 EUR 50 60 75% 64% 5)
Lesotho 20 ZAR 430 55 70% 48%
Total backlog 641 NOK 4)
4,751 1,410 55%
Total 1,120 NOK 4)
8,333 2,275 65%
1) Status per reporting date.
2) See Other Definitions for definition.
3) Lease contract through Release by Scatec, hence other project data N/A.
4) All exchange rates to NOK are as of 31 March 2021.
5) Expected economic interest at financial close of project.12 First quarter 2021
Under construction
Capacity
Tunisia, 360 MW
Project (MW) In December 2019, Scatec was awarded three solar power
plant projects in Tunisia totalling 360 MW. The three
Sukkur, Pakistan 150 projects will hold 20 years of PPAs with Société Tunisienne
Progressovka, Ukraine 148
de l’Electricité et du Gaz (STEG).
Guanizuil, Argentina 117
Chigirin, Ukraine 55
Scatec will be the lead equity investor in the projects.
Torex Gold, Mexico 9
Total 479 The company will also be the Engineering, Procurement
and Construction (EPC) provider and provide Operation &
Maintenance as well as Asset Management services to the
Scatec’s project portfolio under construction is close to
power plants.
completion. The Company maintains its estimate for power
plants under construction in Argentina and Ukraine to
San Pedro and Paulo (SPP), 101 MW
reach commercial operation dates in the second quarter
The SPP project is being developed in partnership with
2021. The 150 MW Sukkur project started construction in
Kroma Energia and Equinor, the same partners that
April 2021 with expected commercial operation in 2022.
realised the Apodi project. The project is located in Flores,
Pernambuco and financing will be provided by Banco
In Ukraine, the government adopted a new law in July 2020 do Nordeste (BNB). The project has secured off-take of
to revise the previous Feed-in Tariffs (FiTs). The new FiTs about 75% of energy generated with ANEEL and Engie. The
have not been accepted by Scatec or other IPPs and Scatec remaining energy will be contracted on short term con-
is in the process of assessing future actions related to the tracts in the market.
new FiTs.
Scatec will have a 40% ownership stake in the project.
8.5 MW lease agreement with Torex Gold (Release) The Engineering, Procurement and Construction (EPC) and
In April 2021, Release by Scatec entered into a lease Operation & Maintenance as well as Asset Management
agreement with mining company Torex Gold for a 8.5 MW service will be provided by Scatec and Equinor in
solar plant for two projects in Mexico. The initial contract partnership.
term is ten years with a possibility of extension and options
for buy-out starting after the expiry of year 3. The solar Lesotho, 20 MW
plant can at any time be expanded, including adding battery The “Neo 1” solar PV project will be Lesotho’s first pub-
storage and it can also be moved to a new location if lic-private, utility-scale solar plant. The project has a total
needed. The solar plant is estimated to be completed in estimated capex of ZAR 430 million and is owned by
fourth quarter 2021 subject to permitting approvals. Scatec, Norfund, One Power Lesotho, the Lesotho Pension
Fund and Izuba Energy.
Backlog Scatec will be the lead equity investor in the project and
also be the Engineering, Procurement and Construction
The 101 MW SPP project in Brazil and the 20 MW Lesotho (EPC) provider and provide Operation & Maintenance as
project has been included in backlog since the fourth well as Asset Management services to the power plant. The
quarter report, resulting in a project backlog of 641 MW. electricity will be sold to the Lesotho Electricity Company
(LEC) through a 25-year Power Purchase Agreement (PPA).
The COVID-19 situation is in general impacting the markets
where Scatec develops projects. There are still restrictions Other backlog
on movement and international travel continues to be very In addition to the above projects, Scatec’s backlog also
limited. This is expected to impact project development as includes) Ukraine (65 MW), Bangladesh (62 MW) and Mali
certain activities requires physical presence. The progress (33 MW). Additional information is available on
that can be made for projects in backlog and pipeline is www.scatec.com.
therefore impacted and delays in maturing some of these
projects are expected.Scatec ASA 13
Pipeline
Q1 2021 Q4 2020
Mendubim project. The MoU provides a framework to
Capacity Capacity 1) realise the project on a site already secured in Rio Grande
Location (MW) (MW)
do Norte in Brazil. The MoU contemplates joint ownership
Latin America 1,325 1,100 and development of the project by the three parties and
Africa and the Middle East 4,693 3,862 offtake of part of the production by Hydro.
Europe & Central/South Asia 1,330 1,280
Southeast Asia 3,750 3,548 Project opportunities in hydropower in Latin America are
Total pipeline 11,098 9,790 being evaluated and pursued mainly in Peru and Colombia.
In addition to the projects in backlog Scatec holds a solid Africa and the Middle East (4,693 MW)
pipeline of projects totaling 11,098 MW across several tech- In South Africa, Scatec holds solar and wind sites rep-
nologies. The pipeline has increased from 9,790 MW at the resenting more than 1.5 GW ready to be bid, and the
fourth quarter reporting to 11,098 MW at the first quarter Company is in the process of securing additional projects
reporting date. The increase in the pipeline is mainly com- for upcoming tenders rounds.
ing from new projects in Africa, Asia and the Middle East.
In fourth quarter 2020, Scatec submitted proposals in the
Solution Capacity (MW) Share in % Risk Mitigation Power Procurement Programme in South
Africa. Scatec is currently providing clarifications to the IPP
Solar 4,686 42% Office in South Africa regarding these proposals and are
Wind 1,870 17% expecting a decision in the near future.
Hydro 2,516 23%
Hybrid solutions 1,726 15% Further, the new integrated Resource Plan has been
Release 300 3%
launched and based on this, a new tender (“round 5”)
Total 11,098 100%
under the Risk Mitigation Independent Power Procurement
Programme Programme (REIPPP) for various renewable
Historically, about 50% of projects in pipeline have been technologies has been launched and the proposal submis-
realised. The pipeline projects are in different stages of sion date is in third quarter 2021.
development and maturity, but they are all typically in
markets with an established government framework for Scatec, together with local partners, have been awarded
renewables and for which project finance is available (from two solar projects, in total 525 MW, in a tender in Iraq, and
commercial banks or multilateral development banks). is currently in discussions with the authorities and lenders
The project sites and concessions have been secured and on the required contract structues to finance and con-
negotiations related power sales and other project imple- struct this capacity. The projects remains in our pipeline
mentation agreements are in various stages of completion. until this is further clarified.
Latin America (1,325 MW) Hydropower project development is undertaken in the
Scatec’s development efforts for solar in Latin America 51/49 joint venture between Scatec and Norfund. Efforts
is now mainly focused on Brazil, where Scatec has been are concentrated on the 153 MW Ruzizi project in Rwanda/
partnering with Equinor over the last few years. Selected DRC, the 120 MW Volobe project at Madagascar and devel-
opportunities are also being pursued in other markets. opment in Malawi.
Scatec has secured rights to a number of projects in Brazil
and is seeking to secure power purchase agreements In addition, Scatec is developing a broad pipeline of projects
through upcoming tenders and negotiations with corporate across several markets and technologies, including Egypt,
off-takers. Nigeria, Cameroon, Tunisia and several other countries on
the continent. Some of the projects are based on bi-lateral
In fourth quarter 2020, Scatec signed an MoU with Equinor negotiations with governments and state-owned utilities,
and Hydro for the solar development of the 530 MW while Scatec is also selectively participating in tenders.
1) Includes Hydropower pipeline after closing of SN Power acquisition.14 First quarter 2021
Through its Release concept, Scatec has increased its In Malaysia it is expected that the new government will
efforts in securing agreements with private companies, maintain the same level of ambition for the renewable
smaller state-owned utilities and Non-Governmental energy sector as before and there will be opportuni-
Organisations, like the UN. These are typically smaller ties within solar through both tenders and bilateral
projects in the range of 5 to 20 MW and Scatec is currently negotiations.
actively working on a portfolio of about 300 MW of this
type of projects on the African continent. Scatec is developing a range of projects in Vietnam, both
solar and wind. These are projects that fit well with the
Europe and Central/South Asia (1,330 MW) stated objectives of the authorities in terms of the future
Scatec is currently mainly pursuing solar project opportuni- implementation of renewable energy in the country.
ties in India and Poland.
In the Philippines, two major laws have incentivised growth
India is expected to be one of the countries with highest of renewables and the country now aims for 15.3 GW of
renewable energy growth globally in the coming years. renewables capacity by 2030. A feed-in tariff has spurred
Expected investment returns have improved over the over 1 GW of renewable energy installations, and it is
last couple of years and India is therefore becoming an expected that implementation of Renewable Portfolio
attractive renewables market. Scatec is working on several Standards will be fast-tracked. Scatec is working on
large project opportunities in the country. developing project opportunities across various renewable
technologies in the country.
Poland has ambitious targets for renewable energy. The
energy market is deregulated and renewable energy pro- Scatec is developing 227 MW of hybrid solutions and
jects are incentivized through auctions awarding contracts a Greenfield hydropower project in Joint Venture with
for difference and it is also possible to sell energy under its partner Aboitiz in the Philippines. Assessments are
PPAs to industrial companies. Scatec is working on a ongoing to expand the scope of project development in
portfolio of renewable energy projects in the country. the partnership to take further advantage of growth in
renewables.
The region represents a major potential for increase in
hydropower capacity supported by political development. Further hydropower acquisitions and greenfield opportuni-
The focus is on opportunities to acquire assets with poten- ties across the region are being evaluated and pursued as
tial to improve operational performance and Greenfield markets open up for IPPs and to take advantage of Scatec’s
projects in the central to western part of Asia and in India. presence within solar. Due to the political situation, the
development of the Middle Yeywa project in Myanmar is
Southeast Asia (3,750 MW) currently on hold.
Malaysia, Vietnam and the Philippines are markets Scatec
currently is focused on in Southeast Asia.Scatec ASA 15
Proportionate financials
Break down of Power Production segment
Key financials
Q1 2021
South Czech
Philippines Africa 1) Uganda Malaysia Egypt Laos Ukraine Republic Honduras Jordan Brazil Vietnam Other 2) Total
NOK million
Revenues 360 129 77 92 69 58 20 19 25 19 17 22 16 924
Cost of sales -79 - - - - - - - - - - - - -79
OPEX -37 -22 -5 -12 -12 -6 -4 -3 -4 -3 -4 -2 -27 -140
EBITDA 243 107 72 81 57 52 16 16 21 16 13 20 -11 704
EBITDA margin 68% 83% 94% 88% 83% 89% 80% 86% 85% 86% 78% 89% -67% 76%
Cash flow to equity 5403) 34 40 20 22 18 -11 3 13 3 2 7 -11 681
Scatec economic
interest 4) 50% 45% 28% 100% 51% 20% 91% 100% 51% 62% 44% 100% - -
Net production
(GWh) 168 119 109 90 114 128 15 3 21 14 32 30 11 854
1) Includes Kalkbult, Linde, Dreunberg and Upington projects
2) Includes Rwanda, Mozambique and Release
3) The amount includes NOK 397 million from a refinancing of the projects
4) The project companies in Philippines, Uganda, Laos and Brazil are equity consolidated in the in the groups financial statements
Q1 2020 3)
South Czech
Philippines Africa 1) Uganda Malaysia Egypt Laos Ukraine Republic Honduras Jordan Brazil Vietnam Other 2) Total
NOK million
Revenues - 103 - 95 73 - 9 23 31 20 21 - 17 391
Cost of sales - - - - - - - - - - - - - -
OPEX - -14 - -9 -10 - -2 -3 -4 -3 -5 - -11 -60
EBITDA - 88 - 86 62 - 7 20 27 17 16 - 6 331
EBITDA margin - 86% - 91% 86% - 79% 89% 88% 86% 76% - 37% 85%
Cash flow to equity - 29 - 28 20 - -1 6 17 2 4 - -1 105
Scatec economic
interest 4) - 45% - 100% 51% - 91% 100% 51% 62% 44% - - -
Net production
(GWh) - 73 - 81 109 - 6 4 23 13 30 - 10 349
1) Includes Kalkbult, Linde, Dreunberg and Upington projects
2) Includes Rwanda, Mozambique and Release
3) The acquisition of SN Power took place in January 2021, hence zero values for Philippines, Uganda, Laos and Vietnam in 2020
4) The project companies in Brazil are equity consolidated in the in the groups financial statements16 First quarter 2021
FY 2020 3)
South Czech
Philippines Africa 1) Uganda Malaysia Egypt Laos Ukraine Republic Honduras Jordan Brazil Vietnam Other 2) Total
NOK million
Revenues - 470 - 335 319 - 107 127 112 97 78 - 63 1,708
Cost of sales - - - - - - - - - - - - - -
OPEX - -76 - -40 -51 - -13 -12 -18 -14 -17 - -63 -304
EBITDA - 394 - 295 268 - 94 116 93 83 61 - - 1,404
EBITDA margin - 84% - 88% 84% - 88% 91% 83% 86% 78% - - 82%
Cash flow to
equity - 116 - 55 104 - 19 54 55 21 30 - -26 427
Scatec economic
interest 4) - 45% - 100% 51% - 91% 100% 51% 62% 44% - - -
Net production
(GWh) - 417 - 294 473 - 80 23 81 62 129 - 43 1,602
1) Includes Kalkbult, Linde, Dreunberg and Upington projects
2) Includes Rwanda, Mozambique and Release
3) The acquisition of SN Power took place in January 2021, hence zero values for Philippines, Uganda, Laos and Vietnam in 2020
4) The project companies in Brazil are equity consolidated in the in the groups financial statementsScatec ASA 17
Financial position and working capital breakdown
Proportionate financials
31 March 2021
Power plants in operation
South Czech
Philippines Africa 1) Uganda Malaysia Egypt Laos Ukraine Republic Honduras Jordan Brazil Vietnam Other 3) Total
NOK million
Project equity 1) 1,481 266 685 519 365 491 324 122 820 212 165 145 60 5,653
Total assets 4)
4,537 2,472 2,231 2,972 2,045 945 963 511 1,032 673 459 530 428 19,797
PP&E 2,116 2,142 1,990 2,826 1,758 800 822 425 923 527 420 433 355 15,535
Cash 335 229 175 343 200 87 23 31 38 127 9 41 46 1,683
Gross interest
bearing debt 2) 2,854 1,866 894 2,154 1,451 397 577 321 152 392 260 337 289 11,943
Net interest
bearing debt 2)
2,519 1,637 719 1,812 1,251 310 554 290 113 265 251 296 243 10,261
Net working
capital 2) -93 -111 40 -491 -93 -79 -487 -21 18 -62 -16 -6 -10 -1,411
Scatec economic
interest 50% 45% 28% 100% 51% 20% 73% 100% 51% 62% 44% 100%
Power plants under construction
Ukraine Argentina Total
NOK million
Project equity 1) 1,012 225 1,237
Total assets 4)
2,169 555 2,724
PP&E 1,937 535 2,471
Cash 13 3 15
Gross interest bearing debt 2)
286 308 594
Net interest bearing debt 2)
274 305 579
Net working capital 2) -896 -296 -1,192
Scatec economic interest 100% 50%
1) See Other definitions appendix for definition
2) See Alternative Performance Measures appendix for definition
3) Includes Rwanda, Mozambique and Release
4) The above asset figures does not include group adjustments of internal margins or group level PPA’s
Bridge from proportionate to consolidated financials
31 March 2021
Power Power Residual ownership Elimination of PP overhead, D&C,
plants under plants under interest for fully equity consolidated Services, Corporate,
NOK million operation construction consolidated entities entities 3) Eliminations Consolidated
Project equity 1) 5,653 1,237 1,240 -3,046 4,553 9,637
Total assets 19,797 2,724 6,607 1,023 3,401 33,553
PP&E-in power projects 15,535 2,471 5,617 -5,860 -1,839 15,925
Cash 1,683 15 674 -608 3,020 4,783
Gross interest bearing debt 2)
11,943 594 4,589 -4,713 7,114 19,527
Net interest bearing debt 2)
10,261 579 3,915 -4,105 4,094 14,744
Net-working capital 2) -1,411 -1,192 -479 444 190 -2,449
1) See Other definitions appendix for definition
2) See Alternative Performance Measures appendix for definition
3) Elimination of the project companies in Philippines, Uganda, Laos and Brazil, which are equity consolidated in the in the groups financial statements.18 First quarter 2021
Condensed interim financial information
Interim consolidated statement of profit or loss
NOK million Notes Q1 2021 Q1 2020 FY 2020
Revenues 2 693 630 2,771
Net income/(loss) from JVs and associated companies 9 138 -5 -16
Total revenues and other income 831 625 2,754
Personnel expenses 2 -82 -54 -262
Other operating expenses 2 -118 -69 -423
Depreciation, amortisation and impairment 2,3 -187 -175 -777
Operating profit (EBIT) 444 328 1,292
Interest and other financial income 4 22 12 57
Interest and other financial expenses 4 -357 -250 -1,189
Net foreign exchange gain/(losses) 4 -9 320 -398
Net financial expenses -344 82 -1,530
Profit/(loss) before income tax 100 410 -238
Income tax (expense)/benefit 6 -59 -111 -130
Profit/(loss) for the period 42 299 -368
Profit/(loss) attributable to:
Equity holders of the parent 18 235 -478
Non-controlling interests 24 64 110
Basic earnings per share (NOK) 1) 0.11 1.87 -3.51
Diluted earnings per share (NOK) 1) 0.11 1.82 -3.51
1) Based on average 158.9 million shares outstanding for the purpose of earnings per share and average 160.2 million shares outstanding for the purpose of
diluted earnings per shareScatec ASA 19 Interim consolidated statement of comprehensive income NOK million Notes Q1 2021 Q1 2020 FY 2020 Profit/(loss) for the period 42 299 -368 Other comprehensive income: Items that may subsequently be reclassified to profit or loss Net movement of cash flow hedges 308 -310 -376 Income tax effect 6 -74 74 98 Foreign currency translation differences -64 343 -116 Net other comprehensive income to be reclassified to profit or loss in subsequent periods 170 106 -394 Total comprehensive income for the period net of tax 212 405 -762 Attributable to: Equity holders of the parent 85 378 -698 Non-controlling interests 127 27 -65
20   First quarter 2021

     Interim consolidated statement of financial position

     NOK million                                    Notes   As of 31 March 2021   As of 31 December 2020

     Assets
     Non-current assets
     Deferred tax assets                                6                 646                       722
     Property, plant and equipment – power plants       3             15,925                    15,861
     Property, plant and equipment – other              3                 391                       225
     Goodwill                                           8                 239                        25
     Investments in JVs and associated companies        9               9,750                       612
     Other non-current assets                                             233                       144
     Total non-current assets                                         27,184                    17,590

     Current assets
     Trade and other receivables                                          691                       623
     Other current assets                                                 895                       663
     Cash and cash equivalents                          5               4,783                    7,788
     Total current assets                                               6,369                    9,074
     Total assets                                                     33,553                    26,663
Scatec ASA 21 Interim consolidated statement of financial position NOK million Notes As of 31 March 2021 As of 31 December 2020 Equity and liabilities Equity Share capital 4 4 Share premium 9,767 9,720 Total paid in capital 9,770 9,724 Retained earnings -691 -708 Other reserves -154 -221 Total other equity -844 -929 Non-controlling interests 712 673 Total equity 9,637 9,467 Non-current liabilities Deferred tax liabilities 6 248 205 Non-recourse project financing 4 10,533 11,350 Corporate financing 5 7,114 - Financial liabilities 279 572 Other non-current liabilities 1,585 1,575 Total non-current liabilities 19,760 13,701 Current liabilities Corporate financing 5 - 748 Trade and other payables 748 760 Income tax payable 6 104 90 Non-recourse project financing 4 1,880 913 Financial liabilities 122 131 Other current liabilities 1,302 852 Total current liabilities 4,156 3,495 Total liabilities 23,916 17,196 Total equity and liabilities 33,553 26,663 Oslo, 29 April 2021 The Board of Directors of Scatec ASA
22   First quarter 2021

     Interim consolidated statement of changes in equity

                                                                           Other reserves

                                                                           Foreign
                                         Share       Share   Retained     currency      Hedging              Non-controlling     Total
     NOK million                        capital   premium    earnings   translation    reserves      Total        interests     equity

     At 1 January 2020                       3      1,806      -134           128           -130   2,975               663     3,640
     Profit for the period                    -          -       235              -            -     235                 64      299
     Other comprehensive income               -          -          -         287           -144     143                -37      106
     Total comprehensive income               -          -       235          287           -144     378                 27      405
     Share-based payment                      -          3          -             -            -        3                  -        3
     Share capital increase                   -        26           -             -            -       26                  -       26
     Dividend distribution                    -          -          -             -            -         -            -110      -110
     Capital increase from NCI                -          -          -             -            -         -               95        95
     At 31 March 2020                        3      3,317        100          415           -274   3,382               677     4,059

     At 1 April 2020                         3      3,317        100          415           -274   3,382               677     4,059
     Profit for the period                    -          -     -713               -            -    -713                 46     -667
     Other comprehensive income               -          -        -1         -376            13     -363              -137      -500
     Total comprehensive income               -          -     -713          -376            13    -1,076               -92    -1,167
     Share-based payment                      -        11           -             -            -       11                  -       11
     Share capital increase                  1      6,717           -             -            -   6,718                   -   6,718
     Transaction cost, net after tax          -      -144           -             -            -    -144                   -    -144
     Share purchase program                   -        -1           -             -            -       -1                  -       -1
     Dividend distribution                    -          -     -131               -            -    -131                -38     -169
     Purchase of NCIs shares in group
     companies                                -          -        35              -            -       35                  -       35
     Capital increase from NCI                -          -          -             -            -         -             126       126
     At 31 December 2020                     4      9,720      -710             39          -261   8,796               674     9,468

     At 1 January 2021                       4      9,720      -710             39          -261   8,796               674     9,468
     Profit for the period                    -          -        18              -            -       18                24        42
     Other comprehensive income               -          -          -         -60           127        67              103       170
     Total comprehensive income               -          -        18          -60           127        85              127       212
     Share-based payment                      -          5          -             -            -        5                  -        5
     Share capital increase                   -        42           -             -            -       42                  -       42
     Dividend distribution                    -          -          -             -            -         -              -88       -88
     At 31 March 2021                        4      9,767      -691           -20           -134   8,927               712     9,637
Scatec ASA 23
Interim consolidated statement of cash flow
NOK million Notes Q1 2021 Q1 2020 FY 2020
Cash flow from operating activities
Profit before taxes 100 410 -238
Taxes paid 6 -15 -63 -214
Depreciation and impairment 3 187 175 777
Proceeds from disposal of fixed assets 3 3 - 26
Net income from JVs and associated companies 9 -138 5 16
Interest and other financial income 4 -22 -12 -57
Interest and other financial expenses 4 357 250 1,189
Unrealised foreign exchange (gain)/loss 4 9 -320 398
Increase/(decrease) in other assets and liabilities -242 285 -262
Net cash flow from operating activities 239 729 1,636
Cash flow from investing activities
Interest received 4 22 12 57
Consideration paid for SN Power, net of cash acquired 1) 8 -7,560 - -
Investments in property, plant and equipment 3 -149 -730 -1,774
Net investments in, and distributions from, JVs and associated companies 9 63 -5 12
Net cash flow from investing activities -7,624 -723 -1,704
Cash flow from financing activities
Net proceeds and repayment from non-controlling interests 2)
-34 105 159
Interest paid 4 -187 -108 -894
Proceeds from non-recourse project financing 42 45 135
Repayment of non-recourse project financing -118 -61 -678
Net proceeds from corporate financing 3)
5 4,729 315 -
Share capital increase 42 26 6,576
Dividends paid to equity holders of the parent company and non-controlling interests -88 -110 -279
Net cash flow from financing activities 4,386 213 5,020
Net increase/(decrease) in cash and cash equivalents -2,999 219 4,951
Effect of exchange rate changes on cash and cash equivalents -6 16 13
Cash and cash equivalents at beginning of the period 7,788 2,824 2,824
Cash and cash equivalents at end of the period 5 4,783 3,058 7,788
1) Consideration paid for SN Power comprise of payment made at the transaction date, excluding NOK 826 million of cash in acquired companies
2) Net proceeds from non-controlling interests include both equity contributions and shareholder loans
3) Net proceeds from corporate financing include proceeds from issuance of EUR 250 million green bond, USD 400 million bridge to bond facility and USD 150
green term loan, as well as redemption of NOK 750 million green bond and partial repayment of the USD 400 million bridge to bond facility. See note 5 Cash,
cash equivalents and corporate funding for further details.24 First quarter 2021
Notes to the condensed interim
consolidated financial statements
Note 1 Organisation and basis for preparation
Corporate information January 2021 the functional currency of Scatec ASA is
Scatec ASA is incorporated and domiciled in Norway. The determined to be US Dollars, being the currency which
address of its registered office is Askekroken 11, NO-0277 primarily affects the financials of the company. Up until
Oslo, Norway. Scatec ASA was established on 2 February 31 December 2020 the functional currency of Scatec ASA
2007. was Norwegian kroner (NOK). The presentation currency
of the Group is Norwegian kroner (NOK). All amounts are
Scatec ASA (“the Company”), its subsidiaries and invest- presented in NOK million unless otherwise stated.
ments in associated companies (“the Group” or “Scatec”) is
a leading renewable power producer, delivering affordable As a result of rounding adjustments, the figures in some
and clean energy worldwide. As a long- term player, Scatec columns may not add up to the total of that column.
develops, builds and operates renewable power plants and
integrates technologies. Significant estimates and judgements
The preparation of condensed interim consolidated
The condensed interim consolidated financial statements financial statements in conformity with IFRS requires
for the first quarter 2021 were authorised by the Board of management to make judgements, estimates and assump-
Directors for issue on 29 April 2021. tions that affect the application of policies and reported
amounts of assets and liabilities, income and expenses.
Basis of preparation
These condensed interim consolidated financial state- Judgements
ments are prepared in accordance with recognition, In the process of applying the Group’s accounting policies,
measurement and presentation principles consistent with management make judgements of which the following
International Financing Reporting Standards as adopted have the most significant effect on the amounts recog-
by the European Union (“IFRS”) for interim reporting under nised in the condensed interim financial statements.
International Accounting Standard (“IAS”) 34 Interim
Financial Reporting. These condensed interim consolidated Consolidation of power plant companies
financial statements are unaudited. Scatec’s value chain comprises all downstream activities
such as project development, financing, construction and
These condensed interim consolidated financial statements operations, as well as having an asset management role
are condensed and do not include all of the information through ownership of the power plants. Normally Scatec
and notes required by IFRS for a complete set of con- enters into partnerships for the shareholding of the power
solidated financial statements. These condensed interim plant companies owning the power plants. To be able to
consolidated financial statements should be read in con- utilise the business model fully, Scatec normally seeks to
junction with the annual consolidated financial statements. obtain operational control of the power plant companies.
Operational control is obtained through governing bodies,
The accounting policies adopted in the preparation of the shareholder agreements and other contractual arrange-
condensed interim consolidated financial statements are ments. Other contractual arrangements may include
consistent with those followed in the preparation of the Scatec’s role as the developer of the project, EPC provider
Group’s annual consolidated financial statements for 2020. (construction), operation and maintenance service provider
and asset management service provider.
The functional currency of the companies in the Group is
determined based on the nature of the primary economic When assessing whether Scatec controls a power plant
environment in which each company operates. From 1 company as defined by IFRS 10 Consolidated FinancialScatec ASA 25
Statements, the Group’s roles and activities are analysed in were transferred to Scatec ASA and 29 January 2021 serves
line with the requirements and definitions in IFRS 10. as the transaction date under IFRS from which SN Power
has been included in the consolidated figures for of the
Refer to note 3 of the 2020 annual report for further group.
information on judgements, including control assessments
made in previous years. Estimates and assumptions
The estimates and underlying assumptions are reviewed
Acquisition of SN Power on an ongoing basis, considering the current and expected
Scatec ASA acquired 100% of the shares of SN Power future market conditions. Changes in accounting esti-
AS on 29 January 2021. SN Power AS was acquired from mates are recognised in the period in which the estimate
Norfund for a total consideration of USD 1,200 million (NOK is revised if the revision affects only that period or in the
10,371 million). See note 8 Business combination for further period of the revision and future periods if the revision
information about the acquisition and the fair value of affects both current and future periods.
the identifiable assets and liabilities of SN Power and the
purchase price allocation. Seasonality in operations
Interim period results are not necessarily indicative of
Completion of the acquisition as defined in the Share results of operations or cash flows for an annual period.
Purchase Agreement (SPA) was made on 29 January 2021. The Group’s operating results are impacted by external fac-
At completion the control and legal ownership of SN Power tors, such as seasonal variations and weather conditions.
Note 2 Operating segments
Operating segments align with internal management is transferred to Scatec from 1 January 2021. Consequently
reporting to the Group’s chief operating decision maker, SN Power is included in the proportionate segment
defined as the Group management team. The operating financials from 1 January 2021. In the Group consolidated
segments are determined based on differences in the IFRS financials the date of inclusion is 29 January 2021,
nature of their operations, products and services. which is the date of completion when Scatec obtained
control over the project companies as defined by IFRS. A
Scatec manages its operations in three segments; Power full reconciliation between the proportionate and the IFRS
Production (PP), Services and Development & Construction financials including the effect of January 2021 is provided
(D&C). in the tables below.
From January 2021 the group has incorporated the hydro Power Production
and wind producing assets in the Power Production The Power Production segment manages the Group’s
segment, other activities related to the development, power producing assets and derives its revenue from the
construction and operations of the wind and hydro plants production and sale of solar, wind and hydro generated
are incorporated in the different segments according to its electricity. The electricity is primarily sold on long-term
nature, as defined below. Power Purchase Agreements or feed-in-tariffs except for
in the Philippines where the electricity is sold on bilateral
The management team assesses the performance of the contracts and the spot market. Finance and operation of
operating segments based on a measure of gross profit the plants is ring-fenced in power plant companies with
and operating profit; hence interest income/expense is not a non-recourse finance structure. This implies that the
disclosed per segment. project debt is only secured and serviced by project assets
and the cash flows generated by the project, and that there
The acquisition of SN Power from January 2021 is struc- is no obligation for project equity investors to contribute
tured so that the economic risk of the acquired companies additional funding in the event of a default. Free cash flowsYou can also read