The Bathroom of the Future - Prospects for Information and Control PREPARED FOR: GWA Bathrooms and Kitchens Group, October 2018 - Caroma Specify
←
→
Page content transcription
If your browser does not render page correctly, please read the page content below
Institute for
Sustainable Futures
Isf.uts.edu.au
                                    The Bathroom
                                    of the Future
                                    - Prospects for Information and Control

                                    PREPARED FOR: GWA Bathrooms and Kitchens
                                    Group, October 2018
       The Bathroom of the Future                                   UTS-ISF 1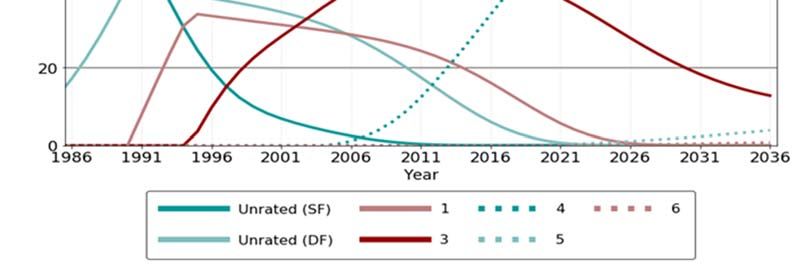
About the authors
The Institute for Sustainable Futures (ISF) is an interdisciplinary research and consulting organisation
at the University of Technology Sydney. ISF has been setting global benchmarks since 1997 in helping
governments, organisations, businesses and communities achieve change towards sustainable
futures.
We utilise a unique combination of skills and perspectives to offer long term sustainable solutions that
protect and enhance the environment, human wellbeing and social equity.
For further information visit: www.isf.uts.edu.au

Research team                                        Citation
Dr Rachel Watson                                     Please cite as:
Jay Falletta                                         Watson R, Mukheibir P Falletta J & Fane S (2018).The
                                                     Bathroom of the Future – Prospects for Information and
A/Prof Pierre Mukheibir
                                                     Control, prepared by the Institute for Sustainable
A/Prof Simon Fane                                    Futures (UTS) for the GWA Bathrooms and Kitchens
                                                     Group.

                  Institute for Sustainable Futures
                  University  of Technology  Sydney
                  PO Box 123 Broadway, NSW, 2007
                  www.isf.edu.au

Disclaimer The authors have used all due care and skill to ensure the material
is accurate as at the date of this report, however, UTS and the authors do not
accept any responsibility for any losses that may arise by anyone relying upon
its contents. In particular, tariff rates and regimes may vary significantly from
those used in this work and have a significant effect on the results.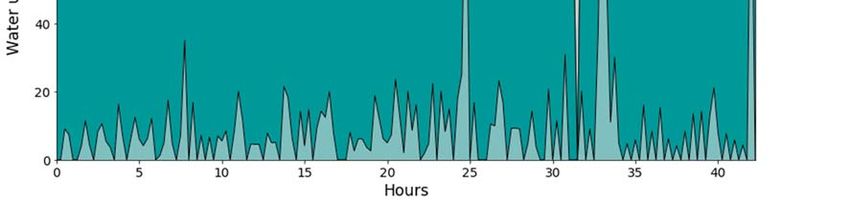
Executive Summary
Across sectors, innovative data collection at a device level and command and control appliances,
are providing an opportunity for improved resource efficiencies, facilities management and user
experiences. The applications of intelligent technologies and localised networks are growing
rapidly. Based on this review of the potential
benefits of digital bathroom fixtures, the
information collected at the fixture point and its
subsequent analysis could reveal useful insights
into fixture operations and user behaviour. This
information has possibilities to inform planning
and operations at multiple scales, from the
actual fixture and bathroom, through to
buildings, precincts and whole cities.
Water efficiency in Australia advanced rapidly during the Millennium drought in the 2000’s, and
was further supported with the introduction of mandatory appliance efficiency labelling in 2006.
More recently, data from digital metering has been used to evaluate the savings of demand
management programs and alternative supply programs. The use of intelligent metering (IM)
for end use analysis purposes reflects a growing interest in improving water efficiency at the
level of each water using product or technology.
In the short term, key benefits to be realised from bathroom fixture information would include
water efficiencies through the faster detection and repair of problems and improved facilities
management. This may include, water loss and breakages, usage patterns to inform cleaning,
pressure management, and energy savings through hot water optimisation. Due to the direct
link between water and energy consumption, in particular hot water use, the ability to adapt
and control temperatures and change behaviour in relation to hot water provides considerable
potential to improve both environmental outcomes and financial savings.
Projecting into the future, the collection of data and the control of appliances could provide
benefits well beyond water efficiency or improved facilities management at a building scale. The
ability to monitor and influence behaviour (through feedback mechanisms) could provide
benefits in a range of specialist applications, such as the health sector, peak demand for
bathroom facilities, and behaviour change towards to improve general hygiene. Nudge
applications to influence hand‐washing behaviour for example, or toilet occupancy linked with
signage in event venues have significant potential.
In relation to planning at a precinct scale, the collection of real‐time end‐use data for the non‐
residential sector and mixed‐use buildings will allow for better planning outcomes at precinct
and wider city scales.
For the full potential of digital fixtures to be realised will require protocols and resources to
manage the way data is collected, stored, transmitted, analysed and integrated with other
applications and data sets through the internet of things (IoT).

The Bathroom of the Future                                                              UTS-ISF 1
Contents
1      Introduction                                                               3

2      The drive for efficiency: efficient fixtures and behaviour change          4
2.1    Development of efficient fixtures                                          5
2.2    The evolution of digital era and intelligent water metering                8
2.3    End-Use Analysis and Efficiency                                            9
2.4    Customer and user feedback                                                10
2.5    Pricing Reform                                                            10
2.6    Network Efficiency: Leak Management, Illegal Use and Asset Management     11
2.7    Precinct planning and management                                          11

3      Going beyond water efficiency                                             12
3.1    Building management                                                       12
3.2    Intelligent buildings and the internet of things                          13
3.3    Health and wellbeing                                                      13
3.4    Energy Savings                                                            14

4      What bathroom data could reveal                                           15

5      Information collection and appliance control across scales                18

6      Conclusions                                                               20

7      References                                                                21

The Bathroom of the Future                                                 UTS-ISF 2
1 Introduction
Since the development of the original dual flush toilet in the early 1980s, rapid advancements in
water metering, efficient fixtures and fittings, in conjunction with regulation and education,
have revolutionised the way water is used within buildings in Australia. In Sydney for example,
we saw the average demand for water per capita fall from 500 L/p/d in the 1990 to 425 L/p/d in
2003 (Sydney Water 2017). Increased focus on water demand driven by the Millennium drought
resulted in a step change reduction in water demand in most urban centres across Australia.
Changes in standards and regulations, including the Water Efficiency Labelling and Standards
(WELS) scheme, during the drought and a broad range of incentivised demand management and
education programs accelerated the uptake of efficient fixtures. In Sydney there was a 20%
reduction in total demand in 2008 from its peak in 2002. In the decade since, water demand has
held steady at around this level despite the increase in population. This was achieved through a
combination of behaviour change, efficient appliance purchases, higher prices for water,
recycled water usage, and improved leakage management (Sydney Water 2017). Through
voluntary rating schemes such as the Green Building Council of Australia’s Green Star, water
efficiency in the commercial sector has also seen substantial gains (https://new.gbca.org.au).
While these savings enable existing urban water networks to support larger populations, the
ongoing challenges of climate change and increasing climate variability, rapid urban growth and
sustainability drive the need for continual advancement. Future strategies to reduce water
demand will require accurate and reliable data that can be meaningfully interpreted to enable
utilities and building operators improve customer services, reduce water losses and manage
demand (Fane et al 2018). The collection of relevant data, its timely and comprehensible
interpretation and communication to end‐users, operators and planners have become key focus
areas in recent times.
It is this history of plumbing product innovation and a familiarity with digital metering, together
with the push for sustainable urban water management, which primes Australia for the next
generation of fixture‐driven water efficiency. Technology providing more frequent, higher
resolution and remotely accessible data generation allows both data‐driven change and
intelligent control. This paper discusses recent trends in water efficiency and metering and
considers this in the context of developments in other sectors, particularly with the rise of the
digital era.
The Institute for Sustainable Futures (ISF) at the University of Technology Sydney has developed
this discussion paper to demonstrate the value and potential applications of smart water
management technologies specifically focused on commercial bathroom products. The work
was commissioned by the GWA Bathrooms and Kitchens Group. The paper has been developed
using available knowledge, with a literature scan of fixture driven innovations, innovations in
collecting and using data from fixtures and other monitoring devices. Preliminary data provided
by GWA from digital fixtures installed in a commercial application were reviewed by ISF to reveal
trends and insights, and to envisage the way future bathrooms could leverage data and thereby
control functions to create efficiencies well beyond that of water savings.

The Bathroom of the Future                                                               UTS-ISF 3
2 The drive for efficiency: efficient
  fixtures and behaviour change
Government and utility driven water efficiency initiatives in Australia
advanced rapidly during the Millennium drought of the 2000s, both in terms
of the breadth of end uses and sectors and the scale of programs. Across
Australia, many of the key end uses in the residential sector (i.e. showers,
toilets, and clothes washers), a significant proportion of non‐residential
sectors (i.e. commercial, institutional and industrial), as well as particular
sub‐sectors (i.e. schools) have all been targeted for the water efficiency
programs (Liu et al 2017). As a result, large‐scale roll out of low cost
efficiency programs focused on hardware modifications for demand
management (such as showerhead exchange programs) now have limited impact due to
saturation of the market.
The focus of these Government and utility programs has been on efficient products and
technologies (which is critical to reducing water consumption); several studies have pointed out
that as the increasing efficiency of fixtures and appliances approaches maximum limits.
Traditional, large‐scale hardware‐focused demand management programs are seen to have
limited further potential. A focus on behaviour and duration of use is therefore likely to yield
greater efficiencies than a focus on hardware alone (Kenway et al 2016). In concert, highly
targeted programs designed for specific customer groups are seen as the ‘next generation’ for
demand programs (Fane et al 2018). Fixtures that are efficient and can also provide both data
and control to help manage and drive efficient behaviour (i.e. the duration of use) will lead to
further efficient water usage (Liu & Mukheibir 2018). Likewise, usage data collection enables
precise targeting of programs.
Examples of the efficiency potential gained from combinations of fixture modifications and
behaviour change has been demonstrated in smart lighting and smart irrigation. Sensor driven
lights can be programmed to provide light only to areas that are being used, or dim lights based
on ambient light levels. This can save energy in the range of 17‐60% over conventional lighting
systems (Chew et al 2017). Similarly, smart irrigation practices, integrating other weather data
such as soil moisture and evapotranspiration, have increased the efficiency and effectiveness of
irrigation in a variety of different climate and irrigation contexts (Haley and Dukes 2012, Vick et
al 2016).
In the private sector, Green Star certification by the Green Buildings Council of Australia in 2002
helped to drive improvements in resource efficiency for commercial building owners, including
for water. Green star buildings reportedly use 51% less potable water than minimum industry
standards (https://new.gbca.org.au/green‐star). This was soon followed by the expansion of the
Australian Building Greenhouse Rating (ABGR) to NABERS in 2004 to include energy, water,
waste and indoor environment quality, which further motivated building owners and operators
to install innovative and efficient appliances. Improved monitoring and data would allow
building owners and operators to make informed decisions on how to maintain or improve their
NABERS rating. Such data would also potentially support the proof required for the rating.

The Bathroom of the Future                                                               UTS-ISF 4
2.1        Development of efficient fixtures
The Commonwealth WELS Act was introduced in 2005 to drive the uptake of water efficient
fixtures and appliances in Australia. The WELS scheme provides information to purchasers on
water use of products using a system of mandatory labelling; all products cover by the scheme
must display their water use and a star rating to indicate their level of water efficiency. The
scheme requires all WELS products to be registered and labelled before they are sold in Australia
(source: www.waterrating.gov.au). WELS also mandates minimum standards for toilet and
clothes‐washing machines. This scheme has led to a high penetration of efficient toilets and
showers in residential and non‐residential buildings. Figure 1 shows the modelled water savings
in Australia due to WELS (Fyfe et al 2015) growing to over 200 GL (billion litres) per year in 2030.

                               Table 1: Timeline of efficiency events
 Date         Details
 1981         Caroma released first dual flush system released 11 litres / 5.5 litres on half flush.
 1988         National Water Conservation Rating and Labelling Scheme - voluntary scheme
              was established and administered by Melbourne Metropolitan Board of Works
              before being taken over by Sydney Water.
 1993         AS 3500 which specified the maximum allowable water use per flush for toilets.
              Caroma redesigned their toilet to 6 and 3 litres.
 1998         Launch of Australian Building Greenhouse Rating (ABGR) focused on energy
 1999         National Water Conservation Rating and Labelling Scheme taken over by Water
              Services Association of Australia (WSAA).
 2002         Green Building Council of Australia (GBCA) established
 2003         Green Star certification launched by GBCA
 2004         ABGR renamed as the National Australian Built Environment Rating System
              (NABERS) to expand its reach beyond energy, to water, waste and indoor
              environment quality.
 2005         Water Efficiency Labelling and Standards Act 2005
              Caroma 4.5 litre full flush / 3 litre half flush toilets enter the market
 2006         On 1 July 2006 it became mandatory for urinals taps toilets and washing
              machines to carry WELS rating label.
 2007         The first 5 star WELS rated toilets and urinals are registered
 2008         The first 5 star WELS rated dishwashers are registered
 2011         Setting of minimum standard for clothes washing machines in WELS
              6 star urinals become available.
 2013         6 star dishwashers become available.
 2016         New 4-star ratings for showers (lower flow rates than 3-star showers but need to
              pass spray force and coverage tests) in WELS.
              0.5 L flow rate reduction for 5-star urinals in WELS
              6 star toilets become available

The Bathroom of the Future                                                                  UTS-ISF 5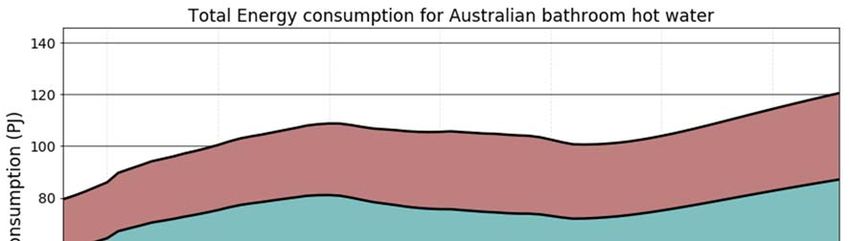
Figure 1: Water savings due to WELS rated fixtures and appliances (Fyfe et al 2015)

Efficient toilets:
The first dual flush toilets where introduced by Caroma in 1981. Replacing 12 litre single flush,
these initial dual flush model where 11 litres, with 5.5 litres on the half flush. Since then
improved dual flush toilet classes have been introduced over time (see Figure 2), with Caroma’s
4.5 litre full flush / 3 litre half flush toilets entering the market in 2005. Efficient four WELS star
toilets are now becoming the dominant stock in Australian houses and building.

         Figure 2: Stock of toilets models in Australia by star WELS band (ISF iSDP model)

Since the 1980s dual flush toilets have seen the demand for water due to flushing reduce
substantially. Figure 3 shows that over time the total demand due to toilet flushing in Australia
has declined despite a significant increase in population. After a peak in the early 1990’s, total
water use dropped to current level and then gradually increased with the projected population

The Bathroom of the Future                                                                  UTS-ISF 6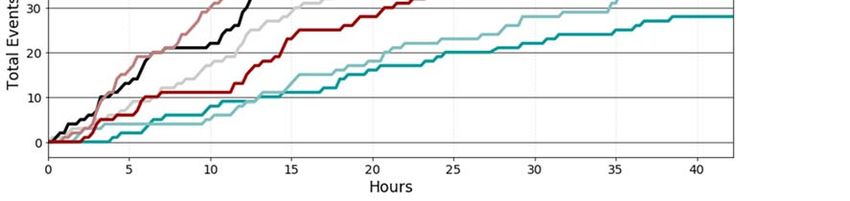
growth trend (ISF iSDP model). The current savings across Australia are estimated at 270 billion
litres per year, the equivalent of three times the capacity of the Sydney desalination plant.

  Figure 3: Water consumption in toilets in Australia with and without dual flush (ISF iSDP model)

Efficient showerheads:
Similarly, the introduction of more efficient showerheads into homes, coupled with water
conservation information on shower durations, led to reduced volumes of water being used per
shower in studied examples – as illustrated in Figure 4 by the results of the Willis et al (2010)
study of retrofits in South East Queensland.

                             Figure 4: Shift in shower volumes (Willis et al 2010)

The Bathroom of the Future                                                               UTS-ISF 7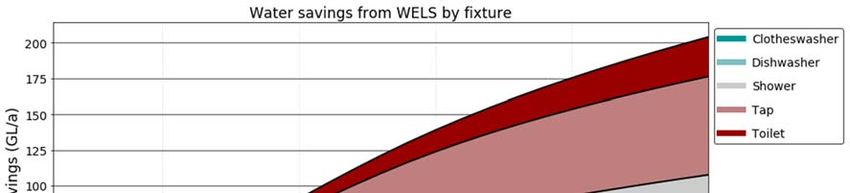
2.2        The evolution of digital era and intelligent water metering
Developments in intelligent water metering technology have evolved to a large extent from the
energy sector, where smart electricity and gas meters and communications infrastructure have
been more widely introduced. From an operational and planning perspective, water utilities
have used Supervisory Control and Data Acquisition (SCADA) systems to monitor network flow
and pressure, record and analyse the data, remotely control pumps and valves, schedule
maintenance and plan future infrastructure augmentations (Boyle et al 2013).

Water utilities are increasingly considering intelligent metering (IM) as a way to enhance water
supply security, minimise waste and control costs (e.g., through reduced labour costs for meter
reading) as well as transform the customer‐utility relationship (Liu & Mukheibir 2018). Within
the distribution network, flow and pressure data acquired from IM can be used to balance high
demands (and the resultant low pressures) across the network. This data is useful both
operationally and for longer term planning to identify areas in the network where there are
higher flows, or where there are low pressures during peak demand.

The above advancements have not involved the end user in any way, except for gradual
development in the deployment and use of customer flow registration meters. The main drivers
for introducing IM were the need to recover costs directly from the customer, to cut out an
intermediary body and to ring‐fence the financial operations from other local government
activities. In Australia, multi‐residential blocks generally have a single water meter which
captures aggregate usage across all apartments. Sub‐metering for individual units/apartments
is on the rise however, bolstered by the recent introduction of legislative requirements in some
Australian states. For example, sub‐metering is now compulsory for all new residential multi‐
unit developments in Queensland (DIP 2008), and in New South Wales, the Residential Tenancies
Act 2010 allows landlords to charge tenants for water usage on sub‐metered units.

Since the 2000s, utilities have become interested in demand side management and water
efficiency in an attempt to delay expensive capital investments for supply options and to
suppress demand during drought periods (White & Fane 2002). Mirroring the electricity
industry, where “least cost planning” and “integrated resource planning” were developed to
compare energy conservation to increased supply, so too have these principles been emerging
as priorities and are now widely applied to planning for urban water supplies (Turner et al 2010).

The current drivers for IM in the water sector are illustrated in Figure 5, and include:
   1. Improve end‐use analysis and end‐use efficiency
   2. Improve feedback and/or customer service and stimulate behaviour change
   3. Implement pricing reform to manage peak demand (and associated behavioural
        response)
   4. Improve network efficiency (leaks, pressure, illegal use and non‐revenue water)
   5. Enable remote accessibility

The Bathroom of the Future                                                              UTS-ISF 8
Figure 5: Drivers for intelligent metering (Boyle et al 2013) 2.3 End-Use Analysis and Efficiency Use of IM for end use analysis purposes reflects a growing interest in improving water efficiency at the level of each water using product or technology. Over the last decade, IM data has been used to evaluate the savings of demand management programs (Giurco et al 2008) and alternative supply programs such as the performance of rainwater tanks (Umapathi et al 2012). Studying fixture and appliance efficiencies and “water use behaviours” is core to the end use based demand forecasting used by most Australian water utilities (Turner et al 2010). It is also critical for evaluation of water savings as water use patterns change over time with demographic shifts and the introduction of new technologies. By capturing high resolution data from individually metered households and network zone meters, utilities have gained an understanding of daily and seasonal residential consumption patterns that are necessary for planning their supply systems. As is the case in the energy sector, residential consumption patterns have historically garnered most interest (McKenna et al 2014), and little research has been done to understand the water end‐use patterns in commercial buildings. The absence of this data signifies a real gap in the knowledge required for optimising operational processes and planning for network improvements (Beal et al 2014). The data is also critical for integrated resource planning of urban water supply systems, which benefits from end‐use modelling for demand forecasting and the design, implementation and refinement of demand management programs. In addition to strategy planning purposes, this data also provides the opportunity for a utility to reduce its operational costs through asset management efficiency and upgrade deferrals. The Bathroom of the Future UTS-ISF 9
2.4        Customer and user feedback
Empowering customers and users with information about their consumption patterns and uses
will allow them to make informed decisions about how they use water in future. By providing
more information about water use, which can then be converted into more meaningful
information for the user/customer, IM presents an opportunity to improve water literacy within
the community. It also empowers users to develop a greater understanding of their
consumption (Liu & Mukheibir 2018). For instance, rather than estimated (average) daily use based
on historical consumption data, IM can potentially offer real‐time monitoring of consumption and
anything in between.
The provision of more detailed water use information to customers is gaining traction, drawing
on successes in the energy sector (Hallinan et al 2012). Research into electricity use feedback,
for example, suggests a 5%–15% reduction in demand is achievable (Darby 2006). A review of
25 published detailed customer water‐use information feedback studies revealed mean savings
across all the studies of 5.5%, within the 10th–90th‐percentile envelope of 3.0%–8.0% savings
(excluding the extreme outliers) (Liu & Mukheibir 2018).
Advancements in mobile applications are facilitating fast and simple management of personal
and household activities, but the success of these applications depends on access to relevant
and useful information while also acknowledging the sensitivity of such information. The
increased availability of this data in conjunction with the emergence of the “internet of things”
(IoT) and Long Range Wide Area Network (LoRaWAN) networks is shifting cultural expectations
of the convenience, detail and accessibility of consumption information (Boyle et al 2013).

2.5        Pricing Reform
While the elastic range of various end‐uses remains the subject of ongoing deliberation (Nataraj
2007), the role of water pricing in regulating water consumption behaviours is well established.
Australian electricity retailers already employ time‐of‐use tariffs (TOUTs) in their pricing
structures to help regulate peak demand. IM offers this same potential for the water sector—
by shifting consumption from peak periods to non‐peak periods through information access and
peak usage pricing. Through a TOUTs approach, based on hourly consumption data,
infrastructure constraints might be avoided and infrastructure upgrades could be postponed,
saving money for utilities and customers (Cole 2012).
Real time price signalling presents another option for scenarios where balancing the supply and
demand of recycled water is required; i.e. lower prices or free water in times of abundant supply
and vice versa in times of constrained supply. Two‐way communication between customer
onsite storage and the service provider could allow such a transaction to take place seamlessly.
This option becomes particularly relevant under a zero discharge to the environment scenario
where at times the utility may require the use of recycled water, but at other times experiences
peak demands that exceed capacity.

The Bathroom of the Future                                                            UTS-ISF 10
2.6 Network Efficiency: Leak Management, Illegal Use and
Asset Management
Improved leak management in the residential, commercial and industrial sectors, municipal
buildings (particularly schools) and within the water supply network is at the core of improving
network efficiency, to which IM for mitigating and reducing losses is essential (Beal et al 2014,
Britton et al 2008). Network water losses may vary between 5% and 55% of total supply,
depending on factors such as number of connections, geography of the water supply network,
asset condition and climate (Mukheibir 2010). In a study of leakage in 52 Australian schools
equipped with IM, the top ten highest consuming schools were found to account for 77% of total
leakage (Turner et al 2012).
Work commissioned by Sydney Water in 2011 showed the potential for water savings in high
rise residential buildings could be made in the following areas (Jones and Jha, 2011):
Irrigation – through reduced irrigation frequency
Cooling towers – through appropriate settings
Taps – flow regulators to match pressure
Showers – flow regulators to match pressure
Toilets – lower flush volumes
Urinals – flow regulators to match pressure
Leak detection – faulty taps and toilet cisterns.
The largest areas for savings were identified for leak repairs, flow regulators for taps and lower
flow shower fittings. Many of these potential areas for savings would apply to commercial
buildings. A related aspect of leak management is pressure management. Water pressure can
fluctuate with reservoir levels and when high, the risk of leakage may increase. IM can be
employed to understand and manage network pressure and mitigate leakage through pressure
reduction during low flow periods.
Beyond leak management, a number of other elements to network efficiency have been
identified, such as efforts to improve response times to issues of non‐compliance (illegal use),
particularly during times of water shortage (Little & Flynn 2012). Monitoring asset condition is
also integral to network efficiency, and IM can provide data on meter performance and failure
and broader network operations.
With improved technologies and new digital fixtures and fittings, building owners and operators
may soon be able to draw inspiration from these large utility network applications of digital
technologies and apply them on the smaller scale of building systems.
2.7 Precinct planning and management
Data acquired from digital fixtures will refine planning estimates at precinct and more regional
levels and provide insights into end use behaviours not previously available, particularly for the
non‐residential sector. Information on daily and peak demands for water, wastewater and non‐
potable water will inform a range of design and planning criteria, allowing for the optimisation
of resourcing and service networks. Smart fixtures may be able to receive signals about peak
demands and shut off non‐critical appliances in return for bill savings, as has been done to some
extent in the energy sector.
The Bathroom of the Future UTS-ISF 113 Going beyond water efficiency There are significant opportunities for leveraging the data and control features of smart devices to capture benefits beyond water savings, with potential for improvements in building management and security, intelligent monitoring control across multiple applications, energy savings and efficiency, and health and wellbeing. 3.1 Building management Previous innovations in smart lighting and ventilation have demonstrated that, in addition to monetary and environmental savings from energy efficiency, there are a number of additional benefits for building management optimisation and ultimately for the end‐user (van de Werff et al 2018). Monitoring of lighting patterns gives building managers additional information including verification of security walkthroughs, alerts to unauthorised occupancy and mechanisms to minimise building maintenance while maximising occupant satisfaction (Chew et al 2017). Smart bathroom fixtures could be utilised in a similar manner to optimise building management practices as well as save water and energy. For example, data on traffic through bathrooms could allow facilities managers to direct cleaning staff to the most‐used bathrooms and optimise the cleaning and maintenance schedules accordingly. Further, automated control of public access to the bathroom could be linked to a type of fault identified through the data, restricting access if required. For street lighting, automatic outage detection and remote monitoring allows operating and maintenance costs to be reduced by reporting exactly where faulty lights are, while also improving safety for pedestrians and vehicular traffic (Mahoor et al 2017). For building managers, knowing exactly the type of fault would allow for correct maintenance reporting and more efficient repairs, saving money and providing a better customer experience. Developments in smart urinals and toilets allow external isolation of faulty fixtures, improving efficiency and cost savings by allowing facilities managers to identify the specific fault allowing the correct technician to be called. For example, a leak due to a faulty solenoid would need to be repaired by an electrician rather than a plumber. For facilities managers with geographically dispersed facilities, for example councils, being promptly alerted of changes in usage patterns and faults would assist in maintenance and cleaning regime scheduling. As is the case in most water supply networks, pressure management in the parts of the network that have high pressures helps to reduce leaks, reduce the volume of water used, and (in the case of booster pumps) can increase pressure during times of peak demand. These practices can be extended to building networks where the lower floors may experience higher pressures than the top floors. Pressure can also fluctuate between the floors of buildings and throughout the day depending on the demands on the network. By monitoring the flows and pressures across the building, pressures can be reduced in some parts, and boosted in other parts. Reducing hydraulic pressures can substantially reduce leaks and also extend the useful life of water related appliances (Liu et al 2017). A lack of pressure can create flushing issues; conversely, too much pressure can cause undue strain on tapware, causing maintenance issues. Detecting and controlling for pressure at a fixture level can prolong the life of fixtures and provide water savings through reduced leaks. If higher pressure is detected in a urinal for example, the volume of the flush could be reduced while still achieving adequate cleaning flows. The Bathroom of the Future UTS-ISF 12
3.2        Intelligent buildings and the internet of things
The “internet of things” (IoT) is the concept that describes merging information from a diverse
range of sources and devices through a common language for devices and apps. By connecting
all these devices, data is both shared and transmitted between devices, providing a deeper
understanding of how these operate individually as well as synergistically. In a building setting,
this could mean that appliances communicate with each other cooperatively as everything is
interconnected wirelessly.
The introduction of localised networks such as LoRaWAN that enable low power, wide area
communication between remote sensors and gateways connected to the internet network are
initial steps towards IoT network functionality. The rise of LoRaWAN technology has driven an
explosion of interconnected electronic devices that both send and receive data signals.
The automation of electronic devices based on instantaneous data inputs has led to concepts
such as the ‘intelligent home’. The intelligent home learns the behaviours and preferences of
people in the home. It uses data gathered from a selection of devices and sensors around the
home and anticipates the needs of the users and responds accordingly, such as controlling the
airflow, lighting and temperature based on parameters such as occupancy density or movement.
The key components of an intelligent home are the analytics engine, the artificial intelligence
underpinning the application, and most importantly, a high level of user trust and data
transparency.

3.3        Health and wellbeing
The ability to vary lighting levels in response to ambient light not only saves energy, but also has
proven health and wellness benefits for inhabitants (Chew et al 2017). Similar benefits have
been shown from smart ventilation systems which adjust the airflow across the building based
on CO2 levels, humidity, occupancy and outdoor temperature. Although still an emerging
technology, an analysis of 38 smart ventilation studies revealed that up to 60% energy savings
can be achieved through this practice, as well as improved health benefits (Guyot et al 2018).
Similarly, being able to regulate the temperature of taps through the mixing of hot and cold
water based on the ambient temperature or the demographic of the users would save hot water
heating costs, reduce scalding risk, and ensure adequate temperatures for cleaning or
healthcare requirements.
Remotely monitoring fixtures and fittings to ensure they are being used may provide an
additional level of surveillance of the infirm or aged to ensure their wellbeing in a nursing home,
or allowing them to remain in their own unsupervised environment for longer. There are
however, potential ethical and privacy issues related with such an approach.
Developments in car park design has allowed for signalling of free parking spaces, and
redirection of traffic when capacity has been reached (Vera‐ Gómez 2016, Pranav et al 2016), a
feature facilitated through sensor data capture and transmission from individual parking spots.
In a similar manner information from fixtures in bathrooms could be used to detect high rates
of occupancy (during breaks in play at sporting stadiums) and redirect patrons to bathrooms of
lower usage through appropriate signage informed by real time data, thereby enhancing the
user experience.

The Bathroom of the Future                                                               UTS-ISF 13
Behavioural economics suggests that most human decisions are made ‘fast’ and are intuitive,
automatic, experience‐based, involve relatively unconscious judgements and ‘rules of thumb’.
Such decision‐making is based on cognitive shortcuts or impressions and is prone to unconscious
bias. This means information or education and rational choices alone do not drive behaviours.
Instead, many unconscious cues have a strong impact on actual behaviour. There is potential for
digital fixtures to also influence behavior in the future. For example, the HYDRAO shower (Liu et
al 2017) in Europe lights up with different colours for different volumes of water use with the
aim of encouraging users to have shorter showers – especially during peak usage periods at a
gym for example. A tap with similar properties could be used to elicit different handwashing
behaviours in high risk areas such as childcare, hospitals, schools, food preparation areas (for
example red: ‘too short’, orange: ‘nearly there’, green: ‘you are done’). Another ‘nudge’
application could be the lighting up of a tap after the toilet has been flushed as a prompt to
encourage handwashing.

3.4        Energy Savings
There is a strong link between water efficiency and energy efficiency. A small study in Melbourne
by Binks et al (2017) demonstrated that, on average, the energy saved from reduced shower
water use (and therefore hot water use) was in the order of 0.034 kWh per litre of total water
saved – this is usually more energy than is used to provide a litre of potable water and sewage
services. As discussed earlier, changing water temperatures in fixtures to reflect seasons and
daily temperatures could result in major energy savings.
There is very little information about the end‐uses of water in the commercial sector. While hot
water from tap use makes up 25‐30% of residential consumption (Figure 6), tap use is likely to
be predominant hot water consumption point within a commercial building, along with some
brands of industrial dishwashers.

                         Figure 6: Residential use of hot water (ISF iSDP model)

The Bathroom of the Future                                                            UTS-ISF 14
4 What bathroom data could reveal
There is the potential for digital fixtures to revolutionise both the management of fixtures and
collection of valuable data to change a range of behaviours. Data collected from fixtures in
bathrooms installed in a commercial application, as part of initial trials by GWA, have provided
preliminary insights to the type of information that could be analysed, as well as the controls
that could provide value at bathroom, building and city planning scales – as shown in Figure 7.
Figure 7: GWA smart control bathroom fixtures and data collection
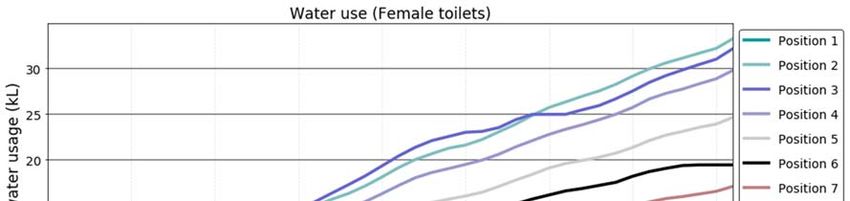
At a bathroom level, data collected from individual fixtures has provided a number of insights
that have assisted with building management and have the potential to influence future
bathroom design. The observations based on the limited data collected thus far are revealing
and highlight that understanding patterns of use for particular fixtures within bathrooms can
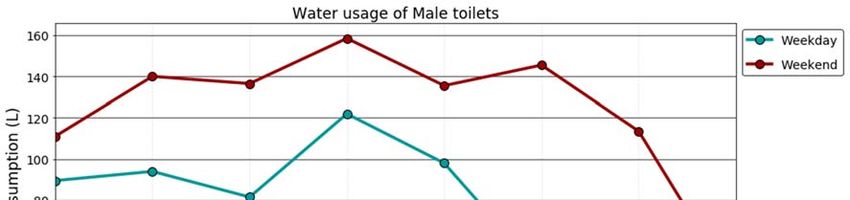
allow more focused cleaning cycles. As shown in Figure 8, there is clearly a higher average use
over the weekend when compared to the week days, and a clear peak of toilet flushing around
midday. This diurnal profile is distinctly different to that of a residential complex and the overall
trends for the city (which exhibit peaks in the morning and early evening). If the high rise building
is mixed use (residential and commercial), then pressure management across the building over
the day might be advantageous.
The Bathroom of the Future UTS-ISF 15Figure 8: Diurnal pattern of toilet flushing
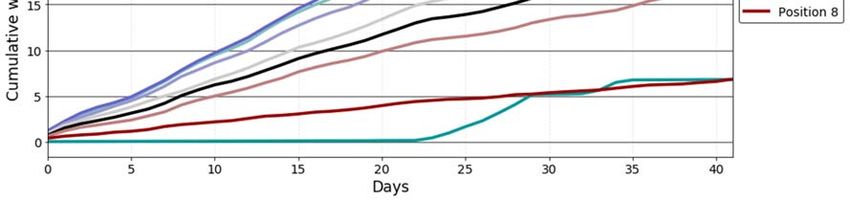
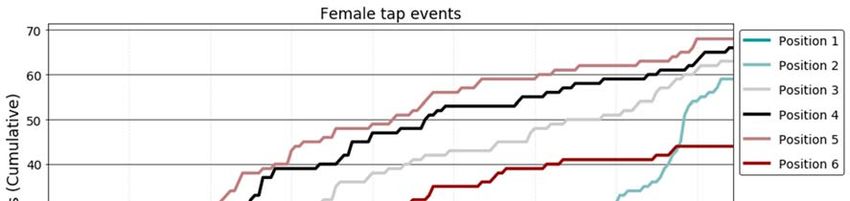
Sudden changes in patterns of use, such as those highlighted in Figures 9 and 10, can indicate
faults. The rapid increase in flow from the tap in Position 2 might signify a leak or running tap.
In the second image, the toilet in Position 1 remains unused for 20 days, signifying a potential
fault with the fixture, or some other problem that has led to users avoiding that cubicle. With
increased digital control of fixtures building managers could remotely isolate faulty fixtures to
stop leaks and further problems and trigger service calls in a timely manner.
Figure 9: Tap (Position 2) with sudden increase in use, indicating a leak
The Bathroom of the Future UTS-ISF 16Figure 10: Toilet (Position 1) with unexplained usage pattern (no usage for 20 days) indicating fault
Further diagnostics could indicate user preferences for particular facilities. As can be observed
in the previous two graphs, not all toilets and taps are used equally. This could be due to their
location or state of cleanliness. Being able to monitor the level of usage of a particular bathroom
or fixture could allow more efficient allocation and scheduling of cleaning and maintenance
staff.
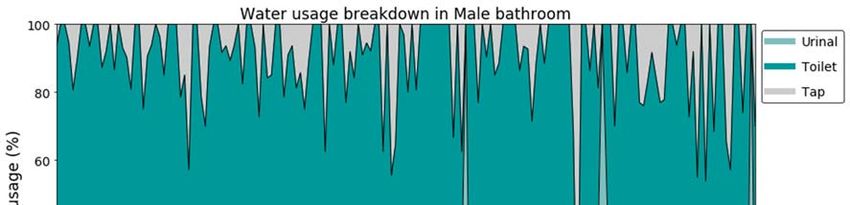
Data could also be used to identify the need for behavioural change programs. For example
Figure 11, which shows the percentage of water used by appliance type in 15 minute periods in
one bathroom, highlights a potential disconnect in some of the periods between toilet and urinal
usage and tap usage (the grey portion of the graph). Drawing on behavioural insights research,
a flashing tap after a toilet flush or urinal use to encourage handwashing, or changing the lighting
colour or brightness on the tap to indicate sufficient handwashing time are some of the possible
ways of using the data collected to promote positive behaviour change.
Figure 11: Toilet and urinal use within a bathroom with limited hand washing
The Bathroom of the Future UTS-ISF 175 Information collection and appliance control across scales It is evident that the collection of data from smart appliances and fixtures is not limited to the fixture or bathroom alone, and can provide insights at broader scales, including for increasing efficiency, detection of faults, determining cleaning requirements, and broader public health considerations such as hand‐washing behaviour. Figure 12 illustrates how information can be collected at outwardly cascading scales – from the fixture itself, the bathroom and the building more broadly, and at the precinct and city scales. Utilities and planners may find commercial building consumption patterns useful when planning new or upgrade infrastructure, especially in densifying precincts. This information then provides the opportunity for controls by various actors, including building managers as well as external stakeholders such as public health practitioners. Examples of controls include changed user behaviour, improved user experience, optimised operational activities (such as cleaning and repairs), improved resource efficiency (water and energy), and better‐informed building designs. Water and energy utilities may also have interest in controlling appliance use during peak demand periods. However, as Freeman (2015) points out, taking advantage of smart appliances (be they lighting, ventilation or taps), five key strategic components are required: (1) the smart appliance, (2) sensors and controls, (3) connectivity, (4) analytics and (5) intelligence (This is further described in Appendix 1). By incorporating the last two components, building operators would be able to monitor and compare multiple buildings, and the “smarts” in the system would perform predictive and learned responses to specific end‐uses and occupancies. The Bathroom of the Future UTS-ISF 18
Figure 12: Bathroom data - Information and Control

The Bathroom of the Future                                UTS-ISF 19
6 Conclusions
The increasing use of data and control across fixtures and fittings has led to widespread
efficiencies and advancements in facilities management and user experience. However, there
has been limited adoption and integration in intelligent water using fixtures to date. Based on
this review, it is clear that in the short‐term digital fixtures in the bathroom could help provide
water efficiencies through the faster detection and repair of problems and improved facilities
management.

Drawing parallels with the lighting industry, it appears unlikely that water efficiency savings
alone will justify broad‐scale adoption. Due to the direct link between energy consumption and
particularly hot water use, the ability to adapt and control temperatures and change behaviour
in relation to hot water use provides consideration for further adaptions, to improve both user
and environmental outcomes as well as financial savings.

Projecting into the future, collection of data and control of fixtures could provide benefits well
beyond water efficiency of single fixtures and appliance or improved facilities management at a
building scale. The ability to monitor and influence behaviour could provide benefits in a range
of specialist applications, such as the health sector, peak demand for bathroom facilities, and
general health behaviour change. In relation to planning at a city scale the collection of real‐time
end‐use data for the non‐residential sector and mixed‐use buildings will allow for better
planning outcomes at precinct and wider city scales.

To allow the full potential of digital fixtures to be realised, protocols and resources should be
developed in order to manage the way data is collected, stored, transmitted, managed, analysed
and integrated with other applications and data sets through the internet of things (IoT).

The Bathroom of the Future                                                               UTS-ISF 20
7 References
Beal C, Stewart R, Giurco D & Panuwatwanich K. (2014) Intelligent Metering for Urban Water
Planning and Management. In K. Adeyeye (Ed.), Water Efficiency in Buildings: Theory and Practice
(pp. 129‐145): John Wiley & Sons Ltd, UK.
Binks A, Kenway S, & Lant P. (2017) The effect of water demand management in showers on
household energy use. Journal of Cleaner Production, 157, pp.177–189.
Boyle T, Giurco D, Mukheibir P, Liu A, Delaney C, White S & Stewart R. (2013) Intelligent metering for
urban water: A review, Water, vol. 5, no. 3, pp. 1052‐1081.
Britton T, Cole G, Stewart R & Wiskar D. (2008) Remote Diagnosis of Leakage in Residential
Households. Water (AWA), 35, 56–60.
Chew I, Karunatilaka D, Pin Tan C & Kalavally V. (2017) Smart lighting: The way forward? Reviewing
the past to shape the future, Energy and Buildings, vol. 149, pp. 180‐191,
Cole G, O’Halloran K & Stewart R. (2012) Time of use tariffs: implications for water efficiency. Water
Science & Technology: Water Supply, 12, 90.
Darby S. (2006) The Effectiveness of Feedback on Energy Consumption: A Review for DEFRA on the
Literature on Metering, Billing and Direct Displays; Environmental Change Institute, University of
Oxford: Oxford, UK, pp. 1‐24.
Department of Infrastructure and Planning (DIP) (2008) Sub‐meter Guidelines; Department of
Infrastructure and Planning, Queensland Government: Brisbane, Australia, pp. 1‐15.
Fane S, Turner A, Falletta J % White S. (2018) Next generation water efficiency: looking over the
horizon, OZWATER 2018, Brisbane
Fyfe J, McKibbin J, Mohr S, Madden B, Turner A & Ege C. (2015) Evaluation of the Environmental
Effects of the WELS Scheme, report prepared for the Australian Commonwealth Government
Department of the Environment by the Institute for Sustainable Futures, University of Technology,
Sydney
Freeman D (2015) Market Trends: The Five Phases that Smart Lighting Providers must address to be
Successful in the Internet of Things, Gartner, https://www.gartner.com/doc/3067420/market‐
trends‐phases‐smart‐lighting?srcId=1‐2994690285, Accessed 02/10/2018
Giurco D, Carrard N, McFallan S, Nalbantoglu M, Inman M, Thornton N & White S. (2008) Residential
end‐use measurement guidebook: A guide to study design, sampling and technology; CSIRO, Institute
for Sustainable Futures, University of Technology, Sydney: Sydney, Australia, pp. 1‐56.
Guyot G, Sherman M & Walker I. (2018) Smart ventilation energy and indoor air quality performance
in residential buildings: A Review. Energy & Buildings, 165 pp 416‐430
Haley M, & Dukes M. (2012) Validation of landscape irrigation reduction with soil moisture sensor
irrigation controllers, J. Irrig. Drain. Eng., 10.1061/(ASCE)IR.1943‐4774.0000391, 135–144.
Hallinan K, Enns H, Ritchey S, Brodrick P, Lammers N, Hanus N, Rembert M & Rainsberger T. (2012)
Energy Information Augmented Community‐Based Energy Reduction, Sustainability, 4, 1371–1396
Jones A & Jha S. (2011) HiRise Pilot Summary Report: Overall Findings from Completed Water Audits
Kenway S, Binks A, Scheidegger R, Bader H, Pamminger F, Lant P & Taimre T. (2016) Household
analysis identifies water‐related energy efficiency opportunities. Energy Build. 131, pp 21‐34
Little L & Flynn J. (2012) Big Data, Smart Meters & Australian Water Utilities; Smart Water Research
Centre: Griffith, Australia, pp. 1‐13.

The Bathroom of the Future                                                                UTS-ISF 21
Liu, A. & Mukheibir, P. (2018) Digital metering feedback and changes in water consumption – A
review, Resources, Conservation and Recycling, vol. 134, pp. 136‐148.
Liu A, Turner A & White S. (2017) Assessment of Future Water Efficiency Measures. Report prepared
for City West Water, Yarra Valley Water, South East Water, Melbourne Water, Barwon Water and
Department of Environment, Land, Water and Planning by the Institute for Sustainable Futures,
University of Technology Sydney.
Mahoor M, Salmasi F & Najafabadi T. (2017) A Hierarchical Smart Street Lighting System with Brute‐
Force Energy Optimization, IEEE Sensors Journal 17 pp. 2871‐2879.
McKenna E, Doylend N & Thomson M. (2014) End‐use demand in commercial office buildings: Case
study and modelling recommendations, Fifth German‐Austrian IBPSA Conference, RWTH Aachen
University, pp 67‐74
Mukheibir P. (2010) Less water loss ‐ An integrated approach for small water supply systems.
Proceedings of OzWater’10, Brisbane, Australia, 8‐10 March 2010; pp. 1‐8.
Nataraj S. (2007) Do residential water consumers react to price increases? Evidence from a natural
experiment in Santa Cruz. Agricultural and Resource Economics Update, 10, pp. 9–11.
Pranav S, Nidhi B, & Himanshi K. (2016) Review of Smart Parking System and Different, International
Journal of Industrial Electronics and Electrical Engineering, vol.4(6), pp. 57–59.
Sydney Water (2017) Water Conservation Report 2016‐2017, http://www.sydneywater.com.au/
web/groups/publicwebcontent/documents/document/zgrf/mdq3/~edisp/dd_047419.pdf
Turner A, Boyle T, Mohr S, Fyfe J & Bruck J. (2012) Quantitative evaluation of residential and school
water efficiency programs; Prepared by the Institute for Sustainable Futures, University of
Technology, Sydney: Sydney, Australia, 2012; pp. 1‐225.
Turner A, Willetts J, Fane S, Giurco D, Chong J, Kazaglis A & White S. (2010) Guide to Demand
Management and Integrated Resource Planning (Update on Original 2008 Guide); Association of
Australia (WSAA): Sydney, Australia, pp. 1–174.
Umapathi S, Chong M & Sharma A. (2012) Evaluation of plumbed rainwater tanks in households for
sustainable water resource management: A real‐time monitoring study, Journal of Cleaner
Production, 42, 204‐214.
van de Werff T, van Essen H & Eggen B. (2018) The impact of the internet of lighting on the office
lighting value network, Journal of Industrial Information Integration, 11 pp 29‐40
Vera‐Gómez J, Quesada‐Arencibia A, García C, Moreno R & Hernández F. (2016) An intelligent parking
management system for Urban areas, Sensors, 16 (6) pp 1–16. https://doi.org/10.3390/s16060931
Vick R, Grabow L, Miller G & Huffman R. (2016) Water Conservation Potential of Smart Irrigation
Technologies in the Catawba‐Wateree River Basin, Journal of Irrigation and Drainage Engineering,
143(Epa). https://doi.org/10.1061/(ASCE)IR.1943‐4774.0001130
White S & Fane S. (2002) Designing cost effective water demand management programs in Australia.
Water Sci. Technol. 46, pp. 225–232.
Willis R, Stewart R, Panuwatwanich K, Jones S & Kyriakides A. (2010) Alarming visual display monitors
affecting shower end use water and energy conservation in Australian residential households,
Resources, Conservation and Recycling, 54, pp 1117‐1127.

The Bathroom of the Future                                                               UTS-ISF 22
Appendix 1. Processes of an intelligent monitoring system (modified from Boyle et al 2013)

 Parameter     Measurement                              Transfer                                 Processing/Analysis                       Feedback
 Mode          Water flow, pressure and data            Means by which data is                   Means by which the data is                Method by which data is provided to
               logger technology combinations           transferred from and from                stored (e.g., data servers) and           user/customers for interpretation,
               used to capture information              meters and loggers. Data is              analysed (e.g., end-use                   e.g., postal bill, email, web interface,
               about water consumption and              transferred via broadband,               analysis software package).               smart phone application.
               pressure in a network.                   cable or wireless (e.g., radio,                                                    Behaviour change may/may not
                                                        GSM, CDMA*). May be fully                                                          ensue.
                                                        remote or require near
                                                        range collection (e.g.,
                                                        via LoRaWAN network).

 Frequency     The specified time intervals or          How often data is sent or                The frequency at which this               The frequency at which information is
               number of pulses at which (i)            collected e.g., daily, half hourly,      information is used to update u           communicated to the user/customer
               activity is recorded by the              “real-time”.                             operations (e.g., for pressure            (e.g., quarterly, monthly, daily, real-
               meter; and (ii) data from the            This will vary depending on the          management).                              time, etc.).
               meter is collected by the data           type of meter, e.g., pulse
               logger, e.g., 15 min intervals.          versus interval.

 Resolution    The granularity of the                   Resolution of data remains               Data may be aggregated or                 The level of detail of information
               information (e.g., L/pulse) is           unchanged, though quality of             manipulated to analyse trends             provided to the user/customer, such
               determined by the purpose,               data (i.e., complete/partial) may        (e.g., leak assessment; end-use           as usage per unit of time and/or end
               capabilities and settings of the         suffer from disruptions to               analysis).                                use breakdown. Comparative framing
               meter. The resolution of the             transmission process.                                                              and benchmarking may aid legibility
               recorded data will depend on                                                                                                and comprehension. Content and
               the data logger, e.g., L/15 min                                                                                             framing should be informed by
               (i.e., frequency of                                                                                                         behaviour change theory, information
               measurement, above).                                                                                                        about target audience and tailored to
                                                                                                                                           the mode in question.
      * N.B. CDMA = Code Division Multiple Access; GSM = Global System for Mobile communications—both are technology platforms for mobile/cellular telephones.

                                                        The Bathroom of the Future                                                                                        UTS-ISF 23
You can also read