LIVING PLANET REPORT 2020 - A DEEP DIVE INTO THE LIVING PLANET INDEX ADEEPDIVEINTOTHELPI
←
→
Page content transcription
If your browser does not render page correctly, please read the page content below
LIVING PLANET
REPORT 2020
A DEEP DIVE INTO THE
LIVING PLANET INDEX

                A DEEP DIVE INTO THE LPI 1
WWF
WWF is one of the world’s largest and most experienced independent
conservation organizations, with over 5 million supporters and a global
network active in more than 100 countries. WWF’s mission is to stop
the degradation of the planet’s natural environment and to build a
future in which humans live in harmony with nature, by conserving the
world’s biological diversity, ensuring that the use of renewable natural
resources is sustainable, and promoting the reduction of pollution and
wasteful consumption.

Institute of Zoology (Zoological Society of London)
Founded in 1826, ZSL (Zoological Society of London) is an international
conservation charity working to create a world where wildlife
thrives. ZSL’s work is realised through ground-breaking science, field

                                                                            LIVING PLANET
conservation around the world and engaging millions of people
through two zoos, ZSL London Zoo and ZSL Whipsnade Zoo.

ZSL manages the Living Planet Index® in a collaborative partnership
with WWF.

                                                                            REPORT 2020
Citation
WWF (2020) Living Planet Report 2020. Bending the curve of
biodiversity loss: a deep dive into the Living Planet Index. Marconi, V.,
McRae, L., Deinet, S., Ledger, S. and Freeman, F. in Almond, R.E.A.,
Grooten M. and Petersen, T. (Eds). WWF, Gland, Switzerland.

                                                                            A DEEP DIVE INTO THE
Design and infographics by: peer&dedigitalesupermarkt

Cover photograph: Credit: Image from the Our Planet series,

                                                                            LIVING PLANET INDEX
© Hugh Pearson/Silverback Films / Netflix
The spinner dolphins thrive off the coast of Costa Rica where
they feed on lanternfish.

Living Planet Report®
and Living Planet Index®
are registered trademarks
of WWF International.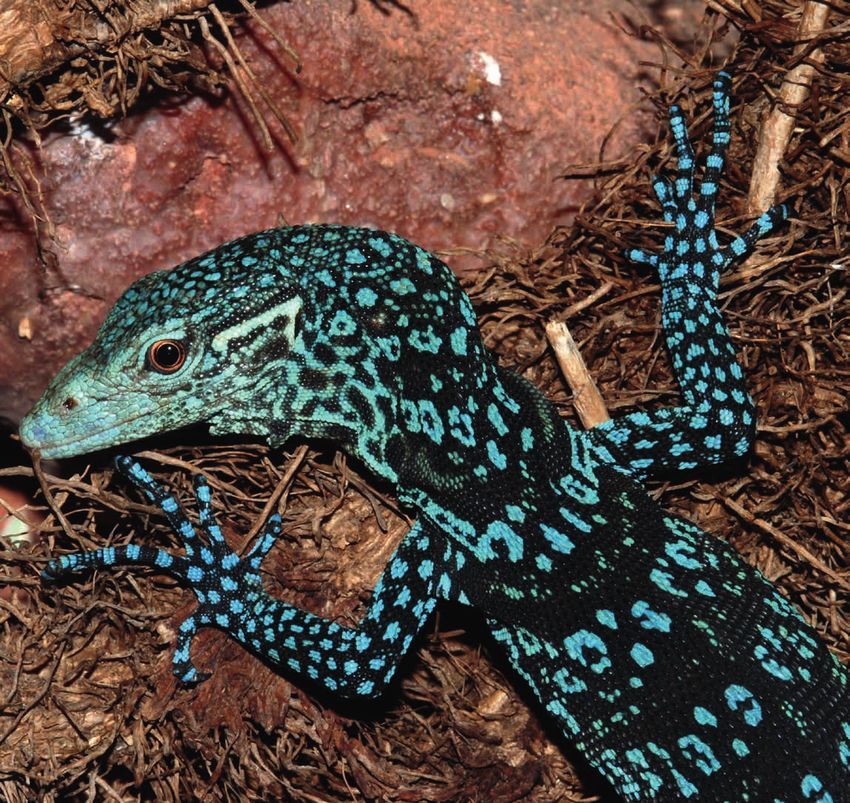
CONTENTS
Editorial Team
Editor-in-Chief: Rosamunde Almond (WWF-NL)                                            INTRODUCTION                                                                     6
Co-Editor-in-Chief: Monique Grooten (WWF-NL)
Lead Editor: Tanya Petersen
Living Planet Report Fellow: Sophie Ledger (Zoological Society of London - ZSL        THE LIVING PLANET INDEX (LPI) AT A GLANCE                                       8
                                                                                      What is the LPI?                                                                8
Steering Group
                                                                                      What the LPI has been used for and how it has evolved                            9
Chair: Rebecca Shaw (WWF-International)
                                                                                      What subsets of the global LPI are included in the 2020 Living Planet Report?   10
Mike Barrett (WWF-UK), João Campari (WWF-Brazil),
                                                                                      What are the main trends shown by the LPI?                                      13
Winnie De’Ath (WWF-International), Katie Gough (WWF-International),
Marieke Hartevel (WWF-International), Margaret Kuhlow (WWF-International),            Zooming in on population trends in the IPBES regions                            14
Lin Li (WWF-NL), Luis Naranjo (WWF-Colombia) and Kavita Prakash-Marni                 Is the decline in freshwater populations slowing down?                          16

Authors
Valentina Marconi (Zoological Society of London - ZSL)
                                                                                      INTERPRETING THE RESULTS                                                        18

Louise McRae (Zoological Society of London - ZSL)                                     Framing the LPI: Why should we be using the word ‘decline’ instead of ‘loss’?   18

Stefanie Deinet (Zoological Society of London - ZSL)                                  What does the LPI indicate?                                                     19
Sophie Ledger (Zoological Society of London - ZSL)                                    What is the LPI useful for?                                                     20
Robin Freeman (Zoological Society of London - ZSL)

Special thanks                                                                        TESTING THE SENSITIVITY OF THE LPI                                              22

Monika Böhm (Zoological Society of London - ZSL), Hannah Rotton (Zoological           Do outliers and extreme trends have a strong influence on the LPI value?        22
Society of London - ZSL) and Kate Scott-Gatty (Zoological Society of London - ZSL).   What influence do short time-series have on the LPI trend?                      23
                                                                                      Why do different indicators show different results?                             25
We would also like to thank everyone who kindly added data to the Living Planet
                                                                                      Why do percentages reported for LPIs change from year to year?                  26
Database (www.livingplanetindex.org).

                                                                                      THE LPI DATABASE                                                                28
                                                                                      How many species and populations are there in the LPI?                          28
                                                                                      Where does the data used in the LPI come from?                                  31
                                                                                      Are extinct species included in the LPI?                                        31

                                                                                      CALCULATING THE LPI                                                             32
                                                                                      How is the LPI calculated?                                                      32
                                                                                      A deeper dive: A step-by-step guide to calculating an LPI                       32
                                                                                      Why does the LPI use a weighted approach?                                       34
                                                                                      How do the LPI weightings work?                                                 35
                                                                                      How are different LPIs calculated?                                              36
                                                                                      Addressing challenges and improving the LPI                                     36

                                                                                      REFERENCES                                                                      38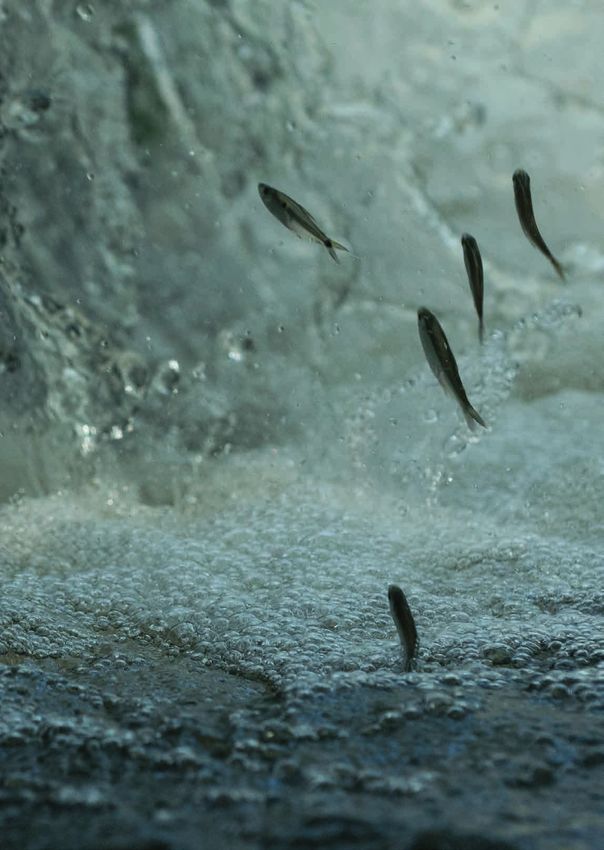
A DEEP DIVE
    INTO THE LIVING
    PLANET INDEX
    INTRODUCTION
    Species population trends are important because they are a
    measure of overall ecosystem health. Measuring biodiversity
    is complex, and there is no single measure that can capture
    all of the changes in this web of life. Nevertheless, the vast
    majority of indicators show net declines over recent decades.
    The global Living Planet Index, the flagship indicator for the
    Living Planet Report, shows an average 68% decrease in
    population sizes of mammals, birds, amphibians, reptiles and
    fish between 1970 and 2016. Here, we look at the data behind
    the LPI and explain in more detail how the trends presented
    in the report are calculated.
    A group of California sea lions (Zalophus californianus) swimming in kelp forest
    (Macrocystis pyrifera), California, USA.

                                                                                       © naturepl.com / Pascal Kobeh / WWF

WWF LIVING PLANET REPORT 2020 6                                                                     A DEEP DIVE INTO THE LPI 7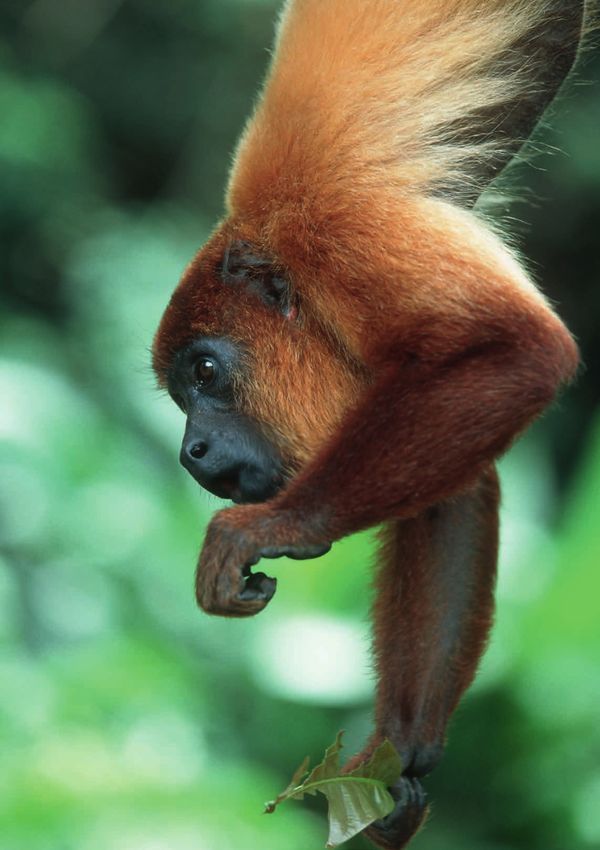
THE LIVING PLANET INDEX AT A GLANCE                                                                                What the LPI has been used for and how it has evolved
                                                                                                                   The LPI database is continually evolving as we add data for an

What is the Living Planet Index?
                                                                                                                   increasing number of species and countries every year. By collecting
                                                                                                                   additional information alongside species population trends – such
                                                                                                                   as the type of species monitored, or where it lives – we can increase
                                                                                                                   the value of the LPI data beyond just the statistics, producing a
      Valentina Marconi, Louise McRae,    The LPI is one of a suite of global indicators used to monitor
                                                                                                                   more in-depth view of the changes in species around the world.
        Stefanie Deinet, Sophie Ledger,   progress towards the Aichi Biodiversity Targets agreed by the
                                                                                                                   The data and the methodology used to calculate the LPI have been
      Robin Freeman (Zoological Society   Convention on Biological Diversity (CBD) in 2010. These targets are
                                                                                                                   increasingly used in a variety of scientific outputs (Figure 1) to look
                       of London - ZSL)   set for review this year, in 2020, the ‘super year’ for biodiversity.
                                                                                                                   at population trends in different taxa, regions and groups of species.
                                          Aichi Targets require nations to take effective and urgent action to
                                          halt the loss of biodiversity and ensure that ecosystems are resilient   	For a full list of LPI publications, please visit
                                          and continue to provide essential services, thereby securing the           https://livingplanetindex.org/publications.
                                          planet’s variety of life, and contributing to human well-being and
                                          poverty eradication.

                                          The LPI tracks trends in abundance of a large number of                  The LPI data, and tools for analysis, have also been used in both
                                          populations of vertebrate species in much the same way that a            international and national policy and integrated into education
                                          stock market index tracks the value of a set of shares or a retail       programmes and public engagement events. The following are
                                          price index tracks the cost of a basket of consumer goods. The data      some important examples of how the LPI data has been used:
                                          used in constructing the index are time-series of either population
                                                                                                                   A closer look at population trends for different species
                                          size, density (population size per unit area), abundance (number
                                                                                                                   and regions
                                          of individuals per sample) or a proxy of abundance (for example,
                                                                                                                   Population trends vary among types of species and regions. Using
                                          the number of nests recorded may be used instead of a direct
                                                                                                                   LPI data we have been able to look at trends for a number of
                                          population count). The LPI is currently based on time-series data
                                                                                                                   species groups such as mammals 1 and migratory birds 2. In each
                                          for 20,811 populations of 4,392 species of mammals, birds, reptiles,
                                                                                                                   case the factors behind the trends – such as body size, habitat
                                          amphibians and fish from around the globe. Using a method
                                                                                                                   and environmental variables – were explored. LPIs for two very
                                          developed by ZSL and WWF, these species population trends
                                                                                                                   different regions – the Arctic 3 and Mediterranean wetlands 4 –
                                          are aggregated and weighted to produce the different Living
                                                                                                                   have been produced, showing average trends among species in
                                          Planet Indices.
                                                                                                                   those regions since 1970. The first LPI for reptiles was also
                                                                                                                   recently published 5.
Figure 1:                                                          100
Number of publications that used                                                                                   The impact of conservation on species
the LPI method or data (purple),                                   90
mentioned the LPI (green), cited
                                                                                                                   Population trend data, the building blocks of the LPI, can be used
                                                                   80
LPI figures (red) or discussed the                                                                                 to understand if, and how, conservation is benefitting species.
                                          Number of publications

                                                                   70
indicator in 2008, 2012 and 2016.                                                                                  This approach has been used to examine the drivers behind the
                                                                   60                                              comeback of some species in Europe over the past 50 years 6 and
Key
                                                                   50                                              to assess how the use of protected areas in conservation can
       Brief mention / cited                                       40                                              benefit species 7-10.
       Discussed
                                                                   30
       Figures cited
                                                                   20
       Method / data used
                                                                   10
                                                                     0
                                                                         2008   2012               2016

WWF LIVING PLANET REPORT 2020 8                                                                                                                                                              A DEEP DIVE INTO THE LPI 9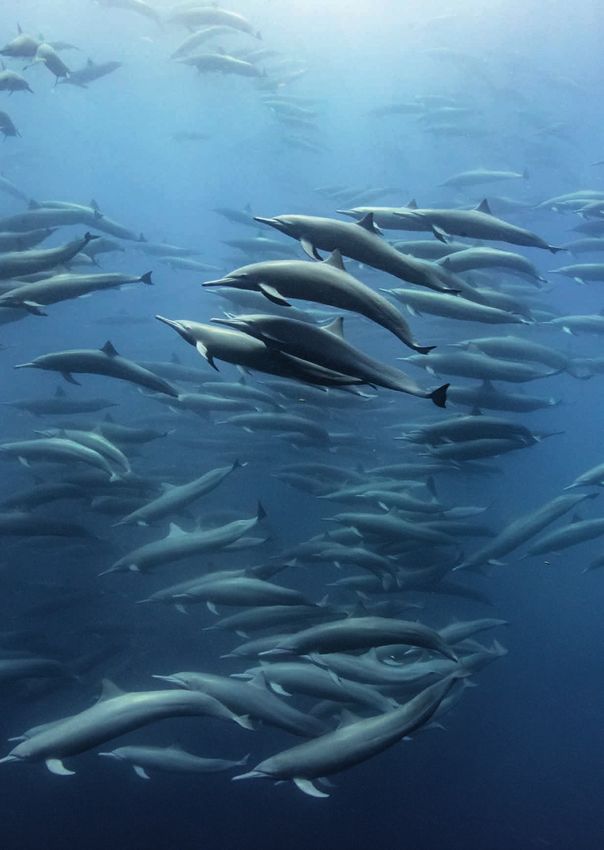
The impact of threats on species                                         A) Terrestrial and freshwater populations in the IPBES
                                   There are many types of threats that can affect species, and                regions – Africa, Americas (North and Latin America &
                                   by investigating the relationships between population trends                Caribbean), Asia-Pacific, Europe-Central Asia
                                   and threats we can start to understand which species are most               Previous LPRs have analysed trends across biogeographic
                                   vulnerable and where. The LPI data has been used to explore how             realms (geographic regions combined with the historic and
                                   land-use change and climate change relate to trends in birds and            evolutionary distribution patterns of terrestrial plants and
                                   mammals 11, as well as how trends in species that are used – for            animals). However, in 2020, the landmark year for biodiversity,
                                   food, medicine, etc – have fared since 1970 12. More recently, a focus      the LPI has instead been applied to the Intergovernmental
                                   on forest species revealed how more than one threat can affect              Science-Policy Platform on Biodiversity and Ecosystem Services
                                   species, and that concentrating on just one threat may mean an              (IPBES) regions, to allow for easy comparisons of trends
                                   important part of the picture is missed 13.                                 (Figure 2). The IPBES regions differ slightly as they reflect
                                                                                                               sociopolitical boundaries, and within this report North
                                   Tracking progress towards international policy targets                      and South America are analysed separately to reflect their
                                   The LPI has been used to measure progress towards international             significantly different biodiversity and LPI trends. In the report,
                                   biodiversity targets set by the Convention on Biological                    a breakdown of the threats affecting species populations in the
                                   Diversity 14,15 as well as national-level targets 16,17. It was also        different regions is also presented. This information is collected
                                   incorporated in the IPBES global assessment 18, and a recent study          from the data sources when the data are entered in the LPI
                                   looked at how population data from the LPI relates to other targets         database, and is specific to the monitored populations.
                                   under the Sustainable Development Goals 19.

                                   Educating and inspiring
                                   With a bank of thousands of species population trends, the
                                   LPI database has been a useful resource for student training
                                   at undergraduate and postgraduate level, through both formal
                                   teaching and independent research projects. The LPI has also
                                   functioned as a talking point for public engagement events held
                                   for everyone from children to scientists to engage people in
                                   conversations about the natural world and how to conserve it.

                     What subsets of the global LPI are included in the
                     2020 Living Planet Report?
                                   In addition to the global LPI, the 2020 report contains LPI subsets
                                   to reflect trends in:

                                   A) Terrestrial and freshwater populations in the IPBES regions –
                                       Africa, Americas (North and Latin America & Caribbean), Asia-
                                       Pacific, Europe-Central Asia
                                   B) Freshwater species
                                                                                                                                                                                     Figure 2:
                                   C) Forest specialist species
                                                                                                                                                                                     The IPBES regions map:
                                   D) European butterflies                                                                                                                           IPBES (2015) 37.
                                   E) Reptiles

WWF LIVING PLANET REPORT 2020 10                                                                                                                                                                  A DEEP DIVE INTO THE LPI 11
B) Freshwater species
                                      In the Living Planet database, each population is assigned to         What are the main trends shown by the LPI?
                                      one system – terrestrial, freshwater or marine. This is typically
                                      based on the main habitats in which the species occurs. For
                                                                                                            The headline trend from this Living Planet Report is that
                                      some species, however, this might be difficult to assign; these
                                      species are therefore assigned to the system in which they were       globally, monitored populations of birds, mammals, fish,
                                      monitored. For example, Pacific salmon will be assigned to
                                                                                                            reptiles and amphibians have declined in abundance by
                                      marine if monitored in the ocean and freshwater if monitored
                                      in a river. The freshwater LPI consists of 944 birds, mammals,        68% on average between 1970 and 2016.
                                      amphibians, reptiles and fish monitored in freshwater habitats
                                      such as rivers and wetlands.                                          The headline trend from this Living Planet Report is that globally,
                                                                                                            monitored populations of birds, mammals, fish, reptiles and
                                   C) Forest specialist species                                            amphibians have declined in abundance by 68% on average
                                       Using the LPI data, we can monitor changes in population             between 1970 and 2016. The results also indicate that species
                                       abundance for forest specialist species. The Forest Specialist       are faring much worse in freshwater systems, where vertebrate
                                       LPI shows the abundance trends for 455 monitored populations         populations declined by an average of 84%. In order to highlight
                                       of 268 bird, mammal, reptile and amphibian species that only         geographical differences, regional LPIs have also been calculated.
                                       live in forests. We defined forest specialists using the habitat     These trends have been defined slightly differently to previous
                                       coding from the IUCN Red List 20. Those with “Forest” listed as      years. Following the IPBES regional classifications, terrestrial and
                                       one of the major habitats were considered forest generalists,        freshwater populations within a country were assigned to an IPBES
                                       while those with only “Forest” listed as the major habitat were      region and a trend was then calculated for each region. The main
                                       considered forest specialists. This definition of specialist is      trends reported in the LPR are listed in Table 1. A more in-depth
                                       rather conservative, as the “Forest” category from the IUCN          discussion of some of these trends is presented below.
                                       Red List refers to natural habitat and does not include artificial
                                       habitats such as plantations.                                                                                         Number of        Number of        Percentage     95% confidence limits
                                                                                                                                                              species         populations        change
                                   D) European butterflies                                                                                                                                    1970 - 2016   Lower            Upper
                                      Although at present the LPI contains data only for vertebrate
                                                                                                             Global                  Global                     4,392           20,811               -68%    -73%              -62%
                                      species – as, historically, these have been better monitored
                                      – efforts are underway to incorporate data on invertebrates,           Systems                 Freshwater                 944              3,741               -84%    -89%              -77%
                                      starting with insects. For the 2020 edition of the Living Planet                               Africa                     371              1,318               -65%    -78%              -43%
                                      Report, a subset of this charismatic order of insects, still
                                                                                                                                     North America              944              2,473               -33%    -54%              -4%
                                      underrepresented in the Red List of Threatened Species, has
                                                                                                                                     Latin America &
                                      been included in the analysis. An LPI has been calculated for          IPBES regions                                      761              1,159               -94%    -96%              -89%
                                                                                                                                     Caribbean
                                      17 typical grassland butterfly species for 16 European countries
                                      between 1990 and 2017.                                                                         Asia-Pacific               581              2,167               -45%    -65%              -15%
                                                                                                                                     Europe-Central Asia        608              4,283               -24%    -43%               2%
                                   E) Reptiles
                                                                                                             Forest specialist
                                      Among vertebrates, reptiles have been one of the lesser studied        species
                                                                                                                                                                268               455                -53%    -70%              -27%
                                      groups, despite having one of the highest total number of
                                                                                                             Reptiles                                           227               672                -31%    -61%              19%
                                      species. Recently, a few studies have tried to redress the balance;
                                      one of which has shown that one in five species of reptiles is         Grassland butterflies   Europe                      17               17                 -49%    -71%              -13%
                                      threatened with extinction 21. The LPI for reptiles contains
                                                                                                            Table 1:
                                      672 population time-series representing 227 species across            Trends in the Living Planet indices between 1970 and 2016, with 95% confidence
                                      the globe.                                                            limits. Positive numbers indicate an increase, negative numbers indicate a decline.
                                                                                                            Please note that the European Grassland Butterfly Index spans the years between
                                                                                                            1990 and 2017, and the Forest Specialist Index stops at 2014 due to data availability.
                                                                                                            WWF/ZSL (2020) 22.

WWF LIVING PLANET REPORT 2020 12                                                                                                                                                                                A DEEP DIVE INTO THE LPI 13
Zooming in on population trends in the IPBES regions                                     Europe and Central Asia
                                                                                                           Europe-Central Asia not only has one of the highest Ecological
                                   The Americas                                                            Footprints of any IPBES region but also exceeds its biocapacity by
                                                                                                           the largest amount 24. However, the abundance trend monitored
                                   The Americas are highly biologically diverse, hosting the largest       here – of 4,283 populations, representing 608 species – shows the
                                   number of megadiverse countries (the most biodiversity-rich             smallest decline of any IPBES region: the average decline is 24%
                                   countries that also harbour high numbers of endemic species) of         between 1970 and 2016 (range: -43% to 2%). This figure paints a
                                   any continent in the world 23. The region has a large capacity to       less severe picture for the biodiversity of Europe-Central Asia, and
                                   provide for people, while at the same time supporting only 13% of       can be attributed in part to successful conservation efforts during
                                   the total human population.23 Despite this seemingly favourable         the time period. That said, biodiversity had been transformed to a
                                   balance between capacity and demand, the region also accounts           large degree prior to 1970, especially in Western Europe, so the LPI
                                   for around 23% of the global ecological footprint 23. Between 1970      shows trends from many species that were already in a depleted
                                   and 2016, the LPIs for North America and for the remaining              state. A closer look at the Europe-Central Asia subregions suggests
                                   subregions combined (South America, Mesoamerica and the                 that Eastern European populations have not fared as well.
                                   Caribbean) have declined by an average of 33% (2,473 populations
                                   of 944 species; range: -54% to -4%) and 94% (1,159 populations          Africa
                                   of 761 species; range: -96% to -89%) respectively. After an initial
                                   steady decrease, the North American trend appears to stabilize          The region of Africa is very rich in biodiversity and is the only
                                   from the turn of the millennium. This flattening of the line suggests   remaining region on Earth to still have significant numbers of
                                   that the rate of decline is slowing, and continued monitoring will      large mammals 25. The goods and services that Africa’s biodiversity
                                   show whether this is true across all species groups. The situation      provides are important, not only for Africa but for the rest of the
                                   appears to be much more serious in the tropical subregions of the       world 25. The LPI for the Africa IPBES region has decreased in
                                   Americas. The 94% decline in Latin America & Caribbean is the           abundance by 65% on average (range: -78% to -43%) between 1970
                                   most striking decline observed in any IPBES region. The conversion      and 2016, based on monitoring data from 1,318 populations of 371
                                   of grasslands, forests and wetlands, the overexploitation of species,   species. More information is needed to examine trends in different
                                   climate change, and the introduction of alien species 23 have all       subregions, but initial examination suggests declines in West,
                                   contributed to a precipitous decline in biodiversity in this area       Central and East Africa, and more stable trends at the extremes of
                                   of the globe. Figures for fish, reptiles and amphibians are behind      the continent in North and Southern Africa. These results largely
                                   much of the decline. Preliminary analysis suggests that the largest     correspond with the findings of the Red List Indices for the
                                   decline in the LPI can be seen in the Mesoamerica subregion, but        Africa subregions 25.
                                   additional data is needed to assess whether this extends to other
                                   tropical subregions (South America, Caribbean).                         Asia-Pacific
                                                                                                           The Asia-Pacific region comprises both vast terrestrial plains and
                                                                                                           many islands small and large, leading to a huge number of endemic
                                                                                                           species and unique ecosystems 26. Species populations monitored
                                                                                                           in the Asia-Pacific region have steadily decreased on average since
                                                                                                           1970, although there has been a positive trend since 2010, which
                                                                                                           is also seen in a few species of reptiles and amphibians. Overall
                                                                                                           abundance is 45% lower on average by 2016 (range: -65% to -15%).
                                                                                                           Because most species were monitored in the Oceania subregion, its
                                                                                                           trend is very similar, although declines appear to be happening in
                                                                                                           all other subregions.

WWF LIVING PLANET REPORT 2020 14                                                                                                                                                  A DEEP DIVE INTO THE LPI 15
Is the decline in freshwater populations slowing down?
The 84% decline in freshwater populations globally is one of the
most striking declines presented in the Living Planet Report. This
is a further reduction since the index was last published in the LPR
2018, when it showed a decline of 83%. Since the 2018 report,
554 populations of 194 freshwater species have been added to
the database; 71 of these are new species to the LPI. The updated
version contains two more years of data but also new time-series
throughout the considered time frame. The trend appears to
stabilize over the last few years for which we have data (2012-2016).
A taxonomic disaggregation of the Freshwater LPI (not shown)
highlighted how this stable trend, rather than being a generalized
trend for all species, is the result of a flattening of the fish and bird
indices, combined with a slight increase in the amphibian and
reptile index between 2013 and 2016, and a sharp drop followed
by a sharp increase in the mammal index. More data collection is
needed to confirm if these are genuine trends. In Figure 3 the trend
Figure 3: is shown alongside the number of species contributing to the index
Index of abundance for 944 in each year: this drops considerably over the last few years of the
freshwater vertebrate species
(final index value = -84%; trend, and especially in 2016. This is not unusual in LPI trends as
range = -77% to -89%) monitored there is often a lag between when data are collected, and when they
between 1970 and 2016, and the are integrated into the LPI database. This reflects the time it takes
number of species contributing to
the index in each year (pale green to analyse and publish data in scientific journals, the main source of
dots). WWF/ZSL (2020) 22. data for the Living Planet Index database.
2.0
600
575
550
525
500
1.5 475
Index (1970=1.0) / Number of species
450
425
400
375
350
1.0 325
300
275
250
225
200
0.5
175
150
125
Fish heading upstream in the Juruena River,
100
Salto São Simão, Mato Grosso-Amazonian States, Brazil. © Zig Koch / WWF
75
0.0 50
25
1970 1975 1980 1985 1990 1995 2000 2005 2010 2015
WWF LIVING PLANET REPORT 2020 16 A DEEP DIVE INTO THE LPI 17
INTERPRETING THE RESULTS                                                                                       What does the LPI indicate?
                                                                                                               LPI results are calculations of average trends. This means that for

Framing the LPI: Why should we be using the word ‘decline’
                                                                                                               the global LPI some populations and species have declined by more
                                                                                                               than 68%, whereas others have not declined as much – or are even

instead of ‘loss’?
                                                                                                               increasing. The average trend calculated for each species in the LPI
                                                                                                               shows that just over half of reptile, bird and mammal species are
                                                                                                               stable or increasing (Figure 5). Conversely, the average trend for
                                                                                                               over 50% of fishes and amphibian species shows a decline.
                                     Although the LPI uses time-series of either population size, density,
                                     abundance or a proxy of abundance, the overall trend calculated           As the number of species which have positive and negative trends         Figure 5:
                                                                                                                                                                                        The proportion of species (above)
                                     represents an average trend in population change and not an               are more or less equal, this means that the magnitude of the             and populations (below) in each
                                     average of total numbers of individual animals or species lost.           declining trends exceeds that of the increasing trends in order to       taxonomic group where the

Figure 4:                            Figure 4 explains this difference using three example populations         result in an average decline for the global LPI. This also suggests      average trend is an increase
                                                                                                                                                                                        (blue), is stable (green) or a decline
An illustration of how the average   of three different species, all of which declined but by different        that the global LPI is not being driven by just a few very threatened    (red). WWF/ZSL (2020) 22.
percentage change of the trend       percentages. The tables show that although the average percentage         species, but that there are a large number of species in each group
differs from the change in total
number of animals lost (in           change of the trend represented is 50%, the total number of               (almost 50%) that together produce an average declining trend.           Key
percentage). WWF/ZSL (2020) 22.      animals in the three combined populations has not declined by                                                                                               Increase
                                     this much, so we haven’t lost 50% of animals.                             If we look at trends at the population level a similar pattern
                                                                                                                                                                                                 Stable
                                                                                                               emerges, although in this case amphibians are the only taxonomic
                                                                                                                                                                                                 Decline
                                                                           Bird        Bear         Shark      group with over 50% of populations showing a negative trend.
                                                                        population   population   population

                                      Initial population size              25           50           20                                                                                 Fishes (1635)
                                      Final population size                 5           45            8
                                                                                                                                                                                        Amphibians (286)
                                      Number of animals lost               20            5           12

                                      Percentage change                   -80%         -10%         -60%                                                                                Reptiles (227)

                                                                                                                                                                                        Birds (1586)
                                      Initial population size (total)      95
                                                                                                                                                                                        Mammals (658)
                                      Final population size (total)        58

                                      Number of animals lost (total)       37                                  0%   10%    20%    30%    40%    50%   60%    70%    80%    90%   100%

                                      Number of animals lost (%)          39%

                                      Percentage change (average)         -50%                                                                                                          Fishes (8412)

                                                                                                                                                                                        Amphibians (639)

                                                                                                                                                                                        Reptiles (672)

                                                                                                                                                                                        Birds (6666)

                                                                                                                                                                                        Mammals (4422)

                                                                                                               0%   10%    20%    30%    40%    50%   60%    70%    80%    90%   100%

WWF LIVING PLANET REPORT 2020 18                                                                                                                                                                           A DEEP DIVE INTO THE LPI 19
What is the LPI useful for?
Distilling many trends into a global mean index can of course
mask variation. As mentioned above, not all populations in the
LPI are declining rapidly, and some are increasing. This is why we
also subset the data to show sub-indices for different regions and
taxonomic groups. It’s important to show how the species within
these subsets vary, and to capture the uncertainty of these trends.
Several scientific studies have explored this research topic to try
and uncover trends in vertebrate populations and how they vary
according to location, species ecology and types of threats the
species are affected by 27,5,11,19,13.
The global LPI trend is also an important tool in communicating to
policymakers and to the general public, to catalyse attention and
encourage a broader conversation around biodiversity loss. The LPI
is one of the best tools we have for outlining the global situation, in
the same way as changes in the FTSE All-Share Index give a sense
of how the economy is faring (but tell us nothing about employment
rates or fairness in salary distribution). Without digging into the
detail, it also doesn’t tell us about which sectors are doing well or
not doing well. Similarly, GDP tells us something about the state of
the economy so it has a certain ‘overview’ value, despite its well-
publicized shortcomings.
A red howler monkey (Alouatta seniculus), South America. © Martin Harvey / WWF
WWF LIVING PLANET REPORT 2020 20 A DEEP DIVE INTO THE LPI 21TESTING THE SENSITIVITY OF THE What influence do short time-series have on
the LPI trend?
LIVING PLANET INDEX The LPI database contains data gathered from different sources
and collected at different scales, and not explicitly for the purpose
Do outliers and extreme trends have a strong influence on
of the analyses presented in the Living Planet Report. It therefore
consists of time-series of varying lengths (interval between the first
the LPI value?
and the last observation) and fullness (number of observations
during the time-series). For some species/groups, only shorter
time-series are available, as shown in Figure 7. While time-
series for birds and mammals are longer, amphibians are almost
The geometric mean, the metric the LPI is based on, can be
exclusively represented in the database by shorter time-series. If we
sensitive to extreme values and outliers 28,29, both positive and
only collected and used long-term data, which is often available for
negative. To some extent this is not surprising. If we remove the
species/groups that are doing relatively well, we could potentially
figures for the top-performing companies in the FTSE All Share
miss declines in other species, which are important signals from a
Index, or the worst-performing companies, then, inevitably,
conservation perspective. Also, a recent study comparing known
the FTSE figure would change. While it is useful to identify the
long-term trends in bird abundance with samples of these complete
populations that are most in decline, excluding these from the
time-series 30 suggests that if a significant trend is detected in the
remaining populations is complex. We are currently investigating
sample it is likely to reliably describe the direction (positive or
how increasing the representation of our dataset can help mitigate
negative) of the complete trend. Although it remains to be tested if
some of the sensitivities of the analysis to extreme increases and
these results can be expanded to other taxonomic groups and types
declines in individual populations. If we look at the total change
of data, this might suggest that a decline detected in a short time-
between 1970 and 2016 for the species included in the global LPI
series is worth investigating to confirm the trend and potentially
(Figure 6), we can see that – as expected – fewer species exhibit
avoid further decline.
extreme increases or declines compared to the number of species
that show stable trends or moderate increases and declines.
Figure 7:
Boxplot showing time-series
Figure 6: Histogram of the length by taxonomic group,
400 60
total change between 1970 WWF/ZSL (2020) 22.
and 2016 of the 4,392 species
contributing to the global LPI
Species are binned based on the
300
Time series length
magnitude of the total change they
Number of species
go through during the entirety of 40
the time-series (one or more) they
are represented by in the dataset. 200
: “100%” is the size of the species
population at the beginning of
the time-series, so the frequency 20
at “100%” represents time series 100
with no change in population size
(stable population). The remaining
percentages reflect how many
times larger or smaller the species 0 0
populations are compared to
Amphibians Birds Fish Mammals Reptiles
0.00%
0.01%
0.10%
1.00%
10.00%
100.00%
1000.00%
10000.00%
100000.00%
1000000.00%
10000000.00%
the beginning of the time series.
WWF/ZSL (2020) 22. Taxonomic group
Percentage Change
WWF LIVING PLANET REPORT 2020 22 A DEEP DIVE INTO THE LPI 23Figure 8:
2
To gauge whether the inclusion of these shorter time-series might
Indices of abundance for
vertebrate species monitored
be skewing the results of the global LPI, we recalculated the trend
between 1970 and 2016, calculated excluding short time-series (Figure 8). Overall, the removal of
excluding time-series with data shorter time-series appears to have little influence on the overall
covering less than 3 years (top,
19,470 populations of 4,094
trend, with the trend calculated excluding time-series with less
Index (1970 = 1)
species), 5 years (middle, 16,579 than 3 years of data largely overlapping with the global trend.
populations for 3,760) and 10
1 Trends calculated excluding time-series with less than 5 and 10
years (bottom, 12,180 populations
of 3,179 species). The global LPI
years of data diverge from the global trend from 2002 and 2003,
trend is provided for comparison respectively. However, the confidence intervals around these trends
(in green). WWF/ZSL (2020) 22. overlap for the most part with the confidence intervals around the
global trend, and the final index values differ from the final value of
the global trend by 3% and 5% respectively.
0
Why do different indicators show different results?
1970 1975 1980 1985 1990 1995 2000 2005 2010 2015
2
The LPI measures change in the abundance of species over time,
but this is only one aspect of biodiversity – other indicators take
different approaches to estimating the trends in global biodiversity.
The Biodiversity Intactness Index (BII), for example, shows a less
Index (1970 = 1)
steep decline than the LPI over a similar time period 31. The BII
1
describes change in local richness: specifically it estimates how
ABUNDANCE
much of a region’s originally present biodiversity remains, relative
to if the region were still covered with primary vegetation and
facing minimal human pressures. The fact that the BII value is
lower than the LPI is due to a number of differences in data types
and datasets used, and methodology. The BII is based on data from
0
a larger number of species (47,000), and therefore examines the
1970 1975 1980 1985 1990 1995 2000 2005 2010 2015 status of a broader set of taxa than most other indicators, including
the LPI. In terms of data types, the BII uses species composition DISTRIBUTION
2 in addition to abundance, which is different to the LPI. And
in terms of methodology, it not only substitutes space for time
(i.e. it doesn’t measure over time like the LPI), it makes certain
assumptions and extrapolations in its calculation, which may lead
to an underestimation of losses (see Martin, P.A. et al. (2019) 32)
Index (1970 = 1)
and, specifically, extirpations. Because the trend calculated for the
1 BII describes the total number of individuals, it uses an arithmetic
rather than a geometric mean, and may thus be particularly EXTINCTION RISK
influenced by abundant species.
0
1970 1975 1980 1985 1990 1995 2000 2005 2010 2015
COMPOSITION
WWF LIVING PLANET REPORT 2020 24 A DEEP DIVE INTO THE LPI 25Why do percentages reported for LPIs change from 3000 Figure 9:
The number of species (above) and
year to year?
populations (below) contributing
2500 to the index in each year for
both the 2018 (orange) and 2020
(blue) Living Planet Report.
2000 WWF/ZSL (2020) 22.
The global LPI shows a declining trend, as has also been seen
in earlier editions of the Living Planet Report. However, the 1500
Key
magnitude of the trend is different than in previous years. The
2018
reason for this is that the dataset is continually evolving and for
1000 2020
each Living Planet Report a larger dataset is available for analysis
(Figure 9). Data for the LPI are gathered from a variety of sources
500
such as journals, online databases and government reports that
contain time-series of vertebrate populations spanning any number
of years between 1970 and 2016. A different composition of species 0
1970 1975 1980 1985 1990 1995 2000 2005 2010 2015 2020
and populations means that the average value of each LPI can
change. Some of these new populations and species will add more
10000
information to more recent years, so that indices can be extended
by two years, as is usually the case with each new edition of the 9000
report. The new percentages generally stay within or close to the 8000
range (as measured by the confidence limits) of previous results so 7000
there are similar overall trends even if the final percentage value is
6000
often different.
5000
4000
© Peter Chadwick / WWF 3000
2000
1000
0
1970 1975 1980 1985 1990 1995 2000 2005 2010 2015 2020
A great white pelican (Pelecanus onocrotalus)
in Lake Nakuru National Park, Kenya.
WWF LIVING PLANET REPORT 2020 26 A DEEP DIVE INTO THE LPI 27THE LPI DATABASE Taxonomic group
Birds
Populations
5,433
2018
Species
1,513
Populations
6,666
2020
Species
1,586
Difference
Populations
23%
Species
5%
Mammals 2,894 597 4,422 658 53% 10%
How many species and populations are there in the LPI? Fish
Amphibians and Reptiles
7,329
1,048
1,501
394
8,412
1,311
1,635
513
15%
25%
9%
30%
Total 16,704 4,005 20,811 4,392 25% 10%
The LPI database currently contains over 27,000 populations of
more than 4,700 species from around the globe. The global LPI is Table 2:
based on 20,811 of these populations, focusing on 4,392 species Changes in the number of populations
and species for different taxonomic
of mammals, birds, reptiles, amphibians and fish. Since the last
groups between LPR 2018 and 2020.
edition of the Living Planet Report in 2018 the size of the dataset WWF/ZSL (2020) 22.
has increased by 25% in terms of populations, and 10% in terms of
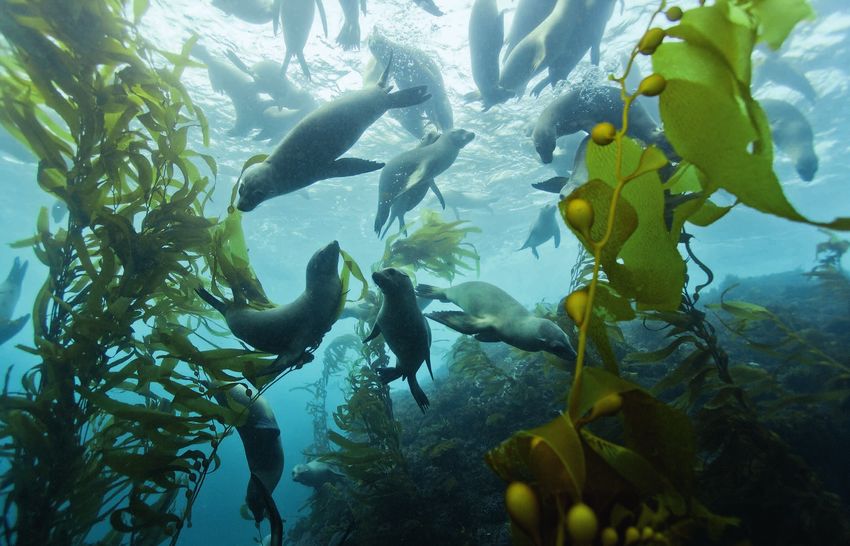
A monitor lizard (Varanus macraei), Papua New Guinea.
species (Figure 10). These changes have also improved the spread
of the data among different taxonomic groups and realms (Tables 2
and 3). Most of the new species (38%) are fish species, followed by
amphibians (25.5%) and birds and mammals (15% each), while a
much smaller proportion of reptiles has been added to the dataset.
The majority of new populations have been added to mammals
(34.5% more compared to LPR 2018) and birds (34%). Around 15%
of the new species added since the 2018 LPR – mostly birds – are
from monitoring locations in Australia. These data were collected
as part of a project aimed at developing a Threatened Species Index
Figure 10:
33
at the national level. Panama, Taiwan and the Russian Federation
The cumulative number of also contributed a considerable number of species. The remainder
population time-series in the LPI are species from tropical areas as data collection was focused there
database and number of species
in each Living Planet Report since to improve representation. A list of the new species can be found
2006. WWF/ZSL (2020) 22. here: http://stats.livingplanetindex.org/.
24,000
2020
22,000 4,392 species
20,000
18,000
Number of populations
16,000
2018
14,000 4,005 species
12,000
2010
2,544 species 2016
10,000 3,706 species
8,000 2008
1,686 species 2014
6,000 3,038 species
2012
2,688 species
4,000
2006
2,000 1,313 species
0
© WWF / Lutz Obelgonner
2006 2007 2008 2009 2010 2011 2012 2013 2014 2015 2016 2017 2018 2019 2020 2021
WWF LIVING PLANET REPORT 2020 28 A DEEP DIVE INTO THE LPI 29Realm Class No. of spe-
cies known
No. of
species in
No. of
species in
Diff # % repre-
sentation
% repre-
sentation
Difference
in repre-
Where do the data used in the LPI come from?
to science LPR 2018 LPR 2020 LPR 2018 LPR 2020 sentation
Across the globe, wild animals are counted for a variety of
Afrotropical Amphibia 777 4 4 0 1% 1% 0,0%
different reasons. If such monitoring is done over multiple years
Aves 2,294 124 139 15 5% 6% + 0,7%
in a particular area, the change in population sizes can be used to
Fishes 2,875 51 51 0 2% 2% 0,0% establish whether, on average, the abundance of monitored species
Mammalia 1,173 127 131 4 11% 11% + 0,3% has increased, decreased or stayed the same. This abundance
Reptilia 1,703 14 16 2 1% 1% + 0,1% change information is taken from the Living Planet database, which
Australasia Amphibia 532 15 19 4 3% 4% + 0,8% comprises time-series of either population size, density, abundance
& Oceania Aves 1.927 181 194 13 9% 10% + 0,7%
or a proxy of abundance of any vertebrate species in any location.
Data can be included only if a measure of population size is
Fishes 479 13 11 -2 3% 2% - 0,4%
available for at least two years, information is available on how the
Mammalia 699 29 53 24 4% 8% + 3,4%
data were collected, what the units of measurement were, and the
Reptilia 271 49 52 3 18% 19% + 1,1% geographic location of the population. The data must be collected
Indo-Malaya Amphibia 787 11 11 0 1% 1% 0,0% using the same method on the same population throughout the
Aves 2,017 110 115 5 5% 6% + 0,2% time-series, and the data source must be referenced and traceable.
Fishes 2,103 5 4 -1 0% 0% 0,0% Time-series information for the LPI is currently collated from more
than 3,000 individual data sources such as published scientific
Mammalia 940 78 90 12 8% 10% + 1,3%
literature, online databases and grey literature.
Reptilia 1,440 10 13 3 1% 1% + 0,2%
Nearctic Amphibia 267 78 80 2 29% 30% + 0,7% While an LPI can be calculated using data from any species, the
Aves 725 497 495 -2 69% 68% - 0,3% current approach focuses only on vertebrate species (i.e. birds,
Fishes 791 117 128 11 15% 16% + 1,4% mammals, fish, amphibians and reptiles) because these are groups
that have been monitored more consistently and for longer.
Mammalia 481 110 116 6 23% 24% + 1,2%
Reptilia 472 63 65 2 13% 14% + 0,4%
Are extinct species included in the LPI?
Neotropical Amphibia 2,322 61 150 89 3% 6% + 3,8%
Aves 3,890 359 363 4 9% 9% + 0,1%
Fishes 4,909 125 134 9 3% 3% + 0,2%
Mammalia 1,282 105 107 2 8% 8% + 0,2% Yes, although there are very few. For example, the golden toad
Reptilia 2,557 39 46 7 2% 2% + 0,3% (Incilius periglenes) is listed as Extinct on the IUCN Red List of
Threatened Species, as extensive searches have not managed to
Palearctic Amphibia 376 17 25 8 5% 7% + 2,1%
locate any individuals since 1989. In the LPI, the last recorded
Aves 1,575 361 394 33 23% 25% + 2,1%
survey data is included, which documents the decline of this
Fishes 1,681 54 73 19 3% 4% + 1,1% species 34. If some individuals of a species are alive only in captivity,
Mammalia 906 118 131 13 13% 14% + 1,4% then the species is assessed as Extinct in the Wild on the Red List.
Reptilia 790 26 27 1 3% 3% + 0,1% This is the case for the Guam rail (Hypotaenidia owstoni), for
which there is also data in the LPI. This species declined because
Table 3: of predation from an introduced brown tree-snake on the island of
Changes in the number of terrestrial and freshwater species for different taxonomic
groups within each realm between LPR 2018 and 2020. Note that in some cases there Guam. A captive population of the Guam rail exists in a snake-proof
was no change in representation (0%) or the change in presentation was negative, enclosure on the island.
because of taxonomic changes (where multiple species were grouped into one, the
total number of species for that group represented in the LPI has decreased).
WWF/ZSL (2020) 22.
WWF LIVING PLANET REPORT 2020 30 A DEEP DIVE INTO THE LPI 31CALCULATING THE LPI
● The species trends are then averaged to obtain an
overall trend. A type of average known as the geometric mean
is used, which has been shown to be particularly suitable for
assessing relative change in population sizes 28,36. In cases where
How is the LPI calculated?
the amount of data is large enough, for example for the global
LPI, the averaging process is adjusted to account for the fact that
species and monitoring programmes are not evenly distributed
across the globe. The LPI method then takes into account how
The global LPI is calculated based on 20,811 population time-
much of the world’s vertebrate biodiversity the species in the
series of 4,392 species which are gathered from a variety of
LPI represent by giving most weight within a biogeographic
sources. For each population, the rate of change from one year
realm to the most species-rich group 27. This means that not all
to the next is calculated. If the data available are from only a
of the weight is placed on the groups for which there is more
few, non-consecutive years, a constant annual rate of change in
information in the database (although this could be the case in
the population is assumed between each data year. Where data
well-monitored areas). For most realms, fish are given the most
are available from many years (consecutive or not) a curve is
weight (around a third), followed by reptiles and amphibians
plotted through the data points using a statistical method called
(around a third) and birds (around a quarter), and finally
generalized additive modelling. Average annual rates of change in
mammals (less than a fifth). Each realm is then given a weighting
populations of the same species are aggregated to the species level
depending on its species richness to give an overall trend for
and then higher levels 35. The higher-level aggregation is based
each realm.
on a weighting system that takes into account species richness to
address certain geographic and taxonomic biases in the LPI data ● The averaging and weighting is done separately for
set 27. This weighted approach is described in more detail below. populations occurring in the three systems (terrestrial,
freshwater and marine), which are then equally
weighted to obtain one set of interannual change values.
A deeper dive: A step-by-step guide to ● These values are then turned into the global index by
calculating an LPI
setting the value to 1 in 1970 and relating each change
to this baseline. Confidence limits are calculated around these
values which describe how certain we are about the index value
An LPI is calculated in multiple steps: in any given year relative to 1970. The baseline year and the
cut-off year are chosen because not enough information is
● First, each population’s size is modelled over time available before 1970 or after 2016 to produce a robust and
and the population size in any year compared to meaningful index.
the population size in the previous year. The original
abundance values are logged, so that differences between years
describe a relative rather than an absolute change. This means
that we can combine information from populations with different
measures of abundance and different numbers of individuals.
● In each year, these interannual change values are
averaged across all populations of a species to give an
overall trend for that species.
WWF LIVING PLANET REPORT 2020 32 A DEEP DIVE INTO THE LPI 33Why does the LPI use a weighted
approach?
The LPI contains data for 4,392 out of more than 62,000 vertebrate
species that have been described globally (Figure 11). There is no
‘perfect’ LPI which has data for all species from all over the world.
The challenge therefore is to represent all 62,000 described species
using those for which data are available. One way to address this
problem is to collect more data and improve the taxonomic and
geographic coverage of the dataset. This was the approach taken
until LPR 2012.
Figure 11: 35000
Number of species represented
How do the LPI weightings work?
in the LPI versus number of 30000 Figure 12:
species known to science in
Map showing the locations of the
each taxonomic group. 25000 populations in the LPI monitored
Number of species
WWF/ZSL (2020) 22.
in specific locations. Newly added
20000 populations since the last report
The higher-level aggregation in the LPI is based on a weighting
are highlighted in orange, or in
15000 system that takes into account species richness to account for red for species new to the LPI.
certain geographic and taxonomic biases in the data set 27. The WWF/ZSL (2020) 22.
10000 greater the number of species for a given group within a realm, the
Key
5000
more weight given to the population trends of those species. For
15% 12% 2% 4%
5% example, fish species represent the largest proportion of vertebrate New species
0 species in both freshwater and marine biogeographic realms, so New populations
Birds Mammals Reptiles Amphibians Fish
this group is given most weight in the index calculation for these Existing data
Class two realms. In the terrestrial realms, reptiles and amphibians are
the largest vertebrate group in the tropical realms (Afrotropical,
A second approach is to make the indicator more representative of Neotropical, Indo-Pacific), whereas birds are the largest group in
vertebrate biodiversity by accounting for the estimated diversity the temperate realms (Nearctic, Palearctic).
of species globally. Because the LPI dataset is not uniformly
This diversity-weighted (‘LPI-D’) method provides a means of
distributed across regions and species (Figure 12), a new approach
reducing bias in groups such as temperate birds, which have
is being employed to calculate indices that reflect the number and
previously dominated some of the global and regional LPIs. As an
distribution of vertebrate species in the world. The LPI-D
example, there are 442 terrestrial Palearctic species in the LPI, of
method 27 involves a system of weighting that reflects the actual
which 67% are birds, 27% are mammals, and 6% are reptiles and
proportions of species found in each taxonomic group and realm.
amphibians. The unweighted LPI-U method would have weighted
These proportions allow the index to be weighted accordingly
each group in these proportions. The LPI-D method reflects the
and are presented on the next page.
proportion of species that should be found in each group. This gives
43% of the weight to bird species, 32% to reptiles and amphibians
and 25% to mammals. In other words, the LPI-D method gives
reptiles and amphibians more weight, and birds and mammals less
weight, to better reflect the actual diversity of species.
The global LPI is an average of the terrestrial, freshwater and
marine LPIs, giving an equal weight to each.
WWF LIVING PLANET REPORT 2020 34 A DEEP DIVE INTO THE LPI 35How are different LPIs calculated? Adding other groups such as insects, targeting data gaps and
exploring how the LPI responds under different future scenarios
will help us to build a more comprehensive picture of how
System LPIs, such as the Freshwater LPI presented in the report, biodiversity is changing and what actions we can take to bend the Tree frog in the rain,
are calculated by first producing realm indices using the LPI-D curve of biodiversity loss. Manu National Park, Peru.
method as described above. The system LPIs are then calculated
using a weighted average of the realm LPIs for that system.
The values for the weighting are equivalent to the proportion of
vertebrate species each realm contains compared to the estimated
total number of vertebrate species for that system. For example, the
Neotropics carry the most weight and the Nearctic the least in the
freshwater LPI because more species occur in the former.
The indices for IPBES regions shown in the report are also
calculated using a weighted approach, according to the number of
species included in each taxonomic group within each region.
Addressing challenges and improving
the LPI
In order to continue improving the global representation of the
LPI, targeting geographic gaps in the data is an ongoing priority.
Part of this process will be accelerated through the use of a recently
developed automated tool. This tool is able to detect data sources
which are likely to contain population trends, therefore speeding up
the process of finding new data.
Machine learning can also help us start to understand how
populations might respond to predicted changes in climate and
land-use (this is explored more in one of the LPR 2020 ‘deep
dive’ reports - Too hot to handle: a deep dive into biodiversity
in a warming world). The LPI shows population trends in the
recent past, from 1970 to almost the present day. This helps us
to understand what has happened and why, but doesn’t inform
us on how different solutions might benefit wildlife in the future.
Moving from explaining recent trends in nature, to predicting what
might happen to the LPI under different policies and management
strategies, is the next stage in development as we try to bend the
curve of biodiversity loss.
Efforts are also underway to incorporate data on invertebrates,
starting with insects (Chapter 1). The LPI contains data only for
vertebrate species, as these have been better monitored historically.
However, as vertebrates only represent 3% of all known species, we Image from the Our Planet series, © Paul Stewart / Netflix / Silverback
know we might not be getting the full picture.
WWF LIVING PLANET REPORT 2020 36 A DEEP DIVE INTO THE LPI 3718 IPBES. (2019). Global assessment report on biodiversity and ecosystem
REFERENCES
services of the Intergovernmental Science-Policy Platform on Biodiversity and
Ecosystem Services. IPBES secretariat, Bonn, Germany.
19 Ament, J. M., Collen, B., Carbone, C., Mace, G. M., and Freeman, R. (2019).
Compatibility between agendas for improving human development and wildlife
conservation outside protected areas: Insights from 20 years of data. People and
Nature 1:305-316. doi: 10.1002/pan3.10041.
20 IUCN. (2019). The IUCN Red List of Threatened Species. Version 2019-3.
1 Collen, B., McRae, L., Deinet, S., De Palma, A., Carranza, T., et al. (2011).
.
Predicting how populations decline to extinction. Philosophical Transactions
21 Böhm, M., Collen, B., Baillie, J. E. M., Bowles, P., Chanson, J., et al. (2013). The
of the Royal Society B: Biological Sciences 366:2577-2586. doi: doi:10.1098/
conservation status of the world’s reptiles. Biological Conservation 157:372-385.
rstb.2011.0015.
doi: 10.1016/j.biocon.2012.07.015.
2 Hardesty-Moore, M., Deinet, S., Freeman, R., Titcomb, G. C., Dillon, E. M., et al.
22 WWF/ZSL. (2020). The Living Planet Index database. .
system and taxonomy shape the vulnerability of migratory species. Philos Trans
23 IPBES. (2018). Summary for policymakers of the regional assessment report on
R Soc Lond B Biol Sci 373 doi: 10.1098/rstb.2017.0017.
biodiversity and ecosystem services for the Americas of the Intergovernmental
3 McRae, L., Böhm, M., Deinet, S., Gill, M., and Collen, B. (2012). The Arctic
Science-Policy Platform on Biodiversity and Ecosystem Services. Rice, J.,
Species Trend Index: Using vertebrate population trends to monitor the
Seixas, C. S., Zaccagnini, M. E., Bedoya-Gaitán, M., Valderrama, N., et al. editors.
health of a rapidly changing ecosystem. Biodiversity 13:144-156. doi:
Intergovernmental Science-Policy Platform on Biodiversity and Ecosystem
10.1080/14888386.2012.705085.
Services. IPBES Secretariat, Bonn, Germany.
4 Galewski, T., Collen, B., McRae, L., Loh, J., Grillas, P., et al. (2011). Long-term
24 IPBES. (2018). Summary for policymakers of the regional assessment report
trends in the abundance of Mediterranean wetland vertebrates: From global
on biodiversity and ecosystem services for Europe and Central Asia of the
recovery to localized declines. Biological Conservation 144:1392-1399. doi:
Intergovernmental Science-Policy Platform on Biodiversity and Ecosystem
10.1016/j.biocon.2010.10.030.
Services. Fischer, M., Rounsevell, M., Torre-Marin Rando, A., Mader, A., Church,
5 Saha, A., McRae, L., Dodd, C. K., Gadsden, H., Hare, K. M., et al. (2018). Tracking
A., et al. editors. Intergovernmental Science-Policy Platform on Biodiversity and
global population trends: Population time-series data and a Living Planet Index
Ecosystem Services. IPBES Secretariat, Bonn, Germany.
for reptiles. Journal of Herpetology 52:259-268, 210.
25 IPBES. (2018). Summary for policymakers of the regional assessment report on
6 Deinet, S., Ieronymidou, C., McRae, L., Burfield, I. J., Foppen, R. P., et al. (2013).
biodiversity and ecosystem services for Africa of the Intergovernmental Science-
Wildlife comeback in Europe: The recovery of selected mammal and bird
Policy Platform on Biodiversity and Ecosystem Services. Archer, E., Dziba, L.
species. Final report to Rewilding Europe by ZSL, BirdLife International and the
E., Mulongoy, K. J., Maoela, M. A., Walters, M., et al. editors. Intergovernmental
European Bird Census Council. ZSL, London, UK.
Science-Policy Platform on Biodiversity and Ecosystem Services. IPBES
7 Craigie, I. D., Baillie, J. E., Balmford, A., Carbone, C., Collen, B., et al. (2010).
Secretariat, Bonn, Germany.
Large mammal population declines in Africa’s protected areas. Biological
26 IPBES. (2018). Summary for policymakers of the regional assessment
Conservation 143:2221-2228. doi: 10.1016/j.biocon.2010.06.007.
report on biodiversity and ecosystem services for Asia and the Pacific of the
8 Barnes, M. D., Craigie, I. D., Harrison, L. B., Geldmann, J., Collen, B., et al.
Intergovernmental Science-Policy Platform on Biodiversity and Ecosystem
(2016). Wildlife population trends in protected areas predicted by national socio-
Services. Karki, M., Senaratna Sellamuttu, S., Okayasu, S., Suzuki, W., Acosta,
economic metrics and body size. Nature Communications 7:12747. doi: 10.1038/
L., et al. editors. Intergovernmental Science-Policy Platform on Biodiversity and
ncomms12747.
Ecosystem Services. IPBES Secretariat, Bonn, Germany.
9 Costelloe, B., Collen, B., Milner-Gulland, E. J., Craigie, I. D., McRae, L., et al.
27 McRae, L., Deinet, S., and Freeman, R. (2017). The Diversity-Weighted Living
(2016). Global biodiversity indicators reflect the modeled impacts of protected
Planet Index: Controlling for taxonomic bias in a global biodiversity indicator.
area policy change. Conservation Letters 9:14-20. doi: 10.1111/conl.12163.
PLOS ONE 12:e0169156. doi: 10.1371/journal.pone.0169156.
10 Geldmann, J., Coad, L., Barnes, M. D., Craigie, I. D., Woodley, S., et al. (2018).
28 Buckland, S. T., Studeny, A. C., Magurran, A. E., Illian, J. B., and Newson, S.
A global analysis of management capacity and ecological outcomes in terrestrial
E. (2011). The geometric mean of relative abundance indices: A biodiversity
protected areas. Conservation Letters 11:e12434. doi: 10.1111/conl.12434.
measure with a difference. Ecosphere 2:art100. doi: 10.1890/es11-00186.1.
11 Spooner, F. E. B., Pearson, R. G., and Freeman, R. (2018). Rapid warming
29 Gregory, R. D., Skorpilova, J., Vorisek, P., and Butler, S. (2019). An analysis of
is associated with population decline among terrestrial birds and mammals
trends, uncertainty and species selection shows contrasting trends of widespread
globally. Global Change Biology 24:4521-4531. doi: 10.1111/gcb.14361.
forest and farmland birds in Europe. Ecological Indicators 103:676-687. doi:
12 Tierney, M., Almond, R., Stanwell-Smith, D., McRae, L., Zöckler, C., et al. (2014).
https://doi.org/10.1016/j.ecolind.2019.04.064.
Use it or lose it: Measuring trends in wild species subject to substantial use. Oryx
30 Wauchope, H. S., Amano, T., Sutherland, W. J., and Johnston, A. (2019). When
48:420-429. doi: 10.1017/S0030605313000653.
can we trust population trends? A method for quantifying the effects of sampling
13 Green, E., McRae, L., Harfoot, M., Hill, S., Simonson, W., et al. (2019). Below the
interval and duration. Methods in Ecology and Evolution 10:2067-2078. doi:
canopy: Plotting global trends in forest wildlife populations. WWF-UK.
10.1111/2041-210x.13302.
14 Butchart, S. H. M., Walpole, M., Collen, B., van Strien, A., Scharlemann, J. P.
31 Newbold, T., Hudson, L. N., Hill, S. L. L., Contu, S., Lysenko, I., et al. (2015).
W., et al. (2010). Global Biodiversity: Indicators of Recent Declines. Science
Global effects of land use on local terrestrial biodiversity. Nature 520:45-50. doi:
328:1164-1168. doi: 10.1126/science.1187512.
10.1038/nature14324.
15 Tittensor, D. P., Walpole, M., Hill, S. L. L., Boyce, D. G., Britten, G. L., et al.
32 Martin, P. A., Green, R. E., and Balmford, A. (2019). The biodiversity intactness
(2014). A mid-term analysis of progress toward international biodiversity targets.
index may underestimate losses. Nature Ecology & Evolution 3:862-863. doi:
Science 346:241-244. doi: 10.1126/science.1257484.
10.1038/s41559-019-0895-1.
16 van Strien, A. J., Meyling, A. W. G., Herder, J. E., Hollander, H., Kalkman, V. J.,
33 TSX. (2018). The Australian Threatened Species Index. Aggregated for National
et al. (2016). Modest recovery of biodiversity in a western European country: The
Environmental Science Program Threatened Species Recovery Hub Project 3.1.
Living Planet Index for the Netherlands. Biological Conservation 200:44-50.
Generated on 14/11/18. .
doi: 10.1016/j.biocon.2016.05.031.
34 Crump, M. L., Hensley, F. R., and Clark, K. L. (1992). Apparent decline
17 WWF-Canada. (2017). Living Planet Report Canada. .
10.2307/1446201.
WWF LIVING PLANET REPORT 2020 38 A DEEP DIVE INTO THE LPI 39You can also read