NATIONAL DRUG REPORT - Gouvernement.lu

Page created by Reginald Anderson
 
CONTINUE READING
NATIONAL DRUG REPORT - Gouvernement.lu
EN

                NATIONAL DRUG REPORT
                                    2019                (OVERVIEW)

         THE DRUG PHENOMENON
  IN THE GRAND DUCHY OF LUXEMBOURG:
       TRENDS AND DEVELOPMENTS
                                      Authors:
               Nadine Berndt, PhD • Rita Seixas, PhD • Alain Origer, PhD

With the support of the European Monitoring Centre for Drugs and Drug Addiction (EMCDDA)
    and the Réseau National d’Information sur les Stupéfiants et les Toxicomanies (RELIS)

                                      January 2020

            LE GOUVERNEMENT DU GRAND-DUCHÉ DE LUXEMBOURG
    Ministère de la Santé • Direction de la santé • Service épidémiologie & statistiques
                           Point Focal Luxembourgeois de l’OEDT

          Bâtiment Greenfinch - 20, rue de Bitbourg - L-1273 Luxembourg-Hamm
           www.relis.lu • www.sante.public.lu • www.gouvernement.lu
NATIONAL DRUG REPORT - Gouvernement.lu
1. DRUG POLICY
    THE DRUG PHENOMENON IN THE GRAND-DUCHY
    OF LUXEMBOURG: TRENDS AND DEVELOPMENTS                                                 2019
                     This factsheet presents an overview of the drug phenomenon in Luxem-
                     bourg, covering drug policy, drug supply and demand, drug use patterns,
                     health consequences and responses, as well as drug markets and crime.
                     The statistical data reported relate to 2018 or the most recent year for
                     which data are available and were provided to the Luxembourg Focal Point
                     of the EMCDDA (PFLDT) by the RELIS network, unless stated otherwise.

                 Drug policy                                                                    3

                 Prevalence, patterns and developments in drug use                              7

                 Drug-related harms and health consequences                                  23

                 Responses to health consequences                                            27

                 Drug markets and crime                                                      37

                 Acknowledgements and COI statement                                          44

                 List of abbreviations                                                       44

                 References                                                                  45

2   The drug phenomenon in the Grand-Duchy of Luxembourg: trends and developments - 2019            The drug phenomenon in the Grand-Duchy of Luxembourg: trends and developments - 2019   3
NATIONAL DRUG REPORT - Gouvernement.lu
1. DRUG POLICY
          1.1. NATIONAL DRUG STRATEGY
          The National Strategy and Action Plan on Drugs and Addictions is based on a holistic approach and addresses
          illicit drugs, alcohol, tobacco, psychotropic drugs and behavioural addictions. It is built on two pillars; namely,
          drug demand and drug supply reduction, and four cross-cutting themes: harm reduction, research and infor-
          mation, international cooperation and coordination. Its overall objective is to contribute to achieve a high level
          of protection in terms of public health, public security and social cohesion. This overall objective relies on six
          sub-objectives across the strategy’s pillars and transversal axes.

          The National Strategy and Action Plan on Drugs and Addictions 2015-19 aimed to contribute to preventing drug
          use and addictive behaviours, developing and maintaining diversity and quality in care and treatment offers,
          and reducing drug use prevalence among the general population and high risk drug use, as well as minimising
          the negative health and social consequences generated by illicit drug use and drug trafficking. The Action Plan’s
          priorities include universal, indicated and selective prevention, diversification and decentralisation of care
          provision, the further development of substitution treatment, specific care for ageing drug users, supervised
          housing offers, the fight against infectious diseases among drug users and responses to new psychoactive
          substances (Ministère de la Santé, 2015).

          Luxembourg evaluates its drug policy and strategy by means of routine indicators’ monitoring and specific
          research projects. An external mixed-methods evaluation of the 2015-19 national strategy’s implementation
          was performed in 2019 and its outcome has been used in the development of the new National Strategy and
          Action Plan on Drugs and Addictions 2020-24.

          1.2. LEGAL PENALTIES FOR PERSONAL DRUG POSSESSION AND USE
                                                                                                                                                                     For any minor drug possession        Not for minor cannabis passession, but for other possession
          In 2001, cannabis use and possession for personal use were decriminalised at the national level and are now
                                                                                                                                                                     Not for minor drug possession
          punishable only by a fine. Prison sentences are foreseen in case of aggravating circumstances (e.g. use in schools
          or in the presence of minors). Penalties for possession and use of controlled substances other than cannabis                                                     FIGURE 1. Legal penalty of incarceration foreseen for possession
          include imprisonment between 8 days and 6 months and/or a fine. Prosecution may be halted or penalties                                                              of drugs for personal use (minor offence) (EMCDDA, 2019)
          reduced if a drug user has taken steps to seek specialised help.

          The national legislation does not differentiate between small-scale and large-scale drug deals or distribution.              1.3. NEW DEVELOPMENTS REGARDING CANNABIS FOR MEDICAL
          Sentences for both currently range from 1 to 5 years’ imprisonment and/or a fine, while a prison sentence of                      AND NON-MEDICAL PURPOSES
          5-10 years can be imposed if the distributed drug has caused severe damage to health. If the drugs have fatal
          consequences for the user, punishment for the distributor can be increased to 15-20 years’ imprisonment.                     CANNABIS FOR MEDICAL PURPOSES
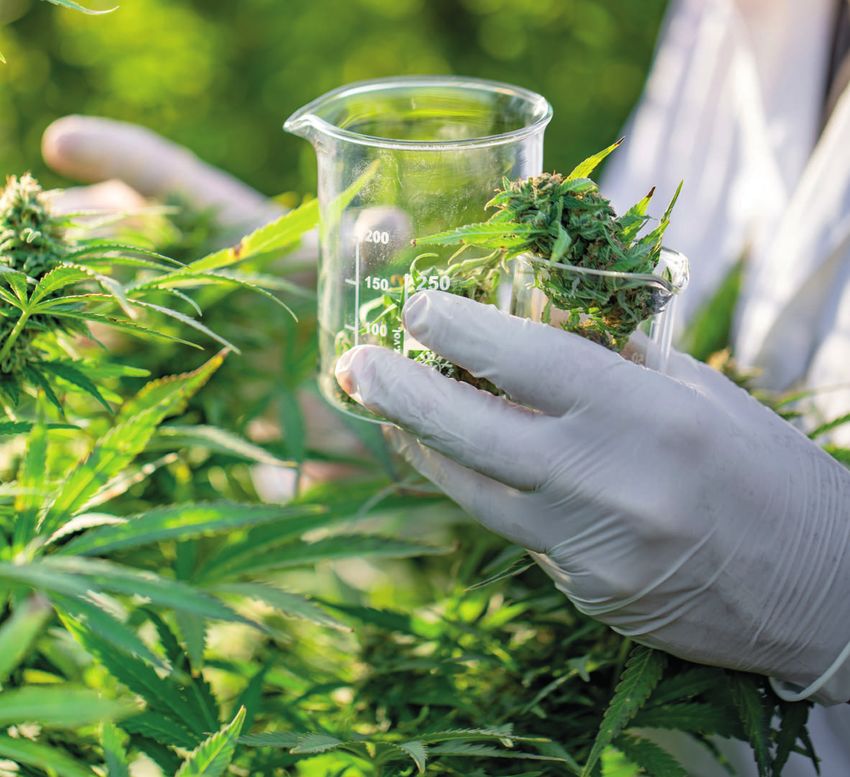
                                                                                                                                       Legal access to cannabis for medical purposes has been regulated in the Grand-Duchy of Luxembourg in 2018.
          New psychoactive substances (NPS) are regulated and controlled by the same legal instruments as other                        The respective law (« Loi du 20 juillet 2018 modifiant la loi modifiée du 19 février 1973 concernant la vente de
          controlled substances.                                                                                                       substances médicamenteuses et la lutte contre la toxicomanie ») was modified and entered in force on August
                                                                                                                                       1st 2018. The grand-ducal decree (« Règlement grand-ducal du 21 août 2018 déterminant les modalités de
                                                                                                                                       prescription et d’accès à l’usage de cannabis à des fins médicales, ainsi que le contenu et la durée de la forma-
                                                                                                                                       tion spéciale pour les médecins-spécialistes ») defining the medical prescriptions modalities and respective
                                                                                                                                       conditions, as well as the training to be pursued by medical doctors entered into force on September 28th, 20181.

                                                                                                                                1 Règlement grand-ducal du 21 août 2018 déterminant les modalités de prescription et d’accès à l’usage de cannabis à des fins médicales, ainsi que le contenu et
                                                                                                                                  la durée de la formation spéciale pour les médecins-spécialistes et modifiant :
                                                                                                                                  1° le règlement grand-ducal modifié du 19 février 1974 portant exécution de la loi du 19 février 1973 sur la vente des substances médicamenteuses et la lutte
                                                                                                                                  contre la toxicomanie ;
                                                                                                                                  2° le règlement grand-ducal modifié du 18 janvier 2005 déterminant le modèle du carnet à souches prévu à l’article 30-1 de la loi modifiée du 19 février 1973
                                                                                                                                  concernant la vente de substances médicamenteuses et la lutte contre la toxicomanie.

4   The drug phenomenon in the Grand-Duchy of Luxembourg: trends and developments - 2019                                                                                                        The drug phenomenon in the Grand-Duchy of Luxembourg: trends and developments - 2019               5
NATIONAL DRUG REPORT - Gouvernement.lu
REGULATION OF LEGAL ACCESS TO CANNABIS FOR NON-MEDICAL PURPOSES
          By the end of the year 2018, the coalition agreement of the government included a chapter on a future regu-
          lation on legal access to cannabis for non-medical purposes. More specifically, the coalition agreement of the
          government states that the main purposes of regulating legal access to cannabis for non-medical purposes are
          to regulate, under conditions yet to be defined, the domestic production as well as the purchase and possession

                                                                                                                               2. PREVALENCE, PATTERNS
          of cannabis for non-medical use for the personal needs of residents of the Grand-Duchy of Luxembourg who
          have reached the age of majority. The objectives mentioned in the coalition agreement for regulating legal access
          to cannabis for non-medical purposes are to reduce the illicit market, to reduce the psychological and physical
          dangers linked to its use, and to fight crime at the level of supply. The coalition agreement also mentions that
          to this end, a State controlled chain of production and national sales will be set up, guaranteeing the quality of
          legal products. Proceeds from the sale of cannabis will be invested primarily in prevention, health promotion
          and education, and treatment in the broad area of dependence. Discussions and preparations towards regula-
                                                                                                                                    AND DEVELOPMENTS
          ting the legal access to non-medical cannabis are currently ongoing within an interministerial working group.
                                                                                                                                           IN DRUG USE

6   The drug phenomenon in the Grand-Duchy of Luxembourg: trends and developments - 2019                                              The drug phenomenon in the Grand-Duchy of Luxembourg: trends and developments - 2019   7
NATIONAL DRUG REPORT - Gouvernement.lu
2. PREVALENCE, PATTERNS AND DEVELOPMENTS IN DRUG USE
          2.1. DRUG USE IN THE GENERAL POPULATION
                                                                                                                                                       � As regards the total population, LTP (15-64y) of cannabis use is 23.3% revealing that the consumption of
          Drug use among the general population in Luxembourg is measured through the cross-sectional                                                    this substance is below the EU average (EMCDDA, 2019). Current (LMP) and recent (LYP) cannabis use are
          population-based survey “European Health Interview Survey (EHIS)”. A module covering the topic of illicit and                                  more common among adolescents (15-18y) and young adults (15-34y) (Figure 2).
          NPS has been added by the EMCDDA Luxembourg Focal Point (PFLDT). This non-mandatory module allows to                                         � Recent cannabis consumption (LYP) among young adults (15-34y) situates at 9.8%, also markedly below the
          assess the lifetime prevalence (LTP), the last year prevalence (LYP) and the last month prevalence (LMP) of use                                EU average of 14.4% (EMCDDA, 2019) (Figure 2). For each prevalence rate, consumption is more common
          of several illicit drugs. The EHIS is implemented in all European Union (EU) Member States and is conducted                                    among men then among women (Figure 3).
          every five years according to the Regulation 1338/2008 on Community statistics on public health and health                                   � First use of cannabis occurs on average around the age of 19 years, and first use of cocaine occurs around
          and safety at work. The data presented below are based on the 2014 EHIS wave. The target for illicit and NPS’                                  the age of 25 years (EHIS, 2014 – Origer et al., 2016).
          use was the general population aged 15-64 years, and a total number of 3,421 valid questionnaires from res-
          pondents of this age category could be retained. The most recent wave of the survey was conducted in 2019.                                   OTHER ILLICIT DRUGS USE
          Results will be available by the end of 2020.                                                                                                Lifetime use (at least once in a lifetime)

          OVERVIEW
          � Cannabis is the most commonly used drug nationally. It is used at least once a year by 4.9% of the total po-                                                  3%

            pulation (15-64y), by 9.8% when considering young adults (15-34y) and by 11.1% when considering young
                                                                                                                                                                      2,5%
            scholars (15-18y) (Figure 2).
          � Following cannabis, cocaine is the most prevalent drug among the general population (15-64y): 2.5% used it                                                    2%

            at least once in their lifetime, 0.4% used it at least once during the last year and 0.2% during the last month.
                                                                                                                                                                      1,5%
            Amphetamines (ATS) and ecstasy/MDMA (XTC) use is also prevalent, particularly among young adults (15-34y),
            while hallucinogens (LSD2 and magic mushrooms) are preferred among adolescents (15-18y) (Figures 4, 5).                                                       1%

          � In Luxembourg, illicit drug use in the general population is below the EU average for all the substances.                                                 0,5%

          CANNABIS USE                                                                                                                                                    0%
                                                                                                                                                                                        Age group 15-18                       Age group 15-34                      Age group 15-64

             35%                                                                    45%        42.4%                                                               XTC                        0%                                    2.2%                                 1.9%
                              31.8%
                                                                15-64 years         40%                                            Female
             30%                                                                                                                                                   ATS                        0%                                     1%                                  1.6%
                                                                15-34 years                                                        Male
                                                                                    35%              31.8%
              25%                                               15-18 years                                                        Total
                         23.3%
                                                                                    30%                                                                        Cocaine                        0%                                    2.1%                                 2.5%
             20%                                                                    25%
                                                                                           24.4%

                                  16.4%                                                                                                                         Heroin                        0%                                    0.2%                                 0.6%
              15%                                                                   20%
                                                        11.1%                       15%                             14.3%                                   Mushrooms                        0.6%                                   2.2%                                 2.2%
                                                 9.8%
              10%
                                                                                                                            9.8%
                                                                                    10%                                                                                                      0.6%                                   0.9%                                 1.5%
                                          4.9%                                                               6.6%                          6.7%                    LSD
               5%                                                       4%
                                                                             4.7%   5%                                                            4%
                                                                 2.2%                                                               2.1%
                                                                                                                                                          Solvents/glue                       0%                                    0.5%                                 0.6%
               0%                                                                   0%
                           Life-time      12 months                30 days                     LTP                  LYP                    LMP
                          prevalence      prevalence              prevalence                                                                                      NPS                         0%                                    0.7%                                 0.5%

                      FIGURE 2. Lifetime (LTP), last year (LYP)                               FIGURE 3. LTP, LYP and LMP                                                       FIGURE 4. Lifetime prevalence (LTP) of illicit drugs’ use by age groups (valid %)
                    and last month (LMP) prevalence of cannabis                            of cannabis use by gender (valid %)                                                                       (EHIS, 2014 - Origer et al., 2016)
                             use by age groups (valid %)                                    (EHIS, 2014 - Origer et al., 2016)
                          (EHIS, 2014 - Origer et al., 2016)
                                                                                                                                                       � After cannabis, cocaine is the most prevalent drug – used by 2.5% of the general population at least once in
                                                                                                                                                         their lifetime. Other hallucinogens such as magic mushrooms are also prevalent (2.2%).
                                                                                                                                                       � Young adults (aged 15-34y) use preferably magic mushrooms and ecstasy/MDMA followed by cocaine.
                                                                                                                                                       � Among adolescents (aged 15-18y), other drugs besides cannabis are not or only marginally used (magic
                                                                                                                                                         mushrooms and LSD) (Figure 4).

    2 LSD = Lysergic acid diethylamide

8   The drug phenomenon in the Grand-Duchy of Luxembourg: trends and developments - 2019                                                                                                                  The drug phenomenon in the Grand-Duchy of Luxembourg: trends and developments - 2019   9
NATIONAL DRUG REPORT - Gouvernement.lu
Recent use (during last year)                                                                                                2.2. DRUG USE AMONG YOUNG SCHOLARS

                      0,70%                                                                                                             Drug use among young scholars is assessed through the representative cross-sectional survey “Health Beha-
                      0,60%                                                                                                             viour in School-Aged Children (HBSC)”, which is conducted every four years – the first in 2006. The University
                      0,50%
                                                                                                                                        of Luxembourg is responsible for the scientific coordination of the HBSC survey in Luxembourg. The data on
                      0,40%
                                                                                                                                        cannabis presented here are derived from the latest HBSC Luxembourg trends report (Heinz, van Duin, Kern, Ca-
                      0,30%
                                                                                                                                        tunda, & Willems, in press). Data on other illicit substances are based on the 2018 National Drug Report (Berndt,
                                                                                                                                        Seixas, & Origer, 2018). Throughout the past four waves of the HBSC survey, 11 to 18 year old adolescents in
                      0,20%
                                                                                                                                        secondary schools were consistently asked if they had ever taken cannabis in their life and in the past 30 days.
                      0,10%
                                                                                                                                        Previous waves of the HBSC survey also addressed the use of other illicit drugs. Whereas a total number of
                         0%
                                    XTC           ATS          Cocaine       Heroin         Mushrooms    LSD    Solvents/glue   NPS     8,732 pupils aged between 11 and 18 participated in 2018 wave of the HBSC survey, the results below present
                                                                                                                                        the prevalence rates of cannabis use among young scholars between the age of 15 and 18 years (n=4,154).

             Age group 15-18         0%            0%            0%            0%            0.60%      0.60%       0%           0%
                                                                                                                                        CANNABIS USE
             Age group 15-34       0.40%         0.10%         0.60%          0.10%          0.20%      0.20%      0.10%        0.30%   � The proportion of 15 to 18 years old scholars who report having used cannabis at least once in their lives (LTP)
             Age group 15-64       0.20%         0.06%         0.40%          0.10%           0.10%     0.10%      0.10%        0.20%     has remained largely stable over time (around 30%) and a slight decrease was observed in 2018 (27%).
                                                                                                                                        � While there was a small decrease in lifetime use (LTP) of cannabis from 2006 to 2018, its current consumption
               FIGURE 5. Last year prevalence (LYP) of illicit drugs’ use by age groups (valid %) (EHIS, 2014 - Origer et al., 2016)      (LMP) increased (Figure 7).

           � Globally (15-64y), cocaine is the most commonly used illicit drug during the last year (0.4%).                                                       35%

           � Young adults (15-34y) tend to use more cocaine (0.6%) than other age groups, followed by ecstasy/MDMA                                                30%
             (0.4%). These prevalence rates are below the EU average – 2.1% for cocaine and 1.7% for ecstasy/MDMA
                                                                                                                                                                  25%
             (EMCDDA, 2019).
           � Among adolescents (15-18y), magic mushrooms (0.6%) and LSD (0.6%) are the most popular drugs besides                                                 20%
             cannabis (Figure 5).
                                                                                                                                                                  15%

           Current use (during last month)                                                                                                                        10%

                                                                                                                                                                   5%
                      0,35%
                      0,30%                                                                                                                                        0%
                                                                                                                                                                               2006                     2010                    2014                    2018
                      0,25%
                      0,20%                                                                                                                  Life-time prevalence (LTP)        30%                      29%                     29%                      27%

                       0,15%                                                                                                               Last month prevalence (LMP)         11%                      11%                      13%                     13%

                      0,10%
                      0,05%                                                                                                                                  FIGURE 7. LTP and LMP of cannabis use among young scholars (15-18y) (valid %)
                                                                                                                                                                                 (HBSC, 2018 - Heinz et al., in press)
                         0%
                                    XTC           ATS          Cocaine       Heroin         Mushrooms    LSD    Solvents/glue   NPS

             Age group 15-18         0%            0%            0%            0%              0%        0%         0%           0%

             Age group 15-34       0.30%           0%          0.30%           0%              0%        0%         0%          0.10%

             Age group 15-64       0.10%         0.03%         0.20%         0.06%             0%       0.03%      0.09%        0.10%

             FIGURE 6. Last month prevalence (LMP) of illicit drugs’ use by age groups (valid %) (EHIS, 2014 - Origer et al., 2016)

           � Besides cannabis, use of other illicit drugs has not been observed among adolescents (15-18y).
           � While cocaine is the most prevalent used drug (0.2%) among the total general population (15-64y) besides
             cannabis, current use of cocaine and ecstasy/MDMA are equally predominant (0.3%) among young adults
             (15-34y) (Figure 6).

10   The drug phenomenon in the Grand-Duchy of Luxembourg: trends and developments - 2019                                                                                             The drug phenomenon in the Grand-Duchy of Luxembourg: trends and developments - 2019   11
NATIONAL DRUG REPORT - Gouvernement.lu
� The proportion of ever (LTP) and current (LMP) cannabis users is slightly higher among boys than among girls.     � Lifetime use of cannabis is less meaningful than recent and current use of cannabis as it covers both experi-
           � For both boys and girls, a slight increase in current (LMP) cannabis use has been observed from 2006 to 2018.       mental and regular use. While there is a mixed picture regarding the use of cannabis, the proportion of young
           � Moreover, while the proportion of boys who ever used cannabis during their lifetime has slightly decreased over     scholars (boys and girls) who claim to use cannabis currently (during the last month) has risen overall.
             the past years, the proportion of girls who ever used cannabis remained largely stable.                           � However, an analysis by age group shows that there has been a shift in age: for both boys and girls, use has
           � In 2018, 10% of girls reported current use of cannabis (LMP) compared to 8% in 2006 (this increase is statisti-     decreased among younger scholars and increased among older ones, respectively (Figures 9, 10).
             cally significant). Among boys a similar increase between 2006 (14%) and 2018 (16%) has been observed (this
             increase is statistically non-significant) (Figure 8).
                                                                                                                                  30               2006
                                                                                                                                                                                                                                                          27%
                                                                                                                                                   2010
                                                                                                                                  25               2014                                                                                             24%
                                                                                                                                                                                                                            22%
                                                  35%                                                                                              2018
                                                                                                                                  20                                                                                                          19%
                                                                                                                                                                                         17%                          17%
                                                  30%
                                                                                                                                                                             15%                          15%
                                                                                                                                   15                                              14%                          14%                     14%
                                                                                                                                             13%
                                                  25%                                                                                                     11%                                  11%
                                                                                                                                                    10%         10%
                                                                                                                                   10
                                                  20%
                                                                                                                                   5
                                                   15%
                                                                                                                                   0
                                                   10%                                                                                        Boys 15 years                   Boys 16 years               Boys 17 years (+)            Boys 18 years (+)

                                                    5%
                                                                                                                                                   FIGURE 9. LMP of cannabis use among boys across different ages (valid %)
                                                    0%
                                                                                                                                                                     (HBSC, 2018 - Heinz et al., in press)
                                                               2006                  2010      2014                2018

                      Life-time prevalence (LTP) boys          34%                   35%        33%                30%

                       Life-time prevalence (LTP) girls        25%                   23%        25%                24%
                                                                                                                                   16              2006
                                                               14%                    14%       17%                16%                                                                                                                                    15%
                   Last month prevalence (LMP) boys
                                                                                                                                   14              2010                                                                     14%

                    Last month prevalence (LMP) girls           8%                    8%        10%                10%                             2014
                                                                                                                                   12              2018                                  11%                                                        11%
                                                                                                                                                                                                                      10%
                       FIGURE 8. LTP and LMP of cannabis use among young scholars (boys and girls) (15-18y) (valid %)              10
                                                                                                                                              9%                                               9%               9%                            9%
                                                   (HBSC, 2018 - Heinz et al., in press)                                           8
                                                                                                                                                                             8%    8%
                                                                                                                                                          7%                                               7%                           7%
                                                                                                                                                    6%          6%
                                                                                                                                   6

                                                                                                                                   4

                                                                                                                                   2

                                                                                                                                   0
                                                                                                                                              Girls 15 years                  Girls 16 years              Girls 17 years (+)            Girls 18 years (+)

                                                                                                                                                         FIGURE 10. LMP of cannabis use among girls across different ages (valid %)
                                                                                                                                                                           (HBSC, 2018 - Heinz et al., in press)

                                                                                                                               � The 2014 survey also enquired if young scholars had used cannabis recently (in the last 12 months; LYP). The
                                                                                                                                 findings of lifetime, recent and current cannabis use across different age groups (13-14y, 15-16y and 17-18y)
                                                                                                                                 are presented in Figure 11.
                                                                                                                               � According to the HBSC 2014, prevalence rates of cannabis use are consistently higher among the older age
                                                                                                                                 groups than among the younger age groups.

12   The drug phenomenon in the Grand-Duchy of Luxembourg: trends and developments - 2019                                                                                      The drug phenomenon in the Grand-Duchy of Luxembourg: trends and developments - 2019   13
NATIONAL DRUG REPORT - Gouvernement.lu
NATIONAL ESTIMATION OF THE NUMBER OF HRDUs
                         40%                                                                                           13-14 years
                                                                                                                       15-16 years
                                                                                                                                            � The annual number of HRDU person-contacts indexed by the national institutions (treatment demand and
                                                       35.7%
                         35%                                                                                                                  law enforcement) figured 5,154 in 2018 (multiple counts included) (5,285 in 2017).
                                                                                                                       17-18 years
                         30%                                                                                                                � According to the last estimation based on incremental OST multiplier method (IOMM), the national prevalence
                                                                                    25.5%                                                     of HRDUs situates around 2,257 persons (prevalence rate: 5.79 per 1000 inhabitants aged 15-64y), which
                         25%
                                                   20.7%
                                                                                                                                              suggests a decreasing trend since 2003. Among the HRDU, 1,738 are high-risk opioid users (OU) (prevalence
                         20%
                                                                                16.5%
                                                                                                                                              rate: 4.46 per 1000 inhabitants aged 15-64y) and 1,467 are injecting drug users (IDUs) (prevalence rate: 3.77
                         15%                                                                                   14.3%                          per 1000 inhabitants aged 15-64y) in Luxembourg (estimation based on RELIS 2015 data - Origer et al., 2017).
                         10%
                                                                                                           10.1%                              � Although HRDU and IDU prevalence rates appear to follow a decreasing trend, some indicators point at an
                                            7.3%
                                                                                                                                                 increasing marginalisation of certain groups of users. Part of the HRDUs may thus not be in contact with
                                                                         4.8%
                          5%                                                                        3.7%
                                                                                                                                                 treatment centres or low-threshold facilities (and perhaps neither with law enforcement).
                          0%
                                             Life-time             Prevalence last 12 months   Prevalence last30 days                       CHARACTERISTICS AND PATTERNS OF USE OF THE HRDUs
                                            prevalence
                                                                                                                                            � During the last 15 years, the average age of the HRDUs in Luxembourg has been around 30 years old. In 2017
                            FIGURE 11. LTP, LYP and LMP rates of cannabis use across different age groups (valid %)                           (most recent data) HRDUs were, on average, 28 years of age which suggests a decrease in the average age
                                                     (HBSC, 2014 – Berndt et al., 2018)
                                                                                                                                              of this group (34y in 2016).
                                                                                                                                            � The majority of the indexed HRDUs are male (88.2% in 2017). The proportion of female HRDUs has followed
           OTHER ILLICIT DRUGS USE                                                                                                            a decreasing trend since the last 10 years (23% in 2007 and 11.8% in 2017).
                                                                                                                                            � The majority of the HRDUs report a stable residence (65.4%), however, a relevant proportion face a homeless
           � Lifetime use of illicit drugs (LTP) other than cannabis has been assessed in the 2006, 2010 and 2014 HBSC
                                                                                                                                              situation (19.6% in 2017). Most of the HRDUs (61.1%) are professionally inactive against a smaller proportion
             waves.
                                                                                                                                              who report a stable (14.9%) or unstable job (5.7%), or to be currently studying (2.3%) (Berndt et al., 2018).
             � LTP of illicit drug use in young scholars (13-18y) decreased between 2006 and 2014 for a great number of
                substances – cocaine (2006: 2.1%; 2014: 1.8%); MDMA (2006: 1.7%; 2014: 1.3%); amphetamines (2006:
                1.6%; 2014: 1.1%); magic mushrooms (2006: 2.1%; 2014: 1.4%); and opioids (2006: 0.9%; 2014: 0.8%)
                                                                                                                                                                                                                                                                                       Opiates
                (Origer, Lopes da Costa, & Diederich, 2008; Origer, Lopes da Costa, Diederich, & Schram, 2012; Berndt et
                                                                                                                                             100%                                                                                                                                      Cocaine
                al., 2018). However, in which regards LSD and “abuse of medication to get high” increases were observed                                                    93%
                                                                                                                                                                                          89%                                                                                          Polydrug use
                                                                                                                                                            87%
                during this period – LSD (2006: 0.7%; 2014: 0.9%); “abuse of medication to get high” (2006: 1.9%; 2014:                                                                                  81%
                                                                                                                                              80%                                                                                                                                76%
                2.5%).                                                                                                                                      84%

                                                                                                                                                                           76%                           76%
           � Regarding recent use (during the last year; LYP) of other illicit drugs, the data available date from the 2006                                                               72%                                                        61%
                                                                                                                                                                                                                                                                                               58%
             and 2010 HBSC waves.                                                                                                             60%                                                                       56%           54%                           54%
                                                                                                                                                                                                                                                                                 61%

             � After cannabis, cocaine was the most prevalent drug used by young scholars (13-18y) – used by 2.1% of                                                                                                    54%           54%
                                                                                                                                                                                                                                                     56%
                                                                                                                                                                                                                                                                                               50%

                the scholars in 2006 and by 1.7% in 2010. Amphetamines, hallucinogens (such as magic mushrooms) and                           40%                                                                                                                   46%

                MDMA use were also reported, although with low prevalence (Origer et al., 2008; 2012).                                                                                                                                                                           22%
                                                                                                                                                                                                                                      20%            19%                                        19%
                                                                                                                                                                                          17%                                                                       17%
                                                                                                                                              20%                          16%
                                                                                                                                                                                                                        12%
                                                                                                                                                                                                         10%
                                                                                                                                                             7%

           2.3. HIGH-RISK DRUG USE                                                                                                              0%
                                                                                                                                                           2000           2004           2008           2010           2012          2014           2015           2016          2017          2018
           Some drug users develop more severe forms of use, defined by the EMCDDA as ‘high-risk drug use’. High-risk
           drug users (HRDUs) are considered those persons whose recurrent drug use is causing actual harms (negative                                         FIGURE 12. Trends in primary drug use among HRDUs during the last 18 years (self-reported)
                                                                                                                                                                                          (RELIS, 2018 – Berndt et al., 2018)
           consequences) to the person (including dependence, but also other health, psychological or social problems)
           or is placing the person at a high probability/risk of suffering such harms (EMCDDA, 2019). Data on HRDU
           originate from the national monitoring system RELIS, which encompasses both treatment demand and law
                                                                                                                                            � Opioids (and heroin in particular) remain the most prevalent drugs among this group – in 2018, 50% of the
           enforcement contact data.
                                                                                                                                              HRDUs used opioids as their primary drug. However, the last years primary opioid consumption has been in
                                                                                                                                              a discontinuous decreasing trend, which contrasts with a slight discontinuous increase in primary cocaine
                                                                                                                                              consumption - 7% in 2000 and 19% in 2018.
                                                                                                                                            � In 2018, 58.2% of the HRDUs reported polydrug use3 (2017: 72.6%; 2016: 54%). Although polydrug use is
                                                                                                                                              very high among HRDUs, it has been witnessing a discontinuous decreasing trend since 2004 (Figure 12).

                                                                                                                                     3 Defined as “the use of at least two illicit drugs and/or NPS either at the same time (concurrent) or one after the other (sequential)”.

14   The drug phenomenon in the Grand-Duchy of Luxembourg: trends and developments - 2019                                                                                                               The drug phenomenon in the Grand-Duchy of Luxembourg: trends and developments - 2019          15
NATIONAL DRUG REPORT - Gouvernement.lu
Heroin
                                                                                                                                                                          2.4. DRUG USE IN SPECIFIC TARGETED GROUPS
             100%               93%
                                                        89%                                                                                        Cocaine
                                                                                                                                                                          DRUG USE IN FESTIVE AND NIGHTLIFE SETTINGS (PIPAPO SURVEY)
                                                                                79%                     78%
                                                                                                                                                   Cocktail
              80%                                                                                                                                                         � Background: Drug use in festive and nightlife settings is analysed yearly by the project ‘Pipapo’ from 4motion
                                                                                                                                67%
                                                                                                                                                                            asbl. A rapid assessment survey is implemented at several festive and nightlife venues in Luxembourg. The
                                                                                                                                                        60%
              60%                                                                                                                                                           main goal is to describe the characteristics of this specific group of users attending these events as well as
                                                                                                                                                                            to follow-up the recreational drug use in festive contexts in Luxembourg.
              40%                                                                                                                                                         � Method: Survey administered by means of a paper-and-pencil questionnaire during festivals and nightlife
                                                                                                                                23%
                                                                                                                                                        28%
                                                                                                                                                                            events. The questionnaire addresses drug use “in the last 2 weeks”.
              20%                                                               13%
                                                                                                        15%                                                               � Sample: Non-representative sample of 2,079 “party goers” in 2018. No exclusion criteria - the survey inquires
                                                                                                                                                        12%

                                 4%
                                                         6%
                                                                                                                                10%
                                                                                                                                                                            all volunteer persons regardless of their drug use. In 2018, the sample consisted of 986 male (47.4%) and
               0%              3%                      5%
                                                                                 9%
                                                                                                         7%                                                                 1,087 female (52.3%) respondents. Few respondents (n=6) reported unknown gender (0.3%). The median
                               2013                    2014                    2015                    2016                    2017                    2018                 age of respondents was 24 years, the youngest respondent had 12 years and the oldest had 74 years. 75.7%
                                                                                                                                                                            of the respondents reported residency in Luxembourg, whereas 14.9% in Germany, 3.7% in Belgium, and
                                    FIGURE 13. Trends in drug use among supervised drug consumption room clients
                                                                (CNDS Abrigado, 2018)                                                                                       3.6% in France.

                                                                                                                                                                                 44.2%
            � Data from the supervised drug consumption room ‘Abrigado’4 confirm RELIS data on the changes regarding                                                       45%
                                                                                                                                                                                                                                                                                                                                                                                                                                                             2018
              the most frequently used drugs: use of heroin is decreasing while use of cocaine and cocktails (“speedball”5)
                                                                                                                                                                                                                                                                                                                                                                                                                                                             2017
              are increasing. Specifically, while in 2013 heroin was used in 93% of consumption episodes, in 2018 this                                                    40%                                                                                                                                                                                                                                                                                2016
              substance was used in only 60% of the consumptions. On the contrary, in 2013 only 4% of the consumption                                                                                                                                                                                                                                                                                                                                        2015

                                                                                                                                                                                         37%
              episodes involved cocaine, while in 2018 this substance was used in 28% of the consumptions (Figure 13).                                                                                                                                                                                                                                                                                                                                       2014

                                                                                                                                                                                               33.7%
                                                                                                                                                                           35%

                                                                                                                                                                                                               32%
                                                                                                                                                   I.V.
                                                                                                                                                                           30%

                                                                                                                                                                                                       27.5%
                                                                                                                                                   Smoke/Inhale
              60%                                                                                       57%
                                                        54%                     54%                                                                Sniff
                                52%
                                                                                                                                                        51%
                                                                                                                                49%                                        25%
              50%
                                42%                                             43%
                                                         41%                                            41%                     47%
                                                                                                                                                        46%
              40%                                                                                                                                                          20%

              30%
                                                                                                                                                                           15%

                                                                                                                                                                                                                                                                                        10.8%
              20%

                                                                                                                                                                                                                     9.3%

                                                                                                                                                                                                                                                        8.5%
                                                                                                                                                                           10%
              10%

                                                                                                                                                                                                                                                                                                6.8%
                                                                                                                                                                                                                            6.6%
                                 6%                      5%

                                                                                                                                                                                                                                   5.8%
                                                                                                                                                                                                                                          5.8%

                                                                                                                                                                                                                                                               6%
                                                                                 3%                                              3%                      3%

                                                                                                                                                                                                                                                 4.9%

                                                                                                                                                                                                                                                                         4.8%

                                                                                                                                                                                                                                                                                                                                                               4.8%
                                                                                                         2%

                                                                                                                                                                                                                                                                                                                     4.7%
                                                                                                                                                                                                                                                                                                              4.6%
                                                                                                                                                                                                                                                                                                       4.3%

                                                                                                                                                                                                                                                                                                                                                                      3.6%
                                                                                                                                                                            5%

                                                                                                                                                                                                                                                                                                                                                                                                3.4%
                                                                                                                                                                                                                                                                                3.3%

                                                                                                                                                                                                                                                                                                                            3.4%
                                                                                                                                                                                                                                                                    4%
               0%

                                                                                                                                                                                                                                                                                                                                                                                                       2.7%
                                                                                                                                                                                                                                                                                                                                   2.7%

                                                                                                                                                                                                                                                                                                                                                                             2.2%
                                                                                                                                                                                                                                                                                                                                                 2.1%
                                                                                                                                                                                                                                                                                                                                          1.9%
                               2013                    2014                    2015                    2016                    2017                    2018

                                                                                                                                                                                                                                                                                                                                                                                         1.8%

                                                                                                                                                                                                                                                                                                                                                                                                              1.6%

                                                                                                                                                                                                                                                                                                                                                                                                                                 1.6%
                                                                                                                                                                                                                                                                                                                                                                                                                                        1.6%
                                                                                                                                                                                                                                                                                                                                                        1.6%

                                                                                                                                                                                                                                                                                                                                                                                                                                                             1.5%
                                                                                                                                                                                                                                                                                                                                                                                    2%

                                                                                                                                                                                                                                                                                                                                                                                                                                                                    0.7%
                                                                                                                                                                                                                                                                                                                                                                                                                                               0.6%
                                                                                                                                                                                                                                                                                                                                                                                                                                                      0.7%
                                                                                                                                                                                                                                                                                                                                                                                                                          0.7%

                                                                                                                                                                                                                                                                                                                                                                                                                                                                                  0.6%

                                                                                                                                                                                                                                                                                                                                                                                                                                                                                                0.6%
                                                                                                                                                                                                                                                                                                                                                                                                                                                                           0.4%

                                                                                                                                                                                                                                                                                                                                                                                                                                                                                         0.4%
                                                                                                                                                                                                                                                                                                                                                                                                                     1%
                                                                                                                                                                            0%
                                     FIGURE 14. Distribution of the HRDU according to their routes of administration (%)                                                                 Cannabis                           Ecstasy                            Speed                            Cocaine                             Psilos                               LSD                       Ketamine                                NPS                             Heroin
                                                                   (CNDS Abrigado, 2018)

                                                                                                                                                                                          FIGURE 15. Proportion of individuals reporting illicit drug use in festivals between 2014 and 2018
            � A gradual modification towards safer routes of administration has been observed and inhalation (chasing) is                                                                                                  (Pipapo survey - Paulos, 2018)
              increasingly frequent (CNDS Abrigado, 2018):
              � In 2018, inhalation was the most frequent route of administration - used by the majority of the supervised
                 drug consumption room clients (51%). 46% of the clients reported injecting and 3% sniff.                                                                 � Cannabis is the most frequently illicit drug used followed by ecstasy/MDMA, amphetamines (ATS/speed)
            � Even though more users adopt the inhalation mode, injecting cocaine is becoming increasingly popular (8%                                                      and cocaine.
              in 2015 to 13% in 2018) (Figure 14).                                                                                                                        � Data suggest an increase in the reported recent use of all the substances except for heroin.
                                                                                                                                                                          � Males tend to report higher consumption than females for all the substances (Figure 15).
     4 Abrigado is a low-threshold centre situated it Luxembourg city managed by the Comité National de Défense Sociale (CNDS). It offers several harm reduction
       measures and includes a supervised injection facility (since 2005) and a supervised drug inhalation facility (blowroom since 2012) allowing for the use of drugs
       through injection, inhalation and sniffing.
     5 Mixture of heroin and cocaine.

16   The drug phenomenon in the Grand-Duchy of Luxembourg: trends and developments - 2019                                                                                                                                                                                              The drug phenomenon in the Grand-Duchy of Luxembourg: trends and developments - 2019                                                                                                                            17
NATIONAL DRUG REPORT - Gouvernement.lu
DRUG USE AMONG RECREATIONAL USERS (EWSD, 2018)                                                                    � Prevalence rates for this targeted sample of last year drug users are, obviously, much higher than those
           � Background: In 2018, the PFLDT participated in the EMCDDA pilot project “European Web Survey on Drugs             observed among the general population:
             (EWSD)” aiming to capture recreational users’ consumption habits, attitudes and perceptions towards drug          � Cannabis and alcohol are the most prevalent substances both in terms of recent and current use.
             use, as well as to improve knowledge on drug markets at national levels.                                          � Cocaine appears as the second most commonly used illicit drug (recently used by 22.4% and currently
           � Methodology: Web-based survey launched in three languages - English, German and French. Data were                   used by 13.9% of the respondents) followed by ecstasy/MDMA (recently used by 21.1% and currently used
             collected between August and September 2018. Participants were recruited via online promotion (Facebook             by 10% of the respondents).
             Adds, Google Display and YouTube), distribution of flyers and posters and by direct personal approach in fes-     � In terms of recent use, other hallucinogens (17.1%) and amphetamines (15.9%) appear also as relevant
             tive and nightlife events. Respondents were selected based on three inclusion criteria: a) aged 18 years-old        drugs, while current use of synthetic cannabinoids (8.6%) deserves attention (Figure 16).
             or above; b) residency in Luxembourg; c) use of at least one illicit drug during the last year.                 � Use of synthetic cannabinoids and NPS are not negligible (data from general population surveys and from
           � Sample: Non-representative sample of 1,223 recreational drug users - mainly young adults between the              police seizures suggest only marginal presence of these substances in Luxembourg). Caution should be taken
             age of 18-34 years (67.4% aged 18-24y and 20.8% aged 25-34y), the majority male (69.1% males; 30.1%               when interpreting these findings since bias related to participants’ conception of NPS cannot be discarded.
             females; 0.8% transgender), and the majority with a secondary or higher education degree (50.1% secondary         Further research is necessary in order to better understand NPS’ use in Luxembourg.
             and 25.2% university). This group of drug users can be described as young recreational users, interested in
                                                                                                                             Gender differences
             festivals/nightlife events and connected to online social networks.
                                                                                                                                                                                                                           82.8%
           Prevalence rates                                                                                                                CANNABIS
                                                                                                                                                                                                                       77.2%

                                                                                                                                                                                                                                  88.2%
                                                                                                                                           ALCOHOL                                                                             83.4%
                                                              LAST YEAR                     LAST MONTH
                                                                                                                                                                                      15.3%
                                                               recent use                    current use                                   COCAINE                              10.1%

                                                                                                                                                                                10.1%
                  ALCOHOL                                               93.2 %                    86.3 %                                   MDMA                                9%

                                                                                                                                                                               9%
                  CANNABIS                                              95.6 %                    81 %                                     OTHER HALLUCINOGENS               6.3%

                                                                                                                                                                              7.7%
                  COCAINE                                               22.4 %                    13.9 %                                   AMPHETAMINES                        9%

                                                                                                                                                                         4.4%
                  MDMA                                                  21.1 %                    10 %                                     LSD                          3%

                                                                                                                                                                              7%
                  SYNTHETIC CANNABINOIDS                                11.4 %                    8.6 %                                    NPS                                     10.6%

                                                                                                                                                                              7.3%
                  OTHER HALLUCINOGENS                                   17.1 %                    8.3 %                                    SYNTHETIC CANNABINOIDS                  11.1%

                                                                                                                                                                        3.7%
                  AMPHETAMINES                                          15.9 %                    8.3 %                                    KETAMINES                    2.7%

                                                                                                                                                                       2.3%
                  LSD                                                   9.6 %                     4.1 %                                    METHAMPHETAMINES            2.4%

                                                                                                                                                                       2.4%
                  KETAMINES                                             7.3 %                     3.6 %                                    OTHER NPS                    2.7%

                                                                                                                                                                       2%
                  OTHER NPS                                             4.7 %                     2.6 %                                    CRACK                       1.6%

                                                                                                                                                                       2.3%
                  METHAMPHETAMINES                                      5%                        2.4 %                                    HEROIN                      2.2%

                                                                                                                                                                       2%
                  HEROIN                                                2.9 %                     2.4 %                                    GHB                         1.9%

                  CRACK                                                                                                                                                1.5%
                                                                        2.8 %                     2%                                       SYNTHETIC OPIOIDS           1.6%
                                                                                                                                                                                                                                 Male
                  GHB                                                   2.5 %                     2%                                       SYNTHETIC CATHINONES
                                                                                                                                                                       1.2%                                                      Female
                                                                                                                                                                       0.8%

                  SYNTHETIC OPIOIDS                                     2.8 %                     1.7 %
                                                                                                                                             FIGURE 17. Gender differences in LMP rates of drug use among the targeted sample
                  SYNTHETIC CATHINONES                                  1.8 %                     1.2 %                                                            (EWSD, 2018 - Berndt & Seixas, 2019)

                             FIGURE 16. LYP (recent) and LMP (current) rates of drug use among the targeted sample           � Concerning gender differences in recreational drug use, EWSD data point out that, on one hand, current
                                                     (EWSD, 2018 - Berndt & Seixas, 2019)                                      use of cocaine (χ2 (1) = 5.922, p
Multiple drugs use                                                                                                                    Market characteristics and consumption habits

                                                                                                14.6%
                                                                                                                                                                          CANNABIS             CANNABIS              COCAINE           AMPHETAMINE              MDMA                 NPS
                                                                                                                                                                           (RESIN)             (HERBAL)              POWDER                                                         HERBAL

                                                                                       16.1%
                   56.3%                                       43.7%                                                           47.6%              Average number
                                                                                                                                                   of days of use-
                                                                                                                                                                            12 DAYS              16 DAYS              5 DAYS               6 DAYS               4 DAYS               14 DAYS
                                                                                                                                                       last month           /MONTH               /MONTH               /MONTH               /MONTH               /MONTH               /MONTH

                                                                                                21.7%                                            Amount (grams or
                                                                                                                                                    units) used on
                              Reported single drug use                                                                                               a typical day
                                                                                Two drugs      Three drugs   Four drugs   Five up to ten drugs                           2.85 JOINTS          2.44 JOINTS             1.18 GR               0.8 GR              0.51 GR              1.75 GR
                              Reported use of multiple drugs

                 FIGURE 18. Proportion of multiple drug users                         FIGURE 19. Distribution of multiple drug users
                        among the targeted sample                                        according to the number of drugs used                   Amount bought on
                                                                                                                                                 a typical purchase
                    (EWSD, 2018 - Berndt & Seixas, 2019)                                 (EWSD, 2018 - Berndt & Seixas, 2019)
                                                                                                                                                      (grams/units)         4.06 GR              4.56 GR              2.45 GR          8.75 TABLETS         4.61 TABLETS            16.69 GR

           � Even though single drug use is predominant, multiple drug use is very common – reported by more than
                                                                                                                                                     Average price
             40% of the respondents. The majority of the multiple drugs users (47.6%) used 2 different drugs during last                          (€ euro per gram
                                                                                                                                                                             14.5 €               16.7 €               64.9 €                7.3 €                8.7 €               10.7 €
             year, a smaller number used 3 (21.7%), 4 (16.1%) or 5 up to 10 (14.6%) different drugs (Figures 18, 19).                                     or tablet            /GR                  /GR                  /GR                /TABLET              /TABLET             /TABLET

                                                                                                                                                                             49.3 %               43.7 %               43.4 %              44.8 %                47.8 %                  -
                                                                                                                                                         % of drug
                                                                                                                                                   typically shared
                                                                                                                                                       with others

                                                                                                                                                                        Bought from dealer   Bought from dealer   Bought from dealer   Bought from dealer   Bought from dealer   Bought from dealer

                                                                                                                                                                                 74.2 %              62.3 %               48.7 %               38.9 %               42.2 %               40.9 %
                                                                                                                                                 How respondents
                                                                                                                                                   get their drugs
                                                                                                                                                     (several answer     Obtained for free    Obtained for free    Obtained for free    Obtained for free    Obtained for free    Obtained for free
                                                                                                                                                    options possible)

                                                                                                                                                                                 43.6 %              47.1 %               42.9 %               54.4 %               46.9 %               40.9 %

                                                                                                                                                                FIGURE 20. Drug market characteristics and consumption habits among the targeted sample
                                                                                                                                                                                         (EWSD, 2018 - Berndt & Seixas, 2019)

                                                                                                                                                 � Cannabis is the most frequently used illicit drug – on average herbal cannabis is used 16 days per month and
                                                                                                                                                   resin is used 12 days per month. Respondents report smoking 2-3 joints of cannabis (herbal or resin) on average
                                                                                                                                                   on a typical day and tend to buy 4 up to 4.6 grams of cannabis (herbal or resin) per purchase.
                                                                                                                                                 � Cocaine is the most expensive drug and amphetamine the cheapest. Users buy on average 2.5 grams of
                                                                                                                                                   cocaine and 9 tablets of amphetamines on a typical purchase.
                                                                                                                                                 � Recreational drug users tend to share with other users almost half of the amount of drugs they buy.
                                                                                                                                                 � Drugs are predominantly obtained through a dealer or for free. Other means of supply are not significantly
                                                                                                                                                   reported (Figure 20).

20   The drug phenomenon in the Grand-Duchy of Luxembourg: trends and developments - 2019                                                                                                              The drug phenomenon in the Grand-Duchy of Luxembourg: trends and developments - 2019           21
Associations between current use of different types of drugs
           � The use of cannabis is not related to the use of other drugs (except synthetic cannabinoids to which it is only
             poorly positively related: r = .10, p < .05). However, using any other illicit drug increases the likelihood of using
             other drugs (significant positive correlations across all the other illicit drugs):
             � Cocaine use is strongly linked to the use of MDMA, amphetamines and ketamine.

                                                                                                                                       3. DRUG-RELATED
             � MDMA use is strongly linked to the use of amphetamines and LSD.

           Attitudes and risk perception towards drug use

                                                                                                                                     HARMS AND HEALTH
           � The majority (92.3%) of the respondents consider that “people should be permitted to use cannabis (herbal
             (weed) or resin (hashish))”.

                 TRYING COCAINE
                  OR CRACK ONCE
                       OR TWICE
                                            6%       13%               21.5%                                 59.5%
                                                                                                                                        CONSEQUENCES
            SMOKING MARIJUANA
                    OR HASHISH                     22.9%                                47.4%                        23.5%   6.2%
                     REGULARY

               HAVING 5 OR MORE
               DRINKS (ALCOHOL)           4.9%        18.3%                         40.4%                            36.5%
                 EACH WEEKEND

                                                     No risk    Slight risk    Moderate risk    Great risk

                              FIGURE 21. Risk perception associated with the use of cocaine, cannabis and alcohol
                                                    (EWSD, 2018 - Berndt & Seixas, 2019)

           � “Smoking marijuana or hashish regularly” is considered less dangerous than “trying cocaine or crack once or
             twice” or “having 5 or more drinks (alcohol) each weekend”:
             � The majority of the respondents consider that “smoking marijuana or hashish regularly” implies no risk
               or only a slight risk. “Trying cocaine or crack once or twice” and “having 5 or more drinks (alcohol) each
               weekend” are considered behaviours that imply a moderate risk or a great risk (Figure 21).

22   The drug phenomenon in the Grand-Duchy of Luxembourg: trends and developments - 2019                                              The drug phenomenon in the Grand-Duchy of Luxembourg: trends and developments - 2019   23
3. DRUG-RELATED HARMS AND HEALTH CONSEQUENCES                                                                                                                                    100

            3.1. DRUG-RELATED INFECTIOUS DISEASES
            Data on drug-related infectious diseases are collected at the national level by the National Retrovirology Labo-                                                           80                                                                                                    77.8%   76.6%
                                                                                                                                                                                                                                                                                                                             75.8%
            ratory and complemented by information obtained through the multi-sector national network RELIS. Moreover,                                                                                              74.1%   74.4%
                                                                                                                                                                                                                                            72%
                                                                                                                                                                                                                                                                             74.8%   74.2%                   73.9%
                                                                                                                                                                                                                                    69.6%                                                                            69.7%
            data are collected through national research studies by the Department of Infection and Immunity, Infectious                                                                                                                            65.5%                                                                            62.9%
            Diseases Research Unit, at the Luxembourg Institute of Health (LIH).                                                                                                                                                                                    62.6%
                                                                                                                                                                                                                                                                                                                             67.2%
                                                                                                                                                                                                                     64.6% 64.9%     65%    64.1%           58.9%
                                                                                                                                                                                       60                                                           63.4%
                                                                                                                                                                                                                                                                                             61.7%   61.5%                           61.3%
                                                                                                                                                                                                                                                                             61.5%
                                                                                                                                                                                                    53%    53%

                                                                                                                                                                            Valid %
                                                                                                                                                                                                                                                                                                             56.1%
                                                                                                                                                                                                                                                                                                                             54.7%
                                120                                                                                                                                                                                                                                                  54.2%
                                                                                                                                                                                                                                                                                                                     51.8%
                                                                                                                                                                                             45%                                                            50.6%
                                                                                                                                                                                                            49%                                                      49.6%
                                                                                                                                                                                                     46%
                                                                                                                                                                                       40
                                                                                                                                                        101                                                                                                                                                                          39.8%
                                100                                                                                                97            98
                                                                                                                                           94
                                                                                                                                                               90

                                                                                                                      83     82                                                        20    25%

                                 80
                                                                                                               73
             Number of people

                                                                                                  68

                                                                                     62                 63

                                 60                                                        57                                                                                           0
                                                                                                                                                                                            1998 2000 2002 2004 2005 2006 2007 2008 2009 2010                                2011    2012 2013 2014 2015 2016 2017 2018

                                                  42                          41
                                                                                                                                                                                                    HCV among HRDU (self-report)            HCV among current IDU (self-report)          HCV among ever IDU (serological data)
                                 40
                                        32
                                                             30          31                                                                                                           FIGURE 23. Evolution of the HCV rate among HRDUs and IDUs - self-reported and serological data (valid %)
                                                                                                                                                                                                         (1998-2018) (RELIS, 2018 – Berndt et al., 2018; Devaux et al., 2018)
                                                        24
                                             22                   22                                                                              21
                                                                                                                                    19     20
                                 20

                                        7                                7
                                                                               6
                                                                                     8                                 8      7
                                                                                                                                                        10
                                                                                                                                                                           � The HCV prevalence rate among high-risk drug users (HRDUs) and particularly among injecting drug users
                                                   4    5                                  4      5      4                                                      4
                                              2              2    3                                             2
                                                                                                                                                                             (IDUs) has been stable and at a high level since 2004 (Figure 23).
                                  0
                                      1987 1989 1991 1993 1995 1997 1999 2001 2005 2006 2008 2010 2011 2012 2013 2014 2015 2016 2017 2018                                    � In 2018, the number of HRDUs who reported being infected with HCV decreased (39.8% in 2018 compared
                                                                                                                                                                                to 54.7% in 2017).
                                                                       New HIV infections among IDUs      New HIV infections
                                                                                                                                                                             � A decrease in the self-reported HCV infections has also been observed among IDUs (a particular high-risk
                                FIGURE 22. Evolution of new HIV infections in the general population and among injecting drug users (IDUs)                                      group) (61.3% in 2018 compared to 67.2% in 2017).
                                                         (1987-2018) according to the SNM6 (Devaux et al., 2019)                                                             � In the framework of the national HCV-UD research project8, serological data has been collected among
                                                                                                                                                                                HRDUs since 2017. Data from this study suggest a decrease in the number of ever IDUs infected with
                                                                                                                                                                                HCV – 75.8% in 2017 and 62.9% in 2018.
            � Most recent data reveal that injecting drug use is the third most reported transmission mode of new HIV                                                      � Despite the high HCV prevalence rate among IDUs, data suggest a decreasing trend in the last years (Figure
              infections since 1989 (homo/bisexual and heterosexual transmission are currently the first and second cause,                                                   23). This decrease in partially due to:
              respectively).                                                                                                                                                 � Improvements in the harm reduction responses in drug treatment centres and in prison – needle (and
            � HIV among IDUs decreased between the late 90’s and 2011. The period between 2014 and 2016 was marked by                                                           paraphernalia) exchange programmes (contributing to a decrease in direct contamination), availability of
              an HIV outbreak among this group – partially explained by an increase in stimulants’ injection (mainly cocaine)7.                                                 opioid substitution treatment and Heroin Assisted Treatment (contributing to stabilisation of users and to
            � Following the implementation of supplementary response measures in the framework of the national drugs                                                            a decrease of high-risk behaviours).
              strategy and action plan, the national HIV and hepatitis action plan, and the recommendations formulated                                                       � Increasing testing and facilitating access to treatment for clients of drug treatment centres (often persons
              by the EMCDDA and the ECDC after their Luxembourg country visit in 2018, the number of new HIV cases                                                              experiencing social exclusion and marginalisation).
              among IDUs decreased from 21 (in 2016) to 4 (in 2018) (Figure 22).                                                                                           � Despite these improvements, it is fundamental to continue the efforts to decreasing HCV infection rates
                                                                                                                                                                             among IDUs. Besides the harm reduction measures already in place, responses directed towards a greater
                                                                                                                                                                             stabilisation of the users (such as Housing First, low-threshold substitution treatment) are discussed (Minis-
                                                                                                                                                                             tère de la Santé, 2015).

                                                                                                                                                                    8 Project HCV-UD « Toxicomanie, hépatite C et substitution: étude épidémiologique, comportementale et clinique au Luxembourg » - https://www.luxclin.lu/
     6 Service National de Maladies Infectieuses (SNMI) located at the Centre Hospitalier de Luxembourg (CHL).                                                        Studies/Details/?c=STP3756SUU. The project results from a collaboration between the LIH, the CHL and 5 harm reduction centres in Luxembourg and it is
     7 The injections of cocaine are more frequent compared to heroin due to shorter effect-windows of the substance. Furthermore, compared to heroin, cocaine is     implemented in several low-threshold sites with the purpose of providing testing and treatment while identifying risk factors and the transmission clusters
       associated to a higher sexual activity.                                                                                                                        related to the HCV infection.

24   The drug phenomenon in the Grand-Duchy of Luxembourg: trends and developments - 2019                                                                                                                                            The drug phenomenon in the Grand-Duchy of Luxembourg: trends and developments - 2019                    25
3.2. DRUG-RELATED MORTALITY
           Anonymised data are available on all direct overdose cases due to illicit drug use documented by contextual
           and forensic evidence; meaning that in case of a suspected overdose death case, post mortem toxicological
           evidence provided by the department of legal medicine of the national health laboratory (Laboratoire national
           de santé; LNS) confirms (or not) the suspected overdose. Hence, acute drug-related mortality are death cases
           attributed directly to the use of an illicit drug, possibly in combination with other types of (prescribed) drugs,
           such as overdoses and acute intoxications, voluntary, accidental or of undetermined intent.                                                           4. RESPONSES
              30

               25
                       26                                                                                                                            TO HEALTH CONSEQUENCES
               20                                    19

               15
                                          13
                                                                        12                                          12
                                 11                                                             11
                                                               10
               10      8.93
                                                                                    8                     8                             8

                                                    6.16
                                                                                                                                 5
                5               3.66
                                          4.2
                                                                        3.5
                                                                                                                                               4
                                                              3.04                             2.97                 3.1
                                                                                   2.21                  2.04                           1.9
                                                                                                                                 1.3          0.96

                0
                      2000     2002     2004       2006      2008      2010        2012       2013      2014      2015      2016       2017   2018

                                                Acute/direct drug-related deaths        Acute/direct drug death mortality rate

                        FIGURE 24. Evolution of direct drug-related death cases and mortality per 100 000 inhabitants
                                                      (RELIS, 2018 - Berndt et al., 2018)

           � Available data indicate that direct drug-related mortality has shown a discontinuous decrease over the last
             years – 20 cases in 2000 and 4 cases in 2018.
           � This reflects in an overall decrease in the overdose rate in the general population - 8.93 overdose deaths per
             100 000 inhabitants in 2000 and 0.96 in 2018 (Figure 24).
           � The mean age at the moment of death has increased over the past 26 years (in 1992: 28.4y; in 2006: 32.5y;
             and in 2018: 41.3y). No victim less than 20 years of age was reported in 2018.
           � Male death cases have outweighed female death cases over the past 22 years (average ratio: 82.2% males
             vs 17.8% females).
           � Also worth mentioning is that a majority of acute drug death victims are known by law enforcement agencies
             (75%) for their “career” of drug possession and/or use.
           � The decrease of direct drug-related deaths is associated with the regionalisation and extension of the opioid
             substitution treatment programme as well as with the development of low-threshold facilities, in particular
             the implementation of supervised drug consumption rooms. Since its opening in 2005, more than 2,200
             overdose episodes have been assisted at the Abrigado centre in the city of Luxembourg. A second supervised
             drug consumption room is operational since September 2019 in the southern city of Esch-sur-Alzette.
           � Opioids (heroin and methadone) are the substances most frequently involved in acute drug-related deaths,
             followed by prescription drugs. Opioids are usually found in combination with other substances.
           � The drug-induced mortality rate among adults (aged 15-64y) in Luxembourg was approximately 10 deaths per
             million in 2018, which is lower than the latest reported European average of 22 deaths per million (2017 data).

26   The drug phenomenon in the Grand-Duchy of Luxembourg: trends and developments - 2019                                                                    The drug phenomenon in the Grand-Duchy of Luxembourg: trends and developments - 2019   27
4. RESPONSES TO HEALTH CONSEQUENCES
           4.1. PREVENTION INTERVENTIONS                                                                                             4.2. TREATMENT RESPONSES AVAILABLE IN LUXEMBOURG
           Prevention is a key pillar of the National Strategy and Action Plan on Drugs and Addictions in the fight against          DESCRIPTION OF THE TREATMENT RESPONSES
           drug addiction. Prevention interventions encompass a wide range of complementary approaches. Prevention aims              Specialised drug treatment offers in Luxembourg include inpatient and outpatient responses. These responses
           at reducing initiation to drugs, delaying the onset of drug use, and encouraging protective actions and healthy           rely on government support and are provided through specialised low-threshold agencies, hospital-based drug
           lifestyles in the general population and in groups at risk, notably young people and their peers. As such, environ-       treatment units, outpatient treatment facilities, and an inpatient treatment facility. Treatment units are also
           mental and universal strategies target entire populations, selective prevention targets vulnerable groups that may        available in prisons. Treatment is decentralised and most commonly provided by state-accredited non-go-
           be at greater risk of developing substance use problems, and indicated prevention focuses on individuals at-risk
                                                                                                                                     vernmental organisations. Outpatient treatment is provided free of charge, whereas inpatient treatment is
           for developing substance abuse dependency.
                                                                                                                                     covered by the national health insurance. All institutions work in close collaboration and can be viewed as an
           Universal prevention is mainly implemented in schools, although drug-related information and prevention mo-               inter-connected therapeutic chain.
           dules are not mandatory in school curricula. School-based programmes are usually implemented in cooperation
           with non-governmental organisations, and seminars, trainings and educational tools about addiction prevention             Low-threshold services
           and improving life-skills are offered to school staff (on a voluntary basis). Annual ‘’thematic/prevention days” or
                                                                                                                                     � Currently two agencies offer harm reduction services in the Centre (CNDS Abrigado and K28), the South and
           “adventure weeks” aim to give young people the opportunity to experience group dynamics, conflict management,
                                                                                                                                       the North of the country including offers such as day and night shelter and supervised injection and blow
           risk assessment and a feeling of solidarity within a group of socially and culturally diverse people. A toolbox de-
                                                                                                                                       facilities (in the centre and in the south).
           veloped by the CePT (Centre de Prévention des Toxicomanies) was recently launched to assist schools with the
           implementation of school-based prevention activities. Moreover, the CePT published a guide with recommen-                 � In July 2005, the first supervised drug consumption room opened in Luxembourg City. It was integrated into
           dations for educational professionals on how to tackle cannabis in the school environment. Training modules for             the low-threshold emergency Abrigado centre providing day care, night shelter (42 beds) and low threshold
           professionals working with young people on how to communicate about psychoactive substances in non-formal                   services to drug users.
           environments and educational tools that allow for discussion on substance abuse have also been developed.                 � A second supervised drug consumption room integrated in the harm reduction service in the south of the
                                                                                                                                       country (Contact Esch), in the city of Esch-sur-Alzette, opened in September 2019 and is run by the Founda-
           Trained police staff members periodically visit schools on demand to inform students on drugs and their risks,              tion ‘Jugend- an Drogenhëllef’ (JDH). Both facilities (Luxembourg City and Esch-sur-Alzette) include injection
           reaching around 6,000 students every year. Some manual-based school prevention programmes are implemented                   and inhalation rooms.
           in schools. Other universal prevention programmes have been implemented periodically in community settings,               � Another low-threshold offer was implemented in the North of the country in 2014 (Contact Nord).
           while trainings and seminars are offered to staff in youth centres so they are able to reinforce social competences
           and prevent substance abuse and addiction among adolescents and young adults. There are also basic information            Outpatient treatment services
           sessions/trainings about drugs (use) and their (side-)effects offered to teachers, staff working in the psycho-so-
                                                                                                                                     � The JDH Foundation was created in 1986. It provides various psychosocial, therapeutic and medical care
           cio-educational field, but also directly to adolescents. Online counselling, e-health and m-health interventions are
                                                                                                                                       services for consumers of illicit drugs, including high-risk drug users, parents, mothers and pregnant women,
           developed on the national level to be offered to provide anonymised advice and information regarding drug use,
                                                                                                                                       and their relatives. Regional antennas of the JDH Foundation exist in Luxembourg City, in Esch-sur-Alzette,
           thus functioning as both a universal and selective prevention measure.
                                                                                                                                       and in Ettelbrück.
           Selective prevention focuses on crisis interventions in schools and on avoiding social exclusion. Activities are also     � The ‘Alternativ Berodungsstell’ (Alternative Counselling Centre) is a specialised outpatient service imple-
           carried out in recreational settings and with high-risk groups, such as at-risk families, multiple drug users and those     mented in Luxembourg City. Its main objectives are to establish first contact with the drug-using clients
           who show excessive use of alcohol. ‘Choice’ and ‘Choice 18+’ are early intervention programmes offered by the               and assist them in the development and organisation of a therapeutic project, detoxification, psychiatric/
           treatment service ‘Impuls’ (Solidarité jeunes asbl) for juvenile first-time offenders. The Choice programme offers          psychotherapeutic interventions, and the provision of informative or therapeutic sessions.
           youngsters aged 12 to 17 who entered in conflict with drug law, mostly due to cannabis possession and/or use, an          � The service ‘Quai 57’ (Arcus asbl) implemented in Luxembourg City is primarily a social and psychological
           early and short-term group-based and individual counselling intervention in order to prevent further development            counselling and referral agency providing help to people who suffer from an addictive disorder (with or wi-
           of drug abuse. The Choice18+ targets young adults up to the age of 21 years. Both Choice programmes offer an                thout substance abuse) or to family members and/or peers of people with an addictive disorder.
           alternative to criminal record registration as a psychoeducational programme is more effective. Young drug users          � The service ‘Impuls’ (Solidarité Jeunes a.s.b.l.) provides, in the framework of youth protection, psychosocial
           may be assigned by police forces or the public prosecutor to this programme. An increase of arrests among young             and therapeutic assistance to young people (generally below the age of 21 years) and their families when
           adults for possession and/or use of cannabis has been observed in recent years.                                             they are confronted with the consumption of legal and illegal psychoactive substances.
           The NGO 4Motion asbl runs a project called ‘Pipapo’, which operates information points that provide information,
           earplugs, condoms, alcohol breath testing and drinking water in recreational and festive settings. They also offer        Hospital-based drug treatment units
           DrUg CheCKing (DUCK) to allow for testing of substances used in these settings.                                           � Detoxification treatment is provided by psychiatric units within the following general hospitals:
                                                                                                                                       � Centre Hospitalier du Nord – CHdN (Ettelbrück - North);
           The Foundation ‘Jugend- an Drogenhëllef’ is the main treatment provider at the national level offering psycho-              � Centre Hospitalier Emile Mayrisch – CHEM (Esch-sur-Alzette - South);
           social help to drug users as well as to drug-dependent parents and their children, and providing intervention to            � Centre Hospitalier de Luxembourg – CHL (Luxembourg city - Centre);
           strengthen the parenting skills of drug-using mothers.                                                                      � Zithaklinik and Hôpital Kirchberg – Fondation Hôpitaux Robert Schuman (Luxembourg - Centre).
           With regard to indicated prevention, early detection is a priority for children exhibiting high-risk behaviour in
           school settings and at home; further interventions are provided by psychiatric care services.
28   The drug phenomenon in the Grand-Duchy of Luxembourg: trends and developments - 2019                                                                                     The drug phenomenon in the Grand-Duchy of Luxembourg: trends and developments - 2019   29
Inpatient treatment services
                                                                                                                                                 TABLE I. Overview of treatment provision                                                                                                      Total
           � The national residential therapeutic centre called ‘Syrdall Schlass’ (CTM-CHNP) is situated in the East of                                   in the Grand-Duchy of Luxembourg                                                                                Number of
             Luxembourg. The Syrdall Schlass is a therapeutic centre for people dependent on illegal substances. The                                                                                                                                                                      clients in
                                                                                                                                                                                                                                       Definition                          clients9 in
                                                                                                                                                                                                                                                                                       treatment10
             centre is organised as a therapeutic community and can accommodate up to 25 people, whereas patients are                                                                                                                                                           2018
                                                                                                                                                                                                                                                                                            in 2018
             allowed to follow substitution treatment in-house. In some cases, it is possible to take in charge mothers and/
                                                                                                                                                                                                                                The patient receives drug
             or fathers accompanied by their children. The goal of the therapeutic community is to help each individual                                       Specialised          Impuls, Quai 57,
                                                                                                                                                                                                                                treatment without staying
             to allow a fulfilling life without drugs and to successfully reintegrate into society and work.                                                  Drug treatment       JDH, Alternativ                                                                               1,522          1,522
                                                                                                                                                                                                                                overnight and can be pharma-
           � The therapeutic programme of the Syrdall Schlass is divided into three progressive phases. The duration of                                       centres              Berodungstell
                                                                                                                                                                                                                                ceutically assisted
             a therapeutic stay usually varies from 3 months to 1 year.                                                                                                                                                         Agencies offering harm
           � Before admission to the Syrdall Schlass, it is mandatory to first consult the ‘Alternativ Berodungsstell’ orientation                                                 Abrigado,
                                                                                                                                                                                                                                reduction services including:
                                                                                                                                                                                   JDH-K28,
             office in Luxembourg city. All the patients have to go through detoxification before entering the therapy.                                                                                                         night shelter, needle
                                                                                                                                                              Low-threshold        JDH-Contact
                                                                                                                                                                                                                                exchange, supervised                         166,945

                                                                                                                                                 OUTPATIENT
           Post-therapy                                                                                                                                       agencies             Esch,
                                                                                                                                                                                                               Non-             consumption rooms,
                                                                                                                                                                                   JDH-Contact
           � In 2016, the ‘Stëmm vun der Strooss asbl’ (Voice of the Street) opened a new post-therapeutic centre in                                                                                           government       education/ counselling,
                                                                                                                                                                                   Nord
             Schoenfels for persons previously treated for an addictive behaviour.                                                                                                                             (non for profit) infectious diseases testing
                                                                                                                                                                                   General
           � It provides post-therapy, time-limited housing and daytime occupation to ex-drug or ex-alcohol dependant
                                                                                                                                                              Outpatient OST       Practitioners                                                                                1,15011         1,150
             adults who intend to lead a life without drugs. The post-therapy centre has two aims:
                                                                                                                                                                                   (GPs) and JDH
             � Offer professional and social reintegration;
                                                                                                                                                                                                                                       Mobile van promoting “safer
             � Avoid accommodation in emergency care facilities after the end of inpatient therapy and provide follow-up                                                                                                               use” and “safer sex” with the
                in a protected setting.                                                                                                                       Mobile outreach MOPUD/X-
                                                                                                                                                                                                                                       ultimate goal of reducing risks            77412
                                                                                                                                                              unit            Change Project
                                                                                                                                                                                                                                       of infectious diseases trans-
           As can be seen in Figure 25, drug treatment and re-integration facilities are spread over different regions. All                                                                                                            mission
           listed services are specialised with the exception of regional general hospitals providing detoxification treatment                                                                                                         The patient is staying over-
           via their respective psychiatric departments.                                                                                                      Hospital-based       CHL, CHEM,                                          night, pharmaceutically
                                                                                                                                                                                                                                                                                  37113           371
                                                                                                                                                              drug treatment       CHdN, Zithaklinik                                   assisted or not (including
                                                                                                                                                                                                                                       detoxification)
                                                                                                                                                                                                                                       The patient is staying over-
                                                                                      JDH: Counselling, substitution, low-threshold,                                                                                                   night, is provided a psycho-
                                       Clervaux
                                                                                      supervised drug consumption/injection room and aftercare                                     Centre                                              logical, long-term treatment,
                                                                                      ABRIGADO (CNDS): Low threshold                                          Therapeutic          Thérapeutique                                       may be pharmaceutically
                                   Wiltz                  GERMANY                                                                                                                                                                                                                    37             37
                                                                                      ABRIGADO (CNDS): Night shelter, Injection room                          communities          de Manternach                                       assisted or not (no detoxi-
                BELGIUM                         Vianden                               IMPULS: Youth counselling                                                                    (CTM)                                               fication). Detoxification is

                                                                                                                                                 INPATIENT
                                                                                      Quai 57: (Arcus asbl): Counselling and referral                                                                                                  required before entering the
                                                    Diekirch                                                                                                                                                   Public/
                                           Ettelbruck                                 CHNP: Treatment and referral                                                                                                                     community
                                                                                                                                                                                                               Government
                               Redange                         Echternach             CTM: Residential therapy, reintegration measures                                                                                                 The patient incarcerated in
                                                            Rosport
                                                                       Manternach     CTM: Aftercare, supervised housing (only main site)                                                                                              prison can submit a demand
                                           Schoenfels
                                                                                      General hospitals providind detoxification treatment                                         Programme                                           to enter a specialised drug
                                                                                      Stëmm vun der Srooss: Post-therapeutic centre
                                                                                                                                                                                   Sucht Hëllef                                        treatment (Sucht Hëllef                     319            319
                                   Luxembourg         Grevenmacher
                                                  Luxembourg
                                                                                                                                                                                   (CPL, CPG)                                          programme) he/she may be
                                                                                                                                                              Prisons                                                                  pharmaceutically assisted (no
                                       Esch/Alzette       Remich                                                                                                                                                                       detoxification)
                                                                                    FIGURE 25. Map of the geographical coverage of                                                                                                     The patient incarcerated in
                                                                                    specialised drug agencies in the Grand Duchy of                                                OST treatment in                                    prison can continue a pre-                         Included in
                                                  FRANCE                                       Luxembourg (status 2019)                                                                                                                                                            169
                                                                                                                                                                                   prison (CPL, CPG)                                   viously prescribed OST treat-                        the 1,150
                                                                                                                                                                                                                                       ment or begin OST in prison
           PROVISION OF DRUG TREATMENT
           � In 2018, 1,522 clients were assisted by specialised outpatient drug treatment units. These include the treat-                                                                                                                                                                     3,399
             ment centres of the JDH (n=444), Impuls (n=568), Quai 57 (n=395), and the Alternativ Berodungsstell (n=115).
           � The number of clients in other national in- and outpatient therapy therapeutic agencies is depicted in Table
             I, whereas Figure 26 shows how the total number of patients has been evolving over the past decade in both                          9,12 Number of client-contacts (the number of individual-clients is not registered for all institutions)
                                                                                                                                                 10 Multiple counts are not excluded
             in- and outpatient services.                                                                                                        11, 13 Based on an estimation

30   The drug phenomenon in the Grand-Duchy of Luxembourg: trends and developments - 2019                                                                                                                           The drug phenomenon in the Grand-Duchy of Luxembourg: trends and developments - 2019   31
You can also read