THC Concentration in Colorado Marijuana - Health Effects and Public Health Concerns
←
→
Page content transcription
If your browser does not render page correctly, please read the page content below
THC Concentration in
Colorado Marijuana
Health Effects and Public Health Concerns
July 31,2020

www.marijuanahealthinfo.colorado.gov
Contents
Abstract ...................................................................................................... 4
Statement of concern ...................................................................................... 4
Introduction ................................................................................................. 5
  About this report ........................................................................................ 5
  Definitions ................................................................................................ 6
Background .................................................................................................. 7
  History of marijuana in Colorado ...................................................................... 7
  State agency roles ....................................................................................... 7
  What the state does to protect consumers .......................................................... 8
  The chemical makeup of marijuana .................................................................. 8
  Variety of marijuana products ......................................................................... 9
  THC concentration of marijuana products in Colorado ........................................... 10
  Method of use ........................................................................................... 11
  Frequency of use........................................................................................ 12
Data .......................................................................................................... 13
  Health effects data ..................................................................................... 13
     Table 1: RMPDS generic codes and descriptions for marijuana exposures and the
     associated marijuana product type and THC concentration ................................... 14
     Exposures.............................................................................................. 15
     Table 2: Count of marijuana exposures by product type reported to RMPDS, Colorado
     January 2017 - June 2020 ........................................................................... 16
     Figure 1: Count and descriptions of marijuana product types associated with marijuana
     codes reported to RMPDS, Colorado January 2017 - June 2020 ............................... 17
     Figure 2: Quarterly count of top three marijuana exposures reported to RMPDS, Colorado
     January 2017 - June 2020 ........................................................................... 18
  Cases ..................................................................................................... 19
     Table 3: Call site of cases reported to RMPDS, Colorado January 2017 - June 2020 ....... 19
     Table 4: Demographics of marijuana concentrate cases compared to other marijuana
     product type cases reported to RMPDS, Colorado January 2017 - June 2020 ............... 21
     Table 5: Medical outcome and exposure intention of concentrate cases and other
     marijuana product type cases, ages 13 to 20 years, reported to RMPDS, Colorado January
     2017 - June 2020 ..................................................................................... 22
  Marijuana use trend data .............................................................................. 23
     Colorado adults ....................................................................................... 23

 1 | THC Concentration in Colorado Marijuana
Table 6: Colorado BRFSS marijuana method of use question options and associated
method of use, marijuana product types and THC concentration ............................ 24
Table 7: Method of use interpretations for Colorado adults, BRFSS 2017-2018 ............. 25
Table 8: Method of marijuana use among Colorado adults, BRFSS 2017-2018 .............. 26
Figure 3: Annual prevalence of marijuana use methods among Colorado adults, BRFSS
2015-2018 ............................................................................................. 27
Adult current users .................................................................................. 27
Table 9: Frequency of marijuana use by any use method among current adult marijuana
users, Colorado, BRFSS 2017-2018 ................................................................. 28
Figure 4: Frequency of marijuana use by single or multiple methods of use among current
adult marijuana users, Colorado, BRFSS 2017-2018 ............................................. 29
Data limitations ......................................................................................... 29
Data conclusions ........................................................................................ 30
Literature review of health effects ..................................................................... 31
Overview of the systematic literature review process ............................................ 31
THC concentration and mental health effects ..................................................... 31
Adults .................................................................................................. 31
Adolescents and young adults ...................................................................... 34
THC blood levels resulting from different exposures .............................................. 37
Flower ................................................................................................. 37
Edibles ................................................................................................. 39
Vaporized ............................................................................................. 42
THC concentrates .................................................................................... 44
THC concentrates ....................................................................................... 45
Dependence ........................................................................................... 45
Acute health effects ................................................................................. 46
Preparation and device failure leading to burn injury.......................................... 47
Discussion and recommendations ....................................................................... 49
Education ................................................................................................ 49
Research ................................................................................................. 50
Surveillance ............................................................................................. 50
Conclusion .................................................................................................. 51
Authors and contributors ................................................................................. 52
Colorado Department of Public Health and Environment ......................................... 52
Marijuana Health Monitoring Program ............................................................ 52
2 | THC Concentration in Colorado MarijuanaRetail Marijuana Public Health Advisory Committee .............................................. 52 References ................................................................................................. 53 3 | THC Concentration in Colorado Marijuana
Abstract
The Retail Marijuana Public Health Advisory Committee through the Colorado Department of Public
Health and Environment were asked by the Colorado General Assembly to produce a report on the
scientific findings pertaining to “...tetrahydrocannabinol (THC) potency of marijuana and any related
health effects” by July 31, 2020. This report provides a brief history of marijuana in Colorado,
including the roles state agencies play and what actions are taken to protect consumer health and
safety. Background is provided on the chemical makeup of marijuana and the large variety of
products available on the regulated market described. “THC potency” is interpreted as THC
concentration, with further explanation of this definition provided. The variation of THC
concentration among marijuana products is addressed as well as the various methods of marijuana
product consumption and the importance of considering the frequency of marijuana use when
examining health effects. Most importantly, this report provides summaries of current scientific
evidence and data that works to inform our understanding of the potential of adverse health effects
associated with high concentration THC products. Informed by this evidence or the lack thereof, this
report concludes with recommendations to better educate, inform, and protect the people of
Colorado.

Statement of concern
The regulated marijuana industry in Colorado produces a large variety of retail products that contain
a high concentration of tetrahydrocannabinol or THC, the most psychoactive substance found in
marijuana. The clinical effects of marijuana are dictated by the dose of THC, and to a lesser extent,
other cannabinoids which will not be discussed in this report. Other factors might include individual
response and marijuana product type. THC concentration, commonly called “potency”, refers to the
content of THC in the marijuana product expressed as either a percentage (%) or milligram (mg) dose
per serving for some products, including edible products. Products containing a high THC
concentration raise public health concern because increased dose may lead to higher potential for
adverse health effects in consumers of these products.

 4 | THC Concentration in Colorado Marijuana
Introduction
About this report
During the 2019 Colorado legislative session, the General Assembly requested the Colorado
Department of Public Health and Environment (CDPHE) to study “...tetrahydrocannabinol (THC)
potency of marijuana and any health effects”.1 In a request for information submitted through the
Long Bill in Footnote 88a, CDPHE was instructed to have the Retail Marijuana Public Health Advisory
Committee (RMPHAC) review the scientific literature, plus relevant data, and present a report with
recommendations to the General Assembly by July 31, 2020. This white paper serves as the requested
report.

In response to this request, it should be noted that both CDPHE and the RMPHAC interpret the term
“THC potency” as the concentration of THC in marijuana or marijuana products. Although “potency”
is the term commonly used to describe THC concentration or content, it has a different
pharmacologic meaning. The proper use of the term potency is used to express the activity of a drug,
in terms of the amount required to produce a defined effect.2 The term “potency” is inaccurate when
discussing marijuana clinical effects since the active compound, THC, is the same in all marijuana
products, and the effect on cannabinoid receptors is therefore consistent across products, on the
cellular level. Since the effects of THC are subjective, differing between individuals and dependent
on mode of use, a known amount to produce a defined effect does not exist. Misuse of the term
potency in this way may also give a false sense that any risk has been mitigated due to testing the
relationship of amount to effect. Increasing the concentration of THC can lead to an increase in the
dose consumed. Even low doses may affect some individuals in adverse ways, though as dose
increases, risk increases.

This report is reflective of literature available and reviewed as of March 2020, and data available as of
August 2020. CDPHE and the RMPHAC consistently search and review the published literature on a
quarterly basis. Data are analyzed as new data is released. As new evidence emerges on topics
covered by this committee, including THC concentration and/or specific marijuana product types, the
RMPHAC will update statements and recommendations made in this report. Updates are made
regularly by CDPHE and posted to the website www.marijuanahealthinfo.colorado.gov.

 5 | THC Concentration in Colorado Marijuana
Definitions
      Trichomes - part of marijuana plant containing cannabinoids, such as THC and CBD.

      Cannabinoid- compounds found in marijuana, such as THC and CBD.

      THC-       -9-tetrahydrocannabinolic acid - non-psychoactive precursor of THC that is
      activated (i.e. decarboxylated) by heat energy to form THC.

                             -9-tetrahydrocannabinol - a prominent cannabinoid of marijuana and
      the primary psychoactive compound found within the marijuana plant.

      CBD or Cannabidiol - a prominent non-intoxicating cannabinoid of marijuana.

      THC Concentrate - product created by using extraction methods that condense trichomes and
      separates them from marijuana plant material. Contains concentrated amounts of
      cannabinoids, including THC.

      THC Concentration - THC content per volume or weight of marijuana products, usually
      measured in milligrams or percentage.

      Potency - an expression of the activity of a drug, in terms of the amount required to produce
      a defined effect.

      Dose or Dosage- specified amount of THC taken (inhaled or milligrams consumed) at one point
      in time.

      Method of marijuana use - The manner in which marijuana is consumed.

6 | THC Concentration in Colorado Marijuana
Background History of marijuana in Colorado Colorado has a 20-year history in the legalization of marijuana. Marijuana, a federally illegal, Schedule I drug that contains psychoactive THC, was first legalized in Colorado for medicinal purposes only. Added to the state constitution through Amendment 20 in 2000, only certain listed medical conditions may be treated using medical marijuana recommended by a physician.3 In 2012, non- medical marijuana intended for adult consumption was proposed on Amendment 64 and passed with 53% of the vote.4 Amendment 64 also instituted the large-scale production and sale of marijuana.5 On January 1, 2014 Colorado became the first state in the nation to open retail stores selling regulated, adult-use marijuana. State agency roles Both state and local government agencies in Colorado have roles in the regulation and safety of marijuana. At the state level, the Colorado Department of Revenue’s Marijuana Enforcement Division (MED) has authority over the production, distribution and sale of marijuana.5 The Marijuana Health Monitoring Program at CDPHE is responsible for monitoring marijuana use trends across the state and the emerging scientific evidence of health effects related to marijuana use.6 At the local level, jurisdictions have authority to require additional licenses and may enact laws that build upon rules and regulations set at the state level to protect public health and safety.5 The MED dictates in rule and regulation what marijuana products are allowable. A current list of allowable products, that includes marijuana concentrate, may be found in the Colorado Code of Regulations, Marijuana Enforcement Division, 1 CCR 212-3.7 These rules and regulations are updated through the rulemaking process that includes input from stakeholders, including industry representatives, state agencies, subject matter experts and the public. CDPHE regularly participates during the rulemaking process to offer consultation from its subject matter experts on topics that pertain to public health. Consumer safety and education, laboratory testing, youth and unintentional consumption prevention, and environmental impacts are all topics that CDPHE has provided input on to minimize the occurrence of adverse health effects and outcomes. 7 | THC Concentration in Colorado Marijuana
CDPHE is required by statute to monitor health effects of retail marijuana use in order to protect both
marijuana consumers and the general public.6 This is accomplished through analysis of various data
sources and regular review of peer-reviewed literature by a panel of health experts, the RMPHAC.
Through the work of the RMPHAC, the department issues Evidence Statements and Public Health
Statements on the health effects of marijuana use that are based on the evidence found in the
current scientific literature. Evidence Statements and Public Health Statements are referenced and
discussed throughout this paper. All statements on health effects have been approved by the
RMPHAC. The work of the RMPHAC and CDPHE is presented to the legislature, Department of
Revenue, and Board of Health as a report summary every two years. The next report summary is due
January 31, 2021, however the work of the RMPHAC is regularly updated throughout the year and
current information may be accessed at www.marijuanahealthinfo.colorado.gov .

What the state does to protect consumers
The state of Colorado has enacted laws and regulations that are intended to protect consumers of
marijuana products. The MED has rules and regulations that aim to inform and protect consumers of
marijuana. A few rules of note that intend to protect and inform consumers include; placing THC
“potency” (concentration) test results on marijuana product packaging labels, requiring a “potency”
(concentration) statement of total THC and cannabidiol (CBD) for all concentrate products and
flower, and requiring a warning statement on the container or marketing label that says “There may
be long term physical or mental health risks from use of marijuana including additional risks for
women who are or may become pregnant or are breastfeeding” and “Use of marijuana may impair
your ability to drive a car or operate machinery.”7 During 2019 Rulemaking, marijuana stores were
required to notify MED or CDPHE of any reports of adverse health effects reported to them by
consumers. The MED also has authority to issue Health and Safety Advisories when any marijuana
product is thought to be a threat to public health or safety.7 CDPHE is regularly consulted during this
process.

The chemical makeup of marijuana
                                                     -9- tetrahydrocannabinol (THC) and cannabidiol
                                      8
(CBD) being the two most prominent. THC is the primary psychoactive compound found within the
                                                                    -9-tetrahydrocannabinolic acid,
which is a non-psychoactive precursor that is d                                               -9-

 8 | THC Concentration in Colorado Marijuana
tetrahydrocannabinol, which is psychoactive. THC concentration refers to the content of THC per unit of weight or volume, and is usually expressed as a percentage (%), but may also be expressed in milligrams (mg).9 “Total THC” means the sum of the percentage by weight of THCA multiplied by 0.877 plus the percentage by weight of THC i.e., Total THC = (%THCA x 0.877) + % THC.7 The 0.877 is used to account for the difference of molecular weight between THCA and THC and this equation assumes 100% decarboxylation of THCA to active THC.9 Variety of marijuana products The marijuana industry in Colorado produces high quality marijuana and a wide variety of products produced from marijuana extract. Marijuana flower is the part of the plant that contains the most THC-containing trichomes. Flower is considered the most valuable part of the plant and is primarily sold as a smokable product. There are hundreds of varieties of marijuana flower regularly cultivated and sold on the regulated market in Colorado. According to the 2018 Colorado Market Size and Demand Update, flower accounted for the majority of all marijuana sales in the state.10 There are also many products sold on the regulated market that are produced using marijuana plant extract. The marijuana industry uses extraction methods to separate THC-containing trichomes from parts of the plant that otherwise would be waste. Specialized machinery that uses a combination of heat and pressure, solvents (e.g. butane, propane, ethanol, isopropyl alcohol, etc.) or water produces relatively small batches of marijuana extract that contains concentrated levels of THC. The resulting extract may be used in the production of many THC-containing products, such as vaping liquids, edibles, tinctures, topicals or alternative use products like inhalers or nasal sprays. Marijuana extract may also be further refined to produce various forms of concentrate products. Concentrate products are intended to be consumed in pure concentrated form. The consistency of the product can vary and is often given a name that reflects its appearance, like wax, shatter, or budder. The MED refers to these products as “marijuana concentrates”.7 For clarity purposes, we refer to these products as THC concentrates throughout this paper. 9 | THC Concentration in Colorado Marijuana
THC concentration of marijuana products in Colorado
Marijuana flower produced in Colorado and other legalized states is known to contain higher
concentrations of THC than what has been reported previously from other regulated sources.
According to the 2018 Colorado Market Size and Demand Update report, marijuana flower in Colorado
contained an average of 19.6% THC per gram (Upper limit 35%) in 2017 and has remained relatively
stable since 2014.10 By comparison, flower produced for research purposes by the University
Mississippi for the National Institute of Drug Abuse averages 4.14%.11 Looking at Colorado specifically,
a 2020 study by Cash et al. found 92.94% of all products sold in retail marijuana stores to have >15%
THC.12

The content of THC in concentrate products is substantially higher than flower. The 2018 Colorado
Market Size and Demand Update report shows the percentage of THC in concentrate products steadily
increased over the years; in 2014, concentrate averaged 56.6% THC compared to an average of 68.6%
THC (Upper limit 90%) in 2017.10 Some retail marijuana stores advertise up to 95% THC in concentrate
products.13

In contrast to THC concentrate products, the THC content in retail marijuana edible products has
decreased. This was due to policy changes for edible products in 2016, which set the maximum THC
concentration (measured as dose in milligrams) in retail edible products to 10mg dose THC per
individual serving, with a maximum of 100mg per package.14 This change was prompted after public
health concern was raised due to reports of THC overconsumption in adults and unintentional or
accidental THC consumption by children.15,16

Scientific literature shows a trend of increasing THC concentration happening worldwide and it
appears to be increasing on a yearly basis. Cascini et al. (2012) conducted a systematic review of
scientific literature published between 1970 and 2009 and found a significant association between
average THC content of marijuana flower and year. Average increase of mean THC concentration
between 1970 and 2010 was 4.7% and this rise has been more rapid in the last decade. Studies
specific to the United States have shown similar results.17 ElSohly et al. (2016) used DEA confiscated
marijuana flower samples from 1995 to 2014 and found a trend of increasing THC concentration from
~4% in 1995 to ~12% in 2014.18 Specifically related to THC concentrates, a 2019 study by Chandra et

 10 | THC Concentration in Colorado Marijuana
al. used DEA confiscated samples to find an average THC content increased from 6.7% in 2008 to
55.7% in 2017, with fluctuation in between.19 These articles provide evidence that average THC
concentration in marijuana products has increased and is associated with time.

Method of use
The method of marijuana use is the manner in which the marijuana is consumed. Certain methods of
use can give insight as to which marijuana products are being consumed. For example, eating or
drinking marijuana indicates only products containing active THC (i.e. edibles) are consumed in order
for the effects of the THC to be felt. Similarly, dabbing marijuana is indicative of THC concentrate
use. However, method of use does not always dictate what type of marijuana product(s) are being
consumed. For example, vaporizing can involve either THC concentrates or flower. In an effort to
help the reader understand the difference in each method of use, we define the most common
methods of marijuana use in the following list:

       Smoking, the most traditional method of use, involves marijuana flower rolled in cigarette
       paper or tobacco leaves (i.e. joint or blunt respectively), or inserted into the bowl of a pipe or
       bong. The flower is combusted by applying flame and the smoke inhaled.

       Eating/Drinking or Oral Administration involves marijuana edible products or tinctures that
       contain active THC that is ingested orally. Effects of edibles are delayed but last longer
       compared to those of smoking.

       Lotions/salves/topicals contain active THC and are applied to the skin surface.

        Vaporizing involves devices (e.g. pen) that contain internal coils that are heated by a battery
        supply. Vaping liquid containing THC concentrate or flower comes into contact with the
        heated coils and produces a vapor that is inhaled.

        Dabbing, also considered a form of vaporization, involves a device that has a metal or ceramic
        plate that is heated prior to placing THC concentrate directly onto the plate’s surface to
        produce an inhalable vapor.

        Alternative use products, such as inhalers and nasal sprays, contain THC concentrate mixed
        with other inactive ingredients to produce a fine, mist-like product that can be inhaled
        through either the mouth or nose.

 11 | THC Concentration in Colorado Marijuana
Frequency of use As with all substance use, frequency of use plays an important role in subsequent health effects. A 2020 study by Hines et al. found the use of high THC concentration marijuana products to be associated with at least weekly marijuana use, when compared to those using lower THC concentration marijuana (aOR 4.38, 95% CI 2.89-6.63).20 In another study Bidwell et al. (2018) studied characteristics of people using THC concentrates on the legal markets in the United States. Those reporting frequent use of concentrate products reported using marijuana (of any form) an average of 6.04 days per week, compared to 4.16 days for marijuana users who never use concentrate products. Furthermore, frequent concentrate users reported a higher per-day use frequency than flower-only marijuana users.21 12 | THC Concentration in Colorado Marijuana
Data
Health effects data
CDPHE is statutorily tasked with collecting data specific to marijuana related health effects and
marijuana use trends. Over the years CDPHE has worked with its partners to explore data sources that
contain information relevant to marijuana health monitoring purposes. Although we have been
successful in identifying data sources that contain useful data on marijuana use, there are few sources
that contain detailed information needed to distinguish the type of marijuana product consumed and
the THC concentration of those products. A prime example is the Colorado Hospital Association (CHA)
data set. CHA provides CDPHE with the largest and most complete surveillance data set containing
information on hospital and emergency department visits from most hospitals around the state. These
data contain billing codes, from which valuable information is extracted, including information on
visits involving marijuana. Since the primary purpose of these codes are for billing purposes, they only
contain information specific to the medical procedure or condition. These codes do not contain the
level of detail that distinguishes the marijuana product type, percentage THC, or whether the
hospital visit was attributable to THC. Therefore these data do not appear in this report.

Rocky Mountain Poison and Drug Safety (RMPDS) serves as the regional poison center for Colorado.
RMPDS has been providing CDPHE data on the number of marijuana exposures since 2014. In 2017
CDPHE granted RMPDS additional funds to collect more detailed information from callers reporting
marijuana exposures. Detailed data now attempted to be collected includes type of marijuana
product consumed. A limitation to these data is that they are voluntarily reported by callers and
cannot capture the true prevalence of use patterns. Additionally, detailed information is not always
known by the caller, who may be a friend, family member, or healthcare personnel who are calling
the poison center on the patient’s behalf.

RMPDS collects information on exposures and opens a case number to be followed. The generic codes
in the Table 1 define an exposure due to marijuana. Each unique patient under a case number is
considered a “case”. Marijuana cases usually have multiple generic codes present. Each case can have
multiple substance exposures.

 13 | THC Concentration in Colorado Marijuana
Table 1: RMPDS generic codes and descriptions for marijuana exposures and the
associated marijuana product type and THC concentration

Generic                                                          Marijuana Product         High THC
        Generic Code Description
Code                                                             Type                      Concentration
0083000 Marijuana: Dried Plant                                   Plant                     Unknown

0310033 eCigarettes: Marijuana Device Without Added Flavors      Electronic device/liquids Unknown

0310034 eCigarettes: Marijuana Device With Added Flavors         Electronic device/liquids Unknown

0310035 eCigarettes: Marijuana Liquid Without Added Flavors      Electronic device/liquids Unknown

0310036 eCigarettes: Marijuana Liquid With Added Flavors         Electronic device/liquids Unknown

0310096 eCigarettes: Marijuana Device Flavor Unknown             Electronic device/liquids Unknown

0310097 eCigarettes: Marijuana Liquid Flavor Unknown             Electronic device/liquids Unknown

0310121 Marijuana: Edible Preparation                            Edible                    Unknown

0310122 Marijuana: Oral Capsule or Pill Preparation              Oral capsule/pill         Unknown

0310123 Marijuana: Undried Plant                                 Plant                     Unknown

0310124 Marijuana: Concentrated Extract (Including Oils and      Concentrate               Yes
           Tinctures)

0310125 Marijuana: Topical Preparation                           Topical                   Unknown

0310126 Marijuana: Other or Unknown Preparation                  Other/Unknown             Unknown

0310146 Cannabidiol (CBD)                                        CBD                       None

Produced by: Marijuana Health Monitoring Program, Colorado Department of Public Health & Environment 2020.
Data Source: Rocky Mountain Poison and Drug Safety.

14 | THC Concentration in Colorado Marijuana
Exposures Most often marijuana exposures are not a single exposure. A marijuana exposure can have multiple generic codes including polysubstance exposures. Concentrated THC product exposures were determined using the generic code for concentrated extract (0310124). From January 2017 through June 2020, 973 human exposures with at least one marijuana generic code present were sent to CDPHE using an enhanced surveillance collection project from RMPDS. In total there were 975 marijuana generic codes described in Table 2 by product type. Almost 75% of marijuana exposures reported to RMPDS were from edibles (44.9%) and marijuana plant (29.1%). There were 104 (10.7%) concentrate extract exposures since 2017. Further description of the marijuana product gathered through the call are in Figure 1. Of the concentrated extracts, 31.7% were described as either concentrated marijuana/THC and 21.2% were oils. No concentrated extracts were tinctures. The number of marijuana exposures due to the top three marijuana associated exposure (edibles, plant, or concentrated extracts) has remained unchanged starting in Q3 of 2018 (Figure 2). Since 2017, most exposures have been due to either edibles or marijuana plant. Exposure to concentrated extracts have consistently remained lower than edible and marijuana plant exposures. 15 | THC Concentration in Colorado Marijuana
Table 2: Count of marijuana exposures by product type reported to RMPDS, Colorado
January 2017 - June 2020
                                                      Exposures
Marijuana Product Type                                Number (%)
Edible                                                438 (44.9%)

Plant                                                 284 (29.1%)

Concentrate                                           104 (10.7%)

Other/Unknown                                         85 (8.7%)

CBD                                                   34 (3.5%)

Electronic device/liquids                             27 (2.8%)

Topical                                               -*

Oral capsule/pill                                     -*

Total marijuana exposures                             975 (100%)
-*Suppressed due to low number count.
Produced by: Marijuana Health Monitoring Program, Colorado Department of Public Health & Environment 2020.
Data Source: Rocky Mountain Poison and Drug Safety.

 16 | THC Concentration in Colorado Marijuana
Figure 1: Count and descriptions of marijuana product types associated with marijuana codes reported to RMPDS, Colorado January 2017 - June 2020 Produced by: Marijuana Health Monitoring Program, Colorado Department of Public Health & Environment 2020. Data Source: Rocky Mountain Poison and Drug Safety. 17 | THC Concentration in Colorado Marijuana
Figure 2: Quarterly count of top three marijuana exposures reported to RMPDS, Colorado January 2017 - June 2020
Produced by: Marijuana Health Monitoring Program, Colorado Department of Public Health & Environment 2020.
Data Source: Rocky Mountain Poison and Drug Safety.
 18 | THC Concentration in Colorado Marijuana
Cases
A concentrate case is exclusive and considered a case if the generic code was present despite the
possibility of multiple substance exposures. There were 104 unique concentrate cases from January
2017 to June 2020. Information about the caller is collected, including caller location site and
whether or not the caller is associated with a healthcare facility. There were no meaningful
differences in the proportion of concentrate exposures reported by call site (11.3% health care facility
vs. 10.1% residential, Table 3). Among all concentrate cases reported to the poison center 54.8% were
called-in by a health care facility, similar to other marijuana product type cases. Of those called in by
a health care facility, 79% were calling from a hospital and 17.5% called from an emergency clinic,
also similar to other marijuana product type cases.

Table 3: Call site of cases reported to RMPDS, Colorado January 2017 - June 2020
                               Concentrate Cases           Other Marijuana          Total
                               (n=104)                     Product Type Cases (n=973)
                               N (%)                       (n=869)                  N (% Concentrate)
                                                           N (%)

Call Site*
Health care facility**         57 (54.8%)                  447 (51.4%)              504 (11.3%)

Residential                    43 (41.4%)                  381 (43.8%)              424 (10.1%)

Occupational                   -*                          11 (1.3%)                -*

Other                          -*                          30 (3.5%)                -*

Health Care Facility**

Emergency Clinic               10 (17.5%)                  60 (13.4%)               70 (14.2%)

Hospital                       45 (79.0%)                  363 (81.2%)              408 (11.0%)

Provider Office                -*                          8 (1.8%)                 -*

Other Health Facility          -*                          16 (3.6%)                -*

*Caller’s location
**Caller associated with a health care facility.
Produced by: Marijuana Health Monitoring Program, Colorado Department of Public Health & Environment 2020.
Data Source: Rocky Mountain Poison and Drug Safety.

 19 | THC Concentration in Colorado Marijuana
Table 4 compares the demographics of concentrated cases to other marijuana product type cases. It also contains the medical outcome, which is based upon available information on the symptoms exhibited, symptom severity and duration following an exposure. Among concentrated cases, the highest percentage of cases were between 13 and 20 years old (32.7%) followed by those aged less than 5 years old (27.6%). Compared to other marijuana product type cases, the highest percentage of cases were less than 5 years old (36.0%) and then cases ages 13 through 20 years (22.0%). Concentrate cases under the legal age to use retail marijuana (21 years) contributed to 10.7% of total marijuana cases. There were no differences based on gender. Interestingly, population surveys have found general marijuana use to be more prevalent in males (20.2% [18.5, 21.8] compared to 14.9% [13.4, 16.5]; BRFSS 2018), and regardless of concentrate exposure there are no differences between males and females. This finding may suggest that marijuana exposures may affect females more or a result of females being more likely to seek care. The majority of concentrate case outcomes resulted in minor (48.1%) or no effect (22.1%). However, concentrate cases contributed to over a quarter (26.1%) of the major medical outcomes associated with marijuana, but causality cannot be determined. 20 | THC Concentration in Colorado Marijuana
Table 4: Demographics of marijuana concentrate cases compared to other marijuana
product type cases reported to RMPDS, Colorado January 2017 - June 2020
                                                              Other Marijuana
                                    Concentrate Cases                            Total
                                                              Product Type Cases
Demographic
                                    (n=104)                                      (n=973)
                                                              (n=869)
                                    N (%)                                        N (% Concentrate)
                                                              N (%)
Age

0-5 years                           27 (27.6%)                297 (36.0%)             324 (8.3%)

6-12 years                          8 (8.2%)                  81 (9.8%)               89 (9.0%)

13-20 years                         32 (32.7%)                183 (22.0%)             215 (14.9%)

21-29 years                         11 (11.2%)                87 (10.6%)              98 (11.2%)

30 + years                          20 (20.4%)                176 (21.4%)             196 (10.2%)

Legal Consumption Age
Less than 21 years                  67 (67.0%)                561 (66.2%)             628 (10.7%)

Older than 21 years                 33 (33.0%)                287 (33.8%)             320 (10.3%)

Gender
Male                                50 (48.1%)                460 (52.9%)             510 (9.8%)

Female                              54 (51.9%)                398 (45.8%)             451 (12.0%)

Medical Outcome
Confirmed non-exposure/unrelated    -*                        19 (2.2%)               -*

No effect                           23 (22.1%)                129 (14.8%)             152 (15.1%)

Minor effect                        50 (48.1%)                427 (49.1%)             477 (10.5%)

Moderate effect                     16 (15.4%)                166 (19.1%)             182 (8.8%)

Major effect                        6 (5.8%)                  17 (2.0%)               23 (26.1%)

Unknown                             7 (6.7%)                  111 (12.8%)             118 (5.9%)

-* Suppressed
Percentages may not add up to total sample size due to unknown demographics.
Produced by: Marijuana Health Monitoring Program, Colorado Department of Public Health & Environment 2020.
Data Source: Rocky Mountain Poison and Drug Safety.

 21 | THC Concentration in Colorado Marijuana
Table 5 compares medical outcomes and intentionality of concentrate cases to other marijuana
product type cases among cases between the ages of 13 and 20. Exposure intention refers to whether
the exposure was knowingly intended or not. There were no meaningful differences between
concentrate cases and other marijuana product type cases. Overall cases in this age group had minor
or moderate effects. Major effects were split between concentrate cases and other marijuana
product type cases, each contributed to half (50.0%) of the major outcomes. However, causality
cannot be determined. All cases in this age range had high intentional use of marijuana. Concentrate
cases contributed to 16.1% of intentional use exposures.
Table 5: Medical outcome and exposure intention of concentrate cases and other
marijuana product type cases, ages 13 to 20 years, reported to RMPDS, Colorado
January 2017 - June 2020
Concentrate Cases Other Marijuana Total
(n=32) Product Type
(n=215)
Cases
N (%)
(n=183) N (% Concentrate)
N (%)
Medical Outcome
Confirmed non-exposure/unrelated -* -* -*
No effect -* 13 (7.1%) -*
Minor effect 14 (43.8%) 98 (53.6%) 112 (12.5%)
Moderate effect 8 (25.0%) 49 (26.8%) 57 (14.0%)
Major effect 5 (15.6%) 5 (2.7%) 10 (50.0%)
Unknown -* 14 (7.7%) -*
Exposure Intention
Unintentional -* 10 (5.5%) 384 (7.6%)
Intentional 29 (90.6%) 153 (83.6%) 192 (16.1%)
Unknown -* 20 (10.9%) 52 (13.5%)
Produced by: Marijuana Health Monitoring Program, Colorado Department of Public Health & Environment 2020.
Data Source: Rocky Mountain Poison and Drug Safety.
22 | THC Concentration in Colorado MarijuanaMarijuana use trend data CDPHE monitors population use of marijuana in Colorado using the Healthy Kids Colorado Survey (HKCS) and Behavioral Risk Factor Surveillance Survey (BRFSS). Both surveys target specific populations and ask questions on marijuana use in the past 30 days, method(s) of use, and frequency of use. These population health surveys do not currently ask respondents to identify marijuana product type or percentage of THC most commonly used. Therefore, the prevalence of high concentration THC use in Colorado cannot be directly determined from these data sources. Note: 2019 Health Kids Colorado Survey will be provided in a supplement separate from this report. Colorado adults BRFSS asks adults 18 and older about marijuana use in the past 30 days. Adults who consumed marijuana one or more days are then asked to select all methods used for marijuana in the past 30 days. Method options on BRFSS include the following: smoke, eat, drink, vaporize, dab, some other way, not sure, or refused. Method questions on BRFSS provide some examples on the type of marijuana product used with the method, but does not provide information on the percentage of THC present (see Table 6). 23 | THC Concentration in Colorado Marijuana
Table 6: Colorado BRFSS marijuana method of use question options and associated
method of use, marijuana product types and THC concentration
Survey Question                           Method of       Associated Product High THC
                                          Use             Types                     Concentration

Smoke it? (for example: in a joint, bong, Smoked          Unspecified/Multiple      Unknown
pipe, or blunt)

Eat it? (for example, in brownies, cakes, Ingestion       Edibles                   Unknown
cookies, or candy)

Drink it? (for example, in tea, cola,     Ingestion       Edibles                   Unknown
alcohol)

Vaporize it? (for example in an e-        Vaporized       Unspecified/Multiple      Unknown
cigarette-like vaporizer)

Dab it? (for example using butane hash    Dabbed          Butane hash oil, wax,     Yes
oil, wax or concentrates)                                 concentrates

Was it used in some other way?            Other way       Unknown                   Unknown

Produced by: Marijuana Health Monitoring Program, Colorado Department of Public Health & Environment 2020.
Data Source: Behavioral Risk Factor Surveillance System (BRFSS)

The only method of use on BRFSS that can provide an unbiased estimate of adult use of high
concentrated THC products is dabbing. Methods are examined by any method of reported use,
multiple methods of use, and single method of use. See Table 7 for how the types of use can
be interpreted for the Colorado adult population. BRFSS survey responses from 2017 and 2018
were combined to provide more stable estimates due to the small sample size of adults that
dabbed concentrates. Prevalence is the average prevalence for the combined years 2017 and
2018. Population estimates are weighted and statistical significance was determined using
margins of error and overlapping confidence intervals.

 24 | THC Concentration in Colorado Marijuana
Table 7: Method of use interpretations for Colorado adults, BRFSS 2017-2018
Method of Use Colorado Adults
Any Method of Use The averaged prevalence (2017-2018) of Colorado adults that used at least one method to
consume marijuana at least once in the past 30 days. They may or may not have used the
method along with additional methods.
Multiple Methods of The averaged prevalence (2017-2018) of Colorado adults that used multiple different
Use methods to consume at least once in the past 30 days.
Single Method of Use The averaged prevalence (2017-2018) of Colorado adults that used only one method to
consume marijuana at least once in the past 30 days.
Produced by: Marijuana Health Monitoring Program, Colorado Department of Public Health & Environment 2020.
Data Source: Behavioral Risk Factor Surveillance System (BRFSS).
Across 2017 and 2018, 8.2% (7.6, 8.8) of Colorado adults used multiple methods to consume marijuana
(Table 8). The most common methods of marijuana use were smoking and ingestion. Among adults,
any use of smoking as a method was 13.7% (13.0, 14.4), with 7.5% (6.9, 8.1) using multiple methods
along with smoking and 6.2% (5.7, 6.7) only smoking. Any consumption of marijuana by ingestion was
6.6% (6.1, 7.2), but the majority (5.2% [4.8, 5.7]) used other methods along with ingestion. The third
most used method was vaporizing marijuana (4.8% [4.4, 5.3]), but this method was again used by the
majority in conjunction with other methods. Across 2017 and 2018, 3.7% (3.3, 4.1) of Colorado adults
dabbed concentrated THC products. However, dabbing was mostly used along with other methods and
only 0.1% (0.0, 0.2) dabbed concentrates exclusively.
25 | THC Concentration in Colorado MarijuanaTable 8: Method of marijuana use among Colorado adults, BRFSS 2017-2018
Method of Use Chosen Any Method of Use Multiple Methods of Single Method of Use
on Survey % (95% Confidence Use % (95% % (95% Confidence
Intervals) Confidence Intervals)
Intervals)
Did not use marijuana in past 83.5% (82.7, 84.3) 83.5% (82.7, 84.3) 83.5% (82.7, 84.3)
30 days
Smoked 13.7% (13.0, 14.4) 7.5% (6.9, 8.1) 6.2% (5.7, 6.7)
Ingestion (Ate/Drank) 6.6% (6.1, 7.2) 5.2% (4.8, 5.7) 1.3% (1.1, 1.6)
Vaporized 4.8% (4.4, 5.0) 4.6% (4.1, 5.0) 0.3% (0.2, 0.4)
Dabbed 3.7% (3.3, 4.1) 3.6% (3.2, 4.0) 0.1% (0.1, 0.2)
Other methods 1.3% (1.1, 1.5) 1.0% (0.8, 1.2) 0.3% (0.3, 0.4)
Multiple methods N/A N/A 8.2% (7.6, 8.8)
Estimates may not add to total any use due to rounding and suppression of unknown/unsure responses
Produced by: Marijuana Health Monitoring Program, Colorado Department of Public Health & Environment 2020.
Data Source: Behavioral Risk Factor Surveillance System (BRFSS).
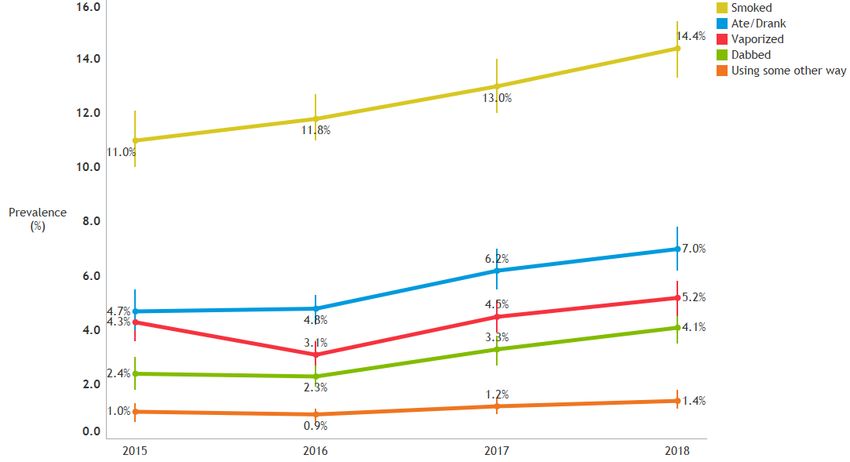
Since legalization of retail marijuana, there have been increases in various methods of use among
Colorado Adults (Figure 3). In 2018, there were increases in smoking (14.4% [13.3, 15.4]) and ingestion
of edibles (7.0% [6.2, 7.8]) compared to 2015 (11.0% [10.0, 12.1]; 4.7% [4.0, 5.5]). In 2018, dabbing
concentrates significantly increased to 4.1% (3.5, 4.8) from 2.4% (1.8, 3.0).
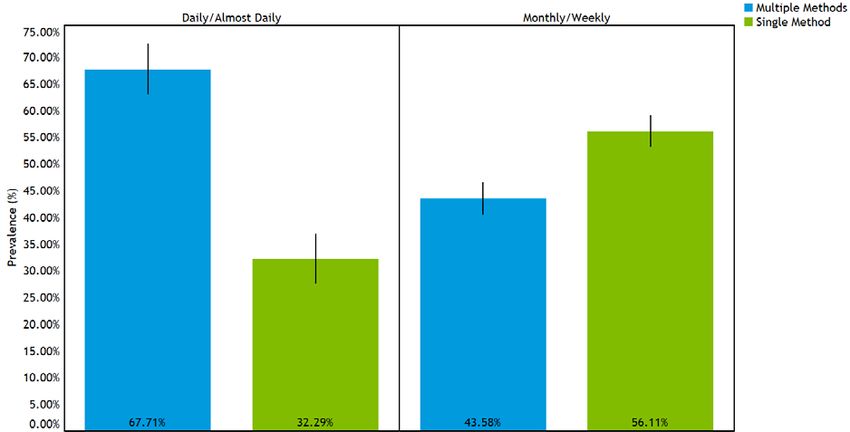
26 | THC Concentration in Colorado MarijuanaFigure 3: Annual prevalence of marijuana use methods among Colorado adults, BRFSS 2015-2018 Produced by: Marijuana Health Monitoring Program, Colorado Department of Public Health & Environment 2020. Data Source: Behavioral Risk Factor Surveillance System (BRFSS). Adult current users Further analyses examining frequency of use are among the subset of the populations that used marijuana in the past 30 days (current users). Frequency of use questions ask respondents to estimate how many days in the past 30 days they used ANY type of marijuana product. Respondents provide a number (1 through 30). Frequency of use among adults is determined by combining days into monthly, weekly, near daily, or daily use (30 days). Due to small sample sizes of single use and higher prevalence of multiple method use to consume marijuana, frequency is stratified by any use of a method. These analyses do not provide estimates for frequency of concentrate use specifically. Among current adult marijuana users in Colorado, half (49.4%) were monthly to weekly users and half (50.6%) were daily or near daily users. Those who reported dabbing had the greatest difference in prevalence; among adults who reported dabbing, 83.8% reported dabbing daily or near daily compared to 16.17% who dabbed monthly or weekly. Regardless of the method of use, daily or near daily use was more prevalent than monthly or weekly use (Table 9). This could be due to more daily and near daily adult users choosing to use multiple methods to consume marijuana versus just a single 27 | THC Concentration in Colorado Marijuana
method (Figure 4). Those that smoked (56.0% vs. 44.0%) or ingested edibles (54.4% vs. 45.6%) were
slightly more likely to use daily or almost daily. Daily or almost daily users are significantly more likely
to use multiple methods (67.7% (63.0, 72.4]) than adults using one method (32.3% [27.6, 37.0]).

Table 9: Frequency of marijuana use by any use method among current adult
marijuana users, Colorado, BRFSS 2017-2018
 Any Method of Use Weighted Mean                     Monthly or Weekly A          Daily or Near Daily B
                          Days of Use
                                                     % (95% Confidence            % (95% Confidence
                          (95% Confidence            Intervals)                   Intervals)
                          Intervals)

Smoked                    18.5 (17.8, 19.2)         44.0% (41.1, 46.9)           56.0% (53.1, 58.9)

Ate/Drank                 18.0 (17.0, 19.0)         45.6% (41.6, 49.7)           54.4% (50.3, 58.4)

Vaporized                 21.4 (20.4, 22.5)         32.6% (28.0, 37.1)           67.4% (62.9, 72.0)

Dabbed                    25.6 (24.6, 26.6)         16.2% (12.0, 20.4)           83.8% (79.6, 88.0)

Other methods             21.0 (19.1, 22.8)         35.0% (27.3, 42.8)           65.0% (57.2, 72.8)

Total                     17.1 (16.5, 17.7)         49.4% (46.8, 52.0)           50.6% (48.0, 53.2)

Estimates do not add to total due to multiple selection of methods
A Used 1-19 days in the past 30 days
B Used 20 or more days in the past 30 days
Produced by: Marijuana Health Monitoring Program, Colorado Department of Public Health & Environment 2020.
Data Source: Behavioral Risk Factor Surveillance System (BRFSS).

 28 | THC Concentration in Colorado Marijuana
Figure 4: Frequency of marijuana use by single or multiple methods of use among current adult marijuana users, Colorado, BRFSS 2017-2018 Produced by: Marijuana Health Monitoring Program, Colorado Department of Public Health & Environment 2020. Data Source: Behavioral Risk Factor Surveillance System (BRFSS). Data limitations A major limitation of using population surveys to determine prevalence of high concentrated THC use is that questions on marijuana product type and percentage of THC usually used is not collected. Dabbing as a method is typically associated with concentrates, but many other methods can be used to consume high concentrated THC products. Additionally, the purpose of frequency of use questions is for marijuana consumption in general and not for specific product types. These survey questions help monitor patterns of marijuana use. Surveillance of health outcomes due to highly concentrated THC products is limited. Marijuana poison center calls are small in comparison to other substances and often are polysubstance exposures. Causality between concentrated THC exposures and major medical outcomes cannot be determined from these data. 29 | THC Concentration in Colorado Marijuana
Data conclusions
Method of marijuana consumption in Colorado varies between the adult and youth populations. For
Colorado adults 18 and older, 8.2% used multiple methods to consume marijuana during 2017 and
2018 combined. The average prevalence of dabbing concentrates during that time was 3.7%, with only
0.1% of the population dabbing THC concentrates exclusively.

Frequency of use is an important consideration when determining health outcomes. If a current user
is using infrequently, then the possibility of adverse health effects is lower compared to more
frequent users. Among current adult marijuana users 83.8% dabbed, and 67.4% vaporized marijuana
daily or near daily. Daily or near daily users are also more likely to use multiple methods for
consumption use. Frequency of days used does not determine frequency of concentrated THC
consumption and higher prevalence is likely correlated with multiple method users rather than
method of use.

Examining adverse health effects through poison center calls, only 10.7% had a marijuana
concentrated extract code and there have been no major changes in number of exposures since 2017.
Age was the only major difference between cases, and concentrate cases had a higher percentage of
adolescents between 13 and 20 years old (32.7% compared to 22.0%). Adolescents in this age group
had high percentages of intentional use regardless of marijuana product type. 90.6% of concentrate
cases and 83.6% of the other marijuana product types were intentionally using the substances.

 30 | THC Concentration in Colorado Marijuana
Literature review of health effects
Overview of the systematic literature review process
The Marijuana Health Monitoring Program (MHMP) and the Retail Marijuana Public Health Advisory
Committee (RMPHAC) are tasked with reviewing the latest peer-reviewed literature articles
published.6 The scientific literature is systematically searched and reviewed on a quarterly basis. The
quality of key findings from each article are graded as high, medium or low based on the study’s
strengths and limitations. The findings are then compiled by topic and the RMPHAC decides the
overall level of evidence strength for that topic. Evidence levels range from insufficient to substantial.
Definitions for each level and further information about the methodology of this systematic process
may be found at www.marijuanahealthinfo.colorado.gov/process.

Following are health topic categories containing Evidence Statements that have been approved by the
RMPHAC and are supported by CDPHE. Each Evidence Statement is reflective of the current state of
evidence on that specific health effect and the association with high THC concentration or specific
marijuana product. These associations should not be interpreted as causal. Below each statement is a
list of the peer-reviewed articles with the key findings of evidence that supports the statement. The
articles are organized by quality rating (High, Medium and Low). At the end of each list of articles is a
summary of the overall evidence.

THC concentration and mental health effects
Adults
         Evidence Statement: We found MODERATE evidence that individuals who use marijuana with
         THC concentration >10% are more likely than non-users to be diagnosed with a psychotic
         disorder, such as schizophrenia.

         Public Health Statement: No public health statement at this time.

            o   High - none

            o   Medium

 31 | THC Concentration in Colorado Marijuana
Di Forti 2015 - Proportion of patients in south London with first-episode
psychosis attributable to use of high potency cannabis: a case-control study22
Individuals who reported smoking more potent marijuana (average
THC 12.9%) were at 2.91 (95% CI 1.52-3.60) greater odds of developing
first episode psychosis compared to those who never used.
This relationship was not significant for individuals who used lower
concentration marijuana compared to those who never used.
Di Forti 2019 - The contribution of cannabis use to variation in the incidence of
psychotic disorder across Europe (EU-GEI): a multicentre case-control study23
Lifetime use (ever use of cannabis) of high concentration cannabis (>
10% THC) was associated with a psychotic disorder compared with no
lifetime use of cannabis (OR 1.6, 95% CI 1.2-2.2), while uswe of low
0.9-1.5).
Daily cannabis use was associated with increased odds of psychotic
disorder compared with never users (aOR 3.2, 95% CI 2.2 - 4.1),
increasing to nearly five-times increased odds for daily use of high-
potency types of cannabis (aOR 4.8, 95% CI 2.5-6.3).
o Low
Sideli 2018 - Interaction between cannabis consumption and childhood
cannabis abuse in psychotic disorders: preliminary findings on the role of
different patterns of cannabis use.24
Use of cannabis with higher THC content (12-18% THC) was associated
with diagnosis of a psychotic disorder in adulthood, regardless of
childhood cannabis abuse status. (aOR 2.16, 95%CI 1.15-4.06 w/o
childhood cannabis abuse and aOR 3.46, 95%CI 1.34-8.97 w/ childhood
cannabis abuse).
Evidence Statement: We found SUBSTANTIAL evidence that THC intoxication can cause acute
psychotic symptoms, which are worse with higher doses.
32 | THC Concentration in Colorado MarijuanaPublic Health Statement: THC, a component of marijuana, can cause acute psychotic
symptoms such as hallucinations, paranoia, delusional beliefs, and feeling emotionally
unresponsive during intoxication. These symptoms are worse with higher doses.
o High
D’Souza 2004 - The psychotomimetic effects of IV THC in healthy individuals:
implications for psychosis25
THC acutely causes both positive and negative psychotic symptoms, as
well as subjective and objective dissociative symptoms - all in a dose-
dependent manner (5mg vs 2.5mg THC).
All other articles linked to this evidence statement only support
evidence that THC intoxication can cause acute psychotic symptoms,
not that these symptoms are worse with higher doses (5mg vs 2.5mg
THC).
Current literature shows that adults who use marijuana classified as containing high concentrations of
THC (>10% THC) are more likely than non-marijuana-users to be diagnosed with a psychotic disorder,
such as schizophrenia. In a 2015 study by Di Forti et al., individuals who reported using marijuana
products with higher THC concentration (average 12.9% THC) had greater odds of developing first
episode psychosis compared to those who never use marijuana products.22 This relationship remained
after controlling for individual demographic factors and any other substance use. However, for
participants that reported using lower THC concentration marijuana products (~3.6% THC), this
relationship was not maintained, signaling that higher THC concentration may be the catalyst for this
relationship.
A 2004 study by D’Souza et al., found that THC can induce positive and negative psychotic symptoms,
as well as dissociative symptoms, and this relationship exhibits a dose-dependent manner.25
Numerous studies have also shown this association between THC intoxication and psychotic
symptoms, however, evaluation of the effect that dose variation may influence this relationship needs
further evidence.
33 | THC Concentration in Colorado MarijuanaThe relationship between marijuana with high THC concentration (>10% THC) and being diagnosed
with a psychotic disorder was further explored in a 2018 study by Sideli et al. and a 2019 study by Di
Forti et al.23,24 Sideli et al., sought to examine if childhood abuse affected the interaction between
marijuana use and later diagnosis of a psychotic disorder in adulthood. They found that regardless of
childhood abuse status, use of high THC concentration marijuana products (12-18% THC) were
associated with diagnosis of a psychotic disorder.24 In the 2019 study by Di Forti et al., they sought to
explore frequency of use, along with THC concentration, and their associations with psychotic
disorder diagnosis in adulthood. Daily use of any marijuana products was associated with a psychotic
disorder, however daily use of high THC concentration products (>10% THC) was more strongly
associated (OR 4.8; 95% CI 2.5-
2.2; 95% CI 1.4-3.6) when compared to never using marijuana. On the other end of the frequency
spectrum, ever use of high THC concentration marijuana was associated with a psychotic disorder (OR
1.6; 95% CI 1.2-2.2), while ever use of low THC concentration marijuana was questionable (OR 1.1;
95% CI 0.9-1.5), when compared to no lifetime use of marijuana.23
Adolescents and young adults
Evidence Statement: We found MODERATE evidence that adolescents/young adults who use
marijuana with higher THC concentration (>10% THC) are more likely than non-users to
continue use.
Evidence Statement: We found MODERATE evidence that adolescents/young adults who use
marijuana with higher THC concentration (>10% THC) are more likely than non-users to
develop future mental health symptoms and disorders.
Public Health Statement: High THC concentration marijuana use by adolescents and young
adults is associated with continued use and development of future mental health symptoms
and disorders.
o High - none
o Medium
Di Forti 2015 - Proportion of patients in south London with first-episode
psychosis attributable to use of high potency cannabis22
34 | THC Concentration in Colorado MarijuanaYou can also read