IMPLEMENTATION OF THE SOCIAL ACCOUNTABILITY FRAMEWORK (ISAF) - FINDINGS AND RECOMMENDATIONS FOR Analysis of the data generated during ISAF phase I ...
←
→
Page content transcription
If your browser does not render page correctly, please read the page content below
IMPLEMENTATION OF THE SOCIAL
 ACCOUNTABILITY FRAMEWORK
           (ISAF)

   Analysis of the data generated during ISAF
               phase I (2016-2018)

  FINDINGS AND RECOMMENDATIONS FOR
                PHASE II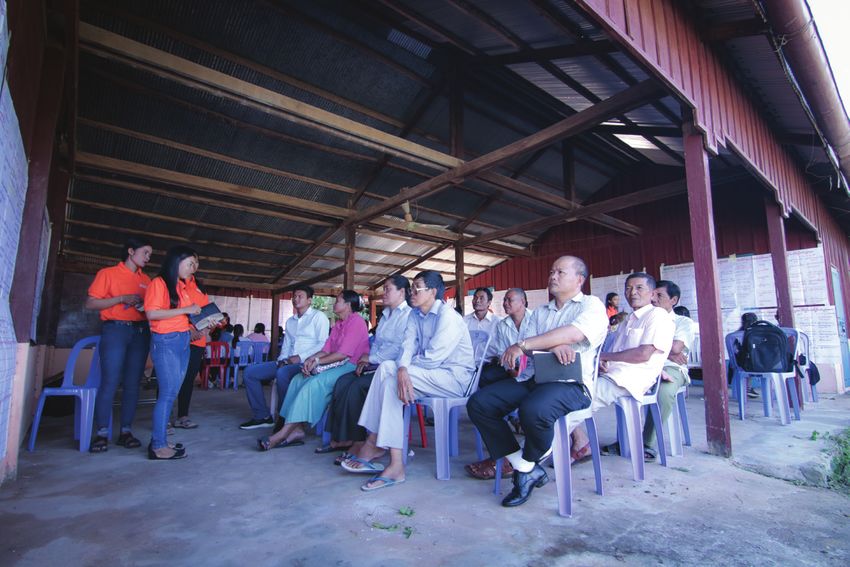
Contents
Acknowledgements ................................................................................................................................. 2
List of figures ........................................................................................................................................... 3
List of tables............................................................................................................................................. 4
Abbreviations .......................................................................................................................................... 5
Executive summary ................................................................................................................................. 6
   Preliminary evidence that the ISAF theory of change is working........................................................ 6
   The case for a national level public response to the feedback of the citizens .................................... 7
   How better usage of ISAF data could increase responsiveness to citizens’ voices ............................. 8
Recommendations................................................................................................................................... 9
1. Background ........................................................................................................................................ 11
   1.1. Introduction and context ............................................................................................................ 11
   1.2. Objective and research questions .............................................................................................. 12
   1.3. Methodology .............................................................................................................................. 12
2. The datasets ...................................................................................................................................... 14
   2.1. Characteristics of the datasets ................................................................................................... 14
   2.2. Strengths and limitations of the datasets .................................................................................. 16
3. Detailed findings from the review of the ISAF data from Phase I ..................................................... 18
   3.1. Findings from the review of the data generated during the scorecard process ........................ 18
   3.2. Findings on the Information for Citizens .................................................................................... 26
   3.3. Findings from the review of the data from the Joint Accountability Action Plans..................... 27
   3.4. Findings from the review of the data on the implementation of JAAP activities ...................... 31
4. Examples of findings from a review of the data focusing on specific geographic areas ................... 37
5. How to promote the use of the ISAF data ......................................................................................... 40
   5.1. Awareness of local and national officials about ISAF ................................................................. 40
   5.2. Potential users, their needs and entry points ............................................................................ 40
   5.3. Potential relevance of ISAF data for non-state actors................................................................ 42
6. Detailed recommendations ............................................................................................................... 43
   6.1. On the data collection and M&E systems .................................................................................. 43
   6.2. On the Scorecard ........................................................................................................................ 43
   6.3. On the Information for Citizens .................................................................................................. 44
   6.4. On the JAAPs............................................................................................................................... 44
   6.5. On how to promote the use of the ISAF data............................................................................. 45
   6.6. On awareness about ISAF and sustainability of the social accountability processes ................. 45
Annexes ................................................................................................................................................. 46
   Annex 1. Summary of the needs of the potential users, entry points and data products ................ 46
   Annex 2. List of categories for each service (grouping 1 and grouping 2) ........................................ 47
   Annex 3. List of people interviewed .................................................................................................. 50
   Annex 4. The ISAF process ................................................................................................................. 50
   Annex 5. Brief on recent relevant changes in the policy landscape .................................................. 52
   Annex 5. Area of implementation of the five main implementing partners (2016 – 2018).............. 54

Acknowledgements

This report is the product of work by a multi-sector team led by Mathieu André, ISAF and Advocacy
Technical Lead at World Vision International Cambodia.

The ISAF data was collected and provided by five organizations: CARE International Cambodia, the
Reproductive and Child Health Alliance (RACHA), Save the Children International Cambodia, Star
Kampuchea and World Vision International Cambodia. They also provided comments and advises on
the methodology and scope of the review to be conducted. From these organizations, the team would
like to thank Sovannara Eang, Tun Youheang, Taing Sam Ath, Sol Sowath, Chea Cheysovanna, Phoeurn
Sokchan, Jan Noorlander and Rebecca Haines.

The data was consolidated, cleaned, categorized and labelled by Ratha Phan, Edgar Kisembo, Khon
Rosa, Nuon Sreynich, Nath Sreypet, Seng Sarith and Mathieu André.

The analysis of the data and the drafting of the findings and recommendations were done by Mathieu
André and Dr. Kimchoeun Pak (consultant).

The team is grateful for the support provided by the National Committee for Sub-National Democratic
Development - Secretariat (NCDD-S). The team is also grateful for the significant contributions made
by Suzanne Cant, Sophors Yin, Chhaileng Hour, Vireak Leng, Robert Gillen, Sotharith Ry, Rany Saing,
Francesca Ciccomartino, Meloney Lindberg, Besinati Mpepo, Andrew Hassett, Jeff Hall, Rob
Worthington, Erik Caldwell Johnson, Anne Provo and Dr. Samrith Wannak.

World Vision International Cambodia would like to thank the European Union, the World Bank and
the Japan Social Development Fund (JSDF) for their financial support and trust during Phase I of ISAF.

This study was funded by World Vision international Cambodia with the support of the Global
Campaigns Team of World Vision International.

The findings, interpretations, and conclusions expressed in this paper do not necessarily reflect the
views of World Vision International Cambodia or the other organizations and individuals that
supported its development.

                                                                                                    2
List of figures
Figure 1: Scores by characteristic of services and sector in Ampil Ta Pok commune (2016)................ 19
Figure 2: Average level of satisfaction as expressed by users or service providers and by services .... 19
Figure 3: Average level of satisfaction by service across years ............................................................. 20
Figure 4: Distribution of the scores by services and by years ............................................................... 20
Figure 5: Average level of satisfaction across years by provinces and services .................................... 21
Figure 6. Distribution of the scores for education service per province ............................................... 21
Figure 7. Distribution of the scores for administrative service per province ........................................ 22
Figure 8. Distribution of the scores for health service per province ..................................................... 22
Figure 9: proportions of citizens perceiving the services received as good or very good, by service and
by province ............................................................................................................................................ 23
Figure 10: Average level of satisfaction for the top 10 best-rated characteristics of services per sector
............................................................................................................................................................... 23
Figure 11. Distribution of the satisfaction scores for the top 5 characteristics of services most frequently
prioritized for the commune administrations ....................................................................................... 24
Figure 12. Distribution of the satisfaction scores for the top 5 characteristics of service most frequently
prioritized for primary schools .............................................................................................................. 25
Figure 13. Distribution of the satisfaction scores for the top 5 characteristics of services most frequently
prioritized for health centres ................................................................................................................ 25
Figure 14: Characteristics of services prioritized by service and by year (grouping #2) ....................... 26
Figure 15: Who suggested the actions integrated into the JAAPs by services, by year ........................ 27
Figure 16: Top five actions most frequently included in the JAAPs and who suggested them............. 28
Figure 17: Number of actions included into the JAAPs by year (Grouping #2) ..................................... 29
Figure 18: Proportion of the actions for which external resources are expected to be required for
implementation, by categories of actions (Grouping #2) ..................................................................... 30
Figure 19: Actions requiring external resources or not and who suggested them ............................... 30
Figure 20: Status of implementation by services, by years for 2016, 2017 (in %) ................................ 31
Figure 21: Status of implementation by services and who raised the actions ...................................... 31
Figure 22: Status of implementation by service and who raised them (without unspecified) ............. 32
Figure 23: Status of implementation by categories of actions (Grouping #2) ...................................... 32
Figure 24: Implementation status of the actions responding to the top 5 issues most frequently raised
for commune services (Grouping #1, %) ............................................................................................... 33
Figure 25: Implementation status of the actions responding to the top 5 issues most frequently raised
for primary schools (Grouping #1, %) .................................................................................................... 33
Figure 26: Implementation status of the actions responding to the top 5 issues most frequently raised
for health centres (Grouping #1, %) ...................................................................................................... 33
Figure 27: Top ten less implemented actions by expected resources and sectors ............................... 35
Figure 28: Implementation of actions by province ............................................................................... 36
Figure 29: Integration into CIP by service, by year................................................................................ 36
Figure 30. Distribution of scores in Prey Veng per sector and per year................................................ 37
Figure 31: Average score by district and by service in Banteay Meanchey province ........................... 37
Figure 32. Distribution of scores in 4 districts of Banteay Meanchey ................................................... 38
Figure 33: Average scores by commune and by service in Chi Kraeng district (Siem Reap province) .. 38
Figure 34. Distribution of scores by communes of Chi Kraeng district (Siem Reap) for health services
............................................................................................................................................................... 39
Figure 35. Distribution of scores in Preah Theat, Ou Reang Ov district, Tboung Khmum province, per
sector and per year................................................................................................................................ 39
Figure 36. The ISAF process – annual cycle ........................................................................................... 50
Figure 37: Planning and budgeting under PBB ...................................................................................... 53
Figure 38: Planning and budgeting for SNAs ......................................................................................... 53

                                                                                                                                                                3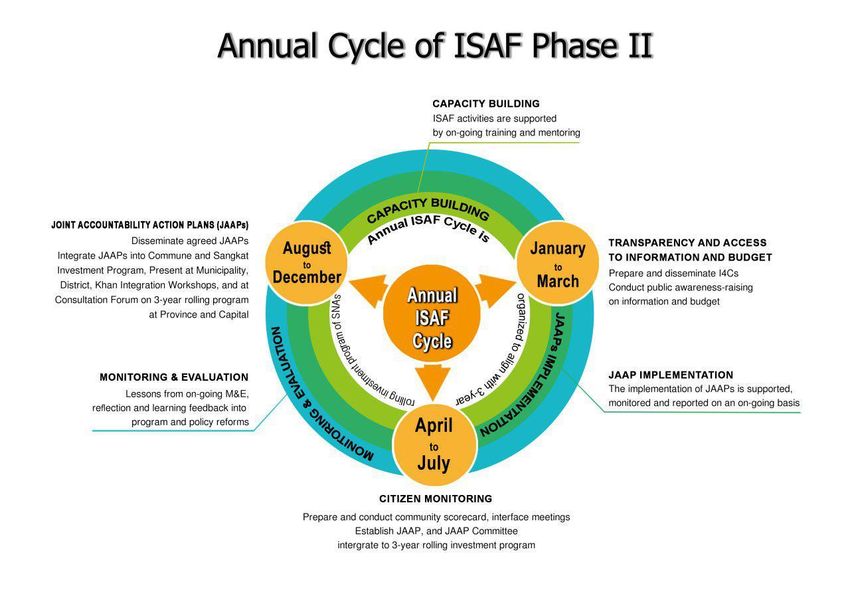
List of tables
Table 1. Top 5 issues most frequently prioritized by users and service providers, % of facilities affected,
average satisfaction scores and % of responding actions implemented ................................................ 7
Table 2: Categories and grouping .......................................................................................................... 13
Table 3: Key government policies reviewed and actors interviewed ................................................... 14
Table 4: The datasets and sample size .................................................................................................. 15
Table 5: Key variables in the two datasets ............................................................................................ 16
Table 6: An example of official codes for geographical areas and facilities .......................................... 18
Table 7: Characteristics of service most frequently prioritized by citizens, satisfaction scores and % of
facilities for which they were raised ..................................................................................................... 24
Table 8: Characteristics of the services identified as insufficiently addressed in the IC4 materials ..... 27
Table 9: Needs of potential users, entry points and data products ...................................................... 46
Table 10. Categories of issues and actions for Commune Administration ........................................... 47
Table 11. Categories of issues and actions for Primary School ............................................................. 48
Table 12. Categories of issues and actions for health centres .............................................................. 48

                                                                                                                                            4
Abbreviations
BSRS       Budget System Reform Strategy
CA         Commune Administration
CCWC       Commune Council for Women and Children
CDB        Commune Database
CIP        Commune Investment Program
CP         Capital and Provincial
CS         Commune/Sangkat
CSF        Commune Sangkat Fund
CSO        Civil Society Organization
DFID       Department For International Development
DM         District and Municipal administration
DoEYS      District office for Education, Youth and Sports
EMIS       Education Management Information System
EU         European Union
FMIS       Financial Management Information System
GDB        General Department of Budget
GDSNAF     General Department Sub-National Administration Finance
HC         Health Centre
HIS        Health Information System
HRMIS      Human Resource Management Information System
I4C        Information for Citizens
ICT        Information and Communication Technology
ISAF       Implementation of the Social Accountability Framework
JAAP       Joint Accountability Action Plan
JSDF       Japanese Social Development Fund
LD         Line Department
MEF        Ministry of Economy and Finance
MCS        Ministry of Civil Service
MoEYS      Ministry of Education, Youth and Sport
MoH        Ministry of Health
MoI        Ministry of Interior
MoP        Ministry of Planning
NAP-YD     National Action Plan for Youth Development
NCDD-S     National Committee for Sub-National Democratic Development - Secretariat
OD         Operational District
OWSO       One Windom Service Office
PBB        Program-based budgeting
PEA        Political Economy Analysis
PFMRP      Public Financial Management Reform Program
PHD        Provincial Health Department
PoEYS      Provincial office for Education, Youth and Sports
PS         Primary School
PSC        (ISAF) Partnership Steering Committee
RACHA      Reproductive and Child Health Alliance
SNA        Sub-national administration
TWG        Technical Working Group
UNDP       United Nations Development Programme
USAID      United States Agency for International Development
WCCC       Women and Children's Consultative Committee
WVI        World Vision International Cambodia

                                                                                      5
Executive summary
Participatory processes to involve communities have been a part of local governance and
decentralisation initiatives led by the Royal Government of Cambodia and supported by donors,
including United Nations Development Programme (UNDP) and the World Bank, since the mid-1990s.
In 2015, the government launched the Implementation of the Social Accountability Framework (ISAF)
to further improve services through community empowerment and enhanced accountability of sub-
national administrations (SNAs). This initiative, unique in its scale, is implemented in partnership with
Civil Society Organizations (CSOs) and a number of institutional donors.
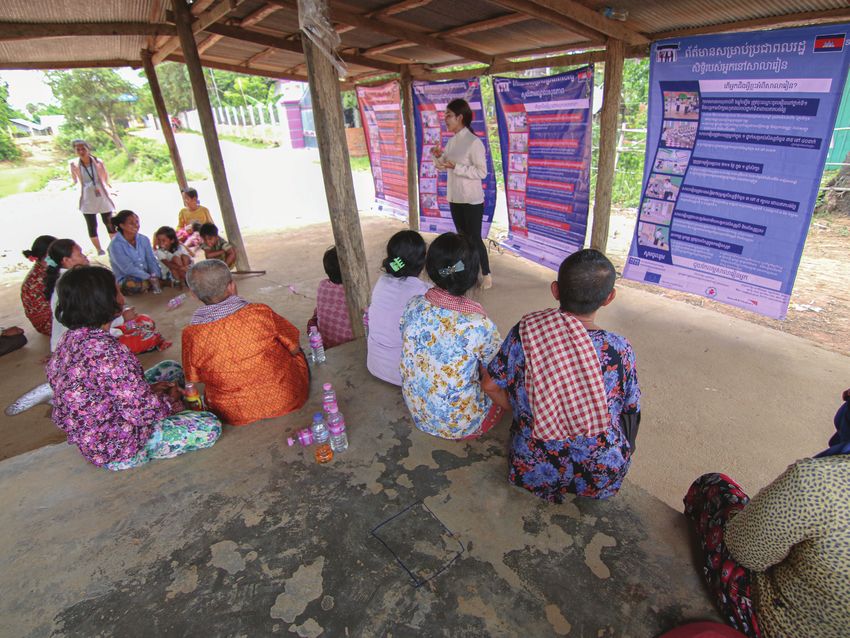
ISAF Phase I (2015 – 2018) covered 757 commune administrations, 1404 primary schools and 605
health centres. More than 550,000 people took part in the process. More than 270,000 citizens and
almost 50,000 service providers took part in the monitoring of the quality of local services using
community scorecards1. Representatives of these citizens and service providers were then involved in
town hall meetings to discuss performance ratings of the services with local officials and to develop
Joint Action Accountability Plans (JAAPs) to address service issues. Around 60% of these actions were
implemented within 12 months of their adoption, contributing to improved local services.
Over this period, the ISAF process generated a significant amount of data on the performance of
services. The data is based on ratings provided by the citizens and service providers and was collected
by the implementing partners2 and then consolidated by World Vision International Cambodia (WVI).
Once consolidated and cleaned, this unique dataset included more than 720,000 votes from 180,000
people3 who participated in the scorecard meetings by scoring the quality of local services of 680
commune administrations, 934 primary schools and 506 health centres. The data also includes detailed
information about approximately 33,900 actions adopted following town hall meetings about the
services provided in these 2120 facilities. This is understood to be the largest citizen data aggregation
exercise via a government partnership involving community scorecards.
Preliminary evidence that the ISAF theory of change is working
The review of the data shows that it is possible to identify patterns and trends about service user
satisfaction. Several other nationwide patterns and trends are described within this report and
highlight broad scope for further analysis from the data.
The main “actionable” finding presented in this report is related to the consensus of service users and
providers nationwide on the poor performance of staff at local facilities, especially with regard to
punctuality, friendliness, courtesy and respect of internal rules. For example, poor staff attitude was
raised by users as an issue in 80% of the health centres. Other key issues raised included availability of
operational supplies and materials (manuals for students, essential medicines, etc.) and issues with
service infrastructure. Table 1 below presents the top five issues raised for each service.
An analysis of the citizen-generated data suggests that the ISAF program was relatively successful at
addressing the issues most frequently raised. Firstly, for 2016 and 20174, the rates of implementation
of the JAAP actions were over 60% for both years. That is, of the actions needed to improve services,
more than 60% were carried out, most of them by local authorities that seem to have reacted positively
to social accountability. The data also shows above-average rates of implementation for the majority
of actions focusing on the issues most often prioritized by citizens. These include actions related to
staff performance (which generally did not require additional funding to be implemented). For
1
Community scorecards allow communities to rate the performance of their services, together with service providers, and provide feedback
to government for service improvements. Community Services Scorecards were first pioneered by CARE, with the support of the World
Bank.
2
CARE, the Reproductive and Child Health Alliance (RACHA), Save the Children International Cambodia, Star Kampuchea and World Vision
International Cambodia (WVI).
3
Due to some gaps in the M&E and data collection systems, the data generated by an additional 90,000 participants was not collected, was
lost or was not usable for this study. This missing data was related to the services provided by 77 commune administrations, 470 schools and
99 health centres.
4
Due to significant gaps in the data for 2018, the implementation of JAAPs for this year was not analysed.
6
example, 76% of actions related to the performance of staff at primary schools were implemented 12
   months after adoption of the JAAPs.

   Secondly, the data shows that the level of satisfaction of both users and service providers increased
   from 2016 to 2018 (5.7% on average) with the biggest increase registered for commune administration
   services (8.6%)5. All of the provinces, except Kratie and Siem Reap, ended the project with higher levels
   of expressed satisfaction than at its start.

   While the findings need to be verified with data collected over a longer period of time (and with
   objective data on the quality of services6), the data is encouraging; it suggests that the ISAF theory of
   change is, to a certain extent, working as designed. Users and service providers identified key issues
   and actions to address them, local authorities and service providers implemented the actions
   responding to the key issues and, as a result, the quality of service and satisfaction of citizens improved.

      Table 1. Top 5 issues most frequently prioritized by users and service providers, % of facilities
              affected, average satisfaction scores and % of responding actions implemented
                                                                              % of      Ave. % of actions
 Sector         Characteristics of services most frequently prioritized
                                                                            facilities Score7 implemented
         Respect of working hours, punctuality and internal rules             69%       3.04         73%
         Public posting and dissemination of information                      66%       2.95         72%
Admin.
         Staff behaviour, friendliness and politeness                         60%       3.11         70%
Services
         Openness to the views of citizens and responsiveness to their
                                                                              48%       2.97         77%
         concerns
         Condition of the commune hall (building)                             35%       2.46         49%
         Functioning and gender-segregated toilets                            61%       2.79         64%
Primary Respect of working hours, punctuality and discipline                  57%       3.14         70%
schools Hygiene, sanitation and environment of the school                     57%       2.88         69%
         Adequate number of textbooks per student                             51%       3.08         79%
         Condition of the school building                                     42%       2.60         45%
         Staff behaviour, friendliness and politeness                         79%       3.09         70%
 Health Adequate availability of essential medicines                          61%       3.10         72%
centers Adequate number of staff during working hours                         55%       2.97         55%
         Availability of 24 hour emergency health services                    54%       3.08         76%
         Respect of working hour, punctuality and respect of internal rules   51%       3.07         78%

   The case for a national level public response to the feedback of the citizens
   Several of the patterns and trends that emerge from the ISAF data have potential to be extremely
   useful for improving implementation of government policy, planning, budgeting and M&E purposes
   for services. This is a compelling argument for increased use of the data at district, provincial or
   national levels. Importantly, if there was a coordinated effort by the government to use the data,
   arguably, we would see greater efficacy in the process and, in turn, better quality services. As
   hypothesised by several major studies, social accountability is likely to work better at scale when
   complemented by national public sector interventions. A macro-evaluation for the UK’s Department
   for International Development (DFID) 8 found that social accountability “almost always” impacts local

   5
     Commune administrations provide services related to civil registry, planning and budgeting, representation and decision-making, information
   and consultation of citizens, etc.
   6 The scorecards which rate service user satisfaction are based on user perceptions
   7
     During the scorecard process, users and services providers rated the quality of the services in relation to specific characteristics of these
   services from very bad to very good. This study uses numbers to visualize their level of satisfaction (1=very bad, 2=bad, acceptable=3, 4=good
   and 5=very good). An average score below 3 means that there are more people with a negative opinion than people with a positive opinion
   about this characteristic of service.
   8 Holland and Schatz, 2016. Macro Evaluation of DFID’s Policy Frame for Empowerment and Accountability, Empowerment and Accountability
   Annual Technical Report 2016: What Works for Social Accountability, DFID.

                                                                                                                                                7
services, but that social accountability could, arguably, have greater impact at scale if it were
complemented by public sector interventions. A 2019 systematic review of social accountability by 3IE9
also found that there was a need for “complementary interventions to address bottlenecks around
service provider supply chains” to achieve greater efficacy.
Another argument in favour of a national level public response to the feedback of the citizens can be
found in the weak action or response of local authorities on some issues, regularly raised by citizens.
These included infrastructure, staff allocation and national procurement and supply chains supporting,
for example, the availability of essential medicines at the health centres. These findings are not
surprising:
Substantial and costly investments (required to build a new school or commune hall) are beyond
the capacities of most local authorities and service providers
The allocation of staff or supplies for health centres and primary schools are the responsibility of
provincial and national authorities and line ministries are not involved in the design nor the
implementation of the JAAPs.
These findings highlight the limited influence of the ISAF process on broader vertical accountability
matrixes, a common issue, where scale has been coined the ‘Achilles heel’ of participatory approaches
(Levy, 2014).10
The issue and its immediate consequences can be summarized:
Local authorities and service providers seem unable to respond to some issues most frequently
raised by citizens (because solutions require significant investments or because the issues are
related to national processes or systems).
The feedback and concerns of the citizens expressed during the ISAF process (or the limited
capacities of local authorities to respond to the feedback of citizens) did not reach the stakeholders
who may have had the capacities and/or mandates to respond to this feedback (provincial and
national authorities and line ministries).
As a result, no additional responses were developed following the failure at local level to respond
to the feedback of the citizens.
How better usage of ISAF data could increase responsiveness to citizens’ voices
Through a review of the ISAF data, it is possible to identify patterns and trends in citizen feedback on
services that cannot be found in other official data. This can provide a valuable complementary source
of information for government planning at national and sub-national levels in order to improve
services.
However, a policy landscape analysis and key informant interviews have confirmed that the data in
itself, even communicated to the right stakeholders, will not guarantee action. As highlighted by Fox
(2015)11, a strategic approach is required to ensure the uptake of the data for improved governance of
services.
The potential data users range from high-level policymakers to managers at facility level:
At the national level, the information on the perception of the citizens generated through the ISAF
process, although not qualifying as indicators of impact, can be used as a proxy to measure the
effectiveness and efficiency of public spending on local services by line ministries and the Ministry
of Economy and Finances (MEF).
The findings on the citizens’ perception of staff performance are relevant to the Ministry of Civil
Service (MSC).
9
Waddington, H, Sonnenfeld, A, Finetti, J, Gaarder, M and Stevenson, J, 2019. Does incorporating participation and accountability improve
development outcomes? Meta-analysis and framework synthesis. 3ie Systematic Review 43. London: International Initiative for Impact Evaluation
(3ie).
10
Levy, B, 2014. Working with the grain: Integrating Governance and Growth in Development Strategies, Oxford University Press.
11
Jonathan Fox, Social Accountability: What Does the Evidence Really Say?, World Development, No. 72, August, 2015.
8 The National Committee for Sub-National Democratic Development (NCDD) and Ministry of
Interior (MOI) can use the ISAF data to complement their regular local governance survey, which
seeks to measure the satisfaction of citizens with local government.
At the provincial level, the ISAF data would be useful to both de-concentrated line departments
(for vertical accountability) and decentralized Subnational Administrations (SNAs) (for horizontal
accountability) over technical offices and facilities.
Most of the potential users would find the data useful for planning, budgeting and reporting/M&E
purposes. To be useful to these users, the ISAF data and analysis that will be shared should be kept
simple. Ideally, very short and clear information briefs should be shared on a regular basis with the
potential users.
Recommendations
1. Invest in deeper analysis of the data
This study aimed to analyse the potential use of citizen-generated data under ISAF and how it could be
better managed and utilised during Phase II for improving services. However, a systematic review of
the data was not conducted and there is much more to learn, leading us to the first recommendation:
a greater investment in the analysis of this unique dataset focusing on specific services, issues or
geographic areas, and especially on the issues related to poor staff attitude and performance.
There is also a need to understand how and why some actions were integrated into Commune
Investment Programs (CIPs) and to what extent the recent increase of the Commune/Sangkat Fund
could be an opportunity to improve responsiveness to the JAAPs12.
2. For the Royal Government of Cambodia, promote the use of citizen data by relevant ministries
and departments as an evidenced-based way of improving services
The findings presented in this report highlight the need for better use of the ISAF data for two main
reasons:
The data enables the identification of patterns and trends in citizen feedback on services, which
cannot be found in other official data and can provide a valuable complementary source of
information for government planning at national and sub-national levels to improve services.
Some of the issues identified through the ISAF process need to be addressed by higher levels of
government. Further analysis of the ISAF data, which was beyond the scope and budget of this
small study, is needed to properly respond to the feedback of citizens.
There is a need for the relevant stakeholders, especially NCDD-S and members of the PSC, to develop
a clear strategy (and processes) to promote data utilisation. This strategy will have to include objectives
to:
Increase the buy-in from potential users (awareness of the ISAF initiative and trust in the data)
Ensure that the right data is shared in a timely way with the right stakeholders using the right
formats
Suggest actions for civil society and development partners to promote the use of the data and use
it themselves
3. Strengthen the data collection and M&E systems
An important step toward a better use of the ISAF data will be to improve and standardize the data
collection and M&E processes used by all implementing partners, especially on the indicator definitions
and quality control processes. There is also a need to find solutions to allow disaggregation of data of
vulnerable groups.
12
The commune / sangkat development budget was doubled to more than $70,000 in 2020, excluding administrative costs, and was expected
to more than triple in 2023. This provides great opportunity for local authorities to respond to citizen needs.
94. Review the information provided to citizens
The review of the ISAF data also shows that the information provided to citizens (I4C)13 needs to be
revised to provide information that better reflects the key concerns of citizens, especially on
performance of service staff and infrastructures.
13
The current civic education materials provided to citizens under ISAF is known as “Information for Citizens” (I4C) and is currently shared
through posters and other communication products and activities. Content includes a presentation of the key national standards related to
each service, budget information (income and expenditures of local facilities and of the commune) and information on the performance of
local facilities against objective indicators. See part 3.2 for detailed analysis on I4C and the annexes for additional information on the ISAF
process.
101. Background
1.1. Introduction and context
The Implementation of the Social Accountability Framework (ISAF) in Cambodia aims to empower
citizens, strengthen partnerships between sub-national administrations (SNAs) and citizens, and
leverage enhanced accountability of SNAs to improve local service delivery. During Phase I (2016-
2018), ISAF’s four operational components - (1) access to information and open budgets, (2) citizen
monitoring, (3) capacity building and facilitation and, (4) program management, learning and
monitoring were designed, tested, and refined. Partnerships between the state of Cambodia,
institutional donors and civil society actors were established and ISAF activities were successfully rolled
out to 75% (18 out of 24) of the provinces, 62% (98 out of 159) of the districts and 56% (786 out of
1409) of the communes across the country.
By the end of Phase I, the full ISAF process had been implemented in relation to the services provided
by 757 Communes, 1404 Primary Schools and 605 Health Centres over a 2 or 3-year period of time
depending on the districts. In all communes and every year, Joint Accountability Action Plans were
adopted and 61 % of the actions not requiring external funding were implemented after a year (44 %
of the actions requiring external funding). 550,000 people had been informed on the services they are
entitled to receive and 270,000 people were involved in the monitoring of the quality of the services
received at local level (through a scorecard methodology). 4,200 volunteers and 16,000 officials had
been trained. While the formal evaluation has not been released at the time of this report, anecdotal
evidence suggest that ISAF Phase I led to enhanced mutual understanding and improved
communication between citizens and local authorities
To support the participation of citizens at local level, five main implementing partners (CARE, the
Reproductive and Child Health Alliance - RACHA, Save the Children International Cambodia, Star
Kampuchea and World Vision International Cambodia – WVI) led the process supported by several
donors (the European Union - EU, the United States Agency for International Development – USAID,
the World Bank and Oxfam) and several other Civil Society Organizations (CSOs), especially local
organizations.
During Phase I, the ISAF process generated a significant amount of data that was captured by the
partners:
For each facility (health centre, primary school or commune administration), users and service
providers conducted an evaluation of the quality of services provided using a scorecard
methodology (grading from 1 to 5 their level of satisfaction using emotion icons) in relation to 5
characteristics of the service delivery (such as punctuality of staff, availability of essential drugs,
etc.) that they decided to prioritize.
For each facility, around 5 prioritized actions that local stakeholders agreed to implement during
the next 12 months to address the key challenges identified by communities were identified. The
actions from all relevant facilities were consolidated in Joint Accountability Action Plans (JAAPs)
for each commune.
A monitoring of the implementation of these JAAPs and, in some cases, of their integration into
Commune Investment Programmes (CIPs) was also conducted.
This data was collected by the five implementing partners from January 2016 to end of 2018 using
slightly different formats and methodologies. Some of this data was unfortunately not captured or was
lost due to various reasons. Before this study, the data collected during ISAF Phase I had never been
aggregated and was scarcely used for any other purposes than the monitoring of the performance of
the implementing partners and the progress of the project.
111.2. Objective and research questions
1.2.1. Objectives
The specific objective of this study is to analyse the data generated during the 3 years (2016-2018) of
the implementation of ISAF Phase I, both scorecard and JAAPs, to show its potential and explore how
the data could be used better during Phase II to improve the quality of local services. More specifically,
the objectives are:
To show it is possible to identify significant patterns and trends in the data, especially on the level
of satisfaction of users on the quality of the service delivery and on the actions identified in the
JAAPs, by type of local services (health centres - HC, primary schools – PS - and commune
administration - CA), geographical area (district or province) and other necessary variables.
To suggest technical and practical solutions to promote the use of the ISAF data for policy
development, planning, budgeting and M&E purposes by relevant national and sub-national
administrations.
To identify the M&E standards that should be met by future implementing partners, including the
type of data that should be collected, to possibly allow for the use of the data for policy making,
planning, budgeting and advocacy purposes.
It is important to note at this point that a systematic review of the data was not conducted and there
is certainly much more to learn from it than what is presented in this report, especially about
satisfaction with the quality of local services and responsiveness of local authorities and service
providers.
1.2.2. Key Questions for analysis
Addressing the key purposes of the study, several main research questions were used as the guidance
for designing the methodology and analysis.
What are the significant patterns and trends in the satisfaction of users and service providers with
the quality of local services as expressed through community scorecard rating?
Is the information provided through the Information for Citizens (I4C) material and posters
adequate in view of the issues most often identified and prioritized by communities? If not, which
information and standards should be added into the current I4C material?
Are there any significant patterns and trends in the categories of actions that were identified and
integrated in the JAAP?
What are the patterns in the categories of actions that most often implemented or not
implemented, integrated into Commune Investment Programmes (CIPs) or not?
How could the data of ISAF Phase I being used for a bigger impact on service quality (and service-
delivery decision making), accountability and policy influencing, and by who?
1.3. Methodology
1.3.1. Overall guiding framework
In addition to the quantitative data analysis techniques (discussed below), the analysis in this report is
guided by an understanding of:
The relevant social accountability concepts and the ISAF Implementation Framework (please see
the annex section for more information), and
How the ISAF is related to the broader public service deliverable reform, including:
o Decentralization reform, especially functional transfer, fiscal transfer, local participation and
accountability,
o Public financial reform agenda especially the budgeting and M&E reform, and
o Relevant sectoral policy and reforms relating to primary education, primary health and
administrative services.
1.3.2. Data processing, cleaning and consolidation
The data was collected from all five implementing partners by World Vision International Cambodia
(WVI) and reorganized to be integrated into 2 datasets: scorecard data and JAAP data. Some errors in
the data were manually corrected (spelling of the names of communes or facilities for example). Some
12of the data collected did not include enough information and was discarded (scorecard data not
mentioning the issues prioritized for example).
1.3.3 Categorization and labelling
To allow analysis, categories were created for both “characteristics of the service prioritized by
communities” for the scorecard data (see box 1) and “actions” for the JAAPs. This allowed to label all
issues or actions and to group the ones that were related (such as “fix the lock of the toilet” and “install
a new door for the toilet”). The categories for the issues and the categories for actions are responding
to one another (for example issue with punctuality of staff and action to improve punctuality) and
therefore there is a similar number of categories for the issues and for the JAAP actions. The list of
these categories is in annex.
World Vision first clustered the issues raised by communities during the scorecard meetings around
categories (22 to 27 depending on the sector). The JAAP actions were then categorized using the same
list and definitions. This work and the categories created are thereafter referred to as Grouping #1.
These categories allowed to consolidate and analyse the data to see which characteristics of the service
delivery citizens are most satisfied and/or dissatisfied about, which categories of actions are most
implemented, etc.
Table 2: Categories and grouping
Grouping #1 Grouping #2
• Human resource/staff (Performance or Resources)
CA - 22 categories • Equipment/material (Performance or Resources)
PS - 25 categories • Environment (Performance or Resources)
HC - 27 categories • Infrastructure (Performance or Resources)
• Information (Performance or Resources)
• Others (Performance or Resources)
In the analysis conducted for this report, the categories created as part of the grouping #1 were further
grouped into 6 broader categories related to specific characteristics of the services delivery (e.g.
personnel/people related issues, equipment/materials related issues, infrastructure, environment,
information, etc.). For the 6 categories, 2 subcategories were created depending whether the issue is
related to the performance of the front line service providers (performance) or a matter of resource
and investment (resource)14. This work and the categories created are referred to as Grouping #2. They
allow to conduct an analysis to suggest where the issue may find its cause, i.e. either at the local or
higher level, and therefore can help to understand how to better respond to them. For a full list of
categories, see the annex section.
This categorization and labelling was done manually for each entry of the datasets. At this stage, it was
impossible to come back to the implementing partners to ask for clarification when the data was
missing or unclear. It was an issue for a small proportion of the dataset entries that, in some cases, had
to be discarded.
1.3.4 Quantitative data analysis
The analysis was then conducted. Several times during the process, the preliminary findings were
presented to and discussed with key stakeholders (including during a workshop in November 2019).
1.3.5. Policy review and key informant interviews
Guided by the analytical framework and the discussion about potential users of the ISAF data, key
policy documents were reviewed and key informants, state and non-state actors, were interviewed at
both national and provincial levels. The table below provides a summary. For a full list of persons
interviewed, please, see the annex section.
14
For example, if citizens complain that there is no information board at the health centre, the category will be “information” and the sub
category “resources”. If there is an information board but the community complains that the information is not displayed, the issue will be
categorized as “Information” and the sub category will be “performance” because the issue is linked to the respect of rules by the staff at the
health centres.
13Table 3: Key government policies reviewed and actors interviewed
Areas/level Cross-sectoral Sectoral
Decentralization Primary education
Relevant policies Public financial management Primary health service
Civil service reform Commune admin services
Government actors
MEF MoEYS
Ministries MoI MoH
Ministry of Civil Service
Prov. Admin PoEYS
Sub-national level ISAF focal persons PHD
Department of Planning
Non-state actors
Development partners
NGOs
2. The datasets
2.1. Characteristics of the datasets
There are two sets of data: the scorecard and the JAAP datasets.
2.1.1 The scorecard dataset
The scorecard dataset includes information about the results of the scorecard meetings. During the
scorecard meetings, citizens were asked to rate (very bad, bad, acceptable, good and very good)
specific aspects or characteristic of the services that they had received from local service providers15.
They expressed their satisfaction through individual votes. For this report, the level of satisfaction was
expressed using score (1=very bad, 2=bad, 3=acceptable, 4=good and 5=very good).
Overall, the scorecard dataset includes around 720,000 votes coming from around 180,000
participants of the scorecard meetings16 and focus on the services offered by 680 commune
administrations, 934 primary schools and 506 health centres. In their project reports, the five partners
reported around 270,000 participants of the scorecard meetings, meaning that the votes / opinions of
around 90,000 people (33%) are missing due to gaps in the M&E and data collection systems. This
missing data was related to the services provided by 77 commune administrations, 470 schools and 99
health centers.
On average, 33 people attended each meeting organized by the implementing partners. They voted on
21,967 aspects or characteristics of the services (such as “attitude of staff” or “condition of the school
building”, referred in the table below as “observations”) they had collectively agreed to prioritize
during the scorecard meetings. For this review, as mentioned earlier, these characteristics of services
were grouped in big categories (22 for commune administration, 25 for primary schools and 25 for
health centres – see the annexes for the full lists and definitions).
2.1.2 The JAAP dataset
The JAAP dataset includes information about around 33,900 actions (referred as “observations” in the
table below) that were adopted as part of the Joint Accountability Action Plans (JAAPs). The dataset
also includes information about who suggested them, if they were expected to require external
15
See boxes 1 and 2 below for additional information about the scorecard process and see annex section for more information on the ISAF
process
16
Because some citizens may have taken part in scorecard meetings in 2016 and then again in 2017 and/or 2018, the number of participants
does not necessarily equal the number of citizens that took part in the scorecard meetings.
14resources or not to be implemented, if they were implemented or not, if they were integrated into the
Commune Investment Programs or not, etc.
The actions were suggested during the scorecard meetings (or self-assessment meeting for service
providers). They were then discussed and prioritized during the interface meetings (single and then
multi interface meetings) during which some actions were dropped and the list of actions was finalized.
JAAP Committees were then created to monitor the implementation of the JAAPs. During the
subsequent meetings of these committees, additional data was collected on implementation status or
integration into the CIPs.
From the reporting of the five implementing partners, it is possible to estimate that the data related
to around 3000 actions was lost (8%) due to gaps in the M&E and data collection systems. Because the
funding of most of the implementing partners stopped soon after the adoption of the JAAPs in 2018,
they only monitored their implementation for a few months that year (and not for 12 months like they
did in 2016 and 2017). For this reason, the JAAP actions adopted in 2018 are not covered in some part
of the analysis on the implementation of the JAAPs.
Table 4: The datasets and sample size
Key points Scorecard dataset JAAP dataset
Number of provinces 14 (11 in 2016; 10 in 2017/2018) 18 (14 for 2016)
Number of districts 63 98
Number of communes 466 733
Total observations by services 21,967 (100.0%) 33,901 (100.0%)
For CA 7,397 (33.7%) 10,925 (32.2%)
For PS 9,467 (43.1%) 14,437 (42.6%)
For HC 5,103 (23.2%) 8,539 (25.2%)
Total observations by years 21,967 (100.0%) 33,901 (100.0%)
For 2016 8,322 (37.9%) 7,344 (21.7%)
For 2017 7,580 (34.5%) 13,028 (38.4%)
For 2018 6,065 (27.6%) 13,529 (39.9%)
Total observations by partners 21,967 (100.0%) 33,901 (100%)
CARE 5,040 (22.9%) 5,217 (15.4%)
Save the Children 7,165 (32.6%) 9,560 (28.2%)
World Vision 9,762 (44.4%) 9,217 (27.2%)
RACHA None 9,644 (28.4%)
Star Kampuchea None 263 (0.8%)
2.1.3 Similarities and differences between the 2 datasets
The datasets cover the same types of services (i.e. commune administration - CA, primary school - PS,
and health centre - HC). The categories of issues raised by communities and actions integrated into the
JAAPs are also similar. Due to gaps in M&E, the two datasets does not exactly cover the same provinces,
districts, communes and implementing partners over the 3 years. The JAAP dataset is bigger both in
term of sampling and of key variables. Within each of the dataset, the geographical focus also differs
from one year to another (because some communes only started to implement in 2017, because some
data was lost or not collected for specific years, etc.).
15Table 5: Key variables in the two datasets
Scorecard JAAP
Categories of actions adopted in JAAPs (grouping 1):
Categories of characteristics of the service most
-For CA: 22 -For PS: 25 - For HC: 25
requiring improvement (grouping 1):
Actions suggested by:
-For CA: 22 -For PS: 25 -For HC: 27
-User (citizens) -Providers -Both -Unspecified (no answer)
Resources (expected to be needed)
Characteristics of the services selected by: -External -Internal -Unspecified (no answer)
-Users (citizens) -Providers -Unspecified (no answer) Status of implementation
-Implemented -Not implemented -Ongoing -Unspecified (no answer)
I4C data relevance17
Satisfaction score with the characteristic of the service -Yes -No -Unspecified (no answer)
selected: 1 to 5 (very bad to very good) Integration into CIP
-Yes - No -Unspecified (no answer)
2.2. Strengths and limitations of the datasets
From the review of the datasets and key informant interviews, the following have been identified as
their strengths and limitations.
Strengths
The big sample size of the datasets makes them more credible especially in the eyes of potential
government stakeholders who tend to put more weight on big sample surveys rather than qualitative
research or small sample surveys.
Information on satisfaction and perception: The two datasets contain perception data from both users
and service providers and the gaps between the two. Such information is unique and is not collected
through existing official M&E indicators.
Identification of high and low performers: The identification of high and low “performers” can be
done not only on specific services, but for specific geographical areas or groups of facilities which might
be helpful for cross-case comparison analysis and cross-case (horizontal) learning.
Identification of potential root causes and potential entry points: As they allow zooming on specific
issues affecting specific characteristics of the service and whether the issues relate to performance or
resources, the datasets allow to identify whether a solution is more likely to be found at local or
national levels, will require funding or not, etc.
A baseline for future comparison and progress monitoring during Phase II, either by service,
characteristics of the service or locations.
Evidence for targeted advocacy works. The big sample size and the concreteness of the findings that
the datasets can offer make them particularly useful for advocacy works.
Appropriate format for online dashboard and spreadsheet data sharing. The ways the datasets are
currently structured, despite various limitations as discussed below, are easy for generating online
dashboard and spreadsheet that can be conveniently shared with other stakeholders, including
relevant members of line ministries at district, provincial and national levels.
Focus on 3 essential services: It is important to note that the datasets (and the ISAF Phase I as a whole)
focused only on 3 services (commune administrative services, primary education and primary health).
These are essential services, used by a significant part of the population. For these reasons, they are
the ones recommended to measure SDG Indicator 16.6.2 (Proportion of the population satisfied with
17
This variable aim at assessing if the action adopted in the JAAP is responding to an issue that is related to the aspect of the service delivery
for which citizens have received some information during the first step of the ISAF process (information for Citizens or I4C). For example: if
the action is about increasing the number of teacher at schools to meet the national standard on ratio on student per teacher, then the
answer will be yes because this national standard is presented to citizens through the ISAF poster and during the I4C meeting.
16their last experience of public services). Some other public services in the country may be more
controversial in their action or polarizing on their performance. However, they are unlikely to cover
the same proportion of the population or to be as essential to the citizens as the ones covered by ISAF.
Limitations
Interpretation of the scores on the quality of services (scorecard): A number of limitations on the uses
and interpretations of the scores should be noted. Firstly, the scores are perception-based which are
influenced in turn by a number of factors including initial expectations, the quality of the facilitation
provided during the scorecard meetings and the experience and knowledge of the score-givers about
the services.
Secondly, as showed in the diagrams presenting the distribution of the satisfaction scores expressed
during the scorecard meetings, a significant proportion of the citizens consulted (more than 40%) rate
the quality of the services at the mid score - “acceptable”. Key informant interviews suggested that
citizens, for various reasons, see the rating “acceptable” as a safe and non-confrontational way to
express their satisfaction with a service even if they have a more negative perception of the quality of
such service. As a result, the average score might not well be representative of the “true” level of
satisfaction. Taking this into account, this report combine several approaches to assess the “real” level
of satisfaction of users and service providers or to identify in relation to which characteristics of the
services they have the bigger concerns:
- The distribution of the scores across the 5 possible ratings
- The proportion of the population that did not score a service as good (or very good)
- The frequency with which specific characteristics of a service have been prioritized during the
scorecard meetings.
The impossibility to disaggregate the data for some specific groups: The M&E systems used by the
implementing partners allowed to measure the proportion of citizens participating in the ISAF process
that belonged to some specific groups such as IDPoors18, youth (less than 25 years old), Indigenous
People (IP) and women. However, the implementing partners did not capture if individual votes were
coming from members of these groups, making it impossible to disaggregate the data to assess, for
example, if members of these groups had a different opinion than the majority of the population on
key issues or potential solutions to address them. No data was collected for other groups for which it
would have been interesting to have data such as people with disabilities, internal migrants, elderly
people, pregnant women, etc.
Lack of information about the motivations of users and services providers: At several points during
the ISAF process, users and service providers have to vote to decide on important points such as the
list of characteristics of service they want to prioritize during the scorecard process or the list of actions
to include in the JAAPs. The decision receiving most votes will be chosen. During the votes, participants
explained and justified their votes. However, this information, that would have allow to better
understand the reasons behind some of the patterns and trends, were not captured by the
implementing partners.
Lack of use of unique geographical and facility codes. The Government has adopted official unique
identification codes for capital and provinces, districts/municipalities/khans, communes/sangkats, and
villages/groups, which are then used to combine with primary school and health centres codes (as
illustrated in the table below).
18
The IDPoor Programme, established in 2006, aims at identifying target groups for various National poverty reduction interventions. See
https://mop.idpoor.gov.kh/ for more information.
17You can also read