Discovery Park Virtual Management Platform - Phase 2 - Project Manual - Phase 2 (2019)
←
→
Page content transcription
If your browser does not render page correctly, please read the page content below
Discovery Park
Virtual Management Platform - Phase 2
                    Project Manual

         Raymond Hall, Dwight Lewis, Austin Lin
           University of Washington MGIS 2019
                   GEOG 569 Workshop
                      August 24, 2019
        Manual provided for Friends of Discovery Park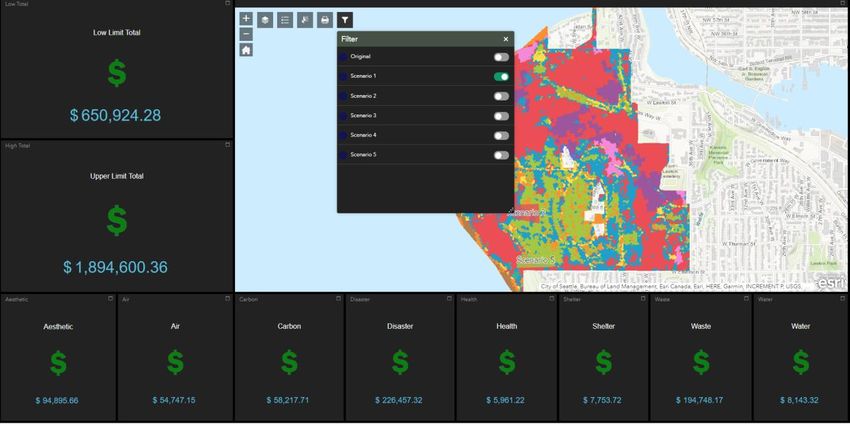
Table of Contents
Executive Summary                                                                         3

1. Background and Project Objectives                                                      4
    1.1 Background                                                                        4
    1.2 Project Objectives                                                                4

2. Data Collector Web Applications                                                        6
    2.1 Hosted Feature Layers                                                             6
        2.1.1 Setting Up Hosted Features for Data Collection                              6
        2.1.2 Visualization of Hosted Feature Layers                                      9
        2.1.3 Privacy Settings for Hosted Features                                       10
    2.2 Visualizing Layers in Web Maps                                                   12
        2.2.1 Setting Up Layers for Web maps                                             12
        2.2.2 Adjusting Visualization                                                    13
        2.3.2 User-experience Widgets                                                    16
        2.3.3 Data Collection Widgets                                                    17
        2.3.4 Complementary Summary Widgets                                              19

4. Recreational and Incident Reporting Platform                                          25
    4.1 Recreational Activities                                                          26
        4.1.1 Adding Recreational Activities                                             26
    4.2 Incident Reporting                                                               28
        4.2.1 Adding Incidents                                                           29

5. “What-If” Analysis Application                                                        30
    5.1 Data Management and Input Data Development                                       30
        5.2.2 The geostatistical model                                                   34
        5.1.2 The simple web application model                                           37
    5.2 Statistical Model Development and Deployment                                     39
    5.3 Model Integration in ArcGIS AppBuilder                                           41

6. Landing Page                                                                           43
    6.1 ArcGIS Experience Builder                                                         43
    6.2 How to Embed Image, Other Websites, and External Applications to Existing Website 44

7. Recommendations                                                                       45
    7.1 Discovery Park Virtual Management Platform                                       45
        7.1.1 Data Collection System                                                     45
    7.2 Professional Consultation                                                        46
        7.2.1 Strava Integration                                                         46
    7.3 Human-Nature Interaction                                                         46

APPENDICES                                                                               48

                                                                                          1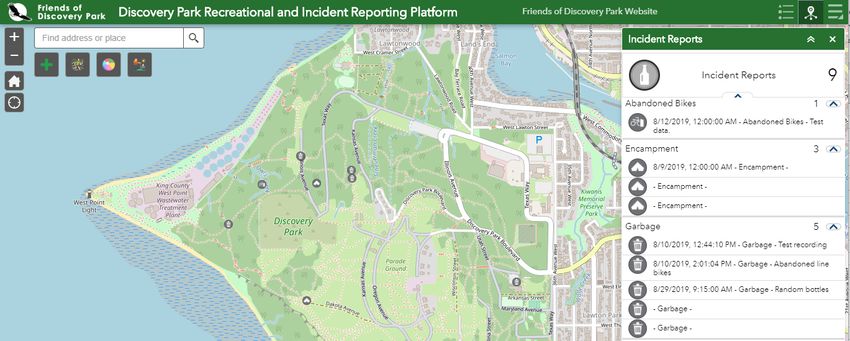
Appendix 1: System Resource Requirements                                     49
Appendix 2: Business Case Evaluation                                         50
Appendix 3: Python Source Code for Model in “What-If” Analysis Application   59
Appendix 4: Data Dictionaries of the What-If Analysis                        72

                                                                             2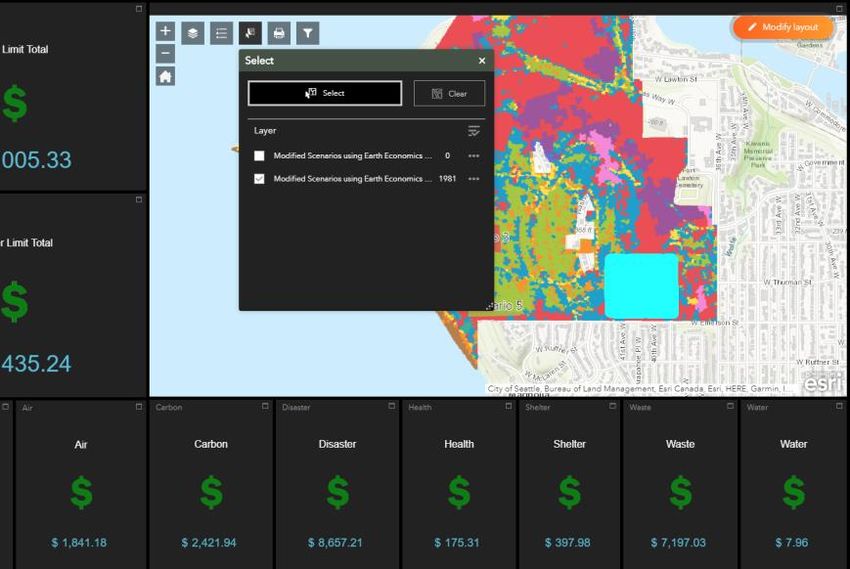
Executive Summary

Suggested key points to cover (Austin)
General:
   - Data collector is meant to feed data into What if.
   - Data collectors are made with public audience in mind.

Recreational & Incident Reporting Platform (RIRP):
   - Data collection platform
   - Provides two-way interaction between the park and the user
   - Examines the basis of human-nature interaction.

Recommendations:
   - Advertise data collector to get a dataset going for What if model
   - Professionals in ecology, biology, and climatology should be consulted for major
     decisions with predicted change in ecosystem services
   - Strava Metro provided potential partnership opportunities for access of robust
     recreational datasets for evaluating Discovery Park’s recreational value
   - Future human-nature interaction studies can use VMP’s data collector as a framework
     for surveying.

                                                                                           3
1. Background and Project Objectives

1.1 Background

The largest city park in Seattle, Washington, Discovery Park offers the community a display of
rich and diverse vegetation and wildlife, which has large areas of acreage preserved in its
natural state. Recently, Discovery Park has made news for issues such as sewage spills, and
proposed plans to build affordable housing within and near the park. These previously
mentioned events has potential implications for a park that Earth Economics projects to have a
financial value somewhere between $557,000 and $1.08 million dollars.

Given factors such as these, the Friends of Discovery Park (FoDP) reached out to the University
of Washington’s Master of Geographical Information Sciences (UW-MGIS) program to help
them to develop a tool that can enable Discovery Park’s stakeholders in making informed
decisions about the recovery efforts and purposeful alterations to the park’s natural landscape.
Established in 1974, the FoDP is a non-profit organization powered by volunteer efforts “to
defend the integrity of Discovery Park and to create and protect there an open space of quiet
and tranquility, a sanctuary where the works of man are minimized.” The collaborative efforts
between FoDP and UW-MGIS began with a project executed by Rich, Peterson, and Marshall
(2018). Their initial efforts laid the foundation of the work efforts for this project. Rich, Peterson,
and Marshall’s work was heavily focused on data collection and researching influences and the
implications of landscaping alterations within Discovery Park. Our guided efforts for this project
were focused on developing a decision support tool with stakeholders of FoDP using data
resources created by Rich, Peterson, and Marshall. As with many projects in the GIS
profession, we encountered challenges that were needed to be addressed to achieve our initial
goal of developing a tool. The first hurdle was the input data used for the proposed geo-
statistical modeling. One affordance in particular, recreational use of Discovery Park’s land
involved data considered proprietary, which had data use agreements constraining the utility of
physical activity data for the proposed GIS application. Also, the data collected by last years
MGIS cohort, though critical to the tool’s functioning, does not appear sufficient to build a
statistically accurate tool. The geo-statistical model would ideally have wildlife data points
reflecting the diverse population of animals and insects within Discovery Park. Moreover, the
ideal data source would have longitudinally robust data on wildlife and vegetation. Given these
considerations, the authors of this report in collaboration with FoDP decided to make a
necessary pivot after the sixth week of the academic quarter, to put FoDP in the best position to
have a useful decision support tool as a long-term goal for this endeavour. The decision to
make changes in the project’s goals and objectives were reached after several failed attempts
to build an effective analytic model accurate enough to make actionable decisions related to the
preservation and improvements to Discovery Park.

1.2 Project Objectives

                                                                                                     4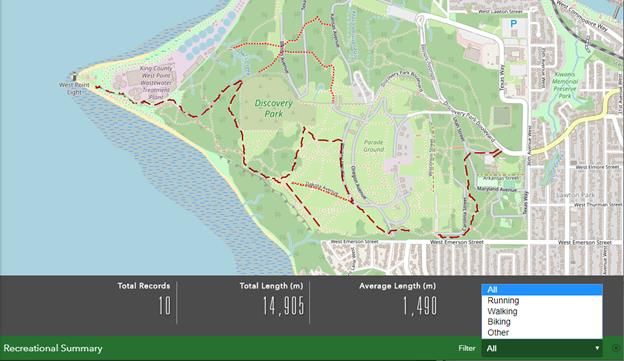
As mentioned in previous assignment submissions in GEOG 569, our initial primary objective
was to develop a functional GIS web application for Seattle’s Discovery Park so that FoDP can
increase their odds of acquiring more financial resources for a decision support tool that The
University of Washington will prototype. As such, the core mission of our GEOG 569 capstone
project was to:
    1. Propose Discovery Park Virtual Management Platform (VMP) as a framework for
        ecosystem-based green space management software across the country.
    2. Implement the Virtual Management Platform (VMP) as an in-house educational interface
        for the general public on ecosystem services and benefits.

Given the project’s pivot, our current objective now is to develop a dynamic and live data
collection and analytic framework for FoDP. Though this pivot means that the VMP return on
investment would be delayed, the long-term goals of having actionable data would increase
multi-fold, as the data architecture could facilitate more accurate longitudinal and time-
comparison analyses. The adjusted core mission of our GEOG 569 capstone project is to:
    1. Develop and implement a wildlife, vegetation and recreational data collection application
        for Discovery Park.
    2. Develop an automated geostatistical framework that will correlate FoDP’s outcomes of
        interest using existing data sources and data collected from the developed data
        collection application.
    3. Develop a web-focused wireframe that will synergize these web applications through a
        centralized browser interface.
    4. Prepare a lay-language report that will inform FoDP how to replicate steps taken to
        develop tools so that they can enhance tool features and run statistical analyses once
        more data come available.

Though challenging to implement in three weeks, this approach was preferred over the original
project scope at the beginning of the Summer 2019 quarter because: 1) current and accurate
data appears to be the most vital component that will influence the success of the decision
support tool, 2) the analytic needs of FoDP exceed the capacity of a single web application, and
3) clearly communicating the project’s tasks in lay terms is critical in advancing the long-term
success of FoDP’s plans for this tool. Given the project’s fourth objective, this report will follow a
format unconventional to previous MGIS capstone reports. The following sections of this report
will detail the steps needed to develop the proposed tool so that individuals with moderate
ArcGIS knowledge can replicate and enhance the proposed tool. Due to this report’s
instructional format, typical GIS reporting sections such as “data development,” “workflow
implementation,” are “results” will be interwoven within the instruction of each tool. The
conclusions and recommendations section will be at the end of this report. The project’s system
resource requirements and business case evaluation sections are located in the project
appendices.

                                                                                                     5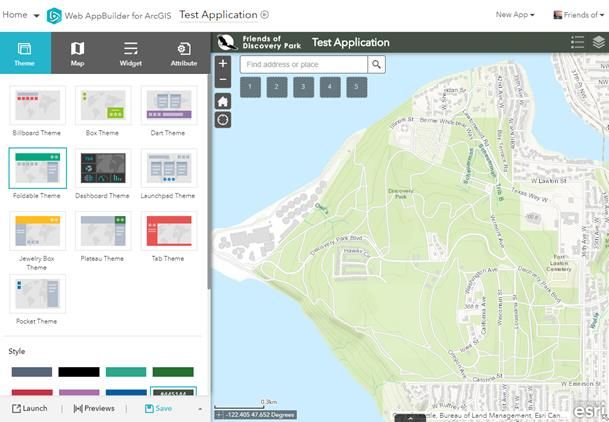
2. Data Collector Web Applications

2.1 Hosted Feature Layers
ArcGIS Online offers hosted layers to be published by accounts within an organization. FoDP’s
creator ArcGIS online account status satisfies the prerequisites for publishing hosted feature
layers for other to query, visualize and edit. Hosted features functions like feature classes in
ArcGIS Desktop software, these layers can house specific vector data types with a wide range
of fields to supplement individual spatial elements. Users within the organization can be broken
down to Viewer, Data Editor, User, Publisher and Administrator access to facilitate access
and maintenance of the hosted feature layers. More details can be found on AGOL FAQ1.

2.1.1 Setting Up Hosted Features for Data Collection
In order to provide hosted feature layers for other AGOL applications, simply navigate to the
account’s content on the AGOL platform and hit “Create”. For the purposes of the VMP data
collector platform, “Feature Layer” should be the primary hosted feature for FoDP (Fig 1).

                                 Fig 1. Creating hosted feature layer.

After “Feature Layer” is selected, the user will be prompted with options to create from
default layer templates based on the user layer requirements. Depending on the specific
real-life phenomenon FoDP wishes to capture, either point, line or polygon can be
selected from the default template to provide the hosted feature layer with default fields

1
    AGOL FAQ - User Privileges

                                                                                                   6
for the type of vector geometry (Fig 2). Proceed with the selected geometry type and a
sequence of options will be presented for the user to fill out metadata for the feature
layer. All the contents provided for the hosted feature layer’s metadata can be updated
from the layer details in FoDP’s “Content” menu.

                    Fig 2. Default feature layer templates from ArcGIS Online.

Once the hosted feature layer is successfully created, an “Overview” will be shown up
for the feature layer. The “Data” tab allows the user to create, modify and update
existing elements and fields housed by the feature layer. To add additional fields for
data collection, click on “Add” and fill out the “Add Field” form presented by the
interface (Fig). The most important aspect of the field creation wizard is the “Allow Null
Values” option. If the created field is meant to be a required field for the data collector,
then the option should be left “unchecked” to disallow null values. Once a field is
created, each field can be modified and updated by clicking on the “Display Name” for
the field and hit the “Edit” option afterward (Fig 3).

                                                                                               7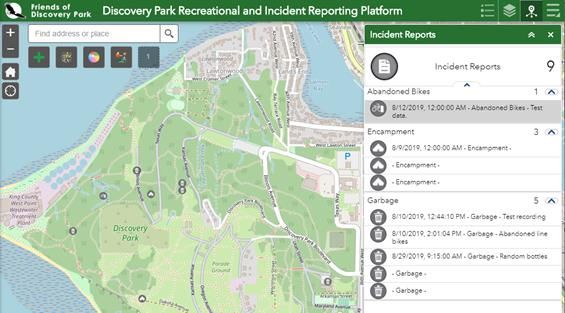
Fig X. Sample hosted feature layer data menu.

                         Fig 3. Field overview from the Data tab under “Fields”.

A host of desired field domains (attribute domains) can be created for the added fields
or existed fields by using the “Create List” option. The “Label” are user-defined values
that can be selected by data collector, and the “Code” is the backend alias for the
specific “Label” (Fig 4). Once completed, save and return the data view and you should
be able to see a “List of Values (Domain)” listed for your newly created field. More
details on customizing a hosted feature layer can be access from AGOL FAQ2.

2
    AGOL FAQ - Publishing Hosted Feature Layers

                                                                                       8
Fig 4. Sample attribute domains for a field in ArcGIS online hosted feature layer.

2.1.2 Visualization of Hosted Feature Layers
Hosted feature layers can contain default symbology for the layer to take on for visualizing on a
web map. Within the feature layer, navigate to the “Visualization” tab and click on the “Change
Style” icon ( ). Choose the field to default the data visualization, and then select “OPTIONS” to
customize the desired symbology by clicking on the current symbology (Fig 5).

After the symbology has been customized for default visualizations, select “Save Layer” to
register the visualization. By customizing visualization through the hosted feature layer
“Visualization” menu all other AGOL applications and products that utilizes the feature layer will
have universal visualization of the data layer.

                                                                                                 9
Fig 5.. Customizing symbology for data visualization of fields from feature layer.
2.1.3 Privacy Settings for Hosted Features
ArcGIS online hosted feature layer allows customized layer settings centered around data
management and accessibility. For long-term usage, enabling “Delete Protection” is highly
recommended to prevent data loss from misuse. Privacy settings can be access from the
“Settings” tab under “Feature Layer (hosted)” section (Fig 6).
10Fig 6. Hosted feature layer privacy setting for editing, viewing, and data management.
Depends on FoDP’s comfort in providing access for the public to use the data collector to
populate hosted feature layers, several important settings should be enabled for the intended
audience. Suggested setting for hosted feature layer privacy can be found below.
Public Audiences
Hosted feature layers published to allow public usage often face difficulty in maintaining
data quality and integrity. To assist in facilitating a productive process of data collection
with the hosted layers below is a list of important settings to consider for public usage:
Editing
● Enable editing
● Keep track of created and updated features
● Keep track of who created and last updated features
● Enable Sync (disconnected editing with synchronization)
Editing Type (only one)
● Add features
● Add and update features
11Editing Viewing Access (only one)
● Editors can see all features
● Editors can only see their own features (require tracking)
Editing Features (only one)
● Editors can only edit their own features (require tracking)
Anonymous Editors (only one)
● Only add new features, if allowed above (requires tracking)
Trusted Audience
Users that are entrusted with collecting spatial elements for the feature layer should
allowed higher access to streamline data editing and in-field maintenance of data
integrity. FoDP should consider modifying user privileges described in Hosted Feature
Layers to manage trusted user access to hosted features. Within the feature layer
privacy settings, a list of important settings to consider are listed below:
Editing
● Enable editing
● Keep track of created and updated features
● Keep track of who created and last updated features
● Enable Sync (disconnected editing with synchronization)
Editing Type (only one)
● Add and update features
● Add, update, and delete features
Editing Viewing Access (only one)
● Editors can see all features
Editing Features (only one)
● Editors can edit all features
● Editors can only edit their own features (require tracking)
Anonymous Editors (only one)
● Only add new features, if allowed above (requires tracking)
2.2 Visualizing Layers in Web Maps
ArcGIS Online Web Maps serve as the basis and foundation for building web applications. The
online web map functions similarly to data frames in ArcGIS desktop counterparts. Despite
having data analysis capabilities in the web map interface, it is recommended to only use
ArcGIS online web maps for only data visualization and client-facing customizations. More
information about the web map can be found on AGOL documentation3.
2.2.1 Setting Up Layers for Web maps
ArcGIS Online web map interface allows addition of feature layers from a wide range of sources
including the user’s content repository, public feature layers, local files, or other import options.
To construct the web map for a data collector, hosted feature layers will be the main import for
3
AGOL - Web Map Documentation
12the web map. To add a layer into the web map, “Search for Layers” and locate the hosted
feature layer created within FoDP’s content repository and “Add to Map” (Fig 7).
Fig 7. Adding layers into ArcGIS Online web map.
2.2.2 Adjusting Visualization
The hosted feature layer should have defaulted symbology if layer creation follows section X.1.2
Visualization of Hosted Feature Layers. If the layer symbology of the added hosted feature layer
requires further customization, access data symbology with the “Change Style” icon ( ) and
follow the instruction to specified desired field to symbology and applied the desired symbology.
More details about available options within the “Change Style” property can be found on the
web map documentation on style customization4.
2.3 Using ESRI WebApplication for Data Collection
ESRI Web Appbuilder provides an online builder platform for developers to create web
applications that are accessible across stationary and mobile platforms. These applications can
perform a wide range of functions ranging from information visualization, management,
collection, and other customizable functionality. The web application developed by University of
Washington MGIS 2019 FoDP group will center around utilizing the existing ESRI builder
framework to construct an open-source data collector for FoDP.
2.3.1 Building ESRI Web Application
Similar to constructing hosted feature layers and web maps, within the “Content” page of the
ArcGIS Online platform, users can create a web application from the “Create” menu (Fig 8).
Follow the wizard prompt after selecting “Using the Web AppBuilder” to provide the web
4
AGOL - Change Style Documentation
13application with metadata, these metadata can be updated on the web application details page
from accessing the application from the content list.
Fig 8. Creating ESRI Web Application from Content page.
Once the web application is successful created, the user will be brought to the Web Appbuilder
interface (Fig 9). The web application can be customized from the AppBuilder via four distinct
aspects – Theme, Map, Widget, Attribute.
Theme – control of the overall application theme and color palette.
Map – settings for referenced web map and associated customization of map viewing.
Widget – controls for adding, editing, deleting, and customizing individual functions
within the web applications. For instance, the Edit widget allows users to add, update,
and manage data from editable layers. The Edit widget can be customized to restrict
fields from user access.
Attribute – settings for the overall web application in regards to branding, backend data
source and content access.
14Fig 9. Default ESRI Web AppBuilder interface.
The first order of business in making a functional web application is to reference an existing web
map from the user content repository. Within the “Map” tab select “Choose web map” to select
the web map set up from Visualizing Layers in Web Maps of this document (Fig 10).
15Fig 10. Selecting map for web application.
2.3.2 User-experience Widgets
ESRI web applications come with a suite of default widgets that enhances basic user
functionality. These widgets can be customized and adjusted based on the needs of the
application from the “Widget” menu in the AppBuilder (Fig 11). For the purpose of the data
collector, legends, layer list are the two widgets that requires further customization from the
default setting. The “Legend” widget governs the visibility of the symbology for each layer within
the web application, while the “Layer List” controls the visibility and accessibility of each
individual layer and the attribute table. Widget customization is application wide and will take
effect once the changes are saved within the AppBuilder interface.
Several widgets that can be further customized to enhance user experience includes:
Coordinate – controls default projection of the web application.
My Location – adjust settings for using of GPS location systems by user.
Overview – adjust placement of in-set map for locating current extend on world extend.
Attribute Table – customizable viewing and access of layer attribute tables.
Scalebar – adjust visualization of map scale bar and units.
Fig 11. Default widget view for web application created from FoDP template.
162.3.3 Data Collection Widgets
ESRI Web Appbuilder offers two options for on-the-fly data editing – 1) Edit Widget and 2)
Smart Editor. For the purpose of the FoDP data collection framework, the edit widget was
focused on for this project and primarily used in the construction of the data collector
application. The “Edit” widget offers a whole suite of options to customize user-side viewing and
interaction with the hosted feature layer fields (Fig 12).
Fig 12. Edit widget customization menu.
Each editable field can be toggled for “Display” and “Edit” on the user side and these
customized field settings allows the AGOL host to manage user access to recorded elements
(Fig 13).
17Fig 13. Hosted layer field access customization within Edit widget.
These settings are reflected on the user-end when elements are added to the hosted feature
layer (Fig 14). The same settings are applied whenever the use decides to add, update, or
delete existing features. End users does not have access to manipulate which fields are
available or unavailable; however, as mentioned in Setting Up Hosted Features for Data
Collection, fields that do not accept “null values” will become required fields of the hosted layer
and users will be required to provide a value for that field in order for an element to be added.
18Fig 14. Edit widget user-end view.
The symbology of the available templates provided by the hosted layer is customizable within
the “Data” tab of the hosted layer as discussed in Visualization of Hosted Feature Layers. More
information on the “Edit” widget can be found on ESRI AGOL documentation5.
2.3.4 Complementary Summary Widgets
Akin to the “Edit” widget’s option to customize for end user viewing and access. ESRI Web
AppBuilder offers numerous widgets that caters to enriching user experience. Several default
widgets provided by the AppBuilder serve as helpful complements for the data collector
experience. Through the development of data collector, a list of four widgets were found to
enhance user experience and provide information for FoDP’s data collectors.
List of Complementary Widgets for Data Collector Application:
1) About6
5
ESRI WebApp Builder - Edit widget
6
ESRI Web AppBuilder - About widget
19The “About” widget is an all-purpose widget for providing a pop-up window within the
web application for user to read any additional information, description, summary of the
application. This pop-up window can also be used to create custom HTML contents for
the user to view and interact (Fig 15).
Fig 15. About widget from FoDP Recreational & Incident Reporting Platform.
2) Infographic7
The “Infographic” widget provides templates for developer to use in illustrating field
summaries or charted statistical data from the map (Fig 16).
7
ESRI Web AppBuilder - Infographic widget
20Fig 16. Options of available infographic templates.
The widget customization offers a limited selection of options for the user to customize
their chart (Fig 17).
21Fig 17. Widget customization for fine-tuning infographic display.
The result is a user-friendly display of map information that facilitate highlighting of
individual field categories and features (Fig 18). This widget provides user with feedback
on their contributions to the hosted feature layer and reinforce positive interaction with
FoDP’s data collector application.
22Fig 18. Infographic from FoDP Recreational & Incident Reporting Platform. Map elements from a chart
category is highlighted when user hovers over the infographic.
3) Summary8
The “Summary” widget allows web application to showcase a summary of numeric
attributes from a feature layer. The summarized features are provided based on user
viewing extent, and individual category for the summarized features can be filtered to
isolated specific elements for viewing. To set up a “Summary” widget, four calculations
are available for field summary – 1) sum (SUM), 2) average (AVG) , 3) maximum (MAX)
and 4) minimum (MIN). These calculations can be performed and displayed for multiple
fields within a single feature layer (Fig 19).
8
ESRI Web AppBuilder - Summary widget
23Fig 19. Summary widget set up for recreational activity survey 1.
This widget functions similarly to the “Infographic” widget but provides a more concise
view of numeric values for spatial elements (i.e. shape length) as seen in figure 20.
Continuous value types are also well suited for this widget (i.e. elevation).
Fig 20. Trail activity summary from user contribution, individual activity can be filtered and summarized.
244) Info Summary9
The “Info Summary” widget provides the user with a collection of features from the map
extent for each tallied feature layer. The collected elements can be organized based on
preset templates from the hosted feature layer and individual records are displayed
when the collection is expanded for viewing (Fig 21). This widget is exceptional for
monitoring incidents in Discovery Park reported by data collectors. Individual elements
within the collection can be interacted directly and associated feature information are
displayed. Another advantage of the “Info Summary” widget is the widgets ability to
summarize multiple layers at the same time. This reduces cluttering of widgets on the
web application without losing the summary function.
Fig 21. Info Summary from FoDP Recreational & Incident Reporting Platform.
4. Recreational and Incident Reporting Platform
A primary part of Virtual Management Platform project’s objectives is to facilitate interaction and
education of visitors at Discovery Park. The platform aims to provide users with an
understanding of effects from potential changes to the park’s natural elements. Along with the
educational mission, FoDP also seeks to portrait human-nature interaction through the lens’ of
the park visitors. The Discovery Park Recreational and Incident Reporting Platform (RIRP) was
9
ESRI Web AppBuilder - Info Summary widget
25constructed as a means of establishing a foundation for surveying human-nature interactions
while informing the public about the park’s suggested recreational activities and safety
precautions. The platform facilitates a two-way interaction where public users can review
personal data contributions and FoDP users can manage park usage and respond to reported
incidents.
4.1 Recreational Activities
Discovery Park provides the natural environment and service needed for conducting
recreational activities. Physical recreational activities such as hiking, running, sports, and other
outdoor hobbies requires the necessary environment to perform. These physical recreational
activities are also often associated with mental and physical health benefits. The RIRP data
collector allows users to input recreational activity information onto the platform and provide a
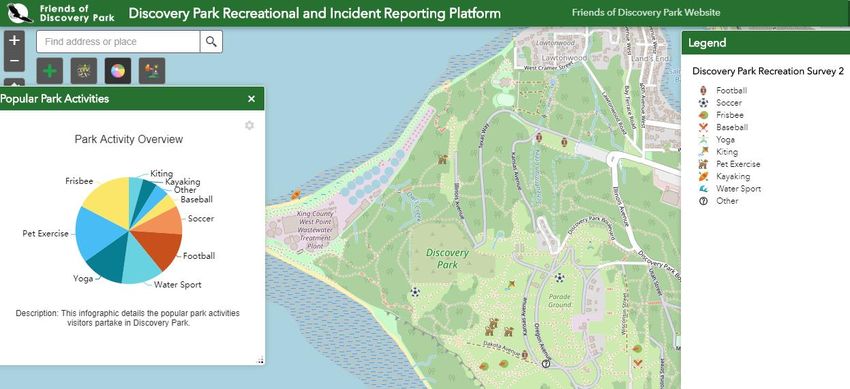
spatial display of the user’s activity pattern (Fig 22).
Fig 22. User recreational activity overview provided by Discovery Park Recreational and Incident
Reporting Platform.
4.1.1 Adding Recreational Activities
The RIRP allows user to simply utilize the “Edit” widget to add in feature templates to denote
the user’s recreational activity (Fig 23).
26Fig 23. Available templates for recreational activities with Discovery Park Recreational and Incident
Reporting Platform.
A simple form will be provided when user finish drawing a feature from the available templates.
Required fields are denoted by * and any other fields within the form will be treated as optional
(Fig 24). Closing the form will save the feature and update the hosted feature layer with the user
edit.
27Fig 24.Edit form for recreational activities with Discovery Park Recreational and Incident Reporting
Platform.
4.2 Incident Reporting
Another aspect of human-nature interaction focused by FoDP pertains to public safety within
Discovery Park. Social activities are not limited to recreation, public safety concerns can
oftentimes be attributed as another form of human-nature interaction. The RIRP allows users to
add, update, and view identified public incidents within the park area. These incidents are live-
updated and keeps users informed of areas to avoid and exercise caution (Fig 25).
28Fig 25. User incident report overview provided by Discovery Park Recreational and Incident Reporting
Platform.
4.2.1 Adding Incidents
Similar to recreational activities, public incidents can be reported on the RIRP using pre-coded
templates (Fig 26). Once a template is added, additional details can be filled out by the form
provided for the feature (Fig 27). Each feature allows the user to update on the fly and provide
changes to reported incidents.
Fig 26. Available templates for incident reporting with Discovery Park Recreational and Incident
Reporting Platform.
29Fig 27. Edit form for incident reporting options with Discovery Park Recreational and Incident
Reporting Platform.
5. “What-If” Analysis Application
The “What-If” Analysis Application is comprised of two major deliverables. The first deliverable
being a statistical framework for FoDP, which can be used once more data becomes available
for reasonably accurate analyses10.The second deliverable is a more simplified web application
assessing implications in land cover modifications with respect to the affordance outcomes of
interest (i.e., aesthetics, air flow quality, carbon sequestration, disaster mitigation, health,
shelter, waste and water). The second deliverable with respect to the “What-If” analysis involves
Python source code11 and an ESRI Web AppBuilder Application12.
5.1 Data Management and Input Data Development
At the request of FoDP we built an analytic framework using ArcGIS the Python API and arcpy
libraries. The intent is for this source code to serve as a foundational workflow than can
automate analyses once more comprehensive data becomes available. Relative to the code
10
GitHub location for Jupyter Notebook of the geostatistical model: https://shorturl.at/hwFLS
11
GitHub location for Jupyter Notebook of the simple application source code
model::https://shorturl.at/bioJ3
12
Location for simple “What-If” application:
https://fodp.maps.arcgis.com/apps/webappbuilder/index.html?id=cc7f57f3f4c04736b40a578b34c12835
30used in the simple model, it is imperative that users of this analytic workflow is aware of all the
Python libraries use to conduct analyses. The core libraries used for the geostatistical model
are: arcpy, ArcGIS Python API, pandas, numpy, and sciKit-learn. There were other libraries
used, but the six previous libraries are critical to the functionality of the provided code. To this
extent, the arcpy and ArcGIS Python API libraries are most functional for analysts with access
to an active ArcGIS Desktop and ArcGIS online (AGOL) license. Therefore, it is recommended
that coded models are processed using Integrated Development Environments (IDE) installed
with the ArcGIS Desktop download. Among the IDEs preinstalled, we used the Jupyter
Notebook IDE for this model. Also, these methods were implemented on a Microsoft Windows
operating system. We accessed Jupyter Notebook through the Python Command Prompt within
the ArcGIS program folder (as displayed in figure 28). Using this interface allows us to change
the directory of our program on the front end by using the ‘cd’ command proceeded with the
folder path where we plan to store the code (e.g., C:://user/name/documents/FoDP). After one
changes their directory, the user needs to type ‘Jupyter Notebook’’ to start the software. If one is
using the ArcGIS installed Jupyter Notebook IDE, most libraries used come preinstalled. sciKit-
Learn may need to be pip installed by opening the ArcGIS Python Command Prompt as an
administrator, and typing ‘pip install -U scikit-learn ’ prior to changing the directory.
Fig 28. How to access Python Command Prompt from Microsoft
Windows Start Menu.
31It is not the intent of this report to teach readers how to use Jupyter Notebook, but the directions
are made available on the Internet13. The libraries used for the geostatistical model can be
imported using the following code:
import arcpy
import pandas as pd
import numpy as np
import matplotlib.pyplot as plt
import matplotlib as matplotlib
import sklearn as sklearn
from matplotlib.ticker import FuncFormatter
from sklearn.model_selection import train_test_split
from sklearn.model_selection import cross_val_score, GridSearchCV
from sklearn.ensemble import RandomForestRegressor
from sklearn.preprocessing import MinMaxScaler
import os
import getpass
from arcgis.gis import GIS
import sys
from arcgis.mapping import WebMap
from arcgis.features import SpatialDataFrame
Next, we use the following code snippet to log into the clients AGOL portal. For security
purposes, we use the Jupyter Notebook pre-installed getpass library to enter our stakeholder’s
username and password so that external users will not see the secure information. It is
important to store the username and password as variables for increased security.
u = getpass.getpass(prompt='Enter username')
p = getpass.getpass(prompt='Enter password')
gis = GIS('https://fodp.maps.arcgis.com/',u, p)
An entity relationship diagram of the primary data sources used for statistical modeling and the
“what-if” application is displayed in Figure 29. These feature classes and tables are located in
the FoDP contents section of its AGOL account.14 The full dictionaries for the data sources used
are located in Appendix 4. All feature classes are projected using the following projection: NAD
1983 StatePlane Washington North FIPS 4601 Feet.
13
https://jupyter-notebook.readthedocs.io/en/stable/notebook.html
14
https://fodp.maps.arcgis.com/home/item.html?id=945ae605ae594fa38bdb84e4d8e8a55d
and https://fodp.maps.arcgis.com/home/item.html?id=a7e8c38fa59743cf8d3241abbbeb372a
and https://fodp.maps.arcgis.com/home/item.html?id=bf90bf466a75417c942802e55c1276a0
32Fig 29. Entity-relationship diagram of data sources used in “what-if” analyses
Given that the source code underlying the What-If application analyses are provided, this written
report will not cover every detail of code used in the analyses. To promote transparency and
reproducibility for modeling in the future, this report will cover important concepts so that GIS
analysts will understand the rationale behind the coding design. A key component in the data
massaging in this project is the importation of data. To do this we used the following code in the
ArcGIS Python API:
33#This code searches for feature layer services in AGOL
search_result = gis.content.search(query="Input Data Used for Geospatial
Analysis v2")
Search_result #This line enables us to see the results in Notebook
#This code assumes what we are looking for is in the first feature layer
#object from the code above
dataSource = search_result[0].layers
for lyr in dataSource:
print(lyr.properties.name)
#After confirming the assigned title of layer from the code above, we
#decide to import the attribute table in the feature layer collection's
#first layer as a pandas dataframe
birds = dataSource[0].query().sdf
birds.head() #This line enables us to preview dataframe in Notebook
The code used to import tables from AGOL is slightly different when compared to importing
feature classes. The primary difference from the above code is in the second block of code,
which looks like this when importing a table:
#This code searches for data in AGOL
search_result = gis.content.search(query="Earth Economics Lookup Table")
search_result
#This code assumes what we are looking for is in the first feature layer
#object from the code above
dataSource = search_result[0].tables #The key dependent variable in our geostatistical model is bird counts, which is present in our
birds feature class. As suggested by the first phase of the virtual management platform project,
we decided to use the 49,000 hexbin point feature class in our modeling so that we can
leverage the increased power with large sampled data. That being said, the bird sightings are
sampled from snapshot instances, which may not accurately reflect all areas within Discovery
Park that serve as birds’ habitat. To better reflect vegetative areas where various species of
birds within Discovery Park likely spend time at, we aggregated the count of birds within 700
feet of each indexed hexbin. We considered using a buffer analysis where we looped through
indexed hexbins and counted varying bird species within 700 feet of the centroid of each hexbin.
Unfortunately, though simpler to code this approach was very computationally intensive on our
computers. Therefore, we decided to do a cross-join between between our birds feature class
and hexbin landcover point feature class using the pandas library. Therefore, to accomplish this
task we first aggregated each species’ bird count over the 1.5 year period. Next, we pivoted the
bird species column so that each column counted the species for each bird. Afterwards, we
crossed joined the pivoted bird dataframe with the hexbin landcover dataframe, which allowed
us to aggregate the number of birds within 700 feet of each hexbin without having to use any
computationally intense geoprocessing tools. Finally, we left joined our vegetation dataframe to
the cross-joined bird and landcover dataframe. In this model, the vegetation columns (1= yes
this vegetation species is dominant in hexbin; and 0 = this vegetation species does not have a
major presence in the hexbin) are our independent variables. The final dataframe used to
process the statistical analyses are indexed at the hexbin-level, which means that this analysis
comprises of roughly 49,000 observations. A summary of the source code to accomplish the
previously described data management tasks are below:
#pandas will not allow cross joins on columns
#from different dataframes with same name
key2 = key[['GRID_ID','Latitude','Longitude']]
birds2 = birds[['Species','Count_','Latitude','Longitude']]
birds2['Latitude2']=birds2['Latitude']
birds2['Longitude2']=birds2['Longitude']
del birds2['Latitude']
del birds2['Longitude']
#Lets do a cross join between the birds and hexbins,
#but only keep the rows where bird sightings
#are within 700 feet of a hexbin
test=key2.assign(foo=1).merge(birds2.assign(foo=1)).drop('foo', 1)
test['dist'] = np.sqrt(((test['Latitude']-
test['Latitude2']).pow(2))+((test['Longitude']-test['Longitude2']).pow(2)))
test = test[test['dist']#Sum bird counts within each species at each GRID_ID
birdSum = test.groupby(['GRID_ID','Species'])['Count_'].sum().reset_index()
#now lets pivot the bird Species into separate columns
birdPivot =
pd.pivot_table(birdSum,index=['GRID_ID'],columns='Species',values='Count_')
birdPivot.reset_index(inplace=True)
#lets fill the nulls with zeros
birdPivot.fillna(0, inplace=True)
birdPivot.head()
#Now lets pivot the vegetation across columns
hexbins_pt_veg['val']=1
veggiePivot =
pd.pivot_table(hexbins_pt_veg,index=['GRID_ID'],columns='CommonDom',values=
'val')
veggiePivot.fillna(0, inplace=True)
#now let's left join the birds pivot on our key table
almost = pd.merge(key[['GRID_ID','LC','Latitude','Longitude']],birdPivot,
how='left',
left_on='GRID_ID', right_on='GRID_ID')
#now lest left join our vegetation to finalize our dataframe that we will
model
data = pd.merge(almost,veggiePivot, how='left',
left_on='GRID_ID', right_on='GRID_ID')
data.rename(columns={'Null':'Barren'}, inplace=True)
At this point, we are ready to build our statistical model. It is important to note that important
covariates are likely missing from this model. Also, it is important to note that some data
management steps that will take a fairly long time if an analyst is only working with a
conventional home use desktop (e.g., 12 GB RAM and i5 Intel Processor). Prior to the draft of
this report, we simultaneously ran models on more powerful servers that may not be available to
FoDP. Given these considerations, it is important to reiterate that findings from our preliminary
models are likely biased and not reflective on the true relationship between wildlife and
vegetation at Discovery Park. Hopefully, once more data is collected, this will not always be the
case. Moreover, it is paramount to mention that to optimize users’ experience for “real-time
analyses,” it would be ideal that the back-end model in this framework is processed on a
powerful server. Now that we covered data management for the geostatistical model, lets
highlight the data management activities in the simple web application model.
365.1.2 The simple web application model
As a consolation deliverable for FoDP in the project, we created a simple web application using
ESRI appBuilder © that will help users understand the implications that landcover modifications
have on the environmental value of discovery park. Originally, it was requested by the FoDP
stakeholder for the application to have the ability to show instantaneous results based on quick
“on-the-fly” edits by users. Our background research suggested that odds of meeting this
request would be higher if a custom widget (i.e., function) was created using JavaScript. Given
that the MGIS analysts did not feel that they had adequate expertise in web development to
create the originally requested application, they decided to use existing templates in ESRI’s
appBuilder, which could serve as an interactive wireframe.
The feature class backending the simple application is essentially the point scenarios feature
class merged with the Earth Economics lookup table so that users would have an understanding
of the affordance valuation given five preprocessed situations that can serve as a potential site
for residence at Discovery Park. This was done by importing the scenario feature class and
lookup table from FoDP’s AGOL account. Next, a pivot table was created from the Earth
Economics lookup table by affordance type. Next, the pivot table was joined on the scenario
feature class. After that, the Earth Economic affordance values were multiplied by the acreage
of each hexbin given the hexbin’s landcover. Finally, the generated dataframe was converted
back to a feature class on a MGIS students local computer. To conserve FoDP’s ArcGIS web
credits, the MGIS group preferred to do most geoprocessing on their local computers. The code
snippet to generate the underlying data for the simple application go as follows:
#code snippet doing a pivot on the Earth Economics lookup table
test=pd.pivot_table(Look,index=['Landcover','Agriculture','Riparian','Urban'],colum
ns='valueType',values='low')
test.reset_index(inplace=True)
test['index1']=test.index
values1=test[['Aesthetic','Air','Carbon Sequestration',
'Disaster Mitigation','Health','Shelter','Waste','Water']].add_suffix('_low')
values1['index1']=values1.index
test2=pd.pivot_table(Look,index=['Landcover','Agriculture','Riparian','Urban'],
columns='valueType',
values='high')
test2.reset_index(inplace=True)
values2=test2[['Aesthetic','Air','Carbon Sequestration',
'Disaster
Mitigation','Health','Shelter','Waste','Water']].add_suffix('_high')
values2['index1']=values2.index
keyTableEE2 =
pd.merge(test[['index1','Landcover','Agriculture','Riparian','Urban']],
values1)
keyTableEE = pd.merge(keyTableEE2,values2)
del keyTableEE['index1']
keyTableEE.head()
37newOriginal = scene[['FID','GRID_ID','Acres','Latitude','Longitude',
'zoneMGT','LC','Agricultur','Riparian','Urban','Scenario','modified']]
newOriginal.rename(columns={'Agricultur':'Agriculture'}, inplace=True)
preOrig = pd.merge(newOriginal,keyTableEE, how='left',
left_on=['LC','Agriculture','Riparian','Urban'],
right_on=['Landcover','Agriculture','Riparian','Urban'])
preOrig['aestheticLowTotal'] = preOrig['Acres']*preOrig['Aesthetic_low']
preOrig['aestheticHighTotal'] = preOrig['Acres']*preOrig['Aesthetic_high']
preOrig['airLowTotal'] = preOrig['Acres']*preOrig['Air_low']
preOrig['airHighTotal'] = preOrig['Acres']*preOrig['Air_high']
preOrig['carbonLowTotal'] = preOrig['Acres']*preOrig['Carbon Sequestration_low']
preOrig['carbonHighTotal'] = preOrig['Acres']*preOrig['Carbon Sequestration_high']
preOrig['mitigationLowTotal'] = preOrig['Acres']*preOrig['Disaster Mitigation_low']
preOrig['mitigationHighTotal'] = preOrig['Acres']*preOrig['Disaster
Mitigation_high']
preOrig['healthLowTotal'] = preOrig['Acres']*preOrig['Health_low']
preOrig['healthHighTotal'] = preOrig['Acres']*preOrig['Health_high']
preOrig['shelterLowTotal'] = preOrig['Acres']*preOrig['Shelter_low']
preOrig['shelterHighTotal'] = preOrig['Acres']*preOrig['Shelter_high']
preOrig['wasteLowTotal'] = preOrig['Acres']*preOrig['Waste_low']
preOrig['wasteHighTotal'] = preOrig['Acres']*preOrig['Waste_high']
preOrig['waterLowTotal'] = preOrig['Acres']*preOrig['Water_low']
preOrig['waterHighTotal'] = preOrig['Acres']*preOrig['Water_high']
preOrig['lowTotal'] =
preOrig['aestheticLowTotal']+preOrig['airLowTotal']+preOrig['carbonLowTotal']+preOr
ig['mitigationLowTotal']+preOrig['healthLowTotal']+preOrig['shelterLowTotal']+preOr
ig['wasteLowTotal']+preOrig['waterLowTotal']
preOrig['highTotal'] =
preOrig['aestheticHighTotal']+preOrig['airHighTotal']+preOrig['carbonHighTotal']+pr
eOrig['mitigationHighTotal']+preOrig['healthHighTotal']+preOrig['shelterHighTotal']
+preOrig['wasteHighTotal']+preOrig['waterHighTotal']
preOrig=preOrig.drop(['Aesthetic_low','Aesthetic_high','Air_low','Air_high',
'Carbon Sequestration_low','Carbon Sequestration_high',
'Disaster Mitigation_low','Disaster Mitigation_high',
'Health_low','Health_high','Shelter_low','Shelter_high',
'Waste_low','Waste_high','Water_low','Water_high'], axis = 1)
preOrig.fillna(0, inplace=True)
x = np.array(np.rec.fromrecords(preOrig.values))
names = preOrig.dtypes.index.tolist()
x.dtype.names = tuple(names)
arcpy.da.NumPyArrayToTable(x,
38"C:/Users/lewis/Documents/ArcGIS/Projects/FoDP/FoDP.gdb/Scenarios_eg_table")
# convert pop geodatabase table to point file for network analysis
in_table = "Scenarios_eg_table"
out_feature_class = "Scenarios_eg"
x_coords = "Longitude"
y_coords = "Latitude"
# Make the XY event layer for providers.
arcpy.management.XYTableToPoint(in_table, out_feature_class,x_coords,
y_coords,None, arcpy.SpatialReference(2285))
5.2 Statistical Model Development and Deployment
Though the MGIS students in this capstone project feels as though there is insufficient data to
replicate the wildlife and vegetation ecosystem present at Discovery Park, it will be to our
stakeholder’s benefit if some foundational source code was provided that is capable of handling
a large number of interactions. Therefore, the MGIS students decided to implement a random
forest regression model to model the correlation between the population density of birds and
vegetation. In this dataset, there are over 100 species of birds and almost 20 species of
vegetation. Despite the preference of using a robust statistical model, we decided to keep the
modeling simple. With respect to statistical modeling, interpreting complex models rivals the
challenge of building a complex model. As such, we did not see the need in building a complex
statistical model without proof that the findings would be useful. We also decided to use the
sciKit-Learn library as it is one of the more established machine learning library used in Python.
It is important to note that though ArcGIS has several geoprocessing tools that leverages the
sciKit-Learn library, that users must activate (i.e., pip install) the library prior to use. There are
several ways to do this, but the pip installation approach in the ArcGIS Python Command
Prompt appears to be the easiest approach.
The first step in generating a prediction model that can predict the presence of wildlife given an
area’s vegetation status is to partition our data. We partitioned the data to prevent overfitting.
Overfitting can drastically reduce our odds of reasonably predicting our outcome of interest. In
this project we suggest that FoDP implement 10-fold cross validation where the estimates are
based on an ensemble of ten models where 10% of our data are removed and compared
against predictions to help develop our weights. Accuracy in modeling will be based upon the
pooled negative mean absolute error in our ten models. Despite the challenges in interpreting
beta weights in a random forest model, the model can output a variable importance factor to
give us a hint as to predictors with the largest influence on our wildlife outcome. Code and
preliminary findings are described below:
X_train, X_test, Y_train, Y_test = train_test_split(good_data[['Big-leaf
Maple','Bitter Cherry','California Blacberry',
39'Cattail','Douglas-
fir','Himalayan Blackberry','Barren','Pacific Madrone',
'Quackgrass','Red
Alder','Scotch Broom','Skunk Cabbage','Tall Fescue',
'Western
Hemlock','Western Red Cedar','Willow']],
good_data[['American Robin']],
test_size=0,
random_state=226)
gsc = GridSearchCV(estimator=RandomForestRegressor(),
param_grid={'max_depth': range(3,30),
'n_estimators': (10, 50, 100, 1000),},
cv=5, scoring='neg_mean_squared_error', verbose=0, n_jobs=1)
grid_result = gsc.fit(X_train, Y_train.values.ravel())
best_params = grid_result.best_params_
rfr = RandomForestRegressor(max_depth=best_params["max_depth"],
n_estimators=best_params["n_estimators"],
random_state=False, verbose=False)
# Perform K-Fold CV
scores = cross_val_score(rfr, X_train, Y_train.values.ravel(), cv=10,
scoring='neg_mean_absolute_error')
rfr.fit(X_train, Y_train.values.ravel())
scores
features = X_train.columns.values
importances = rfr.feature_importances_
indices = np.argsort(importances)
plt.title('Feature Importances for The American Robin')
plt.barh(range(len(indices)), importances[indices], color='#8f63f4',
align='center')
plt.yticks(range(len(indices)), features[indices])
plt.xlabel('Relative Importance')
plt.show()
40Fig 30. Feature importance results for the American Robin
Now that we have our base model built, now it is time to predict out values. To do this we will
essentially feed in the vegetation status of each of our five preprocessed scenarios to generate
predictions of American Robin density per each hexbin. An example, of the python syntax to
generate predictions is below:
scenario1['pred_AmericanRobin'] = rfr.predict(scenario1[['Big-leaf Maple','Bitter
Cherry','California Blackberry','Cattail','Douglas-fir','Himalayan
Blackberry','Barren','Pacific Madrone','Quackgrass','Red Alder','Scotch
Broom','Skunk Cabbage','Tall Fescue','Western Hemlock','Western Red
Cedar','Willow']])
5.3 Model Integration in ArcGIS AppBuilder
Since many details about appBuilder were discussed previously in this report, we will just
highlight details about widgets used in the simple “What-If” Analysis application. As mentioned
in section 5.1.2., the simple application is based on five preprocessed scenarios where we
simulate a case where city government officials are planning to have low-income housing at
Discovery Park. The feature class that was previously created using Earth Economics
affordance values were published as a Web Mapping Application in FoDP’s AGOL account.
From there the web map was imported into ESRI’s appBuilder. In this application, users can use
a filter that alters the affordance values based upon the low-income housing location of choice
(displayed in Figure 31). The Dashboard Theme template was used because it has a preset
template that allows for a large number of chart and numeric display options.
41Fig 31. “What-IF” Analysis Application
The widgets of choice with respect to this application were 10 infographic widgets, which
aggregates affordance values based upon the scenario chosen. A filter widget that allows users
to select a particular scenario (as displayed in Figure 31). Moreover, there is a select widget
that allows users to estimate affordances within the discovery park area (as displayed in Figure
32). Aside from some of the default widgets, the application also has a print widget that will
allow users to print and share their analyses to facilitate data-driven dialogue.
Fig 32. “What-IF” Analysis Application - Select Widget
42You can also read