Data mining in course management systems: Moodle case study and tutorial
←
→
Page content transcription
If your browser does not render page correctly, please read the page content below
COMPUTERS &
                                                                                                                           EDUCATION

     Data mining in course management systems: Moodle case study and
                                 tutorial
                                  Cristóbal Romero * , Sebastián Ventura, Enrique García
                       a
                           Department of Computer Sciences and Numerical Analisys, University of Córdoba, 14071 Córdoba, Spain

                                        Elsevier use only: Received date here; revised date here; accepted date here

Abstract

   Educational data mining is an emerging discipline, concerned with developing methods for exploring the unique types of data that come
from the educational context. This work is a survey of the specific application of data mining in learning management systems and a case
study tutorial with the Moodle system. Our objective is to introduce it in both a theoretical and practical way to all users interested in this
new research area. We describe the full process for mining e-learning data step by step as well as how to apply the main data mining
techniques used, such as statistics, visualization, classification, clustering, association rule mining, pattern mining and text mining of
Moodle data. We have used free data mining tools so that any user can immediately begin to apply data mining without having to purchase
a commercial tool or program a specific personalized tool.
© 2007 Elsevier Science. All rights reserved.

Keywords: Distance Education and telelearning, E-learning, Evaluation of CAL systems, Data mining, Web mining

1. Introduction

    The use of web-based education systems has grown exponentially in the last few years, spurred by the fact that neither
students nor teachers are bound to a specific location and that this form of computer-based education is virtually independent
of any specific hardware platforms (Brusilovsky and Peylo, 2003). Specifically, collaborative and communication tools are
also becoming widely used in educational contexts so, as a result, Virtual Learning Environments (VLE) are installed more
and more by universities, community colleges, schools, businesses, and even individual instructors in order to add web
technology to their courses and to supplement traditional face-to-face courses (Cole, 2005). Such e-learning systems are
sometimes also known as a Learning Management System (LMS), Course Management System (CMS), Learning Content
Management System (LCMS), Managed Learning Environment (MLE), Learning Support System (LSS) or Learning
Platform (LP).
    These systems can offer a great variety of channels and workspaces to facilitate information sharing and communication
between participants in a course, to let educators distribute information to students, produce content material, prepare
assignments and tests, engage in discussions, manage distance classes and enable collaborative learning with forums, chats,
file storage areas, news services, etc. Some examples of commercial systems are Blackboard (BlackBoard, 2007), WebCT
(WebCT, 2007), TopClass (TopClass, 2007), etc. and some examples of free systems are Moodle (Moodle, 2007), Ilias (Ilias,
2007), Claroline (Claroline, 2007), etc. Nowadays, one of the most commonly used is Moodle (Modular Object Oriented
Developmental Learning Environment) which is a free learning management system that enables the creation of powerful,
flexible and engaging online courses and experiences (Rice, 2006).

*
 Corresponding author. Fax: +34-957-218630
E-mail address: cromero@uco.es (C. Romero).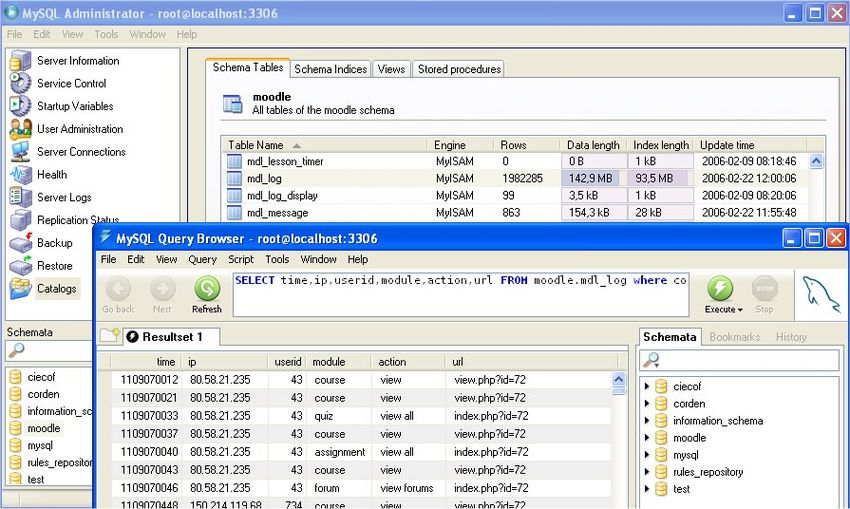
2                                             Submitted to Elsevier Science

   These e-learning systems accumulate a vast amount of information which is very valuable for analyzing students’ behavior
and could create a gold mine of educational data (Mostow and Beck, 2006). Learning management systems accumulate a
great deal of log data about students’ activities. They can record whatever student activities are involved, such as reading,
writing, taking tests, performing various tasks, and even communicating with peers (Mostow et al., 2005). They normally
also provide a database that stores all the system’s information: personal information about the users (profile), academic
results, user’s interaction data, etc. However, due to the vast quantities of data these systems can generate daily, it is very
difficult to manage manually, and authors demand tools which assist them in this task, preferably on a continuous basis.
Although some platforms offer some reporting tools, when there are a great number of students, it becomes hard for a tutor to
extract useful information. They do not provide specific tools which allow educators to thoroughly track and assess all the
activities performed by their learners and to evaluate the structure and contents of the course and its effectiveness in the
learning process (Zorrilla et. al., 2005). A very promising area for attaining this objective is the use of data mining (Zaïane
and Luo, 2001).
   Data mining or knowledge discovery in databases (KDD) is the automatic extraction of implicit and interesting patterns
from large data collections (Klosgen & Zytkow,2002). Data mining is a multidisciplinary area in which several computing
paradigms converge: decision tree construction, rule induction, artificial neural networks, instance-based learning, Bayesian
learning, logic programming, statistical algorithms, etc. And some of the most useful data mining tasks and methods are:
statistics, visualization, clustering, classification, association rule mining, sequential pattern mining, text mining, etc.
   In the last few years, researchers have begun to investigate various data mining methods to help teachers improve e-
learning systems (Romero and Ventura, 2006). Data mining can be applied to explore, visualize and analyze e-learning data
(Mazza and Milani, 2005) in order to identify useful patterns (Talavera and Gaudioso, 2004), to evaluate web activity to get
more objective feedback for teachers’ instruction and to find out more about how the students learn (Mor and Minguillon,
2004), etc. These methods allow us to discover new, interesting and useful knowledge based on students’ usage data. The
same idea has already been successfully applied in e-commerce systems where its use is very popular (Spiliopoulou, 2000).
Although discovery methods used in both areas (e-commerce and e-learning) are similar, the objectives are different
depending on the point of view. From a system perspective, there are no differences since the objective of web mining in both
application areas is to study users’ behavior (namely of clients in e-commerce and students in e-learning systems), evaluate
this behavior, and improve the systems to help the users. But from a user’s point of view there are differences, because the e-
commerce objective is to guide clients in purchasing while the e-learning objective is to guide students in learning. So, each
of them has special characteristics that require a different treatment of the web mining problem.
   The knowledge discovered can be used not only by providers (educators) but also by the users themselves (students), so it
can be oriented for different ends from each particular point of view (Zorrilla et al., 2005). It could be oriented towards
students in order to recommend learners’ activities, resources, suggest path pruning and shortening or simply links that would
favor and improve their learning, or oriented towards educators in order to get more objective feedback for instruction,
evaluate the structure of course content and its effectiveness in the learning process, classify learners in groups based on their
needs for guidance and monitoring, find learner’s regular as well as irregular patterns, find the most frequently made
mistakes, find activities that are more effective, etc. It could also be oriented towards the academics and administrators
responsible in order to obtain parameters about how to improve site efficiency and adapt it to the behavior of their users
(optimal server size, network traffic distribution, etc.), have measures about how to better organize institutional resources
(human and material) and their educational offer, enhance educational program offers, etc.
   Data mining has been applied to data coming from different types of educational systems. On one hand, there are
traditional face-to-face classroom environments such as special education (Tsantis and Castellani, 2001), higher education
(Luan, 2002), etc. On the other, there is computer-based education and web-based education such as well-known learning
management systems (Pahl and Dolleman, 2003), web-based adaptive hypermedia systems (Koutri et. al., 2005), intelligent
tutoring systems (Mostow and Beck, 2006), etc. The main difference between them is the data available in each system.
Traditional classrooms only have information about student attendance, course information, curriculum goals, individualized
plan data, etc. However, computer and web-based education have much more information available because these systems
can record all the information about students’ actions and interactions into log files, databases, etc.
   This paper is oriented to the specific application of data mining in computer-based and web-based educational systems. It
is arranged in the following way: Section 2 describes the general process of applying data mining to e-learning data,
especially to Moodle usage information. Section 3 details the preprocessing step necessary for adapting the data to the
appropriate format. Section 4 describes the application of the main data mining techniques in e-learning and an example case
study with Moodle data. Finally, the conclusions and further research are outlined.
Submitted to Elsevier Science 3
2. Process of data mining in e-learning
The traditional development of e-learning courses is a laborious activity (Herin et. al., 2002) in which the developer
(usually the course teacher) has to choose the contents that will be shown, decide on the structure of the contents, and
determine the most appropriate content elements for each type of potential user of the course. Due to the complexity of these
decisions, a one-shot design is hardly feasible, even when it is carefully done. Instead, it will be necessary in most cases to
evaluate and possibly modify the course contents, structure and navigation based on students’ usage information, preferably
even following a continuous empirical evaluation approach (Ortigosa and Carro, 2003). To facilitate this, we need data
analysis methods and tools to observe students’ behavior and to assist teachers in detecting possible errors, shortcomings and
possible improvements. Traditional data analysis in e-learning is hypothesis or assumption driven (Gaudioso and Talavera,
2006) in the sense that the user starts from a question and explores the data to confirm the intuition. While this can be useful
when a moderate number of factors and data are involved, it can be very difficult for the user to find more complex patterns
that relate different aspects of the data. An alternative to traditional data analysis is to use data mining as an inductive
approach to automatically discover hidden information present in the data. Data mining, in contrast, is discovery-driven in the
sense that the hypothesis is automatically extracted from the data and therefore is data-driven rather than research-based or
human-driven (Tsantis and Castellani, 2001). Data mining builds analytic models that discover interesting patterns and
tendencies from student’s usage information that can be used by the teacher to improve the student’s learning and course
maintenance.
The application of data mining in e-learning systems is an iterative cycle (Romero et. al., 2006) in which the mined
knowledge should enter the loop of the system and guide, facilitate and enhance learning as a whole, not only turning data
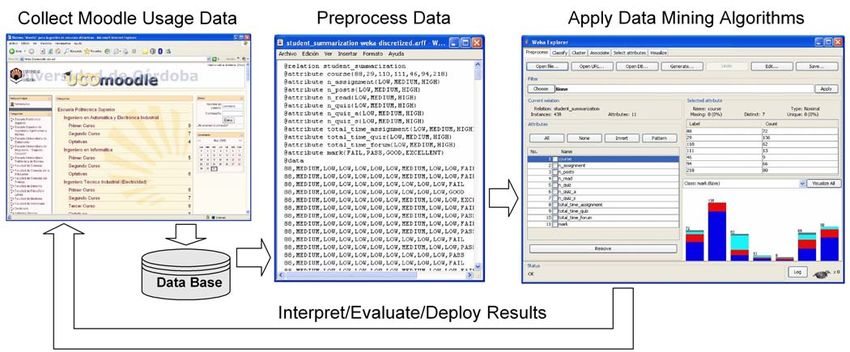
into knowledge, but also filtering mined knowledge for decision making. The e-learning data mining process consists of the
same four steps in the general data mining process (see Figure 1) as follows:
- Collect data. The LMS system is used by students and the usage and interaction information is stored in the database. In
this paper we are going to use the students’ usage data of the Moodle system.
- Preprocess the data. The data is cleaned and transformed into an appropriate format to be mined. In order to preprocess
the Moodle data, we can use a database administrator tool or some specific preprocessing tool.
- Apply data mining. The data mining algorithms are applied to build and execute the model that discovers and
summarizes the knowledge of interest for the user (teacher, student, administrator, etc.). In order to do so, we can use a
general or a specific data mining tool, and we can use a commercial or free data mining tool.
- Interpret, evaluate and deploy the results. The results or model obtained are interpreted and used by the teacher for
further actions. The teacher can use the information discovered to make decisions about the students and the Moodle
activities of the course in order to improve the students’ learning.
Fig. 1. Mining Moodle data.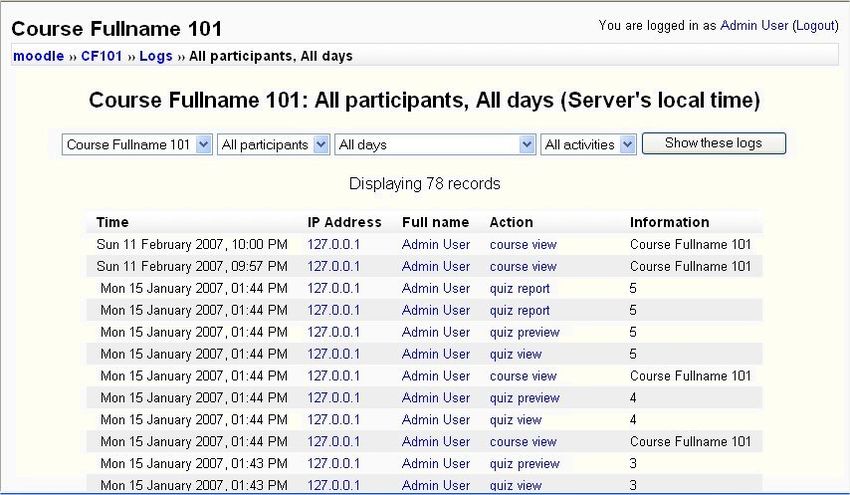
4                                             Submitted to Elsevier Science

   As we can see, the application of data mining in e-learning is not much different than any other application area. However,
there are some important issues that make data mining in e-learning different than in the others (Romero and Ventura, 2006):
- Data. In other web-based systems the data used is normally a simple web server access log, but in e-learning there is much
   more information available about the student’s interaction. LMS systems can record whatever student activities are
   involved, such as reading, writing, taking tests, performing various tasks, and even communicating with peers. They
   normally also provide a database that stores all the system’s information with the personal information of the users
   (profile) and the user’s interaction data.
- Objective. The objective of data mining in each application area is different and can be more or less objective. For
   example, in e-commerce the objective is increasing profit, which is tangible and can be measured in term of amounts of
   money, number of customers and customer loyalty. But the objective of data mining in e-learning is improving the
   learning process and guiding students in their learning. This goal is more subjective and more subtle to measure.
- Techniques. Educational systems have special characteristics that require a different treatment of the mining problem.
   Some traditional techniques can be applied directly, but some cannot and have to be adapted to the specific educational
   problem. Furthermore, some specific data mining techniques can be used to specifically address the learning process.

3. Preprocessing Moodle data

   Moodle (Moodle, 2006) is an open-source learning course management system to help educators create effective online
learning communities. Moodle is an alternative to proprietary commercial online learning solutions, and is distributed free
under open source licensing. Moodle has been installed at universities and institutions all over the world. Moodle has a large
and diverse user community in over 75 languages in over 160 countries and more than 7,000 sites. An organization has
complete access to the source code and can make changes if need be. Moodle can range from a single-teacher site to a 40,000
student university (Cole, 2005).
   Moodle’s modular design makes it easy to create new courses, adding content that will engage learners. Moodle is
designed to support a style of learning called social constructionist pedagogy (Rice, 2006). This style of learning believes that
students learn best when they interact with the learning material, construct new material for others, and interact with other
students about the material. Moodle does not require the use of this style in the courses but this style is what it best supports.
Moodle has a flexible array of module activities and resources to create five types of static course material (a text page, a web
page, a link to anything on the Web, a view into one of the course’s directories and a label that displays any text or image),
six types of interactive course material (assignments, choice, journal, lesson, quiz and survey) and five kinds of activities
where students interact with each other (chat, forum, glossary, wiki and workshop).

                                                   Fig. 2. Moodle log report screen.
   Moodle keeps detailed logs of all activities that students perform (Rice, 2006). Logging is record keeping that can keep
track of what materials students have accessed. Moodle logs every click that students make for navigational purposes and
has a modest log viewing system built into it (see Figure 2). Log files can be filtered by course, participant, day and activity.
The teacher can use these logs to determine who has been active in the course, what they did, and when they did it. For
activities such as quizzes, not only the score and elapsed time are available, but also a detailed analysis of each student’s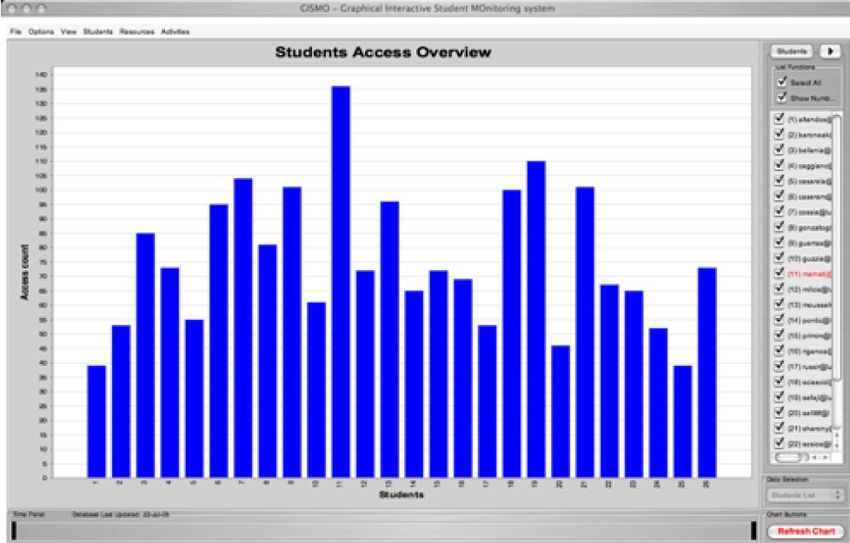
Submitted to Elsevier Science                                                     5

responses and item analysis of the items themselves. Teachers can easily get full reports of the activities of individual
students, or of all students for a specific activity. Activity reports for each student are available and details about each module
(last access, number of times read) as well as a detailed story of each student’s involvement. Logs can show the activity in the
class for different days or times. This can be useful to check to see if everyone has done a certain task, or spent a required
amount of time online within certain activities.
   Moodle does not store logs as text files. Instead, it stores the logs in a relational database. So, data are stored in a single
database. MySQL and PostgreSQL are the best supported, but it can also be used with Oracle, Access, Interbase, and others
(Cole, 2005). We have used MySQL because it is the world's most popular open source database (MySQL, 2007). The
Moodle database has about 145 interrelated tables (Table 1 shows some of the most important Moodle tables for our
purpose). But we do not need all this information and it is also necessary to convert it into the required format used by the
data mining tool and algorithms. For this reason, we have to perform a previous step to preprocess Moodle data.

                                       Table 1. Some important Moodle tables for doing data mining.
                                            Name                                         Description
                                           mdl_user                           Information about all the users.
                                       mdl_user_students                      Information about all students.
                                           mdl_log                                Logs every user’s action.
                                       mdl_assignement                    Information about each assignment.
                                  mdl_assignment_submissions           Information about assignments submitted.
                                           mdl_chat                         Information about all chatrooms.
                                        mdl_chat_users             Keeps track of which users are in which chatrooms.
                                          mdl_choice                        Information about all the choices.
                                         mdl_glossary                        Information about all glossaries.
                                          mdl_survey                           Information about all surveys.
                                           mdl_wiki                             Information about all wikies.
                                          mdl_forum                            Information about all forums.
                                       mdl_forum_posts                         Stores all posts to the forums.
                                    mdl_forum_discussions                     Stores all forums’ discussions.
                                         mdl_message                          Stores all the current messages.
                                      mdl_ message_reads                        Stores all the read messages.
                                           mdl_quiz                            Information about all quizzes.
                                      mdl_quiz_attempts                     Stores various attempts at a quiz.
                                       mdl_quiz_grades                           Stores the final quiz grade.

   Data preprocessing allows the original data to be transformed into a suitable shape to be used by a particular data mining
algorithm or framework. So, before applying a data mining algorithm, a number of general data preprocessing tasks can be
addressed (data cleaning, user identification, session identification, path completion, transaction identification, data
transformation and enrichment, data integration, data reduction). But data preprocessing of LMS has some specific issues:
   - Moodle and most of the LMS employ user authentication (password protection) in which logs have entries identified by
      users since the users have to log-in, and sessions are already identified since users may also have to log-out. So, we can
      remove the typical user and session identification tasks of preprocessing data found in web-based systems.
   - Moodle and most of the LMS record the students’ usage information not only in log files but also directly in databases.
      The tracking module can store user interactions at a higher level than simple page access. Databases are more powerful,
      flexible and bug-prone than typical log text files for gathering detailed access and usage information from the services
      available (forums, chats, etc.) in the LMS.
   So, the data gathered by a LMS may require less cleaning and preprocessing than data collected by other systems.
Although the amount of work required in data preparation is less, the following tasks also need to be done:
   - Select data. It is necessary to choose which courses we are interested in using mining for. Although information is
      available about 4223 students in 192 courses corresponding to different Moodle courses in the University of Cordoba,
      the teachers normally use only assignments. So, we have chosen only 7 courses from among all these courses because
      they use a higher number of Moodle activities and resources (at least assignments, messages, forums and quizzes) and
      the final marks obtained by students only in these courses are also available. So, the total number of students that we are
      going to use in this study is 438 students.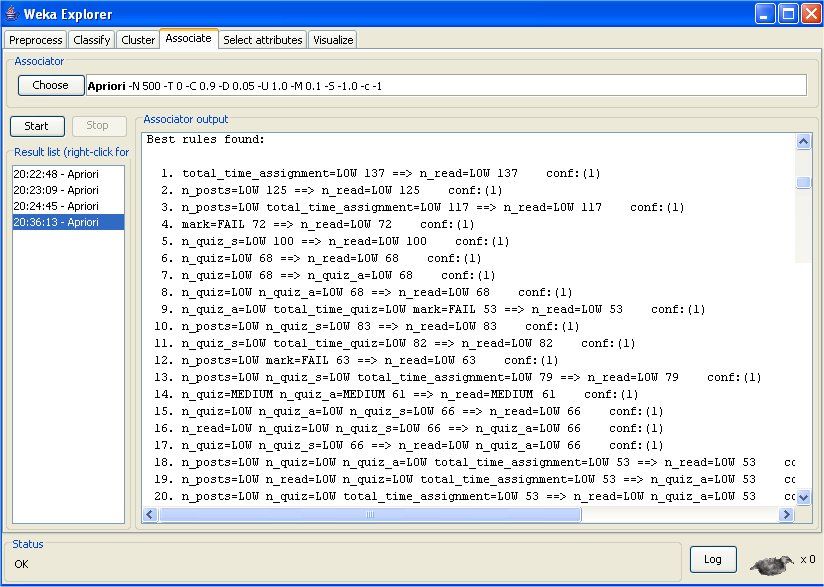
6                                                   Submitted to Elsevier Science

                                                     Table 2. Attributes used for each student.
                                            Name                                   Description
                                              course                   Identification number of the course
                                           n_assigment                 Number of assignments handed in.
                                              n_quiz                       Number of quizzes taken.
                                             n_quiz_a                      Number of quizzes passed.
                                             n_quiz_s                      Number of quizzes failed.
                                           n_messages                 Number of messages sent to the chat.
                                         n_messages_ap              Number of messages sent to the teacher.
                                              n_posts                Number of messages sent to the forum.
                                              n_read                    Number or forum messages read
                                     total_time_assignment               Total time spent on assignment.
                                         total_time_quiz                   Total time used in quizzes.
                                        total_time_forum                    Total time used in forum.
                                               mark               Final mark the student obtained in the course.

    - Create summarization tables. It is necessary to create a new table (mdl_summarization) in the Moodle database that can
      summarize the information at the required level (e.g. student). Student and interaction data are spread over several
      tables. We have created a new summary table (see Table 2) which integrates the most important information for our
      objective. This table has a summary per row about all the activities done by each student in the course and the final
      mark obtained by the student in the course in question. In order to create this table it is necessary to make several
      queries to the database in order to obtain the information about suitable students (userid value from mdl_user_students
      table) and courses (id value of the mdl_course table). For example, in order to obtain the total number of quizzes that
      have been completed by our students (identified by userid) in a specific course (identified by id) the select sentence has
      to be the following:
SELECT COUNT(*) FROM moodle.mdl_quiz,moodle.mdl_quiz_grades
WHERE mdl_quiz_grades.userid= " +userid+ " and mdl_quiz.course= " + id + " and mdl_quiz.id = mdl_quiz_grades.quiz

    - Data discretization. It can necessary to perform a discretization of numerical values in order to increase the
      interpretation and comprehensibility. Discretization divides the numerical data into categorical classes that are easier to
      understand for the teacher (categorical values are more user friendly for the teacher than precise magnitudes and
      ranges). We have discretized all the numerical values of the summarization table (mdl_summarization_discretized)
      except for the course identification number. There are some unsupervised global methods for transforming continuous
      attributes into discrete attributes (Dougherty et al., 1995), such as the equal-width method (divides the range of the
      attribute into a fixed number of intervals of equal length), equal-frequency method (divides the range of the attribute
      into a fixed number of intervals with the same or approximately the same number of instances in it) or the manual
      method (in which the user has to specify the cut-off points). In this case, we have used the manual method in the mark
      attribute with four intervals and labels (FAIL if value is < 5, PASS if value is > 5 and < 7, GOOD if value is >7 and < 9,
      and EXCELLENT if value is > 9) and the equal-width method in all the other attributes with three intervals and labels
      (LOW, MEDIUM and HIGH).
    - Transform the data. It is necessary to transform the data to the required format of the data mining algorithm or
      framework. In our case, we have exported the mdl_log Moodle table and the two versions of the summary table (with
      numerical and categorical values) to text files with ARFF format. An ARFF (Attribute-Relation File Format) file is an
      ASCII text file that describes a list of instances sharing a set of attributes (Witten, I.H., Frank, E. 2005). ARFF files
      have two distinct sections. The first section is the header information (the name of the relation, a list of the attributes
      and their types), which is followed by the data information (containing the data declaration line and the actual instance
      lines). Table 3 shows an example of the summary table dataset with numerical values.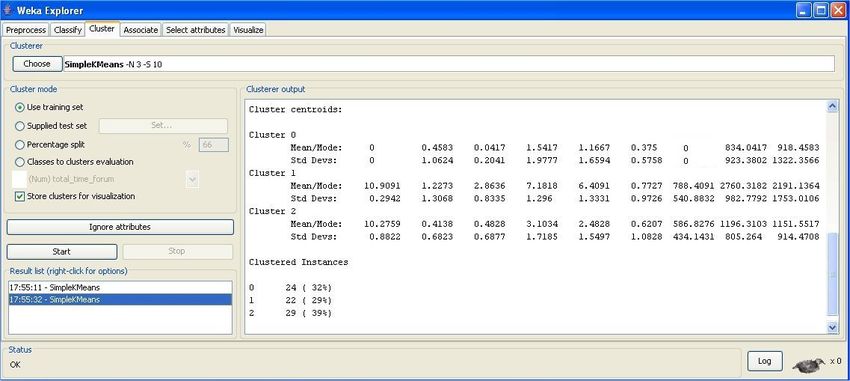
Submitted to Elsevier Science                                                  7

                                            Table 3. Example of student_summarization file.
                                               @relation student_summarization
                                               @attribute course numeric
                                               @attribute n_assignment numeric
                                               …
                                               @attribute total_time_forum numeric
                                               @attribute mark numeric
                                               @data
                                               218,10,1,0,1,1,0,415,0,1417,6.0
                                               218,0,0,0,2,2,0,0,641,1032,3.5
                                               218,11,1,0,7,5,2,890,4667,5414,6.0
                                               218,11,1,0,8,7,1,503,4735,4413,5.5
                                               218,10,0,0,2,2,0,870,1237,100,2.5
                                               218,10,0,0,6,5,1,332,1996,721,5.25
                                               …

   In order to preprocess the Moodle data, we can use a database management tool such as MySQL Administrator tools
(MySQL, 2007), phpMyAdmin (phpMyAdmin, 2007), etc. These tools let us see, edit, delete, modify all the tables and table
data, execute SQL queries, create new tables such as the summarization table, etc. In Figure 3 we can see MySQL
Administrator tool executing a SQL query to the mdl_log table. Using this graphical tool we can select the required data
using SQL queries and export them to format such as CVS, XML, Excel and Plist. We can also directly export Moodle table
data into files with ARFF format using other specific preprocessor tools. For example, we can use the Open DB Preprocess
task in Weka Explorer (Weka, 2007), or we can use WekaTransform (WekaTransform, 2007) in order to transform data
directly from a database into ARFF format.

                                 Fig. 3. MySQL Administrator tool executing a SQL query to a Moodle table.

4. Applying data mining techniques to Moodle data

   Data mining is the process of efficient discovery of non-obvious valuable patterns from a large collection of data (Klosgen
and Zytkow, 2002). There are a lot of general and specific data mining tools and frameworks. Some examples of commercial
mining tools are DBMiner (DBMiner, 2007), SPSS Clementine (Clemententine, 2007), DB2 Intelligent Miner (Miner, 2007),
etc. And some examples of public domain mining tools are Weka (Weka, 2007), Keel (Keel, 2007), etc. Weka (Witten &
Frank, 2005) is open source software that provides a collection of machine learning and data mining algorithms for data pre-
processing, classification, regression, clustering, association rules, and visualization. Keel (Alcalá et al, 2004) is an open
source software tool developed to build and use different data mining models such as pre-processing algorithms, decision
trees, rule extraction, descriptive induction, statistical methods, neural networks, evolutionary multiclassifier systems, etc.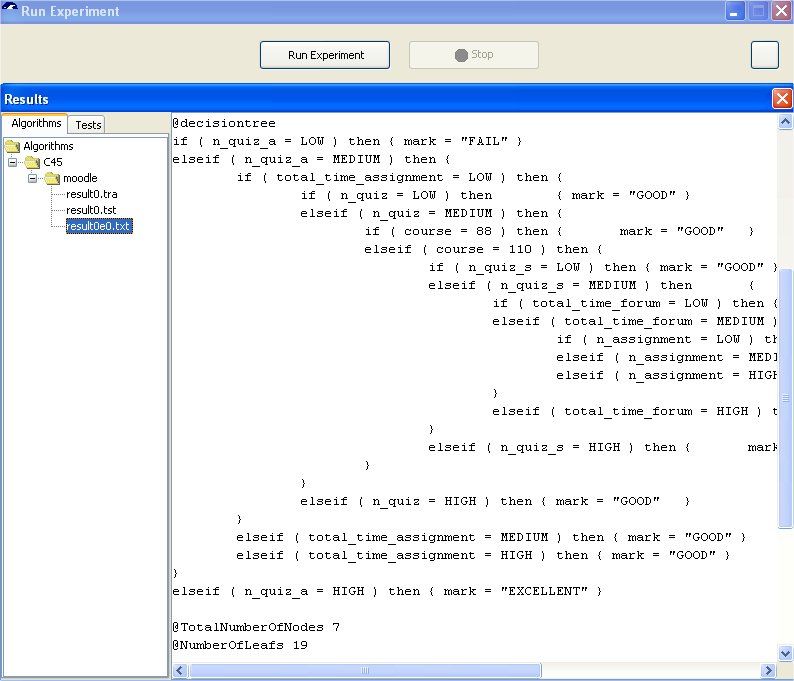
8 Submitted to Elsevier Science
There are also some specific educational data mining tools such as the Mining tool (Zaïane and Luo, 2001) for association
and pattern mining, MultiStar (Silva and Vieira, 2002) for association and classification, EPRules (Romero et. al., 2004) for
association, KAON (Tane et al., 2004) for clustering and text mining, Synergo/ColAT (Avouris et al., 2005) for statistics and
visualization, GISMO (Mazza and Milani, 2005) for visualization, Listen tool (Mostow et al., 2005) for visualization and
browsing, TADA-Ed (Merceron and Yacef, 2005) for visualizing and mining, O3R (Becker et. al, 2005) for sequential
pattern mining, Sequential Mining tool (Romero et. al., 2006) for pattern mining, MINEL (Bellaachia et. al, 2006) for mining
learning paths, CIECoF (García et al., 2006) for association rule mining, Simulog (Bravo and Ortigosa, 2006) for looking for
unexpected behavioral patterns.
In this paper, we are going to use Weka, Keel systems and some other specific tools such as GISMO, Sequential Mining
tool and KEA (KEA, 2007) because they all have in common what we consider to be three important characteristics: they are
free software systems, they have been implemented in Java language and they use the same dataset external representation
format (ARFF files). So, we can easily obtain them from Internet, we can work with them without data format problems and,
if we want, we can modify them using the same programming language.
Data mining has a number of representation formalisms such as probabilities, rules, trees, etc. and a number of tasks and
methods from machine learning, statistics, visualization, artificial intelligence, etc. (Klosgen and Zytkow, 2002). Next, we are
going to describe examples of the specific application of data mining techniques in e-learning systems and Moodle as the
case study, grouped in different categories.
4.1. Statistics
Statistics (Hill and Lewicki, 2006) is a mathematical science pertaining to the collection, analysis, interpretation or
explanation, and presentation of data. The word statistics is the plural of statistic (singular), which refers to the result of
applying a statistical algorithm to a set of data, as in employment statistics, accident statistics. Statistical methods can be used
to summarize or describe a collection of data (descriptive statistics) and for modeling patterns in the data in a way that
accounts for randomness and uncertainty in the observations, to draw inferences about the process or population being
studied (inferential statistics). There are a lot of statistical methods such as basic descriptive statistics (mean, confidence
interval, histogram, frequency table, standard deviation, etc.). And more advanced inferential statistics such as correlations
(that is a measurement of the relation between two or more variables), regression (that takes a numerical dataset and develops
a mathematical formula that transforms input variables into real-valued prediction for the dependent variable/s), hypothesis
testing (answer to yes/no question), ANOVA, time series, etc.
Student’s usage statistics are often the starting point of evaluations on an e-learning system. Although usage statistics may
be extracted using standard tools designed to analyze web server logs such as AccessWatch, Analog, Gwstat, WebStat, etc.
(Zaïane et al., 1998), there are some specific statistical tools in educational data such as Synergo/ColAT (Avouris et al.,
2005). Some example of usage statistics in e-learning systems are simple measurements such as number of visits and visits
per page (Pahl and Donnellan, 2003). Some other statistics show the connected learner distribution over time and the most
frequently accessed courses (Nilakant and Mitrovic, 2005); the visits and duration per quarter, the top referrer and top search
terms (Grob et al., 2004); reports about assistment systems (Feng and Hefferman, 2006); reports of weekly and monthly user
trends and activities (Monk, 2005). Some specific statistics can show the average number of constraint violations and the
average problem complexity (Zorrilla et al., 2005). More advanced statistical methods such as correlation analysis between
variables can be used to infer student’s attitudes that affect learning (Arroyo et. al., 2004), or for predicting the final exam
score (Pritchard and Warnakulasooriya, 2005). At the same time, regression analysis can be used to predict a student’s
knowledge and which metrics help to explain the poor prediction of state exam scores (Feng et. al., 2005), for predicting
whether the student will answer a question correctly enough (Beck and Woolf, 2000), and for predicting end-of-year
accountability assessment scores (Anozie and Junker, 2006).
Moodle does not provide a basic statistics module in which the teacher can obtain specific reports about detailed statistics
about every single student’s performance (how many hours on the site, how much time at every activity, etc.). It would be
very useful for attendance reports (total student enrollment in all courses, total student activity for a whole course for a
specific teacher, student history of all courses taken, time spent in each and grades for each in chronological order) and
financial reports (total enrollment income for specific periods of time, total fees collected from any student for all courses
they have taken, total income generated per student by a teacher for specific periods of time).
Moodle only shows some statistical information in some of the modules (grades and quizzes). On one hand, the teacher
can use scales to rate or grade forums, assignments, quizzes, lessons, journals and workshops in order to evaluate students’
work. Moodle comes with two preexisting scales, one that is numerical (from 1 to 100) and the other to indicate if an item is
connected to other knowledge in the course. But, the teacher can customize grade scales (categorize grades, assign ranges to
letter grades, use weighted grades, hide/reveal grades to students) in order to have a powerful way to view the progress of the
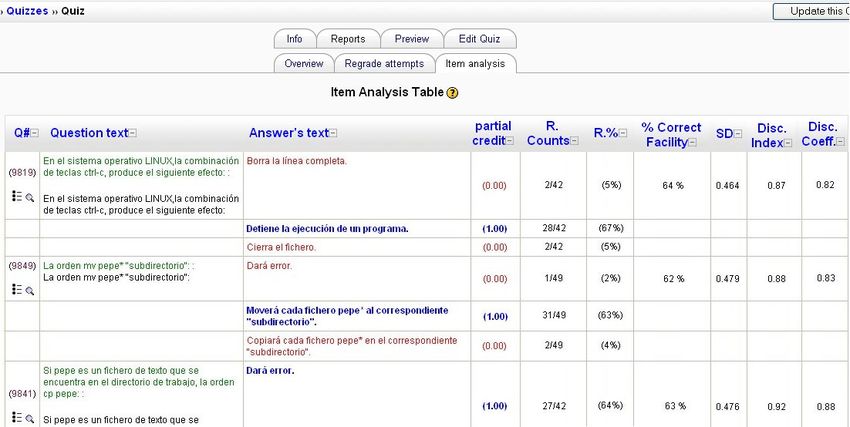
students. On the other hand, Moodle has statistical quiz reports which show item analysis (see Figure 4). This table presents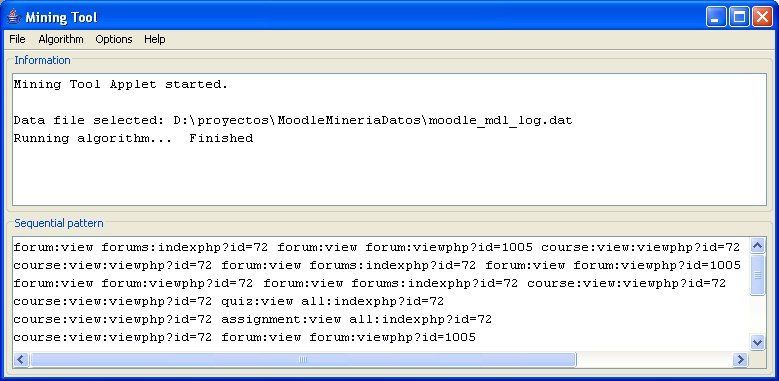
Submitted to Elsevier Science                                                    9

processed quiz data in a way suitable for analyzing and judging the performance of each question for the function of
assessment. The statistical parameters used are calculated as explained by the classical test theory (Facility Index or %
Correct, Standard Deviation, Discrimination Index, Discrimination Coefficient). The teacher can see which questions are the
most difficult and easiest for the students (% Correct Facility)as well as the most discriminating ones (Disc. Index and Disc.
Coeff.). This information can also be downloaded in text-only or Excel format in order to use a spreadsheet to chart and
analyze it.

                                                     Fig. 4. Moodle item analysis.
   Using this information the teacher can carry out a continuous maintenance of the quizzes. For example, the teacher can
modify questions (question text or answer text) or delete questions if they are much too easy or difficult (% correct facility)
and almost all the students fail them (they can have some syntax/semantic error or they are really very difficult) or almost all
the students do them perfectly (they are very easy), and if they are not discerning enough (disc. Index and coeff.) to make a
distinction between good and bad students.

4.2. Visualization

   Information visualization (Spence, 2001) is a branch of computer graphics and user interface which is concerned with the
presentation of interactive or animated digital images so that users can understand data. These techniques facilitate analysis
of large amounts of information by representing the data in some visual display. Normally large quantities of raw instance
data are represented or plotted as spreadsheet charts, scatter plots, 3D representations, etc. Apart from the distinction between
interactive visualizations and animation, the most useful categorization is probably between abstract and model-based
scientific visualizations. The abstract visualizations show completely conceptual constructs in 2D or 3D. These generated
shapes are completely arbitrary. The model-based visualizations either place overlays of data on real or digitally constructed
images of reality, or they make a digital construction of a real object directly from the scientific data.
   Information visualization can be used to graphically render complex, multidimensional student tracking data collected by
web-based educational systems. The information visualized in e-learning can be about: complementary assignments, admitted
questions, exam scores, etc. (Shen et al., 2002). There are some specific visualization tools in educational data. CourseVis
(Mazza and Dimitrova, 2004) visualizes data from a java on-line distance course inside WebCT. GISMO (Mazza and Milani,
2005) uses Moodle student’s tracking data as source data, and generates graphical representations that can be explored by
course instructors. Listen tool (Mostow et al., 2005) browses vast student-tutor interaction logs from Project LISTEN’s
automated Reading Tutor. Using these tools, instructors can manipulate the graphical representations generated, which allow
them to gain an understanding of their learners and become aware of what is happening in distance classes.
   Moodle does not provide visualization tools of student usage data; it only provides text information (log reports, items
analysis, etc.). But we can download and install GISMO (GISMO, 2007) into our Moodle system. GISMO is a graphical
interactive student monitoring and tracking system tool that extracts tracking data from Moodle and generates graphical
representations that can be explored by course instructors to examine various aspects of distance students. GISMO provides
different types of graphical representations and reports of data collected from real courses such as graphs reporting the
10 Submitted to Elsevier Science
student’s access to the course (see Figure 5), graphs reporting on the access performed by a specific students to the course’s
resources, graphs reporting the students’ accesses to a resources of the course, graphical representation of discussions
performed in a course, graphs reporting data from the evaluation tools, etc.
Fig. 5. Students access overview on resources.
The image in Figure 2 represents the global number of accesses made by students (in X-axis) to all the resources of the
course (Y-axis). If the user clicks with the right mouse -button on one of the bars of the histogram and selects the item
”Details”, he can see the details for a specific student (the resource sequence order inside the course). Using this graph, the
instructor has an overview of the global access made by students to the course with a clear identification of patterns and
trends, as well as information about the attendance of a specific student in the course. Using this information can detect more
easily students with some learning problems, for example, students with a very low number of accesses (the first student and
the last but one student in the graph in Figure 2), assignments, quizzes, etc.
4.3. Clustering
Clustering is a process of grouping objects into classes of similar objects (Jain et al., 1999). It is an unsupervised
classification or partitioning of patterns (observations, data items, or feature vectors) into groups or subsets (clusters). This
technique groups records together based on their locality and connectivity within an n-dimensional space. Clustering and
classification are both classification methods (Klosgen and Zytkow, 2002). Clustering is an unsupervised classification and
classification is a supervised classification. In the case of clustering, the problem is to group a given collection of unlabeled
patterns into meaningful clusters. Clustering analysis helps construct meaningful partitioning of a large set of objects based
on a divide and conquer methodology. The principle of clustering is maximizing the similarity inside an object group and
minimizing the similarity between the object groups. There are many clustering methods (Jain et al., 1999), including
hierarchical (single-link, complete-link, etc.) and objective-function-based algorithms (K-means, expectation maximization,
etc.).
In e-learning, clustering can be used for finding clusters of students with similar learning characteristics and to promote
group-based collaborative learning as well as to provide incremental learner diagnosis (Tang and McCalla, 2005), for
discovering patterns reflecting user behaviors and for collaboration management to characterize similar behavior groups in
unstructured collaboration spaces (Talavera and Gaudioso, 2004), for grouping students and personalized itineraries for
courses based on learning objects (Mor and Minguillon, 2004), for grouping students in order to give them differentiated
guiding according to their skills and other characteristics (Hamalainen et al., 2004), for grouping tests and questions into
related groups based on the data in the score matrix (Spacco et. al, 2006).
The Weka system has several clustering algorithms available. We are going to use the KMeans (MacQueen, 1967) that is
one of the simplest and most popular clustering algorithms. The K-means algorithm is an algorithm to cluster objects based
on attributes in k partitions. Our objective is to group students from a specific course into different clusters depending on theSubmitted to Elsevier Science 11
activities done in Moodle and the final marks. We are going to use the numerical summarization information about course
218 (Technical Office) and without two attributes: course (because it is the same in all cases) and mark (because it classifies
the cases). So, we have to select the suitable data executing the following SQL query:
SELECT n_assignment,npost,n_read,n_quiz,n_quiz_a,n_quiz_s,total_time_assignment,total_time_quiz,total_time_forum
FROM moodle.mdl_summarization where course = 218
Next, we have to save and transform the output to an ARFF file. Then, we execute the KMeans over this file with a value
of 3 to the number of clusters. Weka shows (Figure 6) information about the cluster centroids (mean/mode and standard
deviation of each attribute) of each cluster, and the number and percentage of instances in each cluster.
Fig. 6. Weka executing Kmeans algorithm.
We can see in Figure 6 that there are 3 clusters of students. Cluster 0 is characterized by students with no assignments (0),
very low messages read (0.045), very few quizzes done, passed and failed (1.54, 1.16 and 0.37) and low total times in
assignment, quiz and forum (0, 834.04 and 918.45). Cluster 1 is characterized by students with more than one message sent
to the forum (1.22), about 3 messages read (2.8), a high number of quizzes done and passed (7.1 and 6.4), a low number of
quizzes failed (0.7), and high total times in assignment, quiz and forum (788.40, 2760.31 and 2191.13). Finally, cluster 2 is
characterized by students with values somewhat smaller than cluster 1 but greater than cluster 0. We can also see in Figure 6
that the students are grouped into 3 clusters with a uniform number of students (24, 22 and 29).
The teacher can use this information in order to group students into different types of students: very active students
(cluster 1), active students (cluster 2) and non-active students (0). Using this information, for example, the teacher can group
students for working together in collaborative activities (each group with only students of the same cluster or each group with
a similar number of students of each cluster) or the teacher can group new students into these clusters depending on their
characteristics.
4.4. Classification
A classifier is a mapping from a (discrete or continuous) feature space X to a discrete set of labels Y (Duda et al., 2000).
Classification or discriminant analysis predicts class labels. It is a supervised classification in which we are provided with a
collection of labeled (preclassified) patterns; and the problem is to label a newly encountered, yet unlabeled, pattern.
Typically, the given labeled (training) patterns are used to learn the descriptions of classes which in turn are used to label
a new pattern. Based on models of patterns in the database, all the existing data are mapped to predefined set categories.
There are a lot of methods for constructing classifiers, including linear discriminant functions (descent, linear programming,
support vector machines, etc.), decision trees (ID3, C45, CART, etc.), piecewise linear classifiers, nearest-neighbor
classifiers, etc.
In e-learning, classification can be used for discovering potential student groups that have similar characteristics and
reactions to a specific pedagogical strategy (Chen et al., 2000), for predicting students’ performance and their final grade
(Minaei-Bidgoli and Punch, 2003), for detecting students’ misuse or gaming students (Baker et. al., 2004), for grouping
students as hint-driven or failure-driven and finding common misconceptions that students possessed (Yudelson et. al., 2006),12 Submitted to Elsevier Science
for identifying learners with little motivation and finding remedial actions in order to get lower drop-out rates (Cocea and
Weibelzahl, 2006).
The Keel system has several classification algorithms available. We are going to use the C4.5 algorithm (Quilan, 1993) in
order to characterize students who had passed or failed the course. The C4.5 is an algorithm for generating decision trees and
inducing classification rules from the tree. Our objective is to classify students into different groups with equal final marks
depending on the activities carried out in Moodle. We execute the C4.5 with the default parameters over the
student_summarization_discretized file (in which the class is the last attribute) and k-fold crossvalidation with k=3 (the
original sample is partitioned into K subsamples, and of the K subsamples, a single subsample is retained as the validation
data for testing the model, and the remaining K − 1 subsamples are used as training data.). When we execute the algorithm in
Keel, we obtain a decision tree (Figure 6). Keel also shows a summary with a number of nodes and a number of leaves on
the tree, number and percentage of correctly and incorrectly classified instances, etc.
Fig. 7. Keel executing C45 algorithm.
We can see that we obtain a set of IF-THEN-ELSE rules from the decision tree that can show interesting information
about the classification of the students. Summarizing the obtained rules, they classify at least three main categories of
students: students with a low number of passed quizzes are directly classified as FAIL (first IF in Figure 7), students with a
high number of passed quizzes are directly classified as EXCELLENT (last ELSEIF in Figure 7), and students with a
medium number of passed quizzes are classified as FAIL, PASS or GOOD depending on other values in the total time of
assignments, number of quizzes, number of quizzes failed, number of assignments, course, etc. (the rest of IF and ELSEIF).
The teacher can use the knowledge discovered by these rules for making decisions about the Moodle course activities and
for classifying new students. For example, it is very logical that the number of passed quizzes was the main discriminator of
the final marks, but there are some others that can help the teacher to decide to promote the use of some types of activities to
obtain higher marks, or on the contrary, to decide to eliminate some activities related to low marks, or the teacher can detect
new students with learning problems in time (students classified as FAIL). The teacher can also use the decision tree model in
order to classify new students and detect in time if they will have learning problems (students classified as FAIL) or not
(students classified as GOOD or EXCELLENT).
4.5. Association rule mining
Association rule mining is one of the most well studied mining methods (Ceglar and Roddick, 2006). The original
problem was market basket analysis that tried to find all the interesting relationships between the products bought. Such rules
associate one or more attributes of a dataset with another attribute, producing if-then statements concerning attribute-values.
Mining association rules between sets of items in large databases can by stated as follows (Agrawal et al., 1993): given a set
of transactions, where each transaction is a set of items, an association rule is a rule of the form X → Y, where X and Y areSubmitted to Elsevier Science 13
non-intersecting sets of items. Each rule is accompanied by two meaningful measures, confidence and support. Confidence
measures the percentage of transactions containing X that also contain Y. Similarly, support measures the percentage of
transactions that contain X or Y. There are a lot of association rule mining algorithms: Apriori was the first and it opened a
brand new family of algorithms (Ceglar and Roddick, 2006) such as Apriori-TID, DIC, Eclat, FP-Growth, etc.
These methods have been applied to web-based education systems for building a recommender agent that could
recommend on-line learning activities or shortcuts (Zaïane, 2002), for automatically guiding the learner’s activities and
intelligently generating and recommending learning materials (Lu, 2004), for determining which learning materials are the
most suitable to be recommended to the user (Markellou et al., 2005), for identifying attributes characterizing patterns of
performance disparity between various groups of students (Minaei-Bidgoli et al. ,2004), for discovering interesting
relationships from student’s usage information in order to provide feedback to course author (Romero et al., 2004), for
finding out the relationships between each pattern of learner’s behavior (Yu et al., 2001), for finding students’ mistakes that
often occur together (Merceron and Yacef, 2004), for guiding the search for best fitting transfer models of student learning
(Freyberger et al., 2004), for optimizing the content of the e-learning portal by determining what most interests the user
(Ramli, 2005).
The Weka system has several association rule-discovering algorithms available. We are going to use the Apriori algorithm
(Agrawal et al., 1993) for finding frequent item sets and association rules over the discretized summarization table of the
course 110 (Projects). So, we have to select the data executing the following SQL query:
SELECT n_assignment, npost, n_read,n_quiz,n_quiz_a,n_quiz_s,total_time_assignment,total_time_quiz,total_time_forum, mark
FROM moodle.mdl_summarization_discretized where course = 110
Next, we have to save and transform the output to an ARFF file. Then, we execute the Apriori algorithm with a minimum
support of 0.3 and a minimum confidence of 0.9 as parameters. Weka shows (Figure 7) a list or rules with the support of the
antecedent and the consequent (total number of items), and the confidence (percentage of items in a 0 to 1 scale) of the rule.
Fig. 7. Weka executing Apriori algorithm.
We can see in Figure 7 that the number of association rules discovered can be huge. And there are a lot of uninteresting
rules, for example, there are a lot of redundant rules (rules with a generalization of relationships of several rules, like rule 3
with rules 1 and 2, and rule 6 with rule 7 and 8), similar rules (rules with the same element in antecedent and consequent but
interchanged, such as rules 15, 16, 17, and rules 18, 19, 20) and random relationships (rules with random relation between
variables, such as rules 1 and 5). But there are also rules that can be relevant for educational purposes. For example, rules
that show expected or conforming relationships (if a students does not send messages, it is logical that he/she does not read
them either, such as rule 2, and in a similar way rules 10, 11 and 13) and rules that show unexpected relationships (such as
rules 4, 12, 14 and 9). These rules can be very useful for the teacher for decision making about the activities and detecting
students with learning problems. For example, rules 4, 12 and 9 show that if the number of messages read and messages sent14 Submitted to Elsevier Science
in the forum is very low, and the total time and number of passed quizzes is very low, then the final mark obtained is fail.
Starting from this information, the teacher can pay more attention to these students because they are prone to failure. The
teacher can try to motivate them in time to pass the course
4.6. Sequential pattern mining
Sequential pattern mining algorithms (Han et al., 2005) discover inter-session patterns. It is an important data mining
problem with broad applications. Sequential pattern mining tries to discover if the presence of a set of items is followed by
another item in a time-ordered set of sessions or episodes. It was first introduced in the study of customer purchase
sequences, as follows (Agrawal and Srikant, 1995): Given a set of sequences, where each sequence consists of a list of
elements and each element consists of items, and given a user-specified minimum support threshold, sequential pattern
mining is to find all frequent subsequences, i.e., the subsequences whose occurrence frequency is the set of sequences is not
less than minimum support. Normally, a web log’s file server is used to discover sequences of resource requests. The
problem of mining sequences of web navigational patterns refers to the identification of those web document references
which are shared throughout time among a large number of user sequences, where a user sequence is a time-ordered set of
visits. There are several popular pattern-discovering algorithms (Han et al., 2005) such as AprioriAll, GSP, SPADE,
PrefixSpan, CloSpan, FreSpan, etc.
The extraction of sequential patterns can be used in e-learning for evaluating learner’s activities and can be used in
adapting and customizing resource delivery (Zaïane and Luo, 2001), for comparison with expected behavioural patterns
specified by the instructor, designer or educator that describe an ideal learning path (Pahl and Donnellan, 2003), for giving an
indication of how to best organize the educational web space and be able to make suggestions to learners who share similar
characteristics (Ha et al. ,2000), for generating personalized activities to different groups of learners (Wang et al., 2004), for
supporting the evaluation and validation of learning site designs (Machado and Becker, 2003), for identifying interaction
sequences indicative of problems and patterns that are markers of success (Kay, et. al. 2006).
Neither Weka nor Keel provide any sequential pattern mining algorithms. A sequential mining tool (Romero et al, 2006)
can discover and recommend the most interesting paths used by students starting from log information. This Java application
has several mining sequential pattern algorithms and it also uses data files with ARFF format. Although it has been
developed to be integrated into the AHA! (Adaptive Hypermedia for all) system (AHA, 2007), it can be used with logs of
other systems. So, we have to select the log data from the Moodle database and transform them into ARFF format. In this
case, we are going to use only the log information about the students in course number 72 (Introduction to Computer
Science). In order to do so, we have to execute a SQL query. But we do not need all the data available in the mdl_log table,
only that referring to time access (time), user identification (ip and userid) and action identification (module, action and
URL). So, we can use the following select query in order to select the required data.
SELECT time,ip,userid,module,action,url FROM moodle.mdl_log where course = 72 order by time
Then we have to save the query results to a text file with ARFF format so that it can be used by the sequential mining tool.
We are going to use the PrefixSpan algorithm (Pei et. al., 2001) which is an efficient and well-known pattern mining
algorithm, as a parameter using a minimum support threshold of 30, which means that the sequences have to be followed by
at least 30 students.
Fig. 8. Sequential Mining Tool executing Apriori algorithm.Submitted to Elsevier Science 15
As we can see in Figure 8, the navigation patterns are lineal sequences of elements with three components (name of
module: action: URL). There are sequences of only 2 elements and several more long sequences. We are going to analyze the
first, the second and the last sequences obtained, which are very similar sequences. In all these sequences we can see that all
the students who start viewing the main forum discussion of the course (view the forum with id=72), then go on to view
another specific discussion forum (view the forum with id=1005). Starting from this information, the teacher can check what
the main topic in the secondary forum is (1005), and if it does or does not have a logical relationship with the main forum
(72) and also if it is beneficial for students. Then, the teacher can increase this relation (for example, locating both forums
together on the main page of the course) or decrease/delete this relation (for example, deleting the secondary forum or
locating it far from the main forum).
4.7. Text mining
Text mining is an interdisciplinary area involving machine learning and data mining, statistics, information retrieval and
natural language processing (Feldmand and Sanger, 2006). Its methods can be viewed as an extension of data mining to text
data and it is closely related to web content mining. Text mining can work with unstructured or semi-structured data sets such
as full-text documents, HTML files, emails, etc. Text mining usually involves the process of structuring the input text
(usually parsing, along with the addition of some derived linguistic features and the removal of others, and subsequent
insertion into a database), deriving patterns within the structured data, and finally evaluation and interpretation of the output.
High quality in text mining usually refers to some combination of relevance, novelty, and matters of interest.
The specific application of text mining techniques in e-learning can be used for grouping documents according to their
topics and similarities and providing summaries (Hammouda and Kamel, 2006), for finding and organizing material using
semantic information (Tane et al., 2004), for supporting editors when gathering and preparing the materials (Grobelnik et al.,
2002), for evaluating the progress of the thread discussion to see what the contribution to the topic is (Dringus and Ellis,
2005), for collaborative learning and a discussion board with evaluation between peers (Ueno, 2004a), for identifying the
main blocks of multimedia presentations (Bari and Benzater, 2005), for selecting articles and automatically constructing an e-
textbook (Chen et al., 2004), for selecting articles and constructing personalized courseware (Tang et. al., 2000), for detecting
the conversation focus of threaded discussions, classifying topics of discussions and estimating the technical depth of
contribution (Kim et. al., 2006).
Weka and Keel do not provide any text mining algorithms. So, we are going to use KEA (Witten et. al., 1999) which is a
tool for extracting key phrases from text documents. KEA is an open source software implemented in Java that uses core
Weka classes. It can be used for either free indexing or for indexing with a controlled vocabulary. We are going to describe
how we can do text mining for analyzing threaded Moodle discussion forums. KEA uses text files as input, so we need to
obtain them from the Moodle database. Moodle uses two related tables with forum data (forum_read and forum_post). Our
objective will be to examine the large blocks of text for the presence of specific content that could address the quality of
posting. First, we use SQL queries to select all the text messages in the discussion forums of the course. One course can have
one or several discussion forums. For example, we are going to select discussion forum number 93 which is one of the
forums in the Programming Methodology course.
SELECT message FROM moodle.mdl_forum_posts where discussion = 93
Then we have to save each query result to a different plain text file. Next, we have to select some of these files to train
KEA and others to test. For each train file, we have to add a corresponding key file in which we add the author-assigned key
phrases. Using these files we build a key phrase extraction model executing KEAModelBuilder. Finally, we can extract key
phrases for test files using the previous model executing KEAKeyphraseExtractor. The key phrases discovered are stored in a
key file for each test file. In our case, we have used several discussion forums to train (90, 91 and 92) and only one to test
(93). We can compare the results versus controlled author key phrases in the forum (see Table 3). In this way, we can analyze
the percentage of key words found by KEA that coincide with those in the author’s vocabulary.You can also read