Automatic passenger counting (APC) and automatic fare collection (AFC) technology
←
→
Page content transcription
If your browser does not render page correctly, please read the page content below
Automatic passenger counting (APC) and
automatic fare collection (AFC) technology
Benefits, technologies, components, data standards, experiences, and
recommendations

Developed for ODOT by Trillium

Contents
About this white paper

Summary
   Definitions and Components
   Benefits/Uses
      Automatic Passenger Counting
      Automatic Fare Collection
   AFC System Design
   Recommendations
      Recommendations for transit providers
      Recommendations for ODOT & Regional Organizations

Overview
   Uses of passenger data for transit agencies
   Uses of passenger data for ODOT and regional organizations
   APC technology
   Fare collection and passenger experience

Passenger count & fare collection data
    Functions & uses of data
       Local planning
       Regional and state planning
       National Transit Database (NTD) reporting
       Accuracy of counts
    Technology and Methodology
       Modularity and components
       APC components
           Door sensors
           Cameras
           Ramps and bike rack
           Passive Bluetooth-enabled device tracking
Architecture
From raw data to useful reports
Fare collection
APC vs AFC data
Manual passenger survey methods
Uses of data
Data management - GTFS-ride
Case studies: Agency experiences with passenger counting
Agency profiles
User experience and data reliability
Cherriots
Blacksburg Transit
CityBus
GRTS
LeeTran
TriMet
Use of data
Cherriots
Blacksburg Transit
LexTran
CityBus
GRTS
LeeTran
TriMet
Cost
Blacksburg Transit
LeeTran
Future Plans and other notes
Cherriots
Blacksburg Transit
Ticketing & fare collection
Purposes and benefits
Operational efficiency
Equity
Rider convenience
System Design
Example system - Hop Fastpass
Fare Validation Methods
Approach #1: Automated agency-owned device-based validation
Approach #2: Rider-owned device-based
APC and AFC technology white paper Page 2CAD / AVL Integration Recommendations Planning and design Procurement Implementation Operation Recommendations for ODOT & Regional Organizations Vendor Survey Glossary List of Acronyms APC and AFC technology white paper Page 3
About this white paper
Topic
Automatic Passenger Counters (APCs) are a variety of different sensors that count passengers
boarding and alighting transit vehicles. Automatic Fare Collection (AFC) gathers passenger counts
and other data from ticket validation as a rider’s board. Both can be used to collect data to fulfill
reporting requirements, optimize operations, and inform planning decisions to meet transit demand
better.

Audience and purpose
This paper was prepared for the Oregon Department of Transportation (ODOT). The intended
audience is small to medium fixed-route transit providers (with fewer than 200 vehicles) that are
exploring ways to collect better passenger data.

ODOT has expressed interest in more and higher quality transit ridership data. High quality
information will require consistent practices across transit agencies in Oregon; this can be
achieved by using APCs and AFCs that produce data in standardized formats (see procurement
and GTFS-ride). This information will help the state to coordinate transit services better to serve
travelers’ needs and demand.

AFC has additional value since fare payment technology was a key theme in the recent Oregon
Public Transportation Plan (OPTP).

Authors
This white paper was written by a team of consultants with Trillium Solutions, Inc. (“Trillium”), a
transit technology service provider and consulting firm based in Portland, Oregon. Trillium
maintains GTFS data and provides consulting services related to transit technology and data for
ODOT. Modular system design and open and interoperable data have been a core part of
Trillium’s approach and philosophy since its founding in 2008, which is reflected in the
recommendations in this white paper.
Trillium interviewed many vendors, consultants, and transit agencies in the course of writing this
white paper.

Lead author contact
Aaron Antrim, Principal
Trillium Solutions
610 SW Broadway Portland, OR 97212
aaron@trilliumtransit.com
+1 (503) 567-8422 ext. 3

APC and AFC technology white paper                                                            Page 4
Paper sections
   ● Overview
   ● Passenger count & fare collection data: Uses of passenger data and the technology used to
       acquire it.
           ○ Functions and uses of data: How ridership data can serve transit agencies and
              regional planning efforts.
           ○ Technology and Methodology: The many ways of collecting ridership data and
              comparisons of the data available from APC, AFC, and manual counts.
           ○ Case studies: agency experience with passenger counting: Interviews with agencies
              on uses of passenger data and implementation challenges.
   ● Ticketing & fare collection: User and agency benefits of AFC implementation and system
       design considerations.
           ○ Purpose and benefits: Benefits to passengers, bus operators, and improved runtime
              efficiency.
           ○ System Design: The four main decision points in AFC system implementation and
              the consequences of different arrangements.
           ○ Technology and components
   ● Recommendations: Suggestions for procuring and implementing APC and AFC systems.
           ○ Planning and design: Determining needs, preparing information, and developing an
              RFP/RFQ.
           ○ Procurement: Selecting a vendor or vendors.
           ○ Implementation: Installing hardware, preparing staff, and informing the public.
           ○ Operation & evaluation: Maintaining the system, troubleshooting issues, and
              making use of data.
           ○ Recommendations for ODOT: Opportunities to support agencies in implementing
              APC and AFC systems.

APC and AFC technology white paper                                                     Page 5
Summary
Definitions and Components
Automatic passenger counting (APC) is a system of sensors that count passengers boarding and
alighting transit vehicles.
Automatic fare collection (AFC) can include functions for selling, validating, and collecting fares
and tickets, including fareboxes that collect cash fares. AFC can provide passenger count and traveler
flow data for planners.
Components of an APC system may include:
● Door sensors in the form of infrared beams, which can be arranged in a variety of different
arrays
● Cameras
● Ramps/bike rack sensors
● Passive Bluetooth-enabled device tracking, which only tracks a subset of riders but may
provide more detailed data on passenger behavior
● On-board connectivity to backend systems
Components of an AFC system may include:
● On-board card or mobile ticket readers
● Bluetooth beacons for ticket validation
● Farecards (to store value or be linked with customer accounts)
● Mobile ticketing apps
● On-board connectivity to backend systems
Benefits/Uses
Automatic Passenger Counting
APC systems provide passenger counts, and depending on the system may capture information such as
passenger type, and origin and destination stops.
Transit providers may find this data useful for:
● NTD Reporting
● Local transit service planning
● Determining load levels on vehicles
● Tracking ridership changes
ODOT/regional organizations can use this data for:
● Regional/state transit service planning
● Understanding transit demand across services
APC and AFC technology white paper Page 6Automatic Fare Collection
AFC can capture passenger data such as:
● Fare type (e.g. pass vs. single-ride) and category (e.g. adult, youth, disabled, etc.)
● Travel behavior including origins, destinations, and transfers (also called ODX)
● Purchase and activation dates
● Purchase method
● Ticket status: used/unused
● Customer information
AFC and APC data can be synthesized to:
● Validate AFC data
● Estimate fare evasion rates
Aside from the data captured, AFC systems can provide other benefits such as:
● Equity for riders if fare-capping is implemented
● Improved passenger experience, both through ease of use and through the potential for
multiple agencies or modes to share fare systems
● Improved operational efficiency through faster boarding
● Reduced costs for cash handling
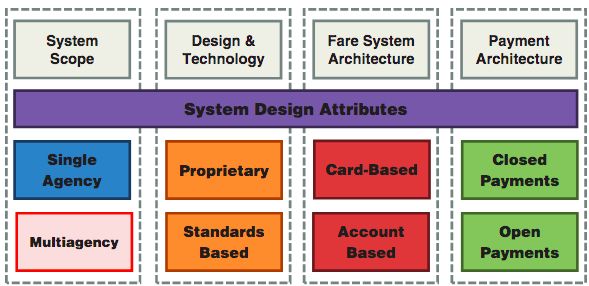
AFC System Design
Transit agencies should consider the following system design attributes when planning an AFC
system. Certain attributes are more compatible depending on the type of system desired. Find more
information in the discussion here.
● Transit system scope
○ Single agency
○ Multiagency: a lead transit agency with partners(such as TriMet’s HOP), or regional
authority
● Design and technology
○ A Proprietary system or design is developed and owned by a contracted vendor and
sold or licensed for use by a transit agency.
○ A Standards-based system or design follows public, non-proprietary standards and
specifications established for the financial payments industry.
● Fare system architecture
○ Card-based transit fare payment systems are those in which the fair medium itself
carries fare value.
○ Account-based transit fare payment systems are those in which the fare medium (such
as a card of virtual mobile wallet) serves as to associate the rider with information held
in a separate account. The fare medium itself does not carry any fare value.
APC and AFC technology white paper Page 7● Payment architecture
○ Closed payment (closed loop) system: a transit fare payment system that uses fare
media that can only be used within a single transit system or partnership of transit
systems. All proprietary fare payment systems are closed loop systems.
○ Open payment (open loop) system: an account-based transit fare payment system that
is able to accept third-party payment media such as bankcards and mobile devices as its
fare media. All open payment systems are both standards- and account-based systems.
Recommendations
Recommendations for transit providers
Planning and design
1. Consider and be clear about objectives to guide the project
2. Identify and document existing resources
a. Technology
b. Staff time and expertise
3. Consider an industry survey
4. Assess and prepare for capacity to maintain the system
5. Prepare for the procurement or pilot(s)
Procurement
1. Issue a procurement instrument (RFP/RFQ): Lead with a statement of objectives followed
by core requirements.
2. Consider a limited-scale pilot
Implementation
● Schedule data preparation: If GTFS data is used as an input (as is generally recommended),
it may need to be modified:
○ block_id values need to be present.
○ stop locations, schedules, and patterns need to be accurate.
● Hardware installation: Devices need to be installed on-board the vehicles, either by the
vendor, a local installation contractor, or maintenance staff. This is a good occasion to begin
maintenance and operations training for hardware.
● Back end payment options (AFC only): The payment options selected need to be established
and operational.
● Develop policies (AFC only): AFC offers an opportunity to transition to a proof-of-payment
fare system, which offers significant efficiency advantages. It is important to consider fare
inspection policies carefully to ensure equitable implementation.
○ Train and deploy proof-of-payment fare inspectors for consistent inspection across
routes and time of day to avoid targeting specific neighborhoods or communities.
APC and AFC technology white paper Page 8○ Fairness and the safety of both inspectors and riders is paramount; criminalizing riders
will not result in an equitable transit system.
● Testing: When the system is implemented, test the accuracy counts and/or the responsiveness
of fare payment mechanisms.
● Full public rollout (AFC only): Once the agency has confidence in the reliability of the
system, announce that it is fully implemented and implement a large publicity campaign to
encourage use of the new system. To avoid overwhelming riders, consider the following
guidelines for implementation:
○ Deploy the new payment system in stages;
○ Do not deploy the new system until all problems are worked out;
○ Increase outreach and education efforts.
Operation
1. Keep data inputs up to date
2. Monitor passenger usage and feedback (AFC only)
3. Monitor APC accuracy
4. Use data for service enhancement
5. Communicate changes effectively
Recommendations for ODOT & Regional Organizations
Standards-setting: Recommend or require APC systems that comply with industry standards for
interoperability and AFC systems that use standards-based, account-based, open payment, in order to
support system modularity and compatibility with statewide and third-party applications. Provide
education for transit agencies on the purpose and benefits of interoperability.
Allow for piecemeal (local) procurement of modular systems. Modularity and interoperability,
rather than a top-down or monolithic decision-making model, can achieve regional integration by
pursuing the guidelines and processes outlined in this white paper.
Statewide contracts with standards-compliant vendors: By securing contracts with standards-
compliant vendors and allowing transit agencies to purchase through those agreements, transit
agencies could save significant staff time.
Knowledge sharing: Encourage transit agencies that implement APC and AFC systems to share
procurement documents and notes on their experience.
Overview
Uses of passenger data for transit agencies
Passenger and fare count data, at varying levels of detail, is useful for local and regional planning and
is necessary for reporting in many circumstances. For transit agencies that receive federal funding,
APC and AFC technology white paper Page 9ridership data is required for the Federal Transit Administration’s National Transit Database (NTD) reporting. Agencies that are Full Reporters to NTD are required to provide Passenger Miles Traveled (PMT), defined by the total number of miles traveled by all passengers. Automatic passenger counters are especially helpful with the calculation of PMT, since most agencies do not have another way of automatically measuring alightings. Agencies can also benefit from collecting and analyzing passenger and fare data in order to determine load levels on vehicles and to track ridership changes. With this data, agencies can have better information before making changes to stop locations or service levels, or adjusting schedules to run more accurately. Uses of passenger data for ODOT and regional organizations Regional organizations such as the Oregon Department of Transportation can use ridership data to understand demand for transit services. If payment technologies that could track riders or payment instruments across different transit services were implemented more broadly in Oregon, it would become possible to analyze travel behavior and connections between services. APC technology There are several types of technology associated with automatic passenger counting. The most common are infrared (IR) door sensors that keep count with beam breaking technology as each passenger boards and alights the vehicle. Cameras can also be used to count riders. Many agencies supplement and verify their passenger count data with fare collection data. Automatic Fare Collection (AFC) can gather passenger counts from fare sales and ticket validation, which can then be compared to or combined with manual or APC data (i.e. to include passenger alightings gathered by APC in cases where AFC gathers only boardings). Bike and ramp sensors that track bicycle and wheelchair numbers may provide other useful data points for ridership information. The vehicle’s GPS can be another data source, allowing the correlation of passenger counts with the specific stops where the passengers board and alight. Fare collection and passenger experience Automated fare collection (AFC) technologies include electronic fareboxes that count cash and coins, electronic farecards and readers, and mobile fare payment apps and validators. AFC can provide riders with a simplified, convenient, and consistent experience during their travel and even between modes of transit throughout a region that is using the same system. Electronic farecards save riders from pre- planning to pay a cash fare or, if the system supports fare capping, from selecting a pass product. When regional transit agencies share AFC standards amongst each other, a rider can expect the same policies and fare structures wherever they ride. This convenience can enable riders to increase their use of transit services. APC and AFC technology white paper Page 10
Passenger count & fare collection data
Passenger count and fare collection data can be collected through a variety of technologies and
methods and can be used for a variety of purposes. This section describes options and opportunities.

Functions & uses of data
Agencies of all sizes have found that they can better meet their requirements and improve overall
service efficiency by utilizing fare and passenger count data. Common uses:
    ● Local transit service planning
    ● Regional and state transit planning
    ● National Transit Database (NTD) reporting

These functions can be accomplished using various sources, including data from Automatic Passenger
Counters (APCs), Automatic Fare Collection (AFC), and manual counts. Each source presents
different opportunities and involves different costs.

Local planning
Capturing boarding and alighting data at the stop and route level can be accomplished by integrating
APCs with GPS and data (for example in General Transit Feed Specification (GTFS) format) that
describes stops and schedules. This can help determine demand for stops, routes, and time of day.

Stops with very low demand can be identified and eliminated from routes to make service faster.
Services (trips and routes) with low demand that do not serve identified coverage goals 1 can be
eliminated to make resources available to serve greater passenger demand. (Note that passengers may
travel on high-demand peak service and then make a return trip on a low-demand off-peak service, or
vice versa, so cutting low-demand service can affect ridership on other trips. 2)

Demand data be useful to mitigate and manage the effects of temporary detours and to inform possible
expansions or improvements. For example, routes with very concentrated boarding and alighting
activity at particular stops may benefit buses with larger doors. Demand informs transit agencies of
what temporary measures are necessary when a station or stop is temporarily closed due to
construction detours or other obstructions. Stop level data can also help transit agencies allocate
amenities such as shelters, benches, and lighting. Finally, some APC technology provides more
differentiated data, such as wheelchair ramp deployment or bike rack use. These indicators can
similarly help transit agencies improve these accommodations.

1
    http://humantransit.org/tag/coverage
2
    The Transit Ridership Recipe: http://humantransit.org/2015/07/mega-explainer-the-ridership-recipe.html

APC and AFC technology white paper                                                                           Page 11
Regional and state planning
ODOT is interested in easy access to more and higher quality transit ridership data through a
standardized format used by all Oregon transit providers. This data should be generated with a spatial
component, typically at the route level and higher levels of aggregation, and sometimes at the stop or
stop cluster level (see the discussion of GTFS-ride). ODOT is interested in ridership data aggregated
by these geographic areas: statewide, urbanized area, urban cluster, county, ODOT transit region, and
corridor.
ODOT’s modelers are interested in passenger miles traveled (PMT) and ridership by route and time of
day and in understanding of impacts of transit investments. For their analysis, they need to know what
portion of Oregonians use transit and the average number of transit trips per Oregonian. It is important
to know which rides provide access that would not otherwise be available and to identify under- and
over-performing transit segments. ODOT’s modelers also have an interest in the impacts of
greenhouse gas emissions (GHG) and congestion from public transit. Building an understanding of the
state transit network involves learning the relationships between travel demand, transit capacity, and
transit use.
Passenger surveys can supplement ridership data. Surveys can capture valuable data points on rider
characteristics (age, disability, veteran status, income, etc.), trip purpose, and alternative travel choices.
National Transit Database (NTD) reporting
The most commonly reported reason for using APCs is to comply with NTD reporting. NTD requires
transit agencies receiving any federal funding to report a variety of details about their services. “Full
Reporters,” urban agencies with thirty vehicles or more and/or fixed guideway systems, are required to
report passenger miles traveled (PMT), which means they are required to collect both boardings and
alightings. Traditionally this has been measured by human counters, using statistical methods to
estimate annual boardings and alightings.
APCs offer an automated solution to an otherwise labor-intensive requirement. However, APC
accuracy can be dependent on a number of variables that may be specific to agencies. To account for
the variability, NTD requires each agency to validate its APC system once every three years 3. The
validation process requirements include:
● Manual counts of half the trips in the system, with a minimum of 15 vehicle trips required. No
more than 50 vehicle trips are required to be sampled.
● The routes must include some heavy ridership routes, a variety of vehicle modes, and a variety
of APC models where applicable.
● Manual counts must be done by a human who is not the driver, although using recorded video
to count is allowed.
3
2020 NTD Policy Manual https://www.transit.dot.gov/ntd/2020-ntd-reporting-policy-manual
APC and AFC technology white paper Page 12● Unlinked Passenger Trips (UPT) (i.e. boardings) and PMT collected through manual counts
must be within five percent of the values collected by the APC system.
● If 98 percent of the data or more is kept, the data may be presented as complete and submitted
to NTD. If two percent of the data or more has to be thrown out (more common), the data has
to be run through a statistical model to estimate UPT and PMT.
● Agencies must validate their systems before they can be used for NTD reporting and again on
all years divisible by three thereafter.
The above validation requirements can sometimes be as onerous as using manual counts alone. For
larger agencies, the labor costs saved on non-validation years can be significant. Some smaller
agencies have indicated that the additional cost and complication of validating the system are enough
that it is more cost effective for them to continue with manual counts. Still other agencies may get
benefits by working with an APC vendor to help them through this process.
Accuracy of counts
Generally, APC accuracy is measured against manual counts. Since a major incentive for APCs is
NTD reporting, NTD standards are commonly used to determine what is accurate. NTD requiresTechnology and Methodology
Modularity and components
APC and AFC systems comprise many components or modules. In some cases, agencies purchase all
components from the same vendor. In other cases, agencies purchase components separately from
various vendors and integrate them together into one system (see discussion of interoperability in the
procurement section). Components include:
● Sensors:
○ Infrared beam sensors
○ Cameras
○ Ramp and bike rack sensors
○ Passive bluetooth sensors
● Onboard sensor aggregator
● Farebox, farecard and mobile ticket readers
● Router and wireless connectivity for data transmission
● Analysis software
APC components
Door sensors
Infrared beam breaking door sensors are a standard for APC and are generally reliable on buses with
standard-sized doors. However, they may be inaccurate when placed in wide doors. There is also some
risk of inaccurate counts in very crowded conditions. Most beam sensors provide a passenger count,
with no information on characteristics of passengers. Some providers have begun offering infrared
arrays that do provide some rider characteristics. For example, one vendor provides an infrared array
that measures objects’ relative distance to build a 3D image of the doorway. This allows for
monitoring in crowded conditions, distinction of passenger type based on height, and recognition of
objects such as bicycles and wheelchairs.
Cameras
Cameras create a 3D array that tracks people going in and out. They can track movement across wide
doors with multiple people moving in both directions. This can be useful for vehicles that have wide
doors, such as those operated on LRT, BRT, or subway services. Some cameras can detect information
about users, such as recognizing a wheelchair or someone boarding with a bicycle.
Camera-based systems tend to be more expensive, but the cost is often offset by the fact that a single
camera is required for a wider doorway where otherwise two or more sensors would be required.
Cameras also have a more difficult time counting passengers in low light settings. There are few transit
agencies that use these, especially in the US, creating some fear around the risk of using technology
TRB’s Transit Cooperative Research Program (TCRP) Synthesis 77: Passenger Counting Systems
(http://www.trb.org/Publications/Blurbs/160654.aspx).
APC and AFC technology white paper Page 14with a limited track record. Cameras have nevertheless been successfully implemented by some transit
agencies.
Ramps and bike rack
Knowing at which locations passengers boarded with a bike or a wheelchair can give planners a better
understanding of their riders’ needs. There are a several types of technology that can collect this
information. A connection to pre-wired onboard signals (if installed) is often sufficient. Some more
sophisticated APC units such as the infrared arrays and cameras may recognize bicycles and
wheelchairs as they pass through the door, as described above. For many agencies, it is specifically
useful to know when bike racks and wheelchair ramps are deployed.
Metro Transit (Minneapolis, MN) worked with a vendor to run a pilot installing bike rack sensors on
their buses. 5 Magnetic sensors were attached to each wheel arm and tray in Sportworks 6 two-place
bike racks. A wire travels through the bumper and connects to the radio cabinet and data is transmitted
with all other vehicle and passenger data. In some cases this data can be incorporated into the real-time
data feed for passenger-facing applications, providing riders with information about bike rack
availability or bus crowding.
Wheelchair lift/ramp operation sensors can record ramp usage for historical analysis and optimization
of schedules. Knowing which stations have more ramp deployments can also help prioritize stops for
ADA enhancements.
Passive Bluetooth-enabled device tracking
Bluetooth-enabled mobile devices that transmit a unique ID can be tracked to understand traveler
flows. With the installation of onboard bluetooth sensors, it is possible to passively track where
passengers board, alight, and transfer. In order to protect privacy, device IDs generally are not and
should not be attached to passenger identities. Since not all travelers carry bluetooth-enabled devices
or leave bluetooth turned on, this method tracks only a subset of travelers. Therefore, this method
would not meet thresholds for NTD reporting purposes, but could still provide useful data for planning
purposes. Total flows can be extrapolated through other datasets such as from APC. Some mobile
ticketing apps that utilize a passive bluetooth beacon as part of the validation process can provide
additional information such as ticket type.
Architecture
Here are two possible options for modular APC data architecture with benefits and drawbacks:
#1 Integrated with onboard AVL: Passenger count and AVL data is synthesized in an onboard
computer.
Disadvantages: It may be unclear which vendor is responsible for an APC failure. An ITS
integrator might not prioritize APC issues among other subsystems.
5
https://bit.ly/2K5DH8J
6
https://www.sportworks.com/about-sportworks/blog/integrating-bike-rack-usage-with-automated-passenger-counting
APC and AFC technology white paper Page 15Advantage: Less redundancy of systems
Backend systems GTFS data
(stops, trips, block)
Wireless
connectivity
Onboard computer /
sensor aggregator
GPS/AVL Fare collection / Bike rack
ticket validation
Door
open/close
Passenger
[On-vehicle components] counters
APC and AFC technology white paper Page 16#2 Stand-alone APC: APC device or system that may include its own CPU, GPS, and time tracking
system. A common wireless connection might be used, or each system may have its own wireless
connection.
Disadvantage: Redundancy of systems.
Advantage: An APC vendor might be able to provide better data and support since it is their
area of focus.
Backend software
AVL / Arrival Account APC data GTFS data
predictions system processing (stops, trips, block)
Wireless connectivity
GPS/AVL Bike rack sensor
Fare collection
/ ticket
Door open/close
sensors
[On-vehicle components] Passenger counters
From raw data to useful reports
There are a number of steps between the collection of raw data and the production of useful reports.
These steps may differ slightly depending on the type of APC system. In general, passenger count data
is collected by the sensor(s) along with GPS locations and time stamps onboard each vehicle. The
recorded data is offloaded, usually via a wireless connection, to a central server. At this point, the data
can be matched against the schedule (for example, a GTFS feed) to allow for reporting of ridership by
route, trip, stop, and many other criteria such as on-time performance.
APC and AFC technology white paper Page 17Raw data can be unwieldy. Various vendors that process raw data into useful reports. Some just offer
the software for analyzing raw data, while others also offer consulting support to utilize the data. The
data can lead to many types of reports, but in general agencies are interested in UPT, PMT, and on-
time performance split by some combination of system/route/stop and days of the week/time of day.
Fare collection
Fare collection and ticket validation systems (Automatic Fare Collection, or AFC) provide another
source of passenger data. These systems may provide some types of information that APC cannot
provide, such as:
● fare type (e.g. pass vs. single-ride)
● fare category (e.g. adult, senior, youth, low-income, disabled, etc.)
● fine-grained travel behavior, including origins, destinations, and transfers, also called ODX
(see below discussion)
Fare collection systems alone cannot count:
● Passengers that evade fares
● Alightings, since most fare collection systems collect data when passengers board, not when
they alight (for example, they require the passenger to “tap-on” only but not “tap-off”)
Fine-grained origin, destination, and transfer (ODX) and traveler flow data can be available from tap-
on/tap-off farecard systems, and by deriving destinations and transfers from data from tap-on only
systems. Destinations and transfers are derived through analysis of traveler behavior over the service
day. For example, the destination of an earlier outbound trip can be assumed to be the origin location
of a later return trip. Using this method, it is not possible to derive destinations for 100 percent of trips,
but it is possible to derive destinations for a majority of trips with sufficient confidence to study
traveler flows. With mobile apps, ODX accuracy can be enhanced if riders consent to GPS tracking for
active tickets, but this does cost the user battery power and some mobile OS’s now terminate
background applications that are consuming power.
A final project summary for the “TriMet Ridership and Effectiveness Analysis” prepared by IBI Group
and Trillium in June 2018 provides more information about this methodology and available tools. 7
APC vs AFC data
APC and AFC systems each provide different data for analysis. Their datasets can be analyzed
together to provide the most complete picture of traveler behavior and service utilization. The data
from the systems can be compared for validation purposes: to see if an APC system is correctly
7
To request a copy of the report, please email: aaron@trilliumtransit.com.
APC and AFC technology white paper Page 18calibrated and producing correct information, or to track fare evasion rates. 8 Schedule data, such as
GTFS, can also be used by APC and AFC systems to tie data to specific stops, routes and trips.
Manual surveys provide a different set of data that tends to focus in on a point in time and must be
extrapolated, but which can provide much more detail and context if transit riders are asked trip
purpose or demographic questions.
This table provides some of the differences between capabilities of APC and AFC:
APC AFC
Boardings by stop, trip, and route ✓ ✓
Alightings by stop, trip, and route ✓ ✓ *Only for fare systems that require
tap-off with fare media
Passenger trips by origin-destination ✓ *For fare systems that require tap-
off. In other cases, a destination of a
trip can be inferred through the
boarding stop on the subsequent trip.
Fare categories e.g. Adult, Senior, * Some APC can differentiate
✓
Youth between adults and children
based on height, or recognize
wheelchairs and bikes. Onboard
sensors can record when the
wheelchair ramp or bike racks
are used.
Transfer behavior i.e. tracking when ✓*only when fare media (i.e. unique
passengers alight and board another card ID) is tracked
vehicle
Anonymized individual travel behavior ✓* subject to anonymization and
patterns privacy practices
AFC data can also include other useful data APCs cannot capture such as:
● Ticket or pass purchase date
● Activation date
● Agency
● Purchase method
● Customer name or demographics (note that this represents sensitive personally identifiable
information or PII which needs to be carefully managed)
8
“Better boarding, better buses: streamlining boarding & fares” (https://nacto.org/wp-
content/uploads/2017/02/NACTO_Better-Buses_Boarding.pdf)
APC and AFC technology white paper Page 19Manual passenger survey methods
Many agencies employ a manual method of passenger counting with traffic checkers using pencil and
paper or hand-held units. Often a manual passenger count is also a good time to perform on-board
surveys to gather more information about riders. Although not every rider needs to be surveyed, every
rider should be counted to determine what percentage of riders were surveyed. Total ridership count
can also be used to weight collected data. 9
Many transit vehicle are equipped with security cameras that record activity at the vehicle doors.
Manual counts can also be conducted by reviewing and counting passengers using security camera
footage. Advantages of using security cameras include reduced commute time and complications for
staff, the ability to fast forward in between stops, and the ability to slow down footage at busy stops
that may otherwise be difficult to count accurately. This method does not allow the staff person to
conduct on-board surveys to gather additional information simultaneously.
ODOT is interested in using passenger surveys to supplement passenger count data. In particular,
ODOT is interested in the collection of rider characteristics (age, disability, veteran status, income,
etc.), trip purpose, and travel of choice if transit is not available.
More info about survey methods is available in the ODOT On-Board Passenger Survey Guide:
https://www.oregon.gov/ODOT/RPTD/RPTD%20Document%20Library/On-Board-Passenger-
Survey-Guide.docx.
9
ODOT On-Board Passenger Survey Guide
APC and AFC technology white paper Page 20This table compares what can be captured through automated versus manual methods:
Automated Data (APC/AFC) Manual On-board
Origin-Destination Survey
Sample Rate Continuous No set schedule
Population Sampled System-wide, capturing all vehicles Targeted corridors or full system; randomly
with APCs and/or all farecard users approached passengers who opt in
Trip Purpose Not available Yes
Travel Scope Origins and destinations are transit Includes full trip O/D (not just transit stops)
stops only. APCs do not connect and access/egress mode to transit stops.
boarding and alightings to a complete
passenger journey. AFC may not
include alightings.
Data Availability Can be near immediate. Depends on Within weeks of survey completion. Data
data transfer and analysis software. cleaning, weighting done manually.
Longitudinal Analysis Possible system wide Only possible for corridors with repeated
sampling
Demographic None, possible for AFC if the Captured
Information information is tied to farecard and
properly anonymized.
Uses of data
The data described above can be valuable for agency planning and tracking analysis. The major
published studies on fare data analysis fall into three categories, according to a literature review on the
subject in 2011 by Pelletier 10:
● Strategic planning (travel time analysis, demand forecasting, mode choice, user behavior, and
ridership profiles)
● Tactical planning (trip data, pattern behavior, service adjustments, origin-destination data,
journeys, and transfers)
● Operational tracking (revenue, crowding, provisioning better travel time and load information
to customers, and equipment performance and maintenance).
Data management - GTFS-ride
GTFS-ride is an open, fixed-route transit ridership data standard developed through a partnership
between the Oregon Department of Transportation and Oregon State University. GTFS-ride allows for
improved ridership data collection, storing, sharing, reporting, and analysis.
10
“Smart card data use in public transit: A literature review” by Marie-Pier Pelletiera; Martin Trépanier; Catherine
Morency. https://doi.org/10.1016/j.trc.2010.12.003
APC and AFC technology white paper Page 21This standard uses the required elements of GTFS and adds files necessary for ridership data
standardization and reporting. GTFS-ride allows transit agencies to share their ridership data with
other agencies and organizations interested in collecting and analyzing ridership data.
The GTFS-ride project plans to create open source software tools that provide immediate value for
transit providers that create GTFS-ride data. With these tools, planners can see how well transit
networks are functioning and also easily access specific information about where riders tend to board
and alight.
Specification: https://github.com/ODOT-PTS/GTFS-ride
Project Information: http://www.gtfs-ride.org/
Applications: http://webhub.gtfs-ride.org/
GTFS-ride tools will provide the following functionality:
● Validate GTFS-ride feeds
● Enter GTFS-ride feeds into a central data repository
● Create new GTFS-ride feeds
● Run analytics on ridership data contained within the data repository
○ Reports
■ Aggregate ridership
■ Performance report
■ Density report
○ Aggregation levels
■ System
■ Route
■ Stop
■ Trip
Case studies: Agency experiences with passenger counting
Seven agencies using APC technology were interviewed near the end of 2017. To make the case
studies as relevant to an Oregon context as possible, Oregon agencies with APCs already installed,
TriMet and Salem Cherriots, were included. Other agencies were chosen because they are not in major
metropolitan areas, to reflect most of the agencies in Oregon that may use this report.
Interviews inquired about the user experience and data reliability experienced by the various agencies,
as well as determining the operational and planning purposes for the data. When possible, agencies
also provided the cost of acquiring and maintaining the system. These cost estimates often did not
include internal staff time estimates.
APC and AFC technology white paper Page 22Agency profiles
Agency (Person Location Fleet Size* Vendor and technology
interviewed) timeline
Cherriots Salem, OR 64 buses 2011/2012: IR beam breaker
http://www.cherriot 2,999,022 annual UPT APCs. Buses do not currently
s.org/ APCs installed on about 80% of have an AVL or CAD system
(Ted - planner) transit and express service installed.
vehicles, not on regional buses.
Blacksburg Transit Blacksburg, 46 buses 2006 /2007: IR beam breaker
http://www.btransit VA 3,483,014 annual UPT APCs installed.
.org/index.aspx?pa APCs installed on all buses, but 2012: switched to a top beam
ge=791 sensor technology varies. array with a different vendor.
(Tim Witten - ITS Blacksburg uses a different
manager) vendor for ITS purposes
including AVL.
Lextran Lexington, KY 62 buses Contracts with a single
http://www.lextran. 3,783,730 annual UPT vendor for all ITS needs,
com/ including APC, AVL, and all
software and reporting.
CityBus Lafayette, IN 69 buses 2002: first APCs installed
http://www.gocityb 4,765,538 annual UPT Currently: contracts with a
us.com/ single vendor for all ITS
needs including APC, AVL,
and software. APCs are
infrared sensors, including
some of the newer matrix
arrays and some older IR
beam breakers.
Gainesville Gainesville, FL 128 buses 2011: installed APCs.
Regional Transit 9,698,179 annual UPT AVL is provided by a
System (GRTS) At the time of the interview, 56 different vendor. Other bus
http://go-rts.com/ buses had APCs installed. Ten sensors send data twice a
more were in line to have them minute on other bus features,
added soon. such as ramp deployment or
bike rack use.
LeeTran Lee County, 58 buses 2007: began installing APCs
http://www.leegov. FL 3,324,256 annual UPT 2012: all buses have
com/leetran Started with a 6 vehicle pilot, IR APCs
(Wayne Gaiter - now all vehicles have APCs Another vendor is used for
Principal Planner) other ITS options and
software.
TriMet Portland, OR 648 buses Mid 1990s: began installing
APC and AFC technology white paper Page 23https://trimet.org/ 59,982,440 annual UPT APCs
(Mike Gilligan - 143 light rail cars 2001: Contracted for APCs
IT) 40,198,185 annual UPT 2008: Same vendor
Older vehicles from 80s (light contracted for CAD/AVL
rail cars) do not have APCs; all
others do have them.
*Bus numbers are vehicles available for maximum service, per NTD 2016 agency profiles. Does not
include demand response.
User experience and data reliability
Cherriots
The APCs Cherriots have used have been very unreliable. When compared with manual
counts, the numbers do not fall within a margin of error. The technology tends to break
regularly, and counts drivers as they board and alight. The agency now uses farebox counters
instead.
Blacksburg Transit
The data from the APCs has not been good enough for NTD reporting. The biggest problem is
that certain stops have very large volumes of people boarding and alighting. The older beam
breakers did not work as well as the overhead arrays because of interference from the bus door.
The sensors are still shaken up from bus operations and need to be calibrated every few
months. Farebox data has generally been more reliable.
CityBus
Data has been reliable. The IR matrix array is much more accurate than the older beam
breakers.
GRTS
Data from APCs has been very useful, but unusable if buses stray from their regular routes.
LeeTran
The agency has been satisfied with APC accuracy. One vendor’s software has been more user
friendly, offers more canned reports, and is easier to use for data sharing with other
departments. However, the other vendor offers greater flexibility.
TriMet
Overall data is good however there are frequent bugs where sensors stop reporting data, bad
wiring switches boardings and alightings, or invalid numbers appear, for example if boarding
and alighting numbers do not match up. Maintaining good data requires regular spot-checking.
The schedule matching process often requires post processing for reports and does not work at
APC and AFC technology white paper Page 24all with light rail. An internal IT person was required to do this post processing and script
writing; the vendor did not provide it.
Use of data
Cherriots
Passenger counts are used to allocate stop amenities and to change stop spacing or to
consolidate stops. The data is included in an annual planning process along with data on
missing coverage, route frequencies, survey data, and complaints. Passenger data is also used
to respond to complaints.
Blacksburg Transit
The main use of passenger counts is to understand stop demand and make determinations
around stop amenities and locations as a result. For example, during a construction project,
stop demand helped inform whether stops were moved or eliminated and the level of outreach
necessary for different stops.
LexTran
Data is primarily used for NTD reporting.
CityBus
Passenger counts are mainly used for stop planning, and not as much for route planning. They
help determine stop amenities and when to move or eliminate stops. Data is also used for NTD
reporting.
GRTS
The most important use of passenger counts is NTD reporting. APC data is also pulled to
determine on-time performance, which is then coordinated with operations to alter route
timing. Passenger counts are used to advise notifications and temporary stops when the regular
routes have to be detoured during construction. Other sensors are helpful to prioritize stop
amenities, especially to support ADA access and access for elderly transit users. Bike sensors
help determine where to deploy buses with newer three-position bike racks.
LeeTran
The data is not used for NTD reporting because the process is too onerous for the fleet size.
APC data informs schedule adjustments, stop alterations, stop location changes, and route
alignment changes. New routes are sometimes run as pilots with APC data used to evaluate
them. The data is frequently shared with municipalities and other third parties.
APC and AFC technology white paper Page 25TriMet
APC data is used for NTD reporting. It is also used to help decide where to install bus shelters
and when certain routes are overloaded and need additional trips. On-time performance helps
schedule more appropriate dwell times.
Cost
Accurately assessing costs is complicated because prices vary based on fleet size and which services
are bundled together. Many agencies did not have cost information readily available. Cost descriptions
from two agencies are provided below.
Blacksburg Transit
The Infrared Matrix Array costs about $4,000 per bus to acquire and install. Software services
for interpreting APC data are about $1,000 per year.
The full package ITS device costs about $4,000 per bus with a license. Software services for
the ITS cost about $550 per vehicle per year.
LeeTran
The vendor charges $10,000 per year for maintenance, updates, and reports. If any amount is
not used for maintenance, it rolls over and can be used to purchase new equipment.
Future Plans and other notes
Cherriots
Cherriots is currently working on an ITS master plan that will replace APC devices in the next
year. The agency is working with a consultant to investigate APC options and AVL and CAD
options.
Blacksburg Transit
The fleet is transitioning to the IR matrix array sensors because of better data quality.
Blacksburg has some unique challenges because the overwhelming majority of transit users are
students, which creates atypical peak volumes. Students also show ID instead of tapping of
farecard, which complicates the use of farebox data.
Blacksburg Transit stores its own data and does its own analytics. This allows for much more
data flexibility. For example, all data can easily be made open and available to the public.
Blacksburg is also working on developing a load factor rating to warn riders if the bus is
getting full. However maintaining data and running analytics internally requires significant
staff time and knowledge.
APC and AFC technology white paper Page 26Ticketing & fare collection
A transit organization’s choice of electronic ticketing and fare collection systems creates consequences
and opportunities in various aspects:
Passenger experience / Ease of purchasing and using fares and transit pass products, including
Mobility-as-a-service across transportation services and payment instruments (e.g. farecards and
mobile apps). Payment systems that work across systems can support a more
seamless passenger experience, which is frequently referred to as mobility-
as-a-service 11.
Operational efficiency Reduced dwell times (for boarding) and reduced cost for cash management.
Equity Equal access to all passengers, especially unbanked and low-income riders.
Opportunities to analyze traveler behavior — see above on using Automatic
Fare Collection.
Flexibility for future The system allows new components (including from other vendors) to be
changes added in the future, to keep up with current technologies and agency and
customer needs.
This section discusses fare system features, components, choices, and benefits as relating to the above
aspects.
Purposes and benefits
Operational efficiency
Research shows that cash-based fare payment slows down transit operations as boarding customers
pay their fares. “Paying a bus fare the traditional way—at the front door, with cash or a farecard—is
time-consuming, taking nearly 5 seconds, and occasionally up to 9 seconds, per passenger. …As a
result, more rider and driver time is lost on the highest-ridership routes and systems, exactly where
transit should be performing best.” 12 On busier routes, “the time it takes for a bus to stop in order to
11
https://maas-alliance.eu/homepage/what-is-maas/
12
“Better boarding, better buses: streamlining boarding & fares” (https://nacto.org/wp-
content/uploads/2017/02/NACTO_Better-Buses_Boarding.pdf). Original citations are Exhibit 6-4, Transportation
Research Board (TRB), "Transit Cooperative Highway Research Program (TCRP) Report 165: Transit Capacity and
Quality of Service Manual (TCQSM), Third Edition," 2013. Accessed via: http://
onlinepubs.trb.org/onlinepubs/tcrp/tcrp_rpt_165ch-06.pdf
APTA, "Public Transportation Fact Book, Appendix B: Transit Agency and Urbanized Area Operating Statistics,"
April 2016. Accessed via: http://www.apta.com/resources/ statistics/Documents/FactBook/2016-APTA-Fact-
BookAppendix-B.xlsx
APC and AFC technology white paper Page 27load and unload passengers—called dwell time—can constitute up to a third of bus travel time.” 13 “On the 11 busiest Minneapolis Metro Transit bus corridors, 32 percent of travel time was spent stopped waiting for customers to board.” 14 Reducing dwell time associated with fare payment is most important on the busiest routes. Off-board fare collection and two-door boarding can reduce dwell time most substantially, but usually requires the most investment. In Oregon, off-board payment is only offered on TriMet’s MAX and Lane Transit District’s (LTD) EmX. 15 Even for lower ridership micro urban systems, dwell time for cash fare payment can add up. If boarding takes 9 seconds per passenger, and a route carries an average of 33 passengers per hour, then overall operating time could be reduced by five percent if boarding time is reduced to three seconds per passenger. Operating time can be improved more significantly when it matters most, during periods of peak ridership. Achieving speed improvements and operational efficiency gains depends on passengers adopting the farecard system; it is not sufficient merely to implement the system. This is why many agencies such as TriMet invest significantly in promoting a farecard system. Another aspect of improved operating efficiency is due to reduced driver responsibilities and distractions. Automated fare collection and passenger counting “reduced transit operator and rider interaction” [TCRP 125]. Agencies can also expect increased timeliness, accuracy, and equity in reconciling, allocating, and settling revenues to agency partners [TCRP 125]. Studies have shown that improvements to fare systems can lead to less concern over fare evasion and less instances of fare evasion [NACTO]. Despite initial investments, automated fare systems can even improve an agency’s bottom line. 16 Cash payment in particular is a source both of expected and unexpected delay, adding hidden costs in the form of longer scheduled dwell times and layover times.[NACTO] Discontinuing cash fare payment has saved Transport for London nearly £26 million annually.[NACTO] Overall, reducing dwell time related to fare payment can lead to more competitive travel times, reduced operating cost, greater reliability, and increased ridership. Equity Automatic fare collection allows transit agencies to institute fare capping. Fare-capping means that a passenger purchasing individual fares would not end up paying more than an unlimited ride pass for 13 “Better boarding, better buses: streamlining boarding & fares” (https://nacto.org/wp- content/uploads/2017/02/NACTO_Better-Buses_Boarding.pdf) 14 MetroTransit, "Arterial Transitway Corridors Study Summary," April 2012. Accessed via: www.metrotransit.org/Data/Sites/1/media/pdfs/atcs/atcs_ summary.pdf 15 https://www.oregonbusiness.com/article/item/18058-the-bus-is-back-eugene-expands-its-emerald-express-bus- rapid-transit-system 16 http://transitcenter.org/2016/11/16/weve-seen-the-future-of-transit-fares/ APC and AFC technology white paper Page 28
the same time-period. For example, if a monthly pass costs $100 and a single ride costs $2.50, a transit
rider would no longer have to pay for fares after riding 40 times ($2.50 * 40 = $100). Low-income
riders may not be able to afford the upfront cost of monthly or yearly passes or cannot justify the risk
of the purchase if they end up using the full value of the pass. As a result, they pay more for transit
than higher income riders do. Fare-capping makes the savings offered by transit passes available to
low-income riders. 17

Rider convenience
Use of mobile apps and fare cards can make paying for tickets easier and more convenient for riders.
In multiagency fare systems, riders benefit from the enhanced convenience of being able to use a
single fare instrument to access regional travel. 18

System Design
TCRP Report 117, Preliminary Strategic Analysis of Next Generation Fare Payment Systems for
Public Transportation, identifies four transit fare payment system design attributes 19. This illustration
is from the report:

     ● Transit system scope:
          ○ Single agency
          ○ Multiagency: a lead transit agency with partners, or regional authority.
     ● Design and technology:

17
   https://usa.streetsblog.org/2018/03/09/the-case-for-fare-capping/
18
   National Academies of Sciences, Engineering, and Medicine. 2017. TCRP Report 125: Multiagency Electronic
Fare Payment Systems. Washington, DC: The National Academies Press. https://doi.org/10.17226/24733.
19
   National Academies of Sciences, Engineering, and Medicine. 2015. TCRP Report 117: Preliminary Strategic
Analysis of Next Generation Fare Payment Systems for Public Transportation. Washington, DC: The National
Academies Press. https://www.nap.edu/read/22158/chapter/1

APC and AFC technology white paper                                                                    Page 29
○ Proprietary system or design: a transit fare payment system in which the design and
technology are developed and owned by a contracted manufacturer and sold or licensed
for use by a transit agency. Proprietary-design based systems tend to have a low level
of interoperability.
○ Standards-based system or design: a transit fare payment system in which the design
and technology follows public, non-proprietary standards and specifications
established for the financial payments industry. Well-managed standards-based
systems tend to have a high level of interoperability, and have been independently
tested to confirm compliance.
● Fare system architecture:
○ Card-based: a transit fare payment system in which fare value is carried on the fare
medium itself.
○ Account-based: a transit fare payment system in which the fare medium (such as a
card of virtual mobile wallet) serves as to associate the rider with information held in a
separate account. No fare value is carried on the fare medium itself.
● Payment architecture:
○ Closed payment (closed loop) system: a transit fare payment system that uses fare
media that can only be used within a single transit system or partnership of transit
systems. All proprietary fare payment systems are closed loop systems.
○ Open payment (open loop) system: an account-based transit fare payment system that
is able to accept third-party payment media such as bankcards and mobile device as its
fare media. All open payment systems are both standards- and account-based systems.
Example system - Hop Fastpass
In July 2017, TriMet, along with C-TRAN (Clark County, WA) and Portland Streetcar, launched Hop
Fastpass (i.e., “Hop”) as the Portland region’s first electronic transit fare payment system. Hop
Fastpass is a “Multiagency - Standards-based - Account-based - Open payment” system. This
combination offers the greatest potential flexibility for transit agencies and riders. The Hop system
also includes features such as:
● Open Application Programming Interfaces (APIs)
● Virtualized (mobile) fare cards, including stored value
● Fare Capping
Hop Fastpass provides a basis for a publicly-managed and operated payment platform for mobility-as-
a-service, in large part because the multiagency and open payment features would allow other modes
such as transportation network companies (TNCs) and bikeshare to be included in the system. Hop
could also support other transit services.
For more on Hop Fastpass, see “Lessons from TriMet’s Hop Fastpass”, an interview with Tim
McHugh and Rhyan Schaub.
APC and AFC technology white paper Page 30You can also read