Light Rail Transit in Hamilton: Health, Environmental and Economic Impact Analysis
←
→
Page content transcription
If your browser does not render page correctly, please read the page content below
Soc Indic Res
DOI 10.1007/s11205-012-0069-x

Light Rail Transit in Hamilton: Health, Environmental
and Economic Impact Analysis

P. Topalovic • J. Carter • M. Topalovic • G. Krantzberg

Accepted: 30 April 2012
 Springer Science+Business Media B.V. 2012

Abstract Hamilton’s historical roots as an electric, industrial and transportation-oriented
city provide it with a high potential for rapid transit, especially when combined with its
growing population, developing economy, redeveloping downtown core and its plans for
sustainable growth. This paper explores the health, environmental, social and economic
impacts of light rail transit, a component of the City of Hamilton’s rapid transit initiative. It
performs a comparative analysis with other major North American cities that have suc-
cessfully implemented this form of mass transit. The analysis concentrates on three main
areas: urban development and land values, health and environmental impact and socio-
economic factors. The results of the research on light rail transit (LRT) and its possible
benefits indicate overwhelming support for the economic, health, environmental and social
benefits of LRT, especially when compared to other forms of transit, including rapid bus
and local transit schemes. According to the results, LRT in a medium sized, growing city
such as Hamilton should be considered a viable and desirable transit option; a catalyst for
transit oriented, high density, mixed use development; an economically sound investment
opportunity, providing a return on investment to property owners, businesses and the
municipality; and a catalyst for social change, improving the health, environment and
connectivity of the community.

Keywords Light rail transit (LRT)  Rapid transit  Health  Quality of life
Environment  Land-use  Transportation  Planning  Economic development
Urban renewal  Revitalization  Smart growth  Municipal infrastructure  Public policy

P. Topalovic (&)
Center for Engineering and Public Policy, School of Engineering Practice, McMaster University,
1280 Main Street West, Hamilton, ON L8S 4K1, Canada
e-mail: topalopj@mcmaster.ca

P. Topalovic  M. Topalovic  G. Krantzberg
Center for Engineering and Public Policy, McMaster University, 1280 Main Street West,
Hamilton, ON L8S 4K1, Canada

J. Carter
School of Geography and Earth Sciences, McMaster University, 1280 Main Street West,
Hamilton, ON L8S 4K1, Canada

                                                                                          123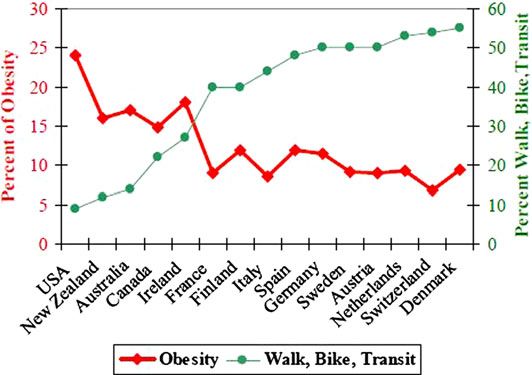
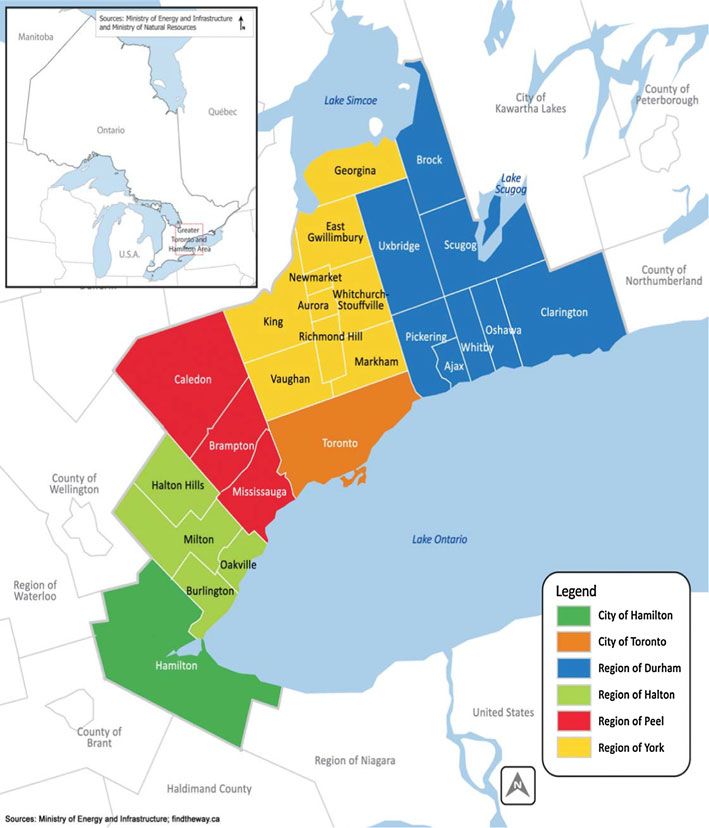
P. Topalovic et al.

1 Introduction and Background

1.1 LRT in North America

The first street car lines in North America were established in New York City during the
1830s (CUTA 2005). While most traditional streetcars ran within the flow of traffic, the
modern light rail car generally runs in a dedicated lane alongside auto lanes and bike lanes.
Light rail vehicle networks also incorporate transit priority traffic signals and a connection
of more than one light rail vehicle, to quickly and efficiently transport people across the
city. The first modern light rail vehicle network in North America was built in Edmonton,
Alberta in 1978 (CUTA 2005). Since then, cities across North America have adopted this
new technology with much fanfare and financial success. The most notable systems include
those in Portland, Oregon; Calgary, Alberta; San Francisco, California; Houston, Texas;
Minneapolis and St. Paul, Minnesota; and Charlotte, North Carolina (Fig. 1).

1.2 The Big Move and the Greater Toronto and Hamilton Area (GTHA)

In November 2008, the Province of Ontario released their Big Move plan; a $17.5 billion
plan for Rapid Transit and Active Transportation projects in the Greater Toronto and
Hamilton Area (GTHA). As Canada’s most densely populated metropolitan region, located
in southern Ontario, it has a combined population of 6 million people and is projected to
grow to 8.6 million by 2031 (Ministry of Energy and Infrastructure 2007). The 25 year
plan aims to develop a multi-modal and efficient transportation system for the entire region
which results in one-third of work commutes taken by transit, one in five commutes taken
by active forms of transportation and 60 % of trips to school made by walking or cycling.
This plan includes the identification of two City of Hamilton rapid transit corridors, which
allowed the City to begin seriously considering the design and implementation of a light
rail transit (LRT) system.

1.3 The City of Hamilton

1.3.1 Geography and Land Use

Located on the Niagara Peninsula in southern Ontario, the City of Hamilton is the ninth
largest city in Canada, stretching over 1,100 square kilometres and housing more than
500,000 residents (Statistics Canada 2006). Hamilton, like many other cities in North
America, has experienced the impacts of urban sprawl; the process of excessive population
decentralization from the urban core into low-density developments (Behan et al. 2008). This
reaction to population growth has been associated closely with economic stability and rising
household incomes following World War II, coupled with the accessibility and popularity of
the automobile (Bruegmann 2005). Traditionally, Canadian neighbourhoods such as those
found in Hamilton’s inner core, were often characterized by mixed land-uses, higher pop-
ulation densities, and short block lengths. However, recent residential developments within
Hamilton have primarily been low-density, semi-detached homes located on large lots
outside of the urban core (Behan et al. 2008). These neighbourhoods are predominantly
found to contain stretched out blocks, single-use residential areas and sparse transit con-
nectivity to goods and services. Such characteristics have been found to be detrimental to the
walkability of neighbourhoods (Saelens et al. 2003; Townshend and Lake 2009).

123
Light Rail Transit in Hamilton

Fig. 1 Greater Toronto and Hamilton Area (Metrolinx 2009)

   In addition to Hamilton’s sprawling neighbourhoods, other challenges to the connec-
tivity and economic stability of the urban core include the geography of the area. Ontario’s
Niagara Escarpment, a massive ridge of sedimentary rock which stretches 725 km east-to-
west and reaching 510 m at it’s highest point, houses many of Hamilton’s suburban
neighbourhoods, acting as a physical barrier to walkability and transit connectivity to the
urban core (Niagara Escarpment Commission 2011).

1.3.2 Community Health Profile of Hamilton

Statistics Canada measures well-being through perceived health and perceived mental
health, based on the population over age 12 who report their own health status as being

                                                                                 123
P. Topalovic et al. very good or excellent (Statistics Canada 2010a). Health includes the absence of disease and injury as well as physical, mental and social well being. Well-being is also measured through perceived life stress (Statistics Canada 2010a). Hamiltonians perceive their health and life stress to be better than people in similar cities, Ontario and Canada; however the level of perceived mental health is lower in Hamilton (Statistics Canada 2010a). Although this data is self-reported, it is still valid; in order to be healthy, a person needs to perceive him or herself as being healthy. The levels of overweight and obesity are based on body mass index (BMI), where a BMI of 25.00–29.99 indicates overweight and a BMI greater than 30.00 indicates obese (Statistics Canada 2010a). The levels of overweight and obesity in Hamilton are higher than levels in similar cities, Ontario and Canada, with only half of the population reporting themselves as being moderately active or active. Obesity has increasingly become a greater public health concern; therefore revitalizing the built environment to provide more options for active living can help address the high obesity levels in Hamilton. The percentage of low-income families after tax in Hamilton (18.1 %) was found to be higher than the provincial (14.7 %) and national (15.3 %) averages (Statistics Canada 2005). Sprawl growth patterns and lack of transit connectivity have been suggested as possible reasons for this statistical difference. A study which investigated wealth disparity in Hamilton and its impacts called ‘‘Code Red’’, analyzed Statistics Canada data to reveal lower life expectancy in neighborhoods with lower median house- hold incomes, suggesting a connection between health and poverty (Buist 2010). 1.4 Purpose of the Study Hamilton’s historical roots as an electric, industrial and transportation-oriented city make it a region well suited for rapid transit, especially when coupled with its growing population, developing economy, redeveloping downtown core and progressive sustainable vision (IBI 2009a, b). This paper explores the potential health, environmental, social and economic impacts of light rail in Hamilton, Ontario and performs a comparative analysis with other major North American cities that have successfully implemented the technology. The analysis concentrates on health, environmental, social and economic impacts but also notes other key impact areas of urban development and land value effects. All of these factors contribute to a city’s quality of life and therefore to the city’s health, environmental, social and economic sustainability. Strategies that improve quality of life, such as rapid transit and land use policies, will help provide solutions to issues facing North American cities today such as obesity, poverty and sustainability (Frank et al. 2007). 2 Literature Review 2.1 Urban Development and LRT LRT as a strategy for implementing a rapid transit system in an urban environment can have an effect on urban growth, land use, intensification and revitalization (Cervero 1984; Cervero and Sullivan 2011; Crampton 2003; Filion and McSpurren 2007; Geller 2003; Handy 2005; Litman 2011; Marstens 2006). The impacts LRT has on land use and development are not accidental (Handy 2005). Significant impacts and stimulated eco- nomic benefits only occur when a system is planned with policies and complementary land-use strategies in place (Cervero 1984). Positive development impacts of LRT systems are restricted to regions that are rapidly growing and have a healthy underlying demand for 123
Light Rail Transit in Hamilton

high density, mixed-use development (Handy 2005). When station locations are in areas
where the existing surrounding land uses and policies are conducive to high-density
development they can have positive impacts to quality of life (Handy 2005).
    Transit oriented developments (TODs) are typically those that mix residential and
commercial land uses in a way that improves access to transit and cycling infrastructure.
Growth policies that are conducive to the development of walkable, mixed-use devel-
opments are conditions that need to be in place for improving quality of life with rapid
transit investments (Litman 2011). As a relatively permanent investment along a fixed
corridor, LRT can encourage urban development in the city centre and declining areas,
change the pattern of urban development, affect land uses, and increase nearby property
values. It can also help strengthen development in existing neighbourhoods, rejuvenate
declining areas and attract new clusters of development around station sites (Cervero
1984).
    Development investments influenced by the implementation of an LRT system can
include the creation of new housing, offices, services, and shops. Cities who have suc-
cessfully implemented LRT systems have reported an increase in shopping commerce
generated adjacent to the transit line, development of new residential and commercial areas
and increased employment nodes, as was the case with LRT development in San Diego
(Crampton 2003). Although urban development has been reported around many imple-
mented LRT lines, a 1995 report from the Transit Cooperative Research Program (TCRP)
concluded that rail transit may not actually create new growth but simply redistribute
growth that would have otherwise taken place elsewhere without the transit investment
(Handy 2005). However, LRT systems consistently influence and direct where and what
kind of growth will take place (Cervero 1984).
    Investment in LRT also has the potential to revitalize declining downtown cores (HDR
2005). For example, Portland’s Central Business District was a typical declining downtown
with office vacancy rates rising and retail centres fading. However, when their light rail
system, MAX, was implemented, downtown office vacancy rates declined to levels below
those of suburban office parks; there was an increase in rents; and the development of an
attractive retail hub in the downtown. In fact, Portland has seen over $2 billion of
development surrounding the downtown station areas (HDR 2005). Dallas and Denver
experienced similar success stories. With the introduction of Dallas Area Rapid Transit
(DART), Dallas has experienced over $1.3 billion in development, while Denver’s Lower
Downtown (LoDo) has been recognized as one of the United States’ most successful new
urban neighbourhoods with the implementation of LRT (Geller 2003).
    The ability to develop the land and the physical suitability of the land around stations
influence positive land use changes and should be taken into consideration when align-
ments and corridors are chosen. Issues have arisen when corridors were chosen to mini-
mize construction costs instead of maximizing the potential for development (Handy
2005). During corridor selection, although there may be industrial areas or open land in
need of redevelopment, there must be adequate economic drive to do so. Many new light
rail systems have been designed to service existing development and may consequently
limit the net gain of development (Handy 2005). Therefore the impact of light rail transit
on accessibility must be taken into consideration. The effect of accessibility can either help
increase ridership, therefore serving as a catalyst for redevelopment in selected areas, or it
may simply mean a redistribution of development rather than a net economic gain for the
city. Finally, a LRT system will likely only influence changes in land use if it adds
significantly to the accessibility, both geographically and economically, that is already
provided by the roadway system (Handy 2005).

                                                                                   123
P. Topalovic et al.
The strongest development potential of light rail is in the downtown, especially when
paired with the use of increased density/development incentives and policies restricting
parking supply; all as a redevelopment effort (Handy 2005). An example of this is the
success of Calgary’s LRT system, the C-Train. The project was implemented as a tool to
encourage intensification of densities and land use development along their chosen cor-
ridors. The C-Train has contributed significant benefits to the city’s urban form, especially
in the downtown, partly due to their commitment to the consolidation of land use, roadway
and transit planning (Charles et al. 2006). Calgary adopted a policy that limited not only
the amount but also the location of downtown parking. The development took place on
most of their former surface parking lots in the downtown. They combined limited
roadway capacity and high priced, long stay parking rates in order to encourage travel via
transit (Charles et al. 2006). Calgary’s successful light rail system is due partly to their
vision of an integrated policy solution and existing economic complementary forces
(Hubbell and Colquhoun 2006).
LRT is not the development ‘‘silver-bullet’’ but it is an important tool in encouraging
smart growth. Without an appropriate, transit oriented policy context and urban environ-
ment development, revitalization, intensification and investments are unlikely. However,
even with these conditions fulfilled the desired development and densities are not guar-
anteed (Handy 2005). The smart growth strategy that can foster successful implementation
of rapid transit projects is also important for improving quality of life, health and envi-
ronmental sustainability, as this development pattern encourages walking, cycling and
improves access to transit (Frank et al. 2007).
2.2 Land Values and Light Rail Transit
The evidence shows that there is a strong positive connection between LRT and land
values, even in the pre-construction phase of the transit system. Proximity to transit nodes,
smart growth, TOD and property tax levels all affect the benefits that light rail can provide.
Data from land value sales in Washington County, Oregon indicate that high-density TOD
is favoured at planned, future LRT station sites over low density housing (Knapp et al.
2001). This gives some proof to the fact that planning can be used to influence land
development and thereby influence land values before any tracks are actually laid. While
those against high-density developments site issues such as increased pedestrian traffic and
crime, the positive benefits such as increased accessibility and decreased congestion out-
weigh the negatives (Knapp et al. 2001). Further evidence shows that plans for LRT can
increase land values and discourage low-density development that does not make effective
use of the station nodes.
Many studies (Hess and Almeida 2007) indicate that land values increase at LRT station
nodes as early as 1 year before station construction or approximately 3 years after station
plans are announced. Plans for LRT can also assist in the coordination of public and private
investments, which can improve social welfare with increased investment and direct
spending into dedicated transportation infrastructure (Knapp et al. 2001). Not only does
LRT planning organize the type and nature of development along corridors, it also
intensifies development at nodes to promote smart growth rather than sprawl, which in turn
provides associated health benefits (Frank et al. 2007). This would reduce the need for
infrastructure at the far reaches of the urban boundary and make more effective use of
infrastructure in the core of the city. In an analysis of transit and health impacts, tools that
aid in the reduction of sprawl growth in cities can have positive health impacts (Frank et al.
2007). Smart growth along these corridors also supports walkable neighborhoods, which
123Light Rail Transit in Hamilton
provide incentives for people to choose walking as a form of transport. Walking to and
from LRT station nodes can help people meet the 60 min of required daily physical
activity, recommended to be met incrementally throughout the day by Canada’s physical
activity guide (Public Health Agency of Canada 2007).
A study of the Dallas Area Rapid Transit (DART) system in 1999 found that the value
added premium for retail spaces near stations is 30 % over spaces located further away
from station nodes (Cervero and Duncan 2002). Another study of a light rail system linking
Silicon Valley in Santa Clara County, California, found that development around transit
nodes was higher than in other areas; these developments included housing, office building
complexes and commercial floor space. This transit-oriented development was accompa-
nied by incentives such as tax-exemptions, public assistance with land assembly and
rezoning permits for higher than normal densities (Cervero and Duncan 2002). In the
downtown core of San Jose, commercial properties in proximity to LRT stations were
worth $19/ft2 ($203/m2) more than other properties. The study also found that proximity to
a rail corridor without nearby access to a station might have little benefit (Cervero and
Duncan 2002).
On the other hand, some researchers (Chen et al. 1998) have theorized that proximity to
a light rail line will negatively or ambiguously impact property values because of nuisance
effects such as noise and vibrations (Cervero and Duncan 2002). However, studies con-
ducted in Portland, Oregon and San Francisco, California (Brinckerhoff 2001) indicate that
these effects did not impact land values for modern light rail systems. Older commuter
trains, such as the GO train heavy rail in the GTHA do have some nuisance effects because
of their larger size and long-range travel capabilities, especially at stations in areas of lower
economic status (Brinckerhoff 2001; Hess and Almeida 2007). Furthermore, the economic
state of the region, accessibility to other major regions and the land market also affect light
rail’s feasibility.
Light rail, as a tool for improved TOD, aids in municipal and regional transportation
demand management efforts, including reduction of car travel trips and increased transit
ridership. Business and commercial interests benefit from increased access to employees
and customers due to accessible transit nodes. These high people-traffic nodes have the
potential for larger revenues than areas that are not transit connected. Private developers
and landowners may also see transit developments as potential for investment profits
(Cervero and Sullivan 2011). In addition, all levels of government benefit from reduced
health care costs decreased green house gas emissions and increased development and tax
base. For example, current estimates of the costs of physical inactivity and obesity in
Canada are $5.3 billion1 and $4.3 billion2 in health care expenditures, respectively (CFLRI
2005).
Evidence for the benefits of light rail development can be seen in the trend for transit
authorities to aggressively purchase areas around potential transit nodes. In 1999 the
Washington Metropolitan Area Transit Authority (WMATA)’s long-term lease arrange-
ments near transit nodes, 24 joint development projects, generated $6 million in annual
income. According to Cervero and Duncan (2002), these value-added benefits can be
captured by the municipality in property taxes. It is fairly evident that all the stakeholders
in a transit project stand to benefit financially, socially, and environmentally. These ben-
efits are tied to connectivity and accessibility, which comes from station access and travel-
time savings. Fixed track systems such as light rail have the largest benefit, especially over
1
$1.6 billion in direct costs and $3.7 billion in indirect costs (CFLRI 2005).
2
$1.6 billion in direct costs and $2.7 billion of indirect costs (CFLRI 2005).
123P. Topalovic et al.
bus rapid transit, because they typically do not travel in traffic and operate similar to heavy
rail at road crossings (Cervero and Duncan 2002).
It is important to note that a number of studies have concluded that LRT has had little or
no effect on land values and property taxes. While these studies are in the minority, it is
important to ensure that regions investigating transit as a catalyst for improved quality of
life take into consideration a variety factors in addition to land values, in determining the
success of its light rail transit system. Land values, quality of life, environmental sus-
tainability and population health are related (Frank et al. 2007; Williams and Wright 2007).
When there is a financial benefit to encourage transit oriented developments, health
impacts can be realized by promoting the business case for undertaking large infrastructure
projects (Frumkin 2002).
2.3 Light Rail and Its Effect on Health and Environment
2.3.1 LRT and Obesity
Recently, studies linking obesity with health care costs have established a direct link
between these two measures. The World Health Organization (WHO) estimates that, where
obesity-related diseases are concerned, ‘‘80 % of cardiovascular diseases and type 2 dia-
betes and 40 % of cancers could be avoided if major risk factors associated with the
environment, were eliminated’’ (Metcalfe and Higgins 2009). Public health officials regard
the increase in ‘‘chronic disease rates associated with physical inactivity, sedentary life-
styles, overweight and obesity’’ as an ‘‘epidemic’’ (Williams and Wright 2007). The cost of
direct health expenses as a result of obesity in the United States is estimated to be $75
billion dollars (Finkelstein et al. 2003). When taking into account indirect expenses such as
treatment of chronic diseases and loss of work time, the number raises to $1 trillion
(Adams and Corrigan 2003).
Modifications to the built environment are predicted to be an important enabler in
decreasing dependence on the automobile and increasing physical activity. The availability
of integrated public transportation systems is a key component in reducing automobile
dependence and providing more opportunity for physical exercise, such as walking or
biking to work (Stokes et al. 2008; Crowley et al. 2009; Kitchen et al. 2011). These trends
are commonplace in some European cities where a dense, transit-oriented city design
encourages active transportation including walking, biking and transit use; resulting in
lower obesity rates and health issues compared to North American cities (Fig. 2). Recently
in some North American centres such as Charlotte, North Carolina and Calgary, Alberta, a
move to mixed-use residential and commercial development is becoming commonplace.
Light rail transit is not just a component of this new urbanism approach to planning; it has
the ability to support this development by promoting intensification and pedestrian friendly
streetscape design (Stokes et al. 2008).
According to research estimating the effect of LRT on health care costs (Stokes et al.
2008), LRT plays a part in decreasing these costs. The study measured the increase in
activity rates that will occur near transit-oriented developments. When people choose rapid
transit over the use of single occupancy vehicles, they walk an average of 30 min more a
day than those who drive their car. Therefore, through modelling it was determined that the
increased activity level amongst transit users would save $12.6 million in the first 9 years
of the city of Charlotte, North Carolina’s operation of its LRT system (Stokes et al. 2008).
Research conducted by Kelly-Schwartz et al. (2004), found a correlation between urban
sprawl and occurrence of illness related to sedentary lifestyle for those living further from
123Light Rail Transit in Hamilton
Fig. 2 Percent of Obesity compared to Percent of walking, cycling and transit (Bassett et al. 2008)
the urban centre, dependent on car travel (Frank et al. 2007). Craig et al. (2002) found that
urban design elements, which encourage walkable neighbourhoods, have an effect on
whether people walk to work. Frank et al. (2004) compared obesity rates to car travel hours
and found that for each additional hour spent in a car per day correlated to a 6 % increase
in the probability of being obese. Alternatively, each additional kilometre walked each day
was found to reduce the odds of being obese by almost 5 %. Mixed land use, transit
oriented development and urban designs encouraging walkability are believed to be key
tools in decreasing obesity and increasing transit use. When comparing light rail and other
rapid transit systems to local bus service, it was found that the best complement to an
intensified land use mix was light rail and bus rapid transit. This can be attributed to a
slightly larger distance between stops, which encourages more walking and the connec-
tivity of the system which encourages more drivers to leave their cars at home in favour of
transit (Stokes et al. 2008).
2.3.2 LRT and Air Pollution
Air pollution has become a growing concern for municipalities across North America.
Many sources contribute to poor air quality in the municipality including those from the
industrial, residential and commercial sectors. Transportation sources of air pollution are
responsible for 35 % of the overall toxins emitted. These toxins are partially to blame for
increased cases of cardiovascular and respiratory illnesses, which have social and eco-
nomic costs for the region. Other diseases such as certain cancers and asthma are also
believed to be affected by air pollution (McKeown 2007).
Mobile air monitoring data supports that the greater amount of time spent in the car, the
greater the exposure to toxins at higher than normal concentrations (McKeown 2007). The
data indicates that particulate matter and other toxins are in their highest concentrations
along roadways and intersections than anywhere else in a typical city. This indicates that
transportation traffic in the city contributes as much or more significantly to air pollution
than surrounding industry does; and these emissions are directly related to acute and
chronic heart disease (Clean Air Hamilton 2008).
123P. Topalovic et al.
Table 1 The illness costs of air
2005 2015 2026
pollution in Ontario (in dollars
per year)
Premature deaths 5,829 7,436 10,061
Hospital admissions 16,807 20,067 24,587
Emergency room visits 59,696 71,548 87,963
Minor illnesses 29,292,100 31,962,200 38,549,300
OMA (2000), CMA (2008)
Table 2 Air pollution costs
Urban Rural
from automobiles in dollars per
tonne, per year
Carbon monoxide (CO) 435 0
Nitrogen oxides (NOx) 15,419 8,789
Volatile organic compounds (VOC) 14,419 11,823
Particulate matter (PM) 5,346 2,620
Carbon dioxide (CO2) 18.13 18.13
VTPI (2007)
The Ontario Medical Association, municipalities in the Greater Toronto and, non-
governmental organizations have attempted to assess the cost of air pollution in terms of
health and economics (Grossman et al. 2009). Traffic pollution alone has been a significant
contributing factor in 1,200 acute bronchitis cases, 68,000 asthma symptom day cases,
67,000 acute respiratory symptom cases, and 200,000 restricted activity days in Toronto
alone. These cases are estimated to cost Toronto area taxpayers $2.2 billion in mortality-
related issues. A 30–50 % reduction in car traffic can help lower emission rates and save
200 lives and $900 million per year (McKeown 2007). According to the Toronto Com-
munity Foundation (2010), congestion in Toronto costs the Canadian economy over $5
billion per year and the Toronto Transit Commission will require expansion in order to
accommodate a projected 175 million new riders by 2021.
According to the Ontario Medical Association (2000), the health care, lost productivity
and mortality costs of air pollution, assuming current emission levels, will total $1 billion
in the province by 2026. The annual economic costs are broken down in Table 1 and are
projected to grow in the future if air pollution is not reduced in the province. The total costs
of air pollution from transportation sources, which include health costs, are broken down in
Table 2. The US Federal Highway Allocation Study (FHWA 2000) investigated trans-
portation air pollution related health care costs and found that for major US cities, the costs
ranged from $100 million to $1 billion per year. These external costs are not covered by the
motorist directly; instead, the province, municipality and sick population bear the burden
of transportation’s health and financial externalities (Filliger and Schneider 1999).
LRT has a major role to play in reducing the costs of air pollution due to transportation
sources. Its ability to carry a large number of passengers, reduce congestion and increase
accessibility makes it a lucrative tool for reducing pollution. However, the largest benefit
of LRT over local transit is that it is an integral component of TOD, mixed-use land
development policies and walkable cityscape designs. When considered as an independent
variable, local transit can reduce total vehicle use by 2–12 %. However, LRT as an integral
component of transportation planning, commute trip reduction, smart growth policy and
parking management (since it can reduce the need for parking lots), may be able to reduce
total vehicle use by 18–58 % (Litman 2007). According to Cervero and Duncan (2002),
buses cannot achieve these same results because of the lack of fixed infrastructure, timely
123Light Rail Transit in Hamilton
Table 3 Strategies to reduce vehicle use and minimize health impact
Policy option Description Reduction in total
vehicle use (%)
Transportation planning Adoption of options that consider all direct and 10–20
indirect costs and benefits
Mobility management Local transportation demand management (TDM) 4–8
programs programs that support and encourage
use of alternative modes
Commuter trip reduction Programs by employers to promote alternative 1–3
commuting options
Fuel taxes—tax shifting Increases fuel taxes and other vehicle taxes 5–15
Parking management More efficient use of parking facilities 2–8
Parking pricing Direct charges for using parking facilities, 3–10
with rates that may vary by location
Transit and rideshare Enhances public transit and car-sharing services 2–12
improvements
Smart growth policies More accessible, multi-modal land use 3–15
development patterns
VTPI (2007)
operation and appeal as a viable transportation option. Table 3 describes the variety of
policy options and their ability to reduce vehicle use and thereby decrease the costs of
health care and improve the health of citizens in the municipality.
2.3.3 LRT, Environment and Climate Change
Auto emissions have a significant effect on air, water and soil quality. In 2001 the
transportation industry emitted 720 million tons of CO2 and other greenhouse gasses. This
accounts for 20 % of the total greenhouse gas emissions produced worldwide; which is a
significant amount given that the cost of gasoline-based externalities, in terms of climate
change, is $3.37 to $30 billion world wide). Transit vehicles in Canada account for only
0.3 % of total green house gas emissions (VTPI 2007).
Ecosystems and storm water management are another major consideration in the
analysis of climate change impacts and transportation. Urban sprawl, which includes car-
dependent residential developments, impacts storm water management systems and eco-
systems. Auto dependent communities require 20–50 times more space than transit-based
communities. This requires 66–80 % of the land be devoted to roads and parking facilities
(VTPI 2007). Pavement deflects water to storm sewers during storm surges which puts a
large burden on the system and results in excess runoff. Runoff water needs to be treated or
stored prior to going back into the water system incurring high operating costs. Storm
water sewers, management ponds and other infrastructure need consistent maintenance,
which directly draws from the property tax base (City of Hamilton 2007a).
As climate change effects become more pronounced, the need for increased storage and
management facilities will continue to rise. Natural, unpaved areas can help meet these
needs and do not result in the associated costs of pavement. If the effects of pavement and
storm water are not mitigated, this could have a severe impact on the surrounding eco-
system, especially when coupled with air and land emissions from transportation. Runoff
can carry large amounts of pollutants to the surrounding natural areas, which can harm
123P. Topalovic et al.
plant and animal life. Furthermore, transportation pollutants such as ozone, a major
component of smog, can reduce agricultural yields at high concentrations and cause
negative health effects for humans and animals. It is estimated that increased ozone
concentrations cost European farmers $7.5 billion in reduced yields (Chanon 2006).
The environmental, social and economic benefits of LRT are realized by the fact that
LRT emits less greenhouse gasses, requires less pavement (or no pavement if tracks are
placed on semi-permeable surfaces) and lessens a household’s dependence on automobiles,
especially in sprawl areas. This helps to mitigate the costs and negative externalities that
are imposed on the surrounding ecosystem, which help households reduce the 17–22 % of
their income that goes to transportation costs associated with automobile dependency
(VTPI 2008).
3 The Potential Impacts of LRT in Hamilton: A Case Study
Over 175 Hamilton Street Railway (HSR) public transit buses are on the road everyday that
serve 21 million passengers per year, or 50 rides per person per year (IBI 2009a). Ham-
ilton’s Transportation Master Plan sets a target for 2031, to reduce auto vehicle-km by
20 % (IBI 2009a). To achieve these targets, the HSR would have to double service hours
and add 10–15 buses per year until 2021 (IBI 2009a). Systems in Canada that have
achieved this goal currently use some form of rapid transit—Ottawa, Toronto and
Montreal.
In 2011, the City of Hamilton completed a Preliminary Design and Engineering (PDE)
plan for a Light Rail Transit System along the B-Line Corridor from McMaster University
to Eastgate Square on Main and King Streets, and the A-Line corridor from the Downtown
Core to the Hamilton International Airport along James Street and Upper James Street. In
order to analyze the potential benefits of an LRT system in the City of Hamilton, scholarly
analyses and statistics are used to compare the successes and failures of projects across
North America to the specific Hamilton case.
3.1 Urban Development and Land Value Impacts
A study conducted by IBI Group in 2009b found that across the specified Rapid Transit
B-Line Corridor from McMaster University to Eastgate Square on Main and King Streets,
the density is at 25 persons plus jobs per hectare, compared to the Downtown Core’s
density of 200 persons plus jobs per hectare. In terms of developable land, there are 500
vacant parcels and numerous low-density land uses such as surface parking lots, within a
2-km radius of the corridor. The potential for increased density creates a development
environment that favours dense, transit-supportive infill developments built for a low cost,
as compared to a corridor that is already heavily built out. The development charges
associated with these developments would be in the order of hundreds of millions of
dollars; these charges could be used by the City to expand transit development and supply
municipal infrastructure for the corridor (IBI 2009b).
Commercial and residential TOD that occurs in the vicinity of transit nodes can benefit
the city by increasing land value. The increased access provided by LRT will make nodes a
lucrative and valuable place to do business and it may also attract residents to areas along
the transportation corridor, including the downtown core. These high value land parcels, in
turn, will produce additional property taxes for the municipality by helping to pay for the
capital and operating costs of the system (Cervero and Duncan 2002). The Economic
123Light Rail Transit in Hamilton
Potential Study (IBI 2009b) found that the development of LRT, coupled with supportive
land uses and increased density, would result in an increase in jobs per hectare and an
increase in residential units along the corridor. Land values are projected to increase
between 5 and 15 % at major hubs such as McMaster University and the Downtown Core,
whereas in other areas along the corridor more modest increases between 3 and 8 % could
be realized (IBI 2009b). Commercial property values followed the same trend in the
analysis with increases in land values of 5–15 % within 400 m of an LRT station and
3–8 % in other areas of the corridor (IBI 2009b). Taking into account operating costs,
revenues, land values, job creation, environmental and health benefits, the study concluded
that the construction of the B-Line in Hamilton would have a net present value of over $1-
billion in benefits (IBI 2009b).
While many of the case studies discussed involve West Coast cities, another interesting
case is that of the city of Buffalo, New York. Buffalo has experienced decreasing ridership
on its light rail line, installed in the 1980s, making it one of the few North American cities
to adopt LRT and experience a decline. While Buffalo and Hamilton share commonalities
such as being major manufacturing centres, they differ in some key aspects. Buffalo has
experienced a worsening economic situation and dwindling population, which has heavily
impacted their light rail system (Hess and Almeida 2007). Hamilton, on the other hand, is
projected to have a steadily increasing population along with a steady stream of downtown
core developments, development of airport lands and increasing property values, which set
it apart from Buffalo (Hamilton Economic Summit 2010).
According to the Economic Impact Analysis (IBI 2009b, p. 2): 17 % of the City’s
population and 20 % of the City’s employment are within 800 m of the B-Line corridor,
while 80 % of HSR local transit system routes connect to the B-Line corridor. Given this
data Hamilton residents have a high chance of benefiting from rapid transit travel time
savings, increased travel time predictability and potentially reduced auto ownership and
operating costs.
3.1.1 Ridership and Congestion
Research presented in this analysis indicates that light rail and TOD increase access to
municipal, commercial and employment areas. A well-planned and convenient transit
system has the ability to attract new ridership through improved accessibility. This
expanded source of income can help fund the day-to-day operation of the system and
sustain future upgrades and maintenance. The Santa Clara Valley Transit Authority
(SCVTA) increased ridership by 136 % between 1980 and 2000 during a high period of
growth in their transit system and in response to a large amount of congestion along major
roadways in the region (Cervero and Duncan 2002). In Minnesota, ridership on the Hia-
watha light rail line operates at double the expected ridership and 40 % of those riders are
new to public transit, which exemplifies the popularity and accessibility associated with the
technology (Delancey et al. 2005). According to Litman (2005), transportation systems
with higher levels of transit ridership have lower operating costs, higher cost recovery rates
and contribute to a municipality’s lower transportation infrastructure costs, as compared to
automobile dependent communities. Many transit-operating costs are generally fixed;
therefore an increase in ridership can help fund system expansion, increase service fre-
quency, and expand system coverage and integration (VTPI 2007).
In the next 10 years, Hamilton’s population is projected to grow and congestion along
major roadways will continue to develop if transit improvements do not evolve to
accommodate new ridership. While traditional bus transit could help to accommodate a
123P. Topalovic et al.
Table 4 Potential vehicle cost savings
Category Description Typical values
Vehicle operating Fuel, oil and tire wear 10–15¢ per vehicle-mile. Higher
costs under congested conditions
Long-term Mileage-related depreciation, mileage lease fees, 10¢ per vehicle-mile
mileage-related user costs from crashes and tickets
costs
Special costs Tolls, parking fees, parking cash out, insurance Varies
Vehicle Reductions in fixed vehicle costs $3,000 per vehicle-year
ownership
Residential Reductions in residential parking costs due to $100–1,200 per vehicle-year
parking reduced vehicle ownership
VTPI (2007)
larger population, the City of Minnesota’s modeling and planning indicated that the
additional busses required to accommodate improved service would contribute to con-
gestion issues and not solve the problem (City of Minnesota Staff, personal communica-
tion, July 30, 2008; Delancey et al. 2005). This concurs with the IBI report (2009a) that
suggests Hamilton local transit will need to double in capacity and service in order to meet
a growing population. According to the Victoria Transportation Policy Institute (2007),
reducing congested roadway traffic volumes by small percentages can significantly reduce
delays (i.e. a 5 % reduction in traffic congestion translates to 10–30 % in reduced delays).
Related research shows that increasing road widths or adding roads does not solve issues
with congestion because there usually exists a latent demand for roadway space (VTPI
2007). Alternatively, adding light rail or rapid transit can help deal with congestion by
removing cars from the road, rather than building more roads to accommodate projected
increases. This has important air quality considerations, as increased congestion can affect
air quality and health negatively (Grossman et al. 2009).
Residents who make use of light rail can also benefit from reduced automobile use, just
as a city or business auto fleet can benefit from employees making a larger percentage of
trips by transit. The reduction of oil and fuel use, lower insurance rates, increase in vehicle
resale value, decrease in wear and tear of the vehicle, extension of vehicle life and a
decreased risk of accidents are amongst the many benefits of integrating efficient rapid
transit into one’s lifestyle. If the transit system is well connected and has a high ridership,
residents and fleet owners can reduce the amount of cars they own, which could amount to
a decrease in $3000 per year for each displaced vehicle (VTPI 2007). Furthermore,
research conducted by McCann (2000) and Litman (2004), indicated that households in
communities with well established transit systems can reduce transportation costs by
$1,000 to $3,000 per year. In addition to these benefits, fewer cars on the road translate to a
decreased need for road improvements and new roadway projects. The data is summarized
in Table 4 In terms of poverty issues and health, decreasing household costs can help the
financial situation of the household, thereby allowing the costs savings to be allocated to
other needs including improved health.
3.1.2 Employment and Lifestyle
LRT’s effect on employment and lifestyle is part of a larger movement towards smart
growth and transit oriented development in city planning and streetscape development.
123Light Rail Transit in Hamilton
LRT can help satisfy the needs of employers who require access to a large pool of
employees and employees who want to live in urban areas that are close to their places of
employment. This new and developing trend has made some companies re-evaluate their
strategy of developing campus-style workplaces on the outskirts of city centres and give
consideration to the development of urban offices located within the central business
district of a larger municipal centre. It has also motivated the Hamilton Chamber of
Commerce to establish Hamilton as a magnet for young talent to ensure the City is a place
where people want to live, work and play (Next Generation Consulting 2010a).
Hamilton is a much older and more established city than its neighboring Greater Tor-
onto Area (GTA) communities, having been established as a manufacturing city in 1847.
As such, it does not have as much developable green space. This means that Hamilton has a
limited ability to compete with younger GTA neighbors for green space developments and
companies wishing to pay fewer taxes. Since Hamilton has more former industrial brown
field space than developable green space, it may be necessary to re-orientate its strategy.
One type of company to focus on is the new urbanite company, which are ‘‘companies
attracted to urban cores with access to employee housing, good public transportation
systems … the presence of urban amenities such as restaurants, shops and health clubs…’’
(O’Mara 1999 p. 380). O’Mara’s research indicates that business relocation is based more
heavily on workforce quality and education potential, than financial incentives. Therefore,
it is important for Hamilton to work on retaining its university and college educated
workforce after graduation, especially for those in technical industries. In order to attract
the companies O’Mara refers to, city planners in Hamilton will have to respond to the
needs of young graduates, who through focus groups and a web-based survey, shared their
frustrations with the car dependent nature of the city and a lack of transit facilities and
opportunities for active transportation (NGC 2010a).
According to Cervero and Duncan (2002), many employers favour rapid transit systems
such as light rail because they provide efficient access to affordable housing and accessible
municipal services, which help to recruit and retain workers. According to the research,
employees favor working near their place of residence and avoiding congestion on road-
ways. Cincinnati, Ohio’s City Manager summarizes this argument well: ‘‘Today, young,
educated workers move to cities with a sense of place and if businesses see us laying rail
down on a street, they’ll know that it is a permanent route that will have people passing by
7 days a week … Cincinnati has to compete with other cities for investment … talent and
for a place of national prominence.’’ (Driehaus 2008).
3.2 Health and Environment Impacts
According to the McMaster Institute of Environment and Health (Sahsuvaroglu and Jerett
2003), Hamilton’s air quality is one of the poorest in Canada. In Hamilton, transportation
sources account for 53 % of NOx releases, 23 % of all volatile organic compounds emitted
and 17 % of all CO2 emissions released. In Toronto, cars contribute to 17 % of all PM10
emissions and 70 % of CO emissions (RWDI 2004). These numbers and their associated
health effects are amplified by a much larger presence of air toxins within the vehicle as
opposed to outside of the vehicle. As previously discussed, the greater amount of time
spent in the car, the greater the exposure to toxins at higher than normal concentrations
(McKeown 2007). Hamilton has responded to this concern with the establishment of Clean
Air Hamilton, a group that investigates air quality issues and develops policy to mitigate
the effects of air pollution and reduce the production of air toxins. A LRT system would
help Hamilton reach its goal to reduce greenhouse gas emissions in its operations starting
123P. Topalovic et al. with a 10 % reduction of 2005 levels by 2012, followed by a 20 % reduction by 2020 (Montgomery 2008). Ecological resources act as a natural filter providing clean air and water to the sur- rounding area. The estimated economic value of the Great Lakes ecosystem is $80 billion (Krantzberg and de Boer 2008). Hamilton occupies a significant portion of this ecosystem and benefits greatly from its services. The city, as a steward of the surrounding area, has a responsibility to ensure the social, environmental and economic stability of this system. An important part of this stewardship initiative centres on land use and transit planning. According to the IBI’s Economic Impact Analysis (2009b), annual emissions costs due to automobile travel could be reduced by 7.5 % ($2 million) annually with the installation of the B-Line LRT system. Furthermore, the reduced amount of collisions due to the removal of automobile traffic from LRT service could reduce collision costs by an addi- tional $2 million. In terms of the sedentary lifestyles associated with car dependency, Hamilton experi- ences a higher health concern, given the amount of sprawl and its corresponding obesity rates. In an analysis conducted by Hamilton Public Health (2007), it was found that 53 % of Hamilton residents are obese or overweight when examining BMI self reports. This is above the provincial average of 48.5 %. When exploring the features of neighbourhoods within the City of Hamilton, Behan et al. (2008) found that most of the new neighbourhood developments are being built further away from the inner-city and lack transit connectivity and mixed-use land uses, promoting the use of private vehicles and possibly contributing to the increased prevalence of obesity within Hamilton. According to census trends occurring between 1996 and 2006, nearly 75 % of 245,000 Hamiltonians employed in the labour force use single-occupancy vehicles to commute to work and less than 10 % report using public transit as their main form of commute (Statistics Canada 2006). In addition, while there is a clear decrease in auto use from 76.9 % of the labour force to 74.4 % between 2001 and 2006, walking and cycling to work has also dropped from 6.7 to 6.3 %. This could contribute to increased obesity risks within the City of Hamilton as Samimi and Mohammadian (2010) showed increased rates of obesity in people who regularly drive as it promotes an inactive lifestyle. Transit oriented development, infill development, walkable neighbourhoods, and increased reliance on transit will play a role in lowering these weights and encouraging more healthy lifestyles for Hamilton residents. This could result in lower health care costs for ailments associated with obesity (Stokes et al. 2008). Light Rail Transit will help satisfy the City of Hamilton Corporate Energy Policy’s energy reduction targets, one of which is to reduce energy use by 20 % by 2020 (City of Hamilton 2007b). Rail does not depend on inefficient and depleting fuel sources such as diesel or natural gas and it helps eliminate dependence on oil. World oil reserves have decreased to the point where much of the easily extracted ‘‘peak oil’’ is no longer available. As reserves continue to be used at unsustainably high rates, the price to extract the crude will increase, while access to the crude source will become more difficult and unaffordable (Deffeyes 2004). There is a possibility that this crisis could drive the municipal, provincial and personal energy budgets to unsustainable levels and jeopardize government’s ability to provide services, programs and infrastructure maintenance. Light rail is energy efficient and displaces automobiles from city roads, thereby pro- viding a two- factor strategy to reduce energy dependence. LRT reduces the impact of fueling public vehicles, since most areas of the city would be rail or rapid transit acces- sible. Strategies could then be implemented to encourage employees to use transit rather than corporate vehicles, eliminating a significant portion of the fleet. According to Shapiro, Hassett and Arnold (2002), travel on various modes of transit compared to automobiles, 123
Light Rail Transit in Hamilton
uses half the energy and produces 5 % as much CO, 8 % as much VOCs and half the CO2
per passenger-mile. When light rail is isolated, the amount of CO2 emitted is nearly zero,
especially if the electricity to power the vehicles come from renewable sources. Further-
more, rail can help lower the amount of congestion on City streets, thereby helping to
conserve energy and reduce emissions (VTPI 2007).
3.2.1 Urban Sprawl
Hamilton, like most North American cities, occupies a large area comprised of outlying
communities, which are disconnected from the downtown core and have limited bus
service (Litman 2011). This type of urban development increases automobile dependence
and has negative impacts on the City’s downtown core. According to a 1997 World Bank
Report (Kenworthy et al. 1997), the per capita wealth in developed cities decreases with
increased car use. Therefore, controlling the escalation of car use through TOD and light
rail networks can improve the municipal economy. There is also clear complementary
evidence that those living a further distance from the city centre are more likely to depend
on their vehicle (Behan et al. 2008). Servicing populations in the outlying areas of the city
with efficient transportation systems will also help lessen this dependence.
Hamilton is an exceptional case study for urban sprawl issues compared to neighbouring
communities because it has a much higher proportion of auto users versus transit riders
(Heisz and LaRochelle-Cote 2005). This information is indicative of Hamilton’s strong
urban sprawl base, which can be environmentally and financially detrimental to the com-
munity. LRT along with TOD and transportation demand management initiatives can
combat these issues and encourage greater use of transit for travel to work and entertainment.
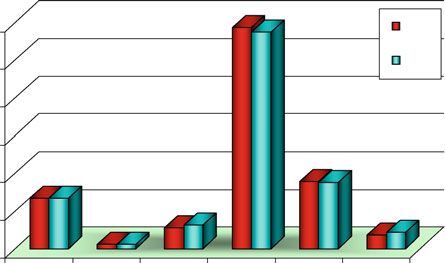
TOD and transit initiatives are important to the City of Hamilton because over 50 % of
all 1–2 km trips in Hamilton are taken by automobile, as depicted in Fig. 3 (University
of Toronto 2009). The data is alarming because it represents a lack of activity amongst
residents, but it is also reassuring because studies show that shorter commuting distances
encourage the use of transit, walking and cycling over single occupancy vehicles (Centre
for Community Study 2005). Therefore, Hamilton has a strong base of citizens who could
be encouraged to use transit rather than automobiles for short trips.
Mode Share for 1-2 km Household Trips
60% 2001
2006
50%
40%
30%
20%
10%
0%
Walking Cyling Transit Auto Driver Auto Other
Passenger
Primary Mode of Travel
Fig. 3 Mode Share for 1–2 km Trips in Hamilton (University of Toronto 2009)
123P. Topalovic et al. 3.2.2 Quality of Life and the Creative Class One challenge that deserves attention is Hamilton’s creative brain drain and its relation to quality of life and the creative class. Hamilton’s economic development policy identifies the downtown core and cultural clusters as areas to focus new development. This is important because they are emerging clusters, which differ from the traditional manu- facturing base the City has relied upon in the past (Hamilton Economic Development 2005). Hamilton’s well established clusters are important areas of development, but they generally require serviced land and infrastructure, which is scarce and expensive. Downtown core renewal, heritage building preservation, smart growth, inner urban area investment, space conversion, park and trail design, efficient rapid transit and growth in the entertainment sector are amongst the list of strategies necessary to attract and retain a creative workforce (Florida 2005). Florida’s research indicates that attracting talented and creative people can create economic growth through innovation, technology based industries and create a Bohemian atmosphere, which is associated with artists, entertainers and other traditional creative occupations (CCS 2004, p. 2). Sustainable development is no longer just the right thing to do, it is a business decision motivated by financial interests and the need for community well being. The evidence indicates that LRT can be a key enabler of downtown renewal and sustainable urban planning and would therefore help to attract the creative class. Urban renewal investments can also address the competition Hamilton faces with other GTA municipalities that have more serviced, undeveloped land and fewer taxes. In order to monitor its economic performance, Hamilton can compliment the standard measures of transportation infrastructure and amount of developable lands with indices that measure indirect elements of development (CCS 2004). These indices include the Bohemian index which measures the amount of creative and artistic employment, as well as indices that measure the amount of university educated citizens, the amount of immi- grants and the amount of employment in the high tech industry (Florida 2005). In the past, Hamilton has fared poorly on all these indices, especially when compared to GTA neighbors (CCS 2004). Similarly, in the Next Generation Consulting report on Next Cities, Hamilton placed 20th in a list of 27 (NGC 2010b). Cities were compared in seven indexes, one being ‘‘Vitality’’, which measures a city’s health, based on air and water quality, green space, and health factors including obesity and life expectancy (NGC 2010b). LRT and supportive urban renewal policies may help to improve Hamilton’s vitality. The opportunities for health, environmental and economic benefits that LRT presents for the City of Hamilton have a high potential to impact various areas including: air quality, quality of life, obesity rates, car dependency, greenhouse gas emissions, urban sprawl, vehicle costs, healthcare costs, land values, job creation, downtown renewal, smart growth, creative class and new urbanite attraction. These potential benefits, presented through this case study, may help the City of Hamilton improve the health of its citizens and the environment in which they live so the city can continue to be a place where people want to live, work and play. 4 Discussion and Recommendations Hamilton’s population is projected to grow by 32 % by 2031 which, according to the Transportation Master Plan (2007c), will result in 180,000 additional car trips per day. If improvements to public transit do not occur, the road network will have to accommodate 123
You can also read