City of Alexandria Low-Income Fare Pass Assessment - TECH MEMO 1 February 9, 2020
←
→
Page content transcription
If your browser does not render page correctly, please read the page content below
City of Alexandria Low-Income
Fare Pass Assessment
TECH MEMO 1

February 9, 2020

Prepared for:
Metropolitan Washington Council of Governments | City of Alexandria Low-Income Fare Pass Assessment Tech Memo 1

CONTENTS

Executive Summary ...................................................................................................................................................... ES-1
Introduction .......................................................................................................................................................................... 1
       Overview ................................................................................................................................................................ 1
       Goals for the Program .......................................................................................................................................... 1
       Options Under Consideration ............................................................................................................................... 2
Existing Conditions .............................................................................................................................................................. 2
       Population Information......................................................................................................................................... 2
       Available Public Transportation Services ............................................................................................................ 4
       Public Transportation Ridership .......................................................................................................................... 4
       Current Public Transportation Fares ................................................................................................................... 7
       Current Public Transportation Fare Media ........................................................................................................ 11
       Costs Associated with Fare Collection............................................................................................................... 12
       Regional Fare-Related Developments ............................................................................................................... 12
Literature Review ............................................................................................................................................................. 13
       Needs and Behaviors of Low-Income Transit Riders ........................................................................................ 13
       Reduced-Fare Program Design .......................................................................................................................... 15
       Benefits to Individuals ........................................................................................................................................ 15
       Ridership Impacts ............................................................................................................................................... 16
       Operational Impacts ........................................................................................................................................... 18
Case Example Review ..................................................................................................................................................... 19
       Overview .............................................................................................................................................................. 19
       Efficiency in Eligibility Determination ................................................................................................................ 23
       Funding Reduced Fare and Fare-Free Service.................................................................................................. 24
       Fare Media .......................................................................................................................................................... 25
       Discounts Offered in Conjunction with Fare Capping ....................................................................................... 25
       Innovative Partnerships ..................................................................................................................................... 25
Insights From City Staff ................................................................................................................................................... 26
Key Findings and Scenario Recommendations........................................................................................................... 27
       Comparison and Evaluation of Options ............................................................................................................. 29
       Other Considerations.......................................................................................................................................... 29
       Recommendations for Targeted Program ......................................................................................................... 30
       Conclusion and Next Steps ................................................................................................................................ 31
Appendix: Full Case Example Review Findings .......................................................................................................... A-1

FIGURES

Figure 1: DASH and WMATA Boardings by Route, FY 2019 ...................................................................................... 5
Figure 2: DASH Weekly Boardings and Service Hours .............................................................................................. 5

                                                                                                                                                                                 ii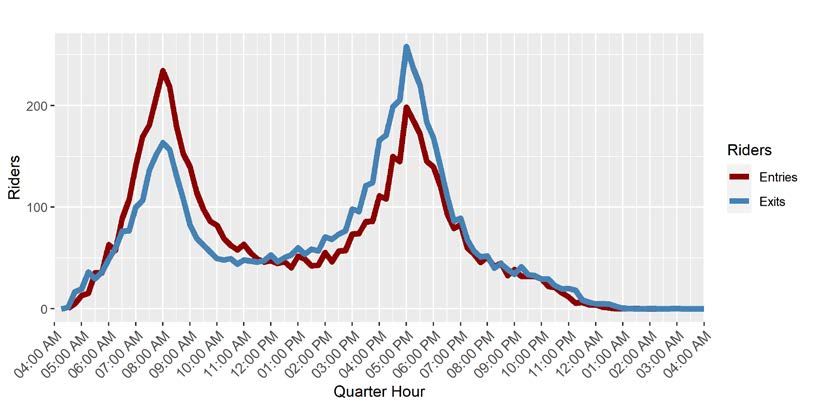
Metropolitan Washington Council of Governments | City of Alexandria Low-Income Fare Pass Assessment Tech Memo 1
Figure 3: Average Daily Entries by Metrorail Station, October 2019 ........................................................................ 6
Figure 4: King Street Metrorail Station Average Weekday Entries and Exits by Time of Day, October 2019 ........ 7
Figure 5: Yellow SmarTrip® Card for Seniors ............................................................................................................ 9
Figure 6: Reduced Fare SmarTrip® Photo ID ............................................................................................................ 9
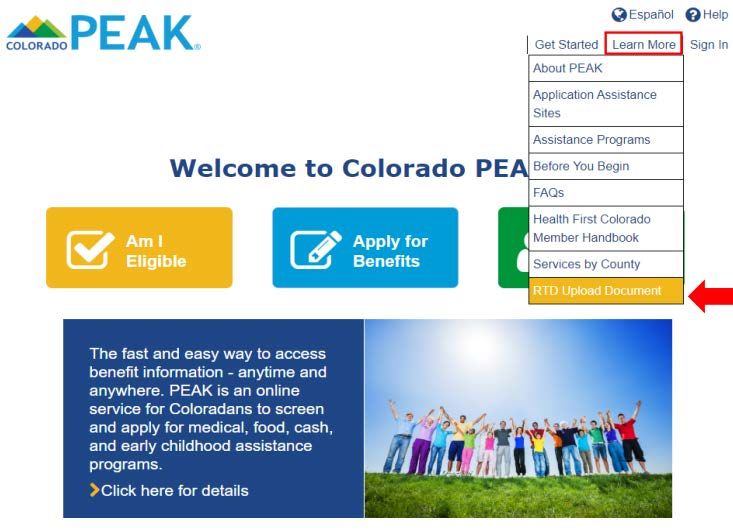
Figure 7: Case Example Locations............................................................................................................................ 19
Figure 8: RTD on Colorado PEAK Portal ................................................................................................................... 23
TABLES
Table 1: Individuals Below Federal Poverty Level ...................................................................................................... 3
Table 2: Number of Households by Income Level in Alexandria, 2019 ................................................................... 3
Table 3: DASH and WMATA Regular Fares, December 2020 ................................................................................... 8
Table 4: Fare-Free Transit Options Available in the Washington, DC Region ......................................................... 10
Table 5: Fare-Ridership Elasticity Estimates ............................................................................................................ 17
Table 6: Fare-Free System Examples ....................................................................................................................... 17
Table 7: General Characteristics of Selected Case Examples ................................................................................ 20
Table 8: Summary Evaluation of Options for the City of Alexandria ....................................................................... 28
Table A-1: List of Other Fare Discount and Fare-Free Programs Identified in Selection of Case Examples........ A-1
iii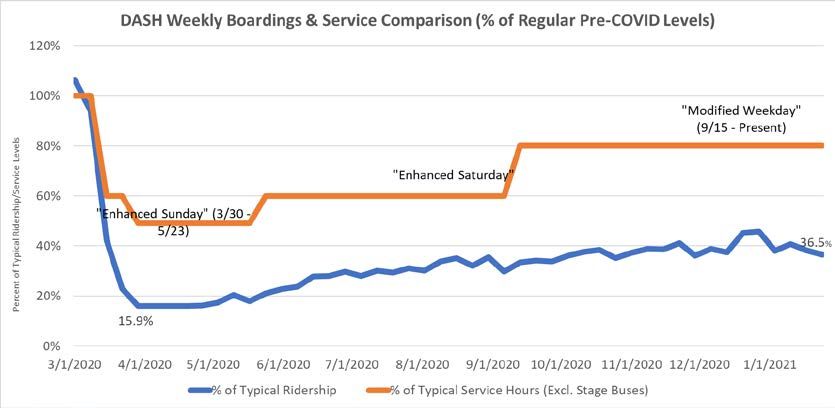
Metropolitan Washington Council of Governments | City of Alexandria Low-Income Fare Pass Assessment Tech Memo 1
EXECUTIVE SUMMARY
Transit fares are often a large cost burden for low-income riders, especially in areas with higher costs of living
like the City of Alexandria and Washington, DC. For many, this burden has increased because of the economic
recession caused by the COVID-19 pandemic. This project was initiated by the City of Alexandria, in partnership
with the Metropolitan Washington Council of Governments, to assess the feasibility and impact of a low-income
transit fare pass program in the City.
This technical memo identifies current practices for reducing the impact of fares on low-income people from
across the country and considers their implications for the City of Alexandria. The memo starts by developing
goals to guide the establishment of a program that would make public transportation more affordable for
residents with low incomes. These goals are:
Make transit more accessible for City residents who struggle to afford the cost of fares.
Enhance equity and access to opportunities in the City.
Maintain or enhance operational performance of the DASH system while maintaining or increasing bus
operator safety.
Minimize the administrative burden of implementing and sustaining a fare program.
Advance regional coordination to increase the affordability of public transportation for low-income
residents throughout the region.
The options for a potential program in the City of Alexandria evaluated in this memo include:
Free fares for everyone on the DASH system at all times;
Free fares for everyone on the DASH system during off-peak hours;
Free fares for eligible low-income residents on the DASH system at all times;
Discounted fares and passes for eligible low-income residents on the DASH system;
Free fares for eligible low-income residents ride on both DASH and WMATA services; and
Discounted fares and passes for low-income residents on DASH and WMATA services.
Literature Review
This memo outlines the findings from a review of published research relating to low-income individuals’ transit
usage, low-income fare program design, the relationship between fares and ridership, key benefits to low-
income transit riders when fares are removed or reduced, and operational impacts that a transit agency may
experience from reducing or eliminating fares. The literature review includes academic research papers that
explore quantitative relationships between fares and ridership as well as practically-minded research that
examines real-world findings from pilot programs and surveys. The portion of the literature review related to
the needs and behaviors of low-income riders indicated that these riders are more likely to:
Pay for each ride rather than use an unlimited pass;
Travel shorter distances;
Take more frequent transit trips;
Make more transfers; and
Be unbanked or underbanked and rely on cash transactions.
ES-1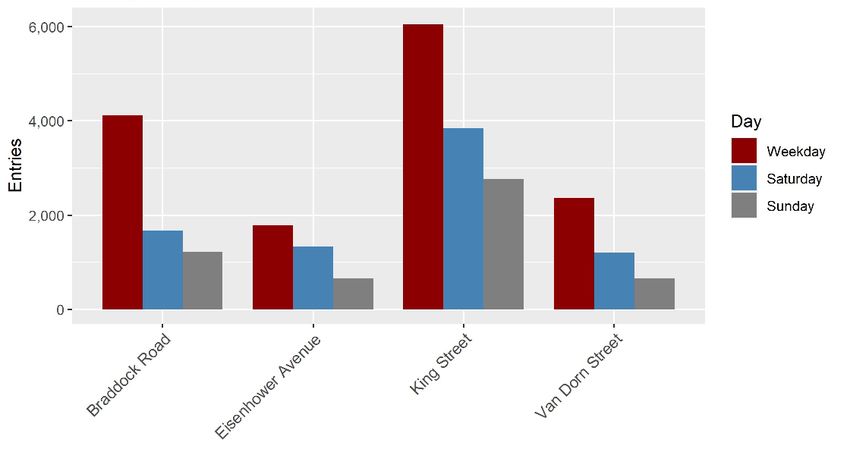
Metropolitan Washington Council of Governments | City of Alexandria Low-Income Fare Pass Assessment Tech Memo 1
In addition to being tailored to rider needs, any program in the City would also need to consider the impact of
reduced or free fares on the affected operators. The literature review uncovered the following findings:
In Boston, a pilot program found that low-income people who were given a 50 percent discount on fares
took 30 percent more trips.
A sample of ridership increases from agencies that went fare-free systemwide range from 32 to 205
percent, with most being below 60 percent.
Not collecting fares allows for faster boarding, which in some cases can improve on-time performance, but
can also lead to crowding. If the crowding is substantial, there is simultaneously the potential for free fares
to worsen on-time performance.
Case Examples
The case examples in this memo, which build on the findings in the literature review, highlight specific
programs across the country in more detail and demonstrate a range of possible options for a new program in
the City of Alexandria. Some of the significant findings from these case examples are:
Travel period considerations – Most agencies in the case examples did not distinguish between discounts
for peak and off-peak periods. Instead, most riders enrolled in reduced fare programs paid one rate per
trip regardless of their time of travel.
Fare media for program participants – In most case examples in which low-income participants received a
benefit, agencies used one of three methods to recognize admission into a reduced or fare-free program.
Agencies either: issued a separate card after eligibility was verified that would allow passengers to
purchase discounted fares/passes; issued a combination photo ID and fare card for free rides; or
programmed the discount onto the riders’ transit cards.
Eligibility thresholds – The case examples that involved targeted assistance (as opposed to going fare-free
systemwide) had different income limits as part of their criteria, with most requiring individuals to have
incomes of no more than 150 percent to 200 percent of the federal poverty level to qualify.
Making eligibility determination and certification easy – The application process can be significantly
streamlined by requiring minimal supporting documentation and, where possible, using existing
certification documents from other (often federal) financial assistance programs to verify eligibility, such as
Temporary Assistance for Needy Families (TANF) approval letters or Electronic Benefit Transfer (EBT)
cards, which function like debit cards and are given to recipients of TANF and Supplemental Nutrition
Assistance Program (SNAP) (food assistance) benefits.
Building partnerships with community organizations – Community organizations can play an important
role in a fare discount program. The case examples show that community organizations, which have direct
contact with clients, can identify who would benefit from a reduced fare program and inform these clients.
These agencies can also help applicants prepare their applications, host sign-up events, and be trained
(and resourced) to certify, issue, and register resulting ID cards or fare media.
Regional collaboration when possible – The LIFE and Clipper START programs (in the Los Angeles and San
Francisco Bay areas, respectively) are examples of successful interagency cooperation. The Clipper START
program, for example, grew from four to ten participating agencies. The program could serve as a model
not just for the City of Alexandria, but potentially the entire region.
After considering these findings, the project team and City staff decided to move three options forward for
further ridership and cost analysis as part of this study. These are:
Free fares for everyone on the DASH system at all times;
Free fares for eligible low-income residents ride on both DASH and WMATA services; and
Discounted (50 percent) fares and passes for low-income residents on DASH and WMATA services.
ES-2
Metropolitan Washington Council of Governments | City of Alexandria Low-Income Fare Pass Assessment Tech Memo 1

The latter two options will allow riders to use the transit options that work best for them regardless of operator
and will demonstrate the difference in impact between free fares and reduced fares. They also leave open the
possibility for the City of implement the program initially just on the DASH system and then expand to cover
WMATA services as resources become available.

The second technical memo will include more detailed ridership and cost estimates as well as a discussion of
potential administration options and operational impacts.

                                                                                                                  ES-3
Metropolitan Washington Council of Governments | City of Alexandria Low-Income Fare Pass Assessment Tech Memo 1
INTRODUCTION
Overview
Public transit fares can often represent a large burden for low-income passengers, especially in areas with
higher costs of living like the City of Alexandria and Washington, DC. For many, this burden has increased as a
result of the economic recession caused by the COVID-19 pandemic. Access to public transportation continues
to be a critical need for low- and middle-income residents, who can have significant trouble getting to jobs,
health care appointments, education opportunities, social service offices, and retail destinations without it.
Access includes not only the availability of public transportation, but the ability to afford the service, and the
cost of riding public transportation remains a barrier for many residents. The Washington Metropolitan Area
Transit Authority (WMATA), for example, found that low-income riders often limit transit use due to cost and
spend more than twice as much of their after-tax income on transit as riders who are not low-income. 1
Recognizing this issue, the City of Alexandria applied for, and was awarded, a grant through the Metropolitan
Washington Council of Governments’ (MWCOG) Transportation-Land Use Connections (TLC) Program to study
and identify the best option for making public transportation more affordable to its residents, particularly those
from low-income households. This Technical Memorandum describes the findings from the research conducted
for this study as of January 2021.
This study is occurring as plans for a roll-out of the City’s redesigned bus network are underway.
Implementation of the new bus network is expected to begin in late 2021. The redesigned network, once fully
implemented, will significantly increase the availability of higher-frequency transit for residents, particularly
during off-peak periods and on weekends. The combination of an enhanced and improved network of bus
services and more affordable fares represents a significant opportunity to enhance equity, increase access to
opportunities, and improve quality of life in the City of Alexandria. There is also the potential for the
implementation of free or more affordable public transportation fares for City residents to serve as a model for
other jurisdictions in the Washington, DC region and in the Commonwealth of Virginia that are also currently
considering how to address this challenge.
Goals for the Program
The City of Alexandria and the Metropolitan Washington Council of Governments have identified goals that they
would like to achieve through establishment of a program that would make public transportation more
affordable for residents with low incomes. These goals are:
Make transit more accessible for City residents who struggle to afford the cost of fares.
Enhance equity and access to opportunities in the City.
Maintain or enhance operational performance of the DASH system while maintaining or increasing bus
operator safety.
Minimize the administrative burden of implementing and sustaining a fare program.
Advance regional coordination to increase the affordability of public transportation for low-income
residents throughout the region.
1 WMATA, DC Low-Income Fare Pilot, Report to the WMATA Board Finance and Capital Committee, December
2019, https://www.wmata.com/about/board/meetings/board-pdfs/upload/3C-DC-Low-Income-Fare-Pilot-
v2.pdf.
1Metropolitan Washington Council of Governments | City of Alexandria Low-Income Fare Pass Assessment Tech Memo 1
Options Under Consideration
The following potential options for making public transportation services more affordable for City of Alexandria
residents were identified for evaluation under this study:
Free fares for everyone on the DASH system at all times.
Free fares for everyone on the DASH system during off-peak hours.
Free fares for eligible low-income residents on the DASH system at all times.
Discounted fares and passes for eligible low-income residents on the DASH system.
Free fares for eligible low-income residents ride on both DASH and WMATA services.
Discounted fares and passes for low-income residents on DASH and WMATA services.
These options are not necessarily mutually exclusive; multiple options could be progressively implemented as
discussions between the City of Alexandria and WMATA continue. For example, discounts or waived fares for
people from low-income households could be implemented in the short-term on the DASH system, with an
expansion of the program to cover WMATA services in the future.
The Key Findings and Scenario Recommendations section at the end of this memo identifies the advantages,
disadvantages, and potential considerations related to these options, and recommends three for further
evaluation as part of this study.
EXISTING CONDITIONS
The City of Alexandria has nearly 160,000 residents and is located approximately five miles south of
Washington, DC. This section outlines existing conditions in the City as they relate to the topic of public
transportation access and affordability.
Population Information
Low-Income Population
In 2019, the City of Alexandria had a high median household income of $100,900. This figure is higher than
the Washington, DC region, which had a median household income of $86,400, and significantly higher than
the national median household income of $62,800. 2 However, there are many residents in the City who have
low incomes and struggle to have all of their basic needs (shelter, food, healthcare, clothing, etc.) met.
A total of 16,100 (10.3 percent) of Alexandria residents live below the federal poverty level (FPL). 3 Table 1
shows the number of individuals living below a variety of poverty ratios in Alexandria. 4 In the City, 7,600
residents live below 50 percent of the FPL (about $6,250 for an individual or $12,900 for a family of four),
while 33,000 live below 200 percent of the FPL (about $25,000 for an individual or $51,500 for a family of
four).
2 U.S. Census Bureau, Table S1903, ACS 5-year estimates, 2015-2019
3 U.S. Census Bureau, Table S1701, ACS 5-year estimates, 2015-2019. The federal poverty level in 2019 was
$12,490 for an individual and $25,750 for a family of four.
4 U.S. Census Bureau. American Community Survey 5-year estimates, Table S1701
2Metropolitan Washington Council of Governments | City of Alexandria Low-Income Fare Pass Assessment Tech Memo 1
Table 1: Individuals Below Federal Poverty Level
Income Level Number of Individuals
50 percent of FPL 7,632
100 percent of FPL 16,100
125 percent of FPL 20,579
150 percent of FPL 24,404
185 percent of FPL 30,651
200 percent of FPL 33,220
300 percent of FPL 48,817
400 percent of FPL 62,846
500 percent of FPL 75,839
Table 2 shows the number of households at various income levels in the City of Alexandria. 5 Approximately
one-third of households earn less than $75,000, which is about 85 percent of the regional median household
income.
Table 2: Number of Households by Income Level in Alexandria, 2019
Household Income Number of Households Percentage of Households
Under $25,000 6,424 9.1%
$25,000-$49,999 8,684 12.3%
$50,000-$74,999 10,449 14.8%
$75,000 and above 45,112 63.8%
In July of 2020, 4,743 households and 9,554 individuals in the City of Alexandria received Supplemental
Nutrition Assistance Program (SNAP) (food assistance) benefits, with an average amount of $352 of SNAP
benefits per household. 6 In most cases, a household must earn at or below 130 percent of FPL to be eligible
for SNAP benefits. 7 The number of individuals receiving SNAP benefits is about 46 percent of the population
living below the 125 percent of FPL, indicating that there are many eligible residents who do not receive SNAP
benefits.
Of DASH riders in 2013, 32.7 percent were from households earning less than $30,000, while 51.2 percent
were from households earning less than $50,000. 8 WMATA’s 2016 Metrorail Ridership Survey indicates that a
total of 5.8 percent of Metrorail riders in the City of Alexandria were from households earning less than
$30,000, while 13.1 percent of riders were from households earning less than $50,000. 9 WMATA’s Metrobus
survey in 2018 found that 31.5 percent of Metrobus riders in the City were from households earning less than
$30,000, 45.5 percent of riders were from households earning less than $50,000, and 71 percent reported a
household income of less than $100,000. 10 This indicates a relatively higher reliance on bus service vis-à-vis
5 U.S. Census Bureau. American Community Survey 5-year estimates, Table S1901
6 SNAP Participation by Household, 2005-2020, Department of Community and Human Services/CES.
7 SNAP Eligibility, USDA, https://www.fns.usda.gov/snap/recipient/eligibility.
8 DASH Demographic Database, 2013
9 WMATA Metrorail Ridership Survey, 2016.
10 WMATA Metrobus Ridership Survey, 2018.
3Metropolitan Washington Council of Governments | City of Alexandria Low-Income Fare Pass Assessment Tech Memo 1
rail among low-income residents. In the City of Alexandria, 6,600 households (about 9.4 percent of all
households) do not own a vehicle. 11
Available Public Transportation Services
The City of Alexandria is served by the DASH bus system, which has 13 routes and 646 bus stops. 12 There are
47 WMATA Metrobus routes and 398 Metrobus stops (some of which coincide with DASH stops) in the City, as
well as two WMATA Metrorail lines and four Metrorail stations. 13 The City is also served by the Virginia Railway
Express (VRE) and Amtrak rail services, which both stop at King Street, and the Capital Bikeshare system.
Public Transportation Ridership
In the City of Alexandria, 59 percent of workers commute by driving alone, 20 percent use transit, 8 percent
carpool, 4 percent walk, and 1 percent bike. 14 In FY 2019, DASH provided a total of 3.7 million trips, 3.1
million on the weekdays and 612,000 on the weekends, with an average weekday ridership of approximately
12,500. Figure 1 shows DASH and WMATA boardings by route in FY 2019. The Trolley, which is free and
connects the King Street Metrorail station to the waterfront along King Street, carried more riders than any
other route in FY 2019 (760,000), and the AT8 15 carried the most weekday passengers (650,000). In FY 2020,
which included four months of service during the COVID-19 pandemic, DASH provided 2.8 million trips.
Figure 2 shows DASH ridership and service levels during the COVID-19 pandemic. DASH service levels
decreased at the beginning of the pandemic in response to the drop in ridership, and have increase twice in
response to rebounding ridership, although ridership was at around 40 percent of pre-pandemic levels in
February 2021.
11 U.S. Census Bureau. ACS 2019 5-year estimates, Table B08201.
12 During the COVID-19 pandemic, the DASH network has been operating 10 routes and providing service at
590 bus stops.
13 There will be five Metrorail stations in the City once the Potomac Yard station opens.
14 U.S. Census Bureau. ACS 2019 5-year estimates. Table S0801
15 The AT8 connects the Old Town area with Landmark Mall and Van Dorn Metro station in the western part of
the City. Between Old Town and Landmark Mall, it operates along Duke Street.
4Metropolitan Washington Council of Governments | City of Alexandria Low-Income Fare Pass Assessment Tech Memo 1
Figure 1: DASH and WMATA Boardings by Route, FY 2019
DASH routes are shown in blue; WMATA Metrobus routes are shown in black.
Figure 2: DASH Weekly Boardings and Service Hours
There were 3.1 million boardings on Metrobus bus routes in the City of Alexandria in FY 2019. 16 The 10A, 10B,
28A, Metroway, and 7M were the most popular routes, each with over 200,000 boardings in FY 2019. 17
WMATA’s most used bus stops in Alexandria are at the King Street Station, Mark Center Transit Station,
Southern Towers Apartments and Braddock Road Station. 18 Metrorail stops in the City of Alexandria include
Braddock Road, King Street, Eisenhower Avenue, and Van Dorn Street. In FY 2019, these four stations had
3.82 million entries, with 3.35 million on weekdays. 19 King Street was the most popular, with an average of
16 Bus Ridership Data Viewer: https://www.wmata.com/initiatives/ridership-portal/Bus-Data-Portal.cfm
17 WMATA PLAN Office using APC data, FY 2019.
18 WMATA Automatic Passenger Counter (APC) data, 2019.
19 Rail Ridership Data Viewer: https://www.wmata.com/initiatives/ridership-portal/Rail-Data-Portal.cfm
5Metropolitan Washington Council of Governments | City of Alexandria Low-Income Fare Pass Assessment Tech Memo 1
6,000 daily weekday riders in FY 2019. Figure 3 shows average daily entries by Metro stations in Alexandria. 20
Figure 4 shows entries and exits at King Street station by time of day, indicating strong peak ridership and
significantly lower off-peak ridership. 21 Figure 4 also shows entries in the morning exceeding exits in the
evening, indicating that more people are departing the station via Metrorail in the morning peak than are
arriving there. Of Metrorail riders who live in the City of Alexandria, 13 percent report an income below
$50,000, and 42 percent report an income below $100,000. 22
VRE provided 4.4 million trips in FY 2019 across its service area, representing about seven percent of ridership
in Northern Virginia across all transit modes. 23 Across VRE’s entire service area, VRE averaged about 18,500 in
daily ridership in early 2020, and provided about 350,000 monthly trips. 24
Figure 3: Average Daily Entries by Metrorail Station, October 2019
20 Metrorail Faregate Ridership Data.
21 Id.
22 Metrorail Ridership Survey, 2016.
23 Northern Virginia Transportation Commission (NVTC), FY 2019 Annual Transit Performance Report,
https://novatransit.org/uploads/data/quarterly/FY2019%20Annual%20Transit%20Performance%20Repor
t.pdf
24 VRE, CEO Report March 2020. https://www.vre.org/about/board/board-agenda-
minutes/2020/March/2020-ceo-report-march-pdf/.
6Metropolitan Washington Council of Governments | City of Alexandria Low-Income Fare Pass Assessment Tech Memo 1
Figure 4: King Street Metrorail Station Average Weekday Entries and Exits by Time of Day, October 2019
Current Public Transportation Fares
DASH and WMATA Fares
Table 3 provides an overview of regular (non-pandemic) DASH and WMATA fares, transfers, and payment
methods. As indicated in Table 3, Metrorail fares are shown as a range since they vary by time of day and
distance, whereas Metrobus fares are a flat $2.00 on regular routes. This difference between Metrorail and
Metrobus fares is believed to be a significant factor in many people’s decisions to take bus rather than rail
within the region. WMATA has found that over half of Metrobus riders are low-income, as compared to only 18
percent of Metrorail passengers. 25
25 WMATA, Bus Transformation Project Strategy and Recommendations, September 2019,
https://bustransformationproject.com/wp-
content/uploads/2019/09/Bus_Transformation_Strategy_and_Recommendations_2019-09-05.pdf.
7Metropolitan Washington Council of Governments | City of Alexandria Low-Income Fare Pass Assessment Tech Memo 1
Table 3: DASH and WMATA Regular Fares, December 2020
Service Standard Children Seniors & Students Transfers 26 Unlimited Passes Pass Storage Other Fare
People with Media Payment
Disabilities Methods
DASH 27 $2.00 Up to two $1.00 Senior Free w/ Transfers to other DASH Monthly: $45 Paper or Cash,
children ages SmarTrip® valid routes valid for 4 hours, SmarTrip® card Metrobus full
four and under during off- Student ID honored on Metrobus and fare token;
free w/ adult peak hours during some other systems within DASH Bus
and school year two hrs. mobile app
weekends
Metrobus 28 $2.00 Up to two $1.00 for Free - DC To Metrobus: free w/ Monthly 29: $72-$216; 1-, SmarTrip® SmarTrip®
children ages Seniors and Kids Ride unlimited transfers within 3-, and 7-Day Unlimited: card; Apple app 31,cash;
four and under Persons w/ Free two hrs. $13, $28, $58; 7-Day Wallet (AW) showing ID 32
free w/ adult Disabilities Program To Metrorail: $0.50 Short Trip: $38 30; 7-Day
(KRFP) discount within two hrs. Regional Bus Pass: $15
Metrobus $4.25- Up to two $2.10-$3.75 Free - DC To Metrobus: free w/ Monthly pass covers first n/a Apple Wallet
Express $7.50 children ages KRFP unlimited transfers within $2.00 (AW); cash
routes (e.g., four and under two hrs. (on most
5A/Airport) free w/ adult To Metrorail: $0.50 routes)
discount within two hrs.
Metrorail $2.25- Up to two 50% off peak Free - DC To Metrobus: $0.50 Monthly: $72-$216 SmarTrip® SmarTrip®
(peak) $6.00 children ages fare KRFP discount within two hrs. card; Apple app
four and under Wallet (AW)
free w/ adult
Metrorail $2.00- Up to two n/a Free - DC To Metrobus: $0.50 Monthly: $72-$216 SmarTrip® SmarTrip®
(off-peak) $3.85 children ages KRFP discount within two hrs. card; Apple app
four and under Wallet (AW);
free w/ adult
26 Transfers are only valid for those using SmarTrip® cards or other unlimited cards.
27 DASH fare information comes from https://www.dashbus.com/ride-dash/fares.
28 WMATA fare information comes from https://www.wmata.com/fares/basic.cfm.
29 The monthly unlimited pass includes all rides on Metrorail and Metrobus for the month up to a maximum fare level based on time of travel and
distance. If a rider makes a trip above their pass’s fare, they pay the cost difference using stored value on their SmarTrip® card.
30 Covers all trips in the Metrorail system during off-peak hours; unlimited trips on Metrorail up to a fare of $3.85 when peak fares are in effect; and
covers first $2.00 of fare on Metrobus Express and Airport Express routes.
31 In September 2020, WMATA launched a touch-free payment system that links SmarTrip® information with a rider’s iPhone and Apple Watch, allowing
them to tap either device where a SmarTrip® card would be tapped. Riders with a Senior SmarTrip® card may transfer their card to the mobile app.
32 Certain riders may board fare-free by showing their ID or badge. Riders carrying badges from the Pentagon, Department of Defense (DOD) and
contractor badges can ride fare-free on specific DOD routes. Those with US Coast Guard badges ride fare-free on two routes serving St. Elizabeth’s.
More information can be found at https://www.wmata.com/business/procurement/solicitations/upload/Exhibit-P-Farebox-Training-Guide.pdf.
8Metropolitan Washington Council of Governments | City of Alexandria Low-Income Fare Pass Assessment Tech Memo 1
In addition, riders transferring between modes and the services of different providers (e.g., WMATA, DASH,
Fairfax Connector, ART, etc.) may be subject to additional transfer fares. For example, a DASH rider would have
a free transfer to Metrobus and all other DASH lines, but would need to pay the full applicable fare, less a
$0.50 credit, when transferring to Metrorail. There is currently, however, a $0.50 discount for transfers from
Metrobus to Metrorail or from Metrorail to Metrobus within a two-hour transfer window. WMATA’s FY21 budget
proposed to increase the transfer discount to $1.00, but this has not yet been implemented due to budget
challenges.
WMATA offers one-, three-, seven-day Unlimited passes, “7-Day Short Trip” passes (covering unlimited travel for
Metrobus trips, off-peak Metrorail trips, and shorter Metrorail trips during peak hours), monthly combined
passes for both Metrorail and Metrobus, and a seven-day regional bus pass. The price of a monthly pass that is
valid for both modes ranges from $72-$216. There is no single, stand-alone monthly pass valid on only
Metrobus or only Metrorail, but there is a 7-Day Regional Bus Pass which is valid on Metrobus, ART, DC
Circulator, CUE, DASH, Fairfax Connector, TheBus, and Ride On and costs $15. Additional regional pass
products were proposed in WMATA’s FY 2021 budget but were ultimately removed as the scope of the
pandemic budget impact became clear.
WMATA offers reduced fares for those ages 65 and Figure 5: Yellow SmarTrip® Card for Seniors
over and for individuals with disabilities under 65.
Special fare media (yellow Senior SmarTrip® cards
(Figure 5) and Reduced Fare SmarTrip® Photo ID
cards for individuals with disabilities) are issued to
those who qualify, and the discounts are
programmed on their cards.
For individuals with disabilities, their reduced fare
cards include their photo and can be used for 50
percent off Metrobus, other regional buses, and trips
made via Metrorail during peak hours. For seniors,
these cards provide discounts of 50 percent off on trips made during peak periods via Metrorail and discounts
on Metrobus, Express Metrobus, and Airport Express Metrobus routes.
In addition, both SmarTrip® cards offer discounted fares for participating
Figure 6: Reduced Fare SmarTrip®
bus service providers in the region including DASH, ART, CUE, Fairfax
Photo ID
Connector, Loudoun County Transit, OmniRide, Ride On, TheBus, and
Maryland Transit Administration (MTA) bus. Applicants can only apply for the
disability card (see Figure 6) in person at one of two WMATA offices, which
are located in downtown DC or Silver Spring, MD. These offices have limited
hours on specific days where they accept applications. Seniors can apply for
their Senior SmarTrip® cards by visiting one of at least twenty locations
throughout the region, including the Metro Center Sales Office; commuter
stores; retail outlets; and select libraries in Montgomery County, Maryland.
Similar to Metrobus, DASH has one standard, $2.00 base fare and a policy that up to two children ages four
and under ride for free when accompanied by a fare-paying adult. DASH also offers reduced ($1.00) fares for
Senior/Disabled SmarTrip cardholders who ride during off-peak hours (anytime except 6:00 to 9:00 a.m. and
3:00 to 6:00 p.m. on weekdays). DASH offers free transfers between all DASH buses and most Metrobus
routes. While most regional providers only provide a two-hour transfer window, DASH allows for free transfers
within a four-hour window, enabling some riders to make their full trip (out and back) for the price of one fare.
9Metropolitan Washington Council of Governments | City of Alexandria Low-Income Fare Pass Assessment Tech Memo 1
The $45 monthly DASH Pass covers unlimited trips on the DASH system and is also recognized on Fairfax
Connector local routes, but additional charges may apply when transferring between systems.
Fare-Free Products in the Region
The types and availability of free fares across transit agencies operating within the Washington, DC region
varies (prior to any pandemic-related changes to fare collection). Table 4 provides an overview of fare-free
programs for targeted populations. No reduced fare or free-fare program for low-income individuals currently
operates among these providers.
Table 4: Fare-Free Transit Options Available in the Washington, DC Region
Agency Seniors Children Students People with Disabilities
ART — Children under 5 — MetroAccess members
CUE — Children 3 and under, Fairfax secondary students MetroAccess members
accompanied by adult GMU Students, faculty, and
staff
DASH — Children under 4, Students from participating MetroAccess members and
accompanied by adult high schools during the City paratransit-eligible
school calendar year residents (DOT Program)
DC — Children under 5, Free with Kids Ride Free —
Circulator accompanied by adult SmarTrip® card
Fairfax — Up to two Children ages Fairfax County high school —
County four and under free w/ and middle school students
Connector adult
Metrobus/ — Up to two Children ages Free with Kids Ride Free —
Metrorail four and under free w/ SmarTrip® card
adult
OmniRide — Up to two Children ages — —
four and under free w/
adult
Ride On Free off-peak Free for all youth ages 18 Free with Montgomery Free off-peak with Metro
and under College student ID Disability ID card
Always fare-free for
MetroAccess members
TheBus Free for ages Free for all youth ages 5-18 Free for students with ID Free
60 and up
VRE — Children under 10, — Attendants travel for free
accompanied by adult with an attendant pass
In 2019, 33 the DC Circulator experimented with fare-free for all service under Mayor Bowser’s Fair Shot
February program. Initially, the program provided fare-free rides on the system for the month of February. After
this initial period, Mayor Bowser extended the program indefinitely and requested $3.1 million dollars to
provide fare-free service in the 2020 fiscal year. This request was denied by Council and fares were later
33 DC Circulator, Mayor Bowser Announces Free Rides on DC Circulator During #FareShotFebruary, January,
2019, https://www.dccirculator.com/mayor-bowser-announces-free-rides-on-dc-circulator-during-
fairshotfebruary/.
10Metropolitan Washington Council of Governments | City of Alexandria Low-Income Fare Pass Assessment Tech Memo 1
reinstated in October 2019. 34 Fares were then re-suspended in response to the COVID-19 pandemic starting in
March 2020 and had not yet been reinstated as of January 2021.
Prior to the COVID-19 pandemic, The Lab @ DC developed a pilot project through which to study how providing
discounted transit would impact low-income residents. 35 The pilot, whose implementation was on hold as of
January 2021, is being organized through a partnership between The Lab @ DC, the District Department of
Transportation (DDOT), the DC Department of Human Services (DHS), and WMATA. Under the pilot, 2,500
study participants will receive assistance with varying levels of transit fares on Metrobus and Metrorail. The
fare options include no discount other than being given a SmarTrip® card with a $10 credit (control group);
half-price fares; and free unlimited trips. The research team will use surveys and other data to determine the
impact of reduced or free fares on travel behavior and other outcomes related to economic mobility and
participant well-being to inform future policy. Initial results, which could be used to inform similar initiatives for
providers across the region, are expected in late 2022 at the earliest.
Current Public Transportation Fare Media
DASH currently offers several ways for riders to pay fares. These include cash, SmarTrip® cards, Metrobus full
fare tokens, DASH Passes (both a paper version or loaded onto a SmarTrip® card), and mobile tickets
purchased on the DASH Bus app. Of these options, fare payment via SmarTrip® is by far the most popular fare
media for DASH riders, who used SmarTrip® cards to pay for 85 percent of trips from November 2019-
November 2020. 36 Less commonly, DASH riders used cash (13 percent) and mobile tickets (2 percent) during
that period. DASH launched a mobile ticketing pilot in June 2019 37 and viewed this effort as an opportunity to
play a part in advancing the goal of having a regional mobile ticketing platform that would be accepted by all
transit operators in the DC region. Despite relatively low adoption, the pilot received positive reviews from
passengers and DASH operators and was extended through March 2021.
In September 2020, WMATA launched a touch-free payment system that links SmarTrip® information with a
rider’s iPhone and Apple Watch and allows them to tap either device where a rider can tap their SmarTrip®
card. 38 Riders with a physical Senior SmarTrip® card may also transfer their card to the mobile app. These
mobile-based fare payment options are included in Table 3.
Many employers in the Washington, DC region provide SmartBenefits, 39 tax-free commute benefits to their
employees via SmarTrip® cards. These benefits allow employees to make pre-tax contributions that are
applied to their SmarTrip® cards, allowing them to pay for fares anywhere SmarTrip® cards are accepted. For
agencies such as MARC and VRE that are not on the SmarTrip® system, riders can set up a separate online
account; transfer their SmartBenefits to the account; and then use the transferred benefits to pay for fares on
these systems.
34 WAMU, D.C.’s Circulator Buses Will Charge Fares Again Oct. 1 At Council’s Order, September 2019,
https://wamu.org/story/19/09/27/d-c-s-circulator-buses-will-charge-fares-again-oct-1-at-councils-order/.
35 The Lab @ DC, Can discounted transit improve mobility and well-being for low-income residents? Accessed
January 2021, http://thelabprojects.dc.gov/fare-subsidy.
36 DASH, November 2019-2020 Hour Ridership YOY Comparison.
37 DASH, Dash Bus Mobile App Pilot Report, July 2020, https://www.dashbus.com/sites/default/files/2020-
09/DASH%20Bus%20Mobile%20App%20Pilot%20Report.pdf.
38 WTOP, Metro debuts ‘touch-free’ SmarTrip® payments with Apple Wallet, September 2020,
https://wtop.com/tracking-metro-24-7/2020/09/metro-debuts-touch-free-smartrip-payments-with-apple-
wallet/.
39 WMATA, Take Advantage of SmartBenefits, accessed January 2021,
https://www.wmata.com/business/smartbenefits/.
11Metropolitan Washington Council of Governments | City of Alexandria Low-Income Fare Pass Assessment Tech Memo 1
Costs Associated with Fare Collection
Prior to COVID-19, DASH collected about $3.7 million in farebox revenue each year for a farebox recovery ratio
of 17 percent in 2019 (just above the national average for all bus systems). 40 There are, however, expenses
that are necessary to carry out the function of collecting fares. In the case of smaller operators, the cost of
collecting fares can exceed the fare revenue that is generated from doing so, largely due to the cost of
purchasing and maintaining fareboxes combined with a lack of economies of scale.
For DASH, the operating costs of collecting fares, which total an estimated $256,000 annually, include
contributions to the Regional SmarTrip® Budget; a farebox cash collection contract with an armored truck
service; farebox maintenance and repair; and fees charged by its mobile app vendor for the sale of mobile
tickets (five percent of revenue processed). There are also significant capital costs to DASH of maintaining and
upgrading fareboxes. DASH’s recent capital costs for additional fareboxes and mobile app platform
development are about $260,000. Planned future investments, including farebox upgrades to WMATA’s new
standard and electronic validation for DASH Bus Mobile App, are $1.3 million, most of which will be funded by
the City of Alexandria’s Capital Improvement Program (CIP).
In a recent study, DASH found that it would lose an estimated $2.2 million in fare revenue if off-peak fares
were to be completely eliminated, which would decrease total annual fare revenues collected to $1.5
million). 41 After taking into account the operating (but not capital) costs associated with collecting fares,
DASH’s net fare revenue would be $1.3 million if the agency were to go fare-free during off-peak periods. A
total elimination of DASH fares would have resulted in a net loss of $3.7 million in annual fare revenues prior
to the COVID-19 pandemic, but would result in a significantly lower loss if implemented within the next 2-3
years – a period during which ridership is expected to be lower than 2019 levels.
Several additional benefits of a partial or full elimination of fares would be increased ridership (and therefore
productivity) improved operating speeds and reliability due to reduced dwell times and faster passenger
boarding, and less potential for conflict between passengers and operators.
The findings from the DASH fare collection study align with the most relevant case example in TCRP Synthesis
101 Report. 42 Lane Transit in Eugene, Oregon, which could be considered a peer agency to DASH, found, in
2012, that it would lose $5 million per year in fare revenues but save only $100,000 - $500,000 by not
collecting fares.
Regional Fare-Related Developments
There are ongoing discussions in the Commonwealth of Virginia and the Washington, DC region related to
changes to fare levels and technologies. Some of these may have implications for the City’s efforts to enhance
transit affordability and payment options. Examples of initiatives that are underway include:
Pandemic-related fare suspension – DASH and many other operators in the region ceased fare collection
in March 2020, at the beginning of the COVID-19 pandemic. Metrobus resumed fare collection and front-
door boarding, and implemented the mobile payment option through ApplePay, on January 3, 2021. As of
January 2021, DASH was continuing to operate fare-free and encouraging rear-door boarding, primarily to
ensure the safety of bus operators.
40 DASH 2019 NTD Submission; calculated by dividing total fares of $4,477,441 (including organization-paid
fares) by total operating expenses of $25,976,670.
41 Fare Free and Fare Collection Costs Analysis FY 2020; This analysis took into account the assumption that
approximately 15 percent of riders would switch from traveling during peak periods to traveling during off-
peak periods.
42 TCRP Synthesis 101: Implementation and Outcomes of Fare-Free Transit Systems. 2012.
12Metropolitan Washington Council of Governments | City of Alexandria Low-Income Fare Pass Assessment Tech Memo 1
Virginia DRPT Transit Ridership Incentive Program (TRIP) – TRIP is a new statewide grant program
dedicated to improving transit’s regional connectivity in urban areas with a population above 100,000 and
reducing barriers to transit use by supporting low-income and zero-fare programming. The TRIP application
is predicted to open in Spring/Summer 2021, and is a potential funding source for the recommendations
that emerge from this study. 43
Northern Virginia Transportation Commission (NVTC) 2021 Northern Virginia Regional Fare Collection
Strategic Plan 44 – This Strategic Plan identifies various fare-related developments occurring in the region
in the short, mid-, and long term, with a focus on the role that NVTC will play in representing the needs of
operators in the Commonwealth, including DASH. Key initiatives underway or under discussion identified in
the Plan include:
─ WMATA’s Farebox State of Good Repair Project and New Farebox Procurement – This project will
mitigate end-of-life issues of the current bus fareboxes, and lead to implementation of new bus
fareboxes with standalone SmarTrip® validators, enabling rear-door payment and all-door boarding.
─ Mobile and contactless payment options – Further implementation and promotion of the SmarTrip®
App and mobile wallet, as new potential additional self-service payment options.
─ Fare capping – Regional discussions on implementing pay-as-you-go options that automatically issue
a pass after meeting the fare payment equivalent of a daily, weekly, or monthly pass. Such options
would require back office system upgrades across the region, as well as technology and policy
changes.
─ Retail network expansion – Expansion of locations where customers can load money to fare payment
cards or accounts using cash.
─ Integration of VRE and SmarTrip® – Implementation of new system and policies to enable VRE to
offer option to pay using SmarTrip® card.
All of these initiatives will be taken into consideration in developing the recommendations of this study.
LITERATURE REVIEW
This section outlines the findings from a review of published research relating to low-income transit usage,
reduced fare program design, the relationship between fares and ridership, benefits to low-income transit
riders when fares are removed or reduced, and operational impacts that a transit agency may experience. This
literature review includes academic research papers that explore quantitative relationships between fares and
ridership as well as practically-minded research that examines real-world findings from pilot programs and
surveys. The literature review involved a review of differing methods for determining and verifying eligibility for
programs that offer fare discounts or waivers in a targeted manner.
Needs and Behaviors of Low-Income Transit Riders
Low-income riders, on average, use transit and pay for transit differently than other riders. Low-income riders
are more likely to:
43 DRPT, TRIP Transit Ridership Incentive Program, http://www.drpt.virginia.gov/transit/trip-transit-ridership-
incentive-program/
44 NVTC, 2021. https://www.masstransitmag.com/technology/fare-collection/press-
release/21205347/northern-virginia-transportation-commission-nvtc-nvtc-supports-enhanced-and-
connected-train-and-bus-fare-collection
13Metropolitan Washington Council of Governments | City of Alexandria Low-Income Fare Pass Assessment Tech Memo 1
Pay for each ride rather than use an unlimited pass. 45
Travel shorter distances.
Take more frequent transit trips. 46 Low-income riders travel
Make more transfers. 47 more often by transit and
Be unbanked or underbanked and rely on cash transactions. 48 make more transfers.
For example, in New York City, only 18 percent of low-income riders
with less than $100 in savings bought a 30-day pass, compared with 33 percent of low-income riders with at
least $100 in savings, and 38 percent of non-low-income riders. 49 Low-income riders, especially those that are
unbanked or have low savings, often have trouble paying the up-front cost of a pass, even if they would benefit
from using the pass rather than paying per ride. The inability to pay up-front for a monthly pass, as seen in the
New York City example, is likely a challenge that at least some low-income riders in the City of Alexandria also
face.
Frequent, shorter trips with more transfers means that flat fares are less likely to benefit low-income riders 50
and that the cost of transfers is more burdensome for low-income riders. In the Washington, DC region, the
cost of transfers is higher than in some other large urban areas and can only be paid with a SmarTrip,
disproportionately negatively impacting low-income riders, especially if they pay with cash. 51 WMATA proposed
removing the charge for transfers between Metrorail and Metrobus in its FY 2021 budget, 52 but
implementation appears to be on hold due to the COVID-19 pandemic.
In an analysis of proposed fare changes, the Corpus Christi Regional Transportation Authority in Texas found
that off-peak reduced fares and free transfers benefit low-income populations more than non-low-income
populations, as the low-income populations were more likely to report off-peak travel (as well as more
transfers). 53 One possible explanation for this finding is that low-income riders are more likely to work in retail
and service industries and work shifts other than standard business work day hours. It is also important to
note that all eligible low-income residents do not necessarily participate in programs for which they are eligible;
45 Rosenblum, J. 2019. How Low-Income Transit Riders in Boston Respond to Discounted Fares: A
Randomized Controlled Evaluation. http://equitytransit.mit.edu/wp-
content/uploads/2019/06/whitepaper_v8.pdf#page=5
46 Nuworsoo, C., Golub, A., & Deakin, E. 2009. Analyzing Equity Impacts of Transit Fare Changes: Case Study
of Alameda-Contra Costa Transit, California. Evaluation and Program Planning 32:4, p. 360-368.
47 Rosenblum, J. 2019. How Low-Income Transit Riders in Boston Respond to Discounted Fares: A
Randomized Controlled Evaluation. http://equitytransit.mit.edu/wp-
content/uploads/2019/06/whitepaper_v8.pdf#page=5
48 FDIC 2019 Survey: How America Banks: Household Use of Banking and Financial Services.
https://www.fdic.gov/analysis/household-survey/2019execsum.pdf
49 Community Service Society. 2016. The Transit Affordability Crisis: How Reduced MTA Fares Can Help Low-
Income New Yorkers Move Ahead. https://issuu.com/cssnyorg/docs/the_transit_affordability_crisis_fi
50 Regional Means-Based Transit Fare Pricing Study, San Francisco, 2016.
https://mtc.ca.gov/sites/default/files/Summary_MTC_Mean_Based_Overview_DRAFT_FINAL.pdf
51 Murakami, K. 2019. Metro finally makes some transfers free, but will it help those who need it most?
Washington Post: https://www.washingtonpost.com/express/2019/07/10/metro-finally-makes-some-
transfers-free-will-it-help-those-who-need-it-most/
52 WMATA FY 2021 Budget: https://www.wmata.com/about/news/FY2021-Budget-Public-
Comment.cfm#main-content
53 Corpus Christi Regional Transportation Authority Fare Equity Analysis. 2019. https://www.ccrta.org/wp-
content/uploads/2019/09/FEA-2019-Report.pdf
14You can also read