New Mexico
Head Start State
Collaboration Office
Needs Assessment
2021
←
→
Page content transcription
If your browser does not render page correctly, please read the page content below
New Mexico Head Start State Collaboration Office Needs Assessment 2021
New Mexico Head Start State Collaboration Office
           Needs Assessment 2021

                          Head Start Official Logo
                            MARCH 2021

                          Prepared by the
      University of New Mexico Cradle to Career Policy Institute

                              for the
     New Mexico Early Childhood Education and Care Department

                               nmececd.org
Table of Contents
Introduction . ....................................................................................................................................................... 1

Recent Accomplishments and Strategic Planning........................................................................................... 2

New Mexico’s Head Start Landscape................................................................................................................ 4

Head Start Providers and Enrollment............................................................................................................... 6

Findings................................................................................................................................................................. 7
       Selected Key Findings.........................................................................................................................................................7
       COVID-19 Public Health Emergency.................................................................................................................................8
       Demographics and Program Type.....................................................................................................................................10
       Collaboration with Partners..............................................................................................................................................13
       Head Start Teaching Workforce........................................................................................................................................14
       Substance Misuse...............................................................................................................................................................16
       Infant/Early Childhood Mental Health.............................................................................................................................17
       FOCUS Tiered Quality Rating and Improvement System..............................................................................................18
       Transitions............................................................................................................................................................................18
       State-Local Collaboration..................................................................................................................................................19

Conclusion............................................................................................................................................................ 20

Appendix A: Survey Instrument......................................................................................................................... 21

Appendix B: Write-In Comments....................................................................................................................... 29
Introduction
Early Head Start (EHS) and Head Start (HS) are a critical part of
New Mexico’s early childhood education and care system. EHS/HS
provide low-income and vulnerable pregnant women and children up
to the age of five an opportunity to succeed in school and life. EHS/
HS programs are funded through federal grants to local programs that
offer wrap around comprehensive services to promote strong family
engagement, family health, and families’ educational, nutritional, and social
emotional well-being. Head Start was established in 1965 and the Early Head
Start program was added in 1995, providing additional comprehensive early
childhood supports to infants and toddlers birth to age 3, pregnant mothers, and
their families. In New Mexico, these programs support 8,945 funded openings for
children and families, across 34 programs.
Head Start State Collaboration Offices (HSSCOs) exist to facilitate partnerships between Head
Start agencies and other state and Tribal entities that serve low-income children and their families. This
past year, New Mexico’s Head Start State Collaboration Office became part of the state’s new Early Childhood
Education and Care Department (ECECD), elevating it to the Office of the Secretary. Under this structure, the
state’s first-ever Assistant Secretary for Native American Early Childhood Education and Care has made it a
priority to strengthen state collaboration with Tribal Head Start programs.
As part of the new Department’s aim to create a more cohesive, equitable, and effective early childhood
system in New Mexico, the Head Start State Collaboration Office serves an important role in the coordination
of programs. Its facilitation of communication, data sharing, and service coordination is critical for creating a
system that works for children and families, meets the needs of communities, and makes efficient use of limited
resources from federal, state, local, and private sources.
The Head Start Act as noted under Sec. 642B (4)(A)(i) requires the Head Start Collaboration Office (HSCO) to
conduct an Annual Needs Assessment that addresses the needs of Head Start agencies (including Early
Head Start agencies) with respect to coordination, collaboration, alignment of services, and alignment
of curricula and assessments used in Head Start programs with the Head Start Child Outcomes
Framework and, as appropriate, the State Early Learning Standards. The Head Start Act also
requires HSCO to use the results of the Needs Assessment to develop goals outlining how it
will assist and support Head Start agencies in meeting the requirements of the Head Start
Act, and to assist Head Start agencies to collaborate with entities involved in state and
local planning processes to better meet the needs of low-income children from birth
to school entry, and their families; and to assist Head Start agencies to coordinate
activities with the state agency responsible for administering the state program carried
out under the Child Care and Development Block Grant Act of 1990 (42 U.S.C. 9858 et
seq.) and entities providing resource and referral services in the state.
This report describes New Mexico’s efforts to build collaborative partnerships between
Head Start and Early Head Start programs and a wide range of state and local
agencies serving low-income children and families. In addition, data in the report
highlights the state’s progress in supporting Head Start as an integrated part of New
Mexico’s overall early childhood system and can be used to guide future endeavors to
improve or refine these efforts.
The 2021 needs assessment focuses on federal priorities for collaboration, while also
recognizing that the COVID-19 pandemic has placed unprecedented strain on low-income
families with young children. This year’s Head Start Needs Assessment reports new data
on the needs and successes of Head Start programs in responding to the public health
emergency, along with their broader, long-term needs related to collaboration with the rest
of New Mexico’s early childhood system. Data were gathered through a dedicated online survey
distributed to Head Start and Tribal Head Start grantees.
ECECD and the New Mexico Head Start State Collaboration Office are grateful to the Head Start programs
that completed the survey and provided their invaluable input, as well as for the resilience and dedication of the
educators in programs like Head Start and Early Head Start who serve and support New Mexico’s families with
young children.

                                                                                                                     1
Recent Accomplishments and Strategic Planning
Head Start Strategic Plan
The input from this assessment will be used to guide New
Mexico in implementing its 2018-2023 Head Start Strategic
Plan. The strategic plan is designed to help build early                     New Mexico Head Start
childhood systems and access to comprehensive services                      State Collaboration Office
for all children served. It also aims to encourage widespread
collaboration to augment Head Start’s capacity to be a partner        Vision: Improve the quality of life
in state initiatives, and to facilitate Head Start involvement        for New Mexico children through
in the development of state policies, plans, processes, and
decisions affecting the Head Start target population and other        school readiness.
low-income families.                                                  Mission: Prepare New Mexico
The Head Start strategic plan informs the following priorities        children for school while
for the Head Start State Collaboration Office:
                                                                      providing their families with
 • Strengthen and continue collaboration with the New Mexico          access to community resources
   Head Start Association
                                                                      and comprehensive support
 • Partner with New Mexico’s Early Head Start-Child Care
                                                                      services to ensure their children’s
   Partnership grantees
                                                                      success in school.
 • Support the state’s efforts to collect early childhood
   program and outcome data
 • Participate in workforce development strategies and
   initiatives
 • Collaborate with the state’s Tiered Quality Rating and Improvement System
 • Engage local education agencies to promote collaboration with Head Start
 • Coordinate with Region VI, Region XI (American Indian/Alaska Native) and Region XII (Migrant Seasonal)
   Collaboration Directors

New Mexico Early Childhood Strategic Plan
While New Mexico’s Head Start Collaboration Office is guided by its own five-year strategic plan, Head Start and
Early Head Start programs are also deeply integrated into New Mexico’s first Statewide Early Childhood Strategic
Plan - a plan also guided by the input and voices of New Mexico families, Tribes and early childhood educators.
This plan, which spans 2021 to 2024, is the result of a comprehensive early childhood needs assessment that was
conducted with federal Preschool Development
Grant Birth to 5 (PDG B-5) funds. The strategic plan
is divided into six overarching goal areas around
families, governance, workforce, funding, data, and
Tribal early childhood. Head Start and Early Head
Start are included in each goal area, and are also
elaborated more specifically in a few key areas
including:

 • Development of aligned service requirements
   across Head Start, New Mexico PreK (NM PreK),
   and Bureau of Indian Education (BIE) schools to
   support seamless transitions between services
   for all children, including those with disabilities
   or learning differences;
 • State engagement with the New Mexico
   Head Start Association (NMHSA) to support
   development and enhancement of partnerships
   with NM PreK, BIE, and family child care
   providers;

                                                                                                             2
• State partnership with the NMHSA to maximize all
   available federal funding, including applying for Early
   Head Start-Child Care Partnership grants and other
   funding opportunities;
 • Provision of state technical assistance and
   consultation for programs on how to effectively
   blend or layer funding to expand services in NM
   PreK, child care, and Head Start;
 • Provision of state funding to help fill gaps where
   federal funds do not cover the costs needed for a
   child’s success (e.g., Head Start 20 percent cost
   match);
 • Establishment of a working group to develop
   common guidelines for shared data use across early
   childhood systems; and
 • Strengthening of early childhood collaboration
   between state and Tribal governments, including
   improved integration of Tribal Head Start grantees.

Recent Accomplishments
Beginning on July 1, 2020, the New Mexico Head
Start State Collaboration Office (HSSCO) is now
administered by the Early Childhood Education
and Care Department. Under HSSCO Director Olga
Valenzuela-Zavala, the office assists with relevant
state initiatives and brings the perspective of Head Start to the development of the state’s comprehensive early
childhood system.
Recent HSSCO highlights include:

 • The Early Childhood Education and Care Department (ECECD) elevated the Head Start State Collaboration
   Office to the Office of the Secretary.
 • Assistant Secretary for Native American Early Childhood Education and Care, Jovanna Archuleta, has been a
   key partner in the collaboration among Tribes, Pueblos, and Nations within New Mexico to increase support and
   services through Head Start and other early childhood systems.
 • In December 2020, NMHSA hosted a virtual conference for Region VI, which includes Arkansas, Louisiana, New
   Mexico, Oklahoma, and Texas. The first virtual Mega Conference was called Head Start – The Shining Rainbow
   During the Storm. It was attended by nearly 600 participants, who were welcomed by Governor Michelle Lujan
   Grisham and ECECD Secretary Elizabeth Groginsky.
 • Early Head Start and Head Start programs continued to provide services to families during the COVID-19
   pandemic, with some programs providing in-person services to essential workers while others provided
   services virtually. In collaboration with public schools, Head Start providers were also key partners in ensuring
   that Head Start children and their families had access to drive-up or delivery meals. Children with special
   needs continued to receive critical supports, either virtually or in person.
 • The New Mexico HSSCO and the NM Head Start Association coordinated fifteen slots for a Classroom
   Assessment Scoring System (CLASS) Training for Trainers offered to Head Start and Tribal Head Start programs
   across the state. The training, funded with PDG B-5 funds, aimed to build capacity and fidelity in the CLASS
   process.

                                                                                                                       3
• Nearly 600 Early Head Start and Head Start professionals engaged in
   Quorum, an online professional development learning platform.
 • Scholarships were granted to 260 Head Start professionals seeking early
   childhood degrees.
 • The American Academy of Pediatrics provided a grant to support a
   campaign on Substance and Opioid Misuse and Prevention.

New Mexico’s Head Start
Landscape
New Mexico is home to many children who are eligible for and in need of the supports
that Early Head Start and Head Start programs provide. In general, Early Head Start or Head
Start services are available to families of young children at or below 100 percent of the Federal
Poverty Level, with additional eligibility categories for families experiencing homelessness, children in
foster care, children with special needs, and families receiving other forms of public assistance.
According to 2019 U.S. Census data, New Mexico’s population was just under 2.1 million people, with a median
age of 38.6. The population of New Mexico is racially and culturally diverse, consisting of residents who are
49.3% Hispanic or Latino, 36.8% White, and 11% American Indian and Alaskan Native. New Mexico is home to 23
Pueblos, Tribes and Nations; 34% of New Mexicans speak a non-English language, and 94.5% are U.S. citizens.
New Mexico’s median household annual income of $49,754 is less than the nationwide median annual income by
approximately $13,000. About 18.2% of New Mexicans live below the poverty line, compared with the national rate
of 10.5%. The largest demographic living in poverty are females ages 25 to 34, followed by females 18 to 24. In
2019, 5.8% of New Mexico’s population is reported as under 5 years of age, and 22.7% are under 18 years old.
In 2019, there were 116,978 children birth to age five in New Mexico. Of these, 28.9% were living at or below
the federal poverty level, which in 2019 was set at an annual income of $21,330 for a family of three. The total
number of births in New Mexico in 2019 was 22,966. Of these, 56% were Hispanic, 27.1% White, 12% Native
American, 2.3% Asian, 2% Black, and 0.2% another race or ethnicity. Data reported in 2015 show that 72% of
births in the state are Medicaid-funded.
Public school data reported to the U.S. Department of Education during the 2018-2019 school year indicates that
an estimated 11,588 New Mexico public school students experienced homelessness over the course of the year.
Of that total, 1,251 students throughout the state were unsheltered, 1,159 were in shelters, 603 were in hotels/
motels, and 8,575 were doubled up in their living arrangement.
Feeding America reports a 2018 food insecurity rate for New Mexico of 15.1%, with a child food insecurity rate of
23.8% (114,180 children). It estimates a 30% increase in child food insecurity during the 2020 pandemic, reaching
a rate of 30.8% of the state’s children. During the 2019-20 school year, Early Head Start and Head Start programs
in New Mexico provided 753,377 vital, nutritious meals and snacks.
According to the New Mexico Department of Health’s 2021 Substance Use Epidemiology Profile, alcohol-related
deaths (including deaths from chronic diseases strongly associated with heavy drinking and deaths due to
alcohol-related injuries) in New Mexico totaled 7,281 between 2015 and 2019. This is a rate of 67.1 per 100,000.
Among states, New Mexico has rated first, second or third in alcohol-related deaths for the past thirty years.
Since 1990, New Mexico’s death rate for alcohol-related injury alone has ranged from 1.4 to 1.8 times the national
rate. In addition, the Centers for Disease Control and Prevention reports that the state had the 15th highest
drug overdose rate in the country in 2018 at a rate of 26.7 per 100,000. Opioid overdose-related emergency
department visits occurred at a rate of 57.8 per 100,000, affecting 6,255 New Mexicans between 2014 and 2018.

                                                                                                                   4
FIGURE 1: NEW MEXICO HEAD START AND EARLY HEAD START PROGRAM LOCATIONS

                                                                         5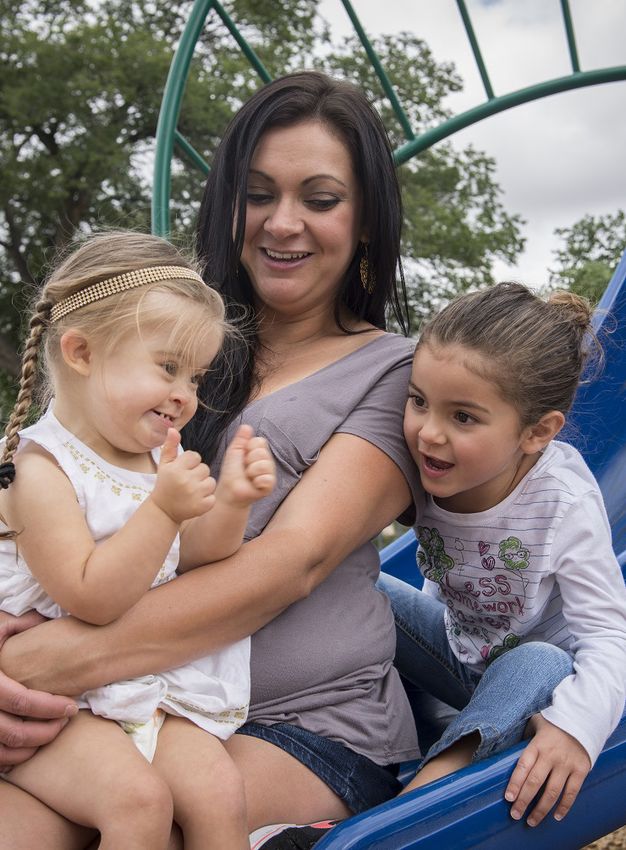
Head Start Providers and Enrollment
Head Start and Early Head Start programs in New Mexico reflect the characteristics of the state – rural and
urban, culturally diverse, and rich in human and community values. As seen in Figure 1, New Mexico has 34
Head Start and Early Head Start programs with a total of 8,945 funded openings in 2020. In a typical year, HS/
EHS programs in the state serve over 10,000 children. Cumulative enrollment totals are not available this year
due to the COVID-19 public health emergency. Of the 34 grantees, 16 are Tribal. In 2020, federal and Tribal Head
Start and Early Head Start awards in New Mexico totaled $96,608,145. This amount does not include Head Start
funding on the Navajo Nation.

                                         TABLE 1. FUNDED ENROLLMENT BY PROGRAM

   2020 Regional and Tribal Early Head Start/Head Start Funded Enrollment
   Program Name                                             Program Type         Early Head Start   Head Start
   Alamo Navajo School Board, Inc.                          AIAN                 44                 64
   Child and Family Services Inc. of Lea County             Regional             55                 257
   City of Albuquerque Early Head Start                     Regional             128
   CPLC HS/Multi‐State Migrant and Seasonal                 Migrant                                 107
   Eastern Plains Community Action Agency, Inc.             Regional             102                329
   Eight Northern Indian Pueblos Council, Inc.              AIAN                                    36
   El Grito, Inc. Head Start                                Regional             24                 161
   Five Sandoval Indian Pueblos Inc.                        AIAN                                    53
   Help ‐ New Mexico, Inc.                                  Regional             88                 319
   Jicarilla Apache Nation                                  AIAN                 65                 102
   La Clinica De Familia Inc.                               Regional             231
   Laguna Department of Education                           AIAN                 52                 115
   Las Cruces School District #2                            Regional                                413
   Mescalero Apache Tribe                                   AIAN                                    120
   Mid‐West New Mexico Community Action Program             Regional             56                 667
   Mora Independent School District                         Regional             64                 51
   Native American Professional Parent Resources, Inc.      Regional             72
   Navajo Nation                                            AIAN                 17                 513
   New Mexico State University                              Regional             32                 228
   Ohkay Owingeh Tribal Council                             AIAN                                    81
   Presbyterian Medical Services, Inc.                      Regional             552                625
   Pueblo of Acoma (Inc.)                                   AIAN                                    90
   Pueblo of Isleta                                         AIAN                 48                 87
   Pueblo of Jemez                                          AIAN                                    68
   Pueblo of San Felipe                                     AIAN                                    96
   Pueblo of Santa Clara                                    AIAN                                    38
   Pueblo of Taos                                           AIAN                 14                 36
   Pueblo of Zuni                                           AIAN                                    153
   Ramah Navajo School Board Inc.                           AIAN                                    60
   Region IX Education Cooperative                          Regional             44                 115
   Santo Domingo Tribe‐ Kewa Health Outreach Program        AIAN                 94                 120
   Southeast NM Community Action Corporation                Regional                                679
   West Las Vegas Schools                                   Regional             36                 140
   Youth Development Inc.                                   Regional             392                812
   TOTAL FUNDED ENROLLMENT                                  8,945                2,210              6,735

                                                                                                                   6
Methodology
Directors of 23 Head Start and Early Head Start programs
from urban, rural, and Tribal regions throughout New Mexico
responded to an online survey conducted in February 2021.
The 2021 Head Start Need Assessment survey included a total
of 96 questions under the following eight category areas:

 • COVID-19 Public Health Emergency
 • Demographics
 • Collaboration with Partners
 • Workforce
 • Substance Misuse
 • Infant/Early Childhood Mental Health
 • FOCUS Tiered Quality Rating and Improvement System
 • Transitions
 • State-Local Collaboration
The survey instrument is included as Appendix A and all write-in comments are provided in Appendix B of this
report.
This report is based on the results of the survey. The questions were developed with input from Head Start
grantees, under the direction of the New Mexico HSSCO and ECECD. The survey and report were conducted on
behalf of ECECD by the University of New Mexico Cradle to Career Policy Institute.

Findings
Selected Key Findings
Findings from the Needs Assessment survey demonstrate the ways in
which Early Head Start and Head Start grantees adapted to the unique
circumstances of the COVID-19 public health emergency in the past year.
Survey respondents largely provided services virtually, and most programs
reported that they provided portable computing devices to families to
facilitate distance learning, though internet connectivity remained an issue.
Enrollment dropped significantly for most survey respondents, and more
than half reported that decreased enrollment would present a barrier to
full re-opening.
Despite the obvious challenges of the past year, programs also reported a
variety of accomplishments and positive developments that emerged from
the public health emergency. Programs reported that with fewer people
on-site, they were able to complete needed upgrades to their facilities, and
that virtual learning created new times and opportunities for early childhood
educators to focus on higher education. Programs also reported that they were
able to promote food security for families through meal delivery or drop-off options.

                                                                                                               7
Some survey findings reflect the substantial population of respondents (35 percent)
who direct Tribal Head Start or Early Head Start programs. Overall, responses show
American Indian children among the largest population of children served and
reflect some challenges around conflicting communication from ECECD and from
Tribal governments, particularly around COVID-19 reopening guidance. In general,
programs reported that they were well-supported by ECECD during the public
health emergency and that communication was clear and ample. Some critical
feedback suggested that communication was sometimes overwhelming, and that
much of it seemed more tailored to NM PreK and child care programs than to Head
Start grantees.
Respondents reported generally high levels of collaboration with partners, though there
was considerable variation across service agency programs. Grantees reported particularly
high levels of collaboration with Family Infant Toddler (Early Intervention) programs, and high-to-
moderate collaboration with other closely related services such as public schools, community health centers,
and ECECD itself. Lower levels of collaboration were reported with housing partners such as youth shelters,
transitional housing, and McKinney-Vento liaisons, and with Tribal partners such as Bureau of Indian Education
schools and Indian Child Welfare Agencies.
In the critical area of supporting and developing the Head Start workforce, programs reported relatively
high levels of partnership with higher education institutions and workforce training programs, though these
relationships were sometimes challenging to maintain. Survey results show a significant minority of programs
who were not aware that workforce scholarships were available for early childhood educators, or who cannot
access such scholarships. State early childhood scholarships are not available to programs that aren’t licensed
by the state – a category that includes many Tribal grantees.
Survey respondents indicated that substance misuse is a significant challenge facing the families they serve. Yet,
among the group of respondents who rated substance misuse as a moderate to large issue in their communities,
about half had limited or no collaboration with substance use treatment agencies. This finding affirms the
need for a public awareness campaign related to opioid and other
substance misuse, which is among the NM Head Start Collaboration
Office’s plans for the coming year.
COVID-19 Public Health Emergency
When asked whether they had remained open for in-person
services during the COVID-19 public health emergency,
more than 90 percent of respondents reported
they had been closed temporarily or throughout
the public health emergency (to date) for
in-person services. Fifty-two percent of
respondents reported lower enrollment as
an issue preventing or delaying re-opening,
while 39 percent said staffing shortages
prevented or delayed re-opening as
well (Figure 2). Tribal respondents noted
potential contradictions between Tribal
and state authorities’ recommendations
to stay closed or to instead re-open with
enhanced safety practices.
860%
52.2%
Figure 3. Issues that prevented
FIGURE or delayed
2. ISSUES THAT reopening
PREVENTED for
OR DELAYED in‐program
REOPENING services SERVICES
FOR IN-PROGRAM
50%
60% 39.1%
40% 52.2%
50%
30%
39.1% 21.7%
40% 17.4%
20%
30%
10% 21.7% 4.3%
20% 17.4%
0%
Lower enrollment Staffing shortage Lack of PPE Difficulty meeting Sanitation issues
10%
social distancing 4.3%
requirements
0%
Lower enrollment Staffing shortage Lack of personal Difficulty meeting Sanitation issues
When asked what they perceived families’ highest needs
protective to be, internet
equipment social connectivity
distancing was ranked the
highest, followed by food security and mental/behavioral health. Additional requirementsneeds reported were
“adequate housing allowing families to social distance,” dependable child care, “transportation to
needed resources,”
When asked what theyandperceived
educationfamilies’
and training about
highest health
needs behaviors,
to be, internetincluding the COVID-19
connectivity was ranked vaccine.
the
When asked what they perceived families’ highest needs to be, internet connectivity was ranked the highest,
highest,
followedSeventy followed
by foodpercent
security by food security and mental/behavioral health. Additional needs reported werehousing
ofand mental/behavioral
respondents reported that health.
theirAdditional needs
local education reported
agencies met were “adequate
the needs of young
allowing “adequate
families tohousing allowing families
social distance,” to social
dependable distance,”
child dependable child
care, “transportation to care,
needed“transportation
resources,” andto education
children
and training about
with special educationincluding
health behaviors,
needs moderately
the COVID-19
to extremely
vaccine.
well (Figure 2). Still, in open-ended
needed resources,” and education and training about health behaviors, including the COVID‐19 vaccine.
comments respondents mentioned that virtual services generally are “not supportive to special
Seventy percent of respondents reported that their local education agencies met the needs of young children
education
Seventy
with special needs”
percent
education ofand
needs can be difficult
respondents
moderately tofor
reported children and
that their
extremely well parents,
local butStill,
education
(Figure 3). may beopen-ended
agencies
in “better
met thethan nothing.”
needs Some
of young
comments
noted that
children getting
with families
special with
education young
needs children
moderately to participate
to extremely consistently
well (Figurein virtual
4). Still,
respondents mentioned that virtual services generally are “not supportive to special education needs” and can services
in was
open‐endeda
challenge,
be difficult
comments while
for children others
and
respondents remarked
parents but on
mentioned may long
that be waiting
“better
virtual times
than to
services get children
nothing.”
generally Some
are screened,
“not noted referred
that
supportive andfamilies with
getting
to special
young children to
evaluated. participate consistently in virtual services was a challenge, while others
education needs” and can be difficult for children and parents but may be “better than nothing.” Some remarked on long
waiting times to get children screened, referred, and evaluated.
noted that getting families with young children to participate consistently in virtual services was a
Figure 2. How well local LEAs met the needs of children with disabilities during the pandemic
challenge,FIGURE
while3.others remarked
HOW WELL onMET
LOCAL LEAs long
THEwaiting times
NEEDS OF to get
CHILDREN children
WITH screened,
DISABILITIES DURING referred,
THE PANDEMICand
evaluated.
50%
43.5%
Figure
45% 4. How well local LEAs met the needs of children with disabilities during the pandemic
40%
50%
35%
45% 43.5%
30%
40%
25% 21.7% 21.7%
35%
20%
30%
15%
25% 8.7% 21.7% 21.7%
10%
20% 4.4%
5%
15%
0%
8.7%
10% Extremely poorly Fairly poorly Moderately well Fairly well Extremely well
4.4%
5%
0% 11
Extremely poorly Fairly poorly Moderately well Fairly well Extremely well
9Respondents did report positive developments during the public health
emergency. Just over a quarter of respondents noted that without
children or staff present on-site full time, they were able to complete
facility upgrades, or their staff were able to participate in more
professional development or concentrate on classes to complete
their degrees. Another 17 percent reported that they and their
communities were proud to be able to deliver meals and protect
food security by delivering meals directly to families, while 13 percent
saw strength in the adaptations and innovations that programs
employed to creatively meet the needs of families.
When asked whether they were able to maintain enrollment
throughout the public health emergency, almost three quarters said
that their enrollment had dropped significantly, but they were still
serving about half of their original families. Only 4 percent reported losing
more than half of their enrollment. However, 70 percent of respondents
reported that less than half of their enrolled families are experiencing in-
person services. Only 9 percent of respondents indicated that all or most families
in their program were receiving in-person services.
Respondents reported that their programs met the technological needs of families as most
shifted to distance learning. Seventy-four percent of respondents reported that all or most students in their
program had access to a technological device like a tablet or a laptop, and two-thirds of respondents affirmed
that their program helped distribute devices to families. Still, reliable connectivity was an issue.
Sixty-one percent of respondents reported that about half of their families had issues with
connectivity.
When asked whether they thought ECECD provided clear communication during the
public health emergency, 70 percent reported that the messaging was clear most of
the time. While many respondents praised weekly calls and emails from ECECD,
a few noted that policies and expectations sometimes changed frequently.
Some respondents felt that the information they received from the state
was sometimes in conflict with their Tribal governing authority, while others
perceived that much of the information “was aimed toward programs providing
child care or Pre-K.” Overall though, people saw ECECD communication as
consistent, helpful, and informative.
Respondents said they were thankful for personal protective equipment (PPE)
supplies, food resources, masks, and infant gift packages that helped meet
the needs of their families. Reflecting on challenges from state agencies, some
did comment that testing and vaccines were not especially well-coordinated
among state agencies, with one lamenting the lack of state prioritization of early
childhood providers for receipt of the COVID-19 vaccination.
Demographics and Program Type
Survey respondents reported that their programs served a total of 20 of the state’s
33 counties (61 percent). Four respondents reported serving Cibola County, while three
respondents each reported serving Doña Ana, McKinley, and Sandoval Counties. Seventy-four
percent of respondents reported serving one or two counties, with a minority reporting serving
three or more.
Thirty-five percent of programs offered both Early Head Start and Head Start, while 35 percent reported Tribal
affiliation. Fifteen percent offered only Head Start and the final 15 percent offered only Early Head Start (Figure
4). No migrant seasonal programs provided data for the survey.
10s by program type
FIGURE 4. SURVEY RESPONDENTS BY PROGRAM TYPE
35% Both of New Mexico’s Early Head Start-Child Care (EHS-CC)
Partnership grantees responded to the survey. The EHS-CC
Partnership is a program in which Early Head Start (EHS)
grantees partner with local child care centers and family child
15% care programs. These partnerships layer funding in order
EHS HS Tribal HS/EHS HS + EHS
to provide comprehensive services and high-quality early
learning environments for low-income working families with
35% infants and toddlers.
Both programs that are Early Head Start‐Child Care (EHS‐CC) Partnership grantees responded to the C
Among the programs surveyed, American Indian or Alaska I
survey. The EHS‐CC Partnership is a 15%
program in which Early Head Start (EHS) grantees partner with local
Native (AIAN) children comprise the largest demographic
child care centers and family child care programs.group.
TheseThis
partnerships layergiven
is unsurprising funding in order
that just tothird
over a provide
of
programs in the survey sample are Tribal Head
comprehensive services and high‐quality early learning environments for low‐income working families Start or
Early Head Start grantees. Programs who took the survey
with infants and toddlers. reported on average that 58 percent of their families are
AIAN. Eight programs reported that 95 percent or more of
Among the programs surveyed, American Indian the or Alaska
familiesNative (AIAN)were
they served children
AIAN. comprise
Hispanic/ the largest
demographic group. This 35% Latino families account for 22 percent
is unsurprising given that just over a third of programs in the survey sample are
of families served in the sample, on
Tribal Head Start or Early Head Start grantees. Allaverage.
programs who
White took the
families make survey
up reported on average
that 58 percent of their families are AIAN. Eight programs
on averagereported
about 12 that 95 percent or more of the
percent
of families served, and other
families they served were AIAN. Hispanic/Latino families account for 22 percent of families served in the
EHS HS Tribal HS/EHS HS + EHS racial and ethnic groups
sample, on average. White families make up on average
composeabout 12 percent of families served, and other
an exceedingly
racial and ethnic groups compose an exceedinglysmallsmallproportion
proportion of of families served (Figure 6).
families served (Figure 5).
(n = 2Figure
programs)
6. FIGURE
reported
Racial5. and
that
ethnic
they are
identities of
Early Head
children served
Start-Child
by survey
Care (EHS-CC)
respondents
HS-CC Partnership isRACIALa program in which Early Head Start (EHS) grantees
AND ETHNIC IDENTITIES OF CHILDREN SERVED BY SURVEY RESPONDENTS
centers and family child care programs. These partnerships layer funding in
Asian American 0.4%
sive services and high-quality early learning environments for low-income
s and toddlers. Other race 0.8%
African American 1.4%
ed, American Indian or Alaska Native (AIAN) children comprise the largest
unsurprising given thatMixed just race
over a third6.3%
of programs in the survey sample are
ad Start grantees. All programs White who took the survey reported on average
11.5%
lies are AIAN. Eight programs reported that 95 percent or more of the
Hispanic/Latino 22.0%
AN. Hispanic/Latino families account for 22 percent of families served in the
amiliesAmerican
make up Indian
onoraverage
Alaska Native
about 12 percent of families served, and other 57.8%
mpose an exceedingly small proportion 0% of families
10% 20%served30%
(Figure 40%
4). 50% 60% 70%
entities of children served by survey respondents
0.4%
0.8%
1.4%
6.3%
11
11.5%Respondents reported that English was spoken by 84 percent of the families they serve, followed
distantly
Respondents by Spanish
reported thatatEnglish
about 9was
percent (Figure
spoken 7). percent of the families they serve, followed distantly by
by 84
Spanish at about 9 percent (Figure 6).
Figure 7. Languages spoken by children served by survey respondents
FIGURE 6. LANGUAGES SPOKEN BY CHILDREN SERVED BY SURVEY RESPONDENTS
East Asian languages 0.2%
Middle Eastern langages 0.3%
Other languages 1.5%
Indigenous languages 5.2%
Spanish 8.5%
English 83.7%
0% 10% 20% 30% 40% 50% 60% 70% 80% 90%
About 35 percent of programs reported that they use a language immersion program. Of this group, 57
percent
About 35 percentreported teachingreported
of programs in indigenous languages
that they use asuch as Keres,
language Navajo, and Tewa while the remaining
immersion
program.
43 Of this group,
percent 57 teaching
reported percent reported
in Spanish.teaching in indigenous
Among respondents not offering a language immersion
languages such as
program, Keres,
several Navajo,
said andhad
that they Tewa while staff,
bilingual the remaining 43
but not a formalized language immersion approach,
percent reported teaching in Spanish. Among respondents not
noting a desire to further explore what such a framework would look like. One respondent noted that
offering a language immersion program, several said that they
for their
had bilingual indigenous
staff, but notlanguage, therelanguage
a formalized is a “lack immersion
of educational material.”
approach, noting a desire to further explore what such a
Programs
framework would shared a variety
look like. One of strategies they
respondent noteduse for for
that maximizing dual language learning. Bilingual staff
their indigenous language, there is a “lack of educational that they label things around the classroom with
were a key component, and many respondents stated
material.”
both languages, provide visual examples, and use interpreters if necessary (including for parent
meetings).
Programs shared One respondent
a variety mentioned
of strategies they using picture cards, song, and dance to help immerse children in
use for
maximizing dual language
non‐written learning.
indigenous Bilingual
languages, whilestaff weredescribed trying to create “a welcoming environment,
another
a key component, and many respondents stated that
promote positive relationships and build family engagement partnerships.”
they label things around the classroom with both
languages, provide
Seventy visual
percent examples, and
of respondents use interpreters
reported serving one or more children in the care of non‐parental kin.
if necessary (including for parent meetings). One have 10 or more children in kinship care, while 14
Of these, 36 percent estimated their programs
respondent mentioned using picture cards, song, and
percent
dance to reported having
help immerse childrenmore than 20 children
in non-written in such care.
indigenous
languages, while another described trying to create “a
welcoming environment, promote positive relationships and
build family engagement partnerships.”
Collaboration with Partners
SeventyInpercent
general,of respondents
respondents reported
reported highserving one orlevels
or moderate moreof collaboration with partners. In communities
children in the care of non-parental kin. Of these, 36 percent
where
estimated these
their serviceshave
programs exist,10more than children
or more 80 percent
in of respondents
kinship care, indicated moderate to high
collaboration
while 14 with community
percent reported having more health centers,
than ECECD,inWomen,
20 children Infants & Children (WIC), Temporary
such care.
Assistance for Needy Families (TANF), Supplemental Nutrition Assistance Program (SNAP), and Local
Education Agencies (LEAs) for kindergarten transitions as well as IDEA Part B and C transitions. Seventy
five percent noted moderate to high collaboration with Medicaid, Child Protective Services, behavioral
and mental health services, and pediatric clinics (Figure 6).
12Collaboration with Partners
In general, respondents reported high or moderate levels of collaboration with partners. In communities where
these services exist, more than 80 percent of respondents indicated moderate to high collaboration with
community health centers, ECECD, Women, Infants & Children (WIC), Temporary Assistance for Needy Families
(TANF), Supplemental Nutrition Assistance Program (SNAP), and Local Education Agencies (LEAs) for kindergarten
transitions as well as IDEA Part B and C transitions. Seventy five percent noted moderate to high collaboration
with Medicaid, Child Protective Services, behavioral and mental health services, and pediatric clinics (Figure 7).
About 50 percent of respondents indicated moderate or high collaboration with other partners including infant
mental health consultants, parenting classes, substance treatment agencies and family shelters. Youth shelters,
Indian Child Welfare Agencies and Bureau of Indian Education community schools were all ranked lowest at 30
percent or less for moderate to high collaboration.
FIGURE 7. STRENGTH OF COLLABORATION BY PARTNER ORGANIZATION TYPE
Early Childhood Education and Care Department
Local domestic violence agency
Indian Child Welfare agencies
Child Protective Services (CYFD)
Early childhood coalitions
Libraries/museums
Parenting/grandparenting classes
Tribal Indian Health services/clinics
Substance/opioid awareness and/or treatment programs
Infant/early childhood mental health services
Behavioral and mental health services
Pediatric practices/clinics
Community health centers
Local public health/DOH office
McKinney‐Vento Liaisons
Transitional housing
Youth shelters
Family shelters
Women, Infants & Children (WIC)
Food Distribution Program on Indian Reservations (FDPIR)
Food pantries/commodities
Food Stamps (SNAP)
Medicaid
Temporary Assistance for Needy Families
BIE community schools
Pre‐K (Public schools and community‐based)
Home visiting programs
Child care licensing
IDEA Part C (Family Infant Toddler program)
IDEA Part B (ages 3‐5 special education)
LEAs/Public Schools (Kindergarten transitions)
0% 10% 20% 30% 40% 50% 60% 70% 80% 90% 100%
High Moderate Limited None N/A
13working at their program sites (67 sites in total). Across these sites, degree attainment data were
reported for 292 total early childhood educators (244 lead teachers and 48 assistant teachers). Among
lead teachers who held any degree, 40 percent had a bachelor’s degree or higher. For assistant teachers,
Head Start Teaching Workforce
thisSurvey
number is just over 10 percent. Associate degrees were more common among educators, held by
respondents provided information on educational credentials and
about 60 percent
certificates ofbythe
earned degreed
teachers leadatteachers
working in the
their program sample
sites and about 90 percent of the degreed
(67 sites
in total). Across these sites, degree attainment data were reported for
assistant teachers (Figure 7).
292 total early childhood educators (244 lead teachers and 48 assistant
teachers). Among lead teachers who held any degree, 40 percent had a
Respondents reported
bachelor’s degree thatFor
or higher. their staff hold
assistant a total
teachers, this of 124 Child
number is just Development Certificates, 125 Child
over 10 percent. Associate degrees were more common among educators,
Development Associate degrees, and 4 bilingual certifications. No educators were reported as having an
held by about 60 percent of the degreed lead teachers in the sample and
infant mental
about health
90 percent endorsement.
of the degreed assistant teachers (Figure 8).
Respondents reported that their staff hold a total of 124 Child Development
SeeCertificates,
“Head Start 125Workforce Education”
Child Development Excel
Associate file for
degrees, anda 4full breakdown by site (table is a bit too big to fit
bilingual
certifications. No educators were reported as having an infant mental health
nicely in report as appendix, also may be too much detail for this report)
endorsement.
Figure 7. Distribution of degree attainment among degreed educators
FIGURE 8. DISTRIBUTION OF DEGREE ATTAINMENT AMONG DEGREED EDUCATORS
100%
90%
80%
70% 59.8%
60%
89.6%
50%
40%
30%
20% 36.9%
10%
3.3% 2.1% 8.3%
0%
Lead Teachers Assistant Teachers
Master's Bachelor's Associate
DataData note:
note: Surveyrespondents
Survey respondents werewereasked to provide
asked the number
to provide of educators,
the number by site, with by
of educators, certain
site,degrees and credentials.
with certain degrees These
and credentials.
percentages reflect the distribution among educators with degrees, and do not indicate that 100% of Head Start educators have a degree.
These percentages reflect the distribution among educators with degrees, and do not indicate that 100% of Head Start
educators have a degree.
Respondents described a variety of needs related to staff professional development. Responding to an open-
ended question, almost 30 percent indicated that infant mental health training was needed, and 24 percent
reported a need for resources on teacher-child interactions (Figure 9). Eighteen percent of respondents noted
that professional development around assessments and the Classroom Assessment Scoring System (CLASS)
were needed,
Respondents while 12 percent
described eachof
a variety reported
needsarelated
need fortoprofessional development
staff professional on dealing with
development. and
Responding
to an
documenting challenging behaviors, designing high-quality lesson plans, and fostering family engagement.
open-ended question, almost 30 percent indicated that infant mental health training was needed, and
24 percent reported a need for resources on teacher-child interactions (Figure 8). Eighteen percent of
respondents noted that professional development around assessments and the CLASS were needed,
while 12 percent each reported a need for professional development on dealing with and documenting
challenging behaviors, designing high-quality lesson plans, and fostering family engagement.
14Family engagement 11.8%
Figure 8. Greatest professional development needs
FIGURE 9. GREATEST PROFESSIONAL DEVELOPMENT NEEDS
Lesson plans 11.8%
Family engagement 11.8%
Challenging behaviors 11.8%
Lesson plans 11.8%
CLASS 17.6%
Challenging behaviors 11.8%
Assessment 17.6%
CLASS 17.6%
Teacher-child interactions
Assessment 17.6% 23.5%
Infant mental health
Teacher-child interactions 23.5% 29.4%
Infant mental health
0% 5% 10% 15% 20% 25% 29.4%
30% 35%
0% 5% 10% 15% 20% 25% 30% 35%
About 70 percent of respondents reported that they have a partnership with a higher education
institution
About or70training
percentprogram, whilereported
of respondents about 30 percent
that reported
they have they had
a partnership withno partner.
a higher Respondents
education
About 70 percent
reported of
having or respondents
agreements reported
with more that they have a partnership with a higher education institution or
institution training program, while than
about1430different universities,
percent reported colleges
they had or other
no partner. agencies,
Respondents
training program, while about 30 percent reported they had no partnerships. Respondents reported having
representing
agreements with nearly
reported having
more every
than 14major
agreements higher
with
different educational
more institution
than 14colleges,
universities, different in the
universities,
or other state.
collegesrepresenting
agencies, or other agencies,
nearly every major
representing
higher education nearly in
institution every
themajor
state.higher educational institution in the state.
Figure 9. Level of challenge experienced in collaborating with higher education institutions
Figure 9. Level of challenge experienced in collaborating with higher education institutions
FIGURE 10. LEVEL OF CHALLENGE EXPERIENCED IN COLLABORATING WITH HIGHER EDUCATION INSTITUTIONS
12.5%
12.5%
43.8%
43.8% We
Wehave
havea strong collaboration
a strong collaboration
It is sometimes challenging
It is sometimes challenging
It is very challenging
It is very challenging
43.8%
43.8%
About 44 percent of respondents reported that they had a strong collaboration with higher education
About and training institutions, while the same proportion noted that it is sometimes challenging (Figure 9).
44 percent of respondents reported that they had a strong collaboration with higher education
Only 13 percent of respondents stated that collaborating with these institutions was very challenging.
and training institutions, while the same proportion noted that it is sometimes challenging (Figure 9).
Only 13 percent of respondents stated that collaborating with these institutions was very challenging.
18
18
15About 44 percent of respondents reported that they had a strong
collaboration with higher education and training institutions, while
the same proportion noted that it is sometimes challenging (Figure
10). Only 13 percent of respondents stated that collaborating with
these institutions was very challenging.
Those who said their collaboration was strong mentioned that
they felt supported and their partner institution was eager to
serve their employees. Another said there was no challenge in
collaborating, but that the problem was “our own teachers who
are losing motivation and commitment.” Respondents who said
collaboration was sometimes challenging described a lack of
time and a struggle to connect with the staff and faculty from
those institutions. Multiple respondents noted that it was hard
to work with institutions to offer the classes that staff needed to
finish degrees. Those who saw their collaboration as very challenging
reported “very little communication, if any” and remote distances and
lack of early childhood classes as being barriers.
Slightly less than half (44 percent) of respondents reported that their
program accesses the state scholarship system for early childhood educators.
Forty-five staff from these programs were reported to have accessed a scholarship.
Among the 56 percent who had not accessed the program, 44 percent reported that
they had not heard of it and 22 percent reported that they encountered difficulty when trying to sign up. Other
comments mentioned not being state licensed and thus not having been allowed to
apply for scholarships. Some respondents said that in the past they had used
their own technical assistance funds to cover tuition, and that most staff use
other specific scholarships and financial aid to finance their education.
About 59 percent of respondents indicated their program had accessed
online Quorum training. From this pool, respondents estimated that
194 staff had accessed the training. Among the 41 percent who
reported their programs had not accessed Quorum training, 57
percent had not heard of it while 29 percent did not think Head
Start was eligible for it.
Substance Misuse
Nearly half (47 percent) of respondents reported limited or no
collaboration with local substance treatment partners, or that
such services were not available in their area. When asked
about the needs in their communities regarding substance
misuse, 71 percent indicated substance abuse was a moderate
to large issue in their locales (Figure 11). Only one survey
respondent indicated that substance misuse programs were at
the lowest level of priority. Of the 71 percent, half had limited or
no collaboration with substance use treatment agencies. Nearly
all respondents reported alcohol (94 percent) and marijuana (82
percent) were abused in their communities, while opioids (59 percent)
and methamphetamines (53 percent) were also mentioned by more than
half of respondents.
16methamphetamines (53 percent) were also mentioned by more than half of respondents.
Figure 12. Extent of substance misuse in respondent communities
FIGURE 11. EXTENT OF SUBSTANCE MISUSE IN RESPONDENT COMMUNITIES
50% 47.1%
45%
40%
35%
30%
23.5% 23.5%
25%
20%
15%
10% 5.9%
5%
0%
A large issue A moderate to large issue A moderate issue A minor to moderate issue
More than half (59 percent) of respondents reported that their program collaborates with a specific
More than half (59 percent) of respondents reported that their program collaborates with a specific agency that
agency that provides treatment for substance abuse. Of this group, about half reported their local
provides treatment for substance abuse. Of this group, about half reported their local behavioral health clinic
behavioral health clinic was their primary treatment agency for referred families. Respondents
was their primary treatment agency for referred families. Respondents described numerous examples of how
described
they collaborated withnumerous examples of
these agencies inhow they collaborated
addition to makingwith these agencies
referrals, including in addition
monthly toor
making
annual trainings,
workshops andreferrals, including
resources monthly
for or annual
parents, trainings,
and written workshops andagreements.
collaboration resources for parents, and written
collaboration agreements.
Nearly half of respondents (47 percent) reported that availability was a barrier to substance use treatment.
Respondents alsohalf
Nearly noted that those(47
of respondents referred
percent)for services
reported thatmay not bewas
availability ready to admit
a barrier to the use
to substance scope of their problem
or act on it,treatment.
and that Respondents
commitment and
also following
noted through
that those referredon
forattending
services maythenot
treatment
be ready toprogram
admit to are
the frequent
problems. Financial
scope of their problem or act on it, and that commitment and following through on attending the One respondent
cost poses barriers, as well as the process of leaving family for treatment.
from a rural area noted a lack of qualified treatment professionals, and difficulty maintaining confidentiality
treatment program are frequent problems. Financial cost poses barriers, as well as the process of
while seeking services in a small community.
leaving family for treatment. One respondent from a rural area noted a lack of qualified treatment
Infant/Early Childhood Mental
professionals, and difficulty maintaining confidentiality while seekingFIGURE
services in aFAMILIES
12. ARE small community.
AWARE OF INFANT /EARLY
CHILDHOOD MENTAL HEALTH CONSULTATIONS?
HealthInfant/Early Childhood Mental Health
About a third of respondents (36 percent) reported that they employ dedicated onsite staff providing
About a third of respondents (36 percent) reported that they
Infant/Early
employ dedicated Childhood
onsite Mental Health
staff providing consultations.
Infant/Early Sixty‐four percent reported using an offsite
Childhood
contractor
Mental Health instead. Sixty-four percent reported using
consultations.
an offsite contractor instead.
29.4%
About two-thirds (65 percent) of respondents said families in
their program were aware of Infant / Early Childhood Mental
Health Consultation. About 30 percent reported they were
unsure whether families were aware of such services (Figure
12). Two respondents noted that a training and informative
session on the topic for families would be useful in increasing 5.9% 64.7%
awareness and uptake of these services. One respondent
noted the need to “remove the stigma from partaking in
these services” while another stated that finding a consistent
Infant/Early Childhood Mental Health consultant to work with
families would improve awareness and uptake.
Yes No Don't know
17You can also read