Livelihood Dependency on Non-Timber Forest Products: Implications for REDD+
←
→
Page content transcription
If your browser does not render page correctly, please read the page content below
Article
Livelihood Dependency on Non-Timber Forest
Products: Implications for REDD+
Khaing Thandar Soe 1 and Youn Yeo-Chang 1,2, *
 1    Department of Forest Sciences, College of Agriculture and Life Sciences, Seoul National University,
      1 Gwanakro, Gwanakgu, Seoul 08826, Korea; khaingthandasoe@gmail.com
 2    Department of Forest Sciences and Research Institute of Agriculture and Life Sciences,
      Seoul National University, Seoul 08826, Korea
 *    Correspondence: youn@snu.ac.kr; Tel.: +82-02-880-4754

 Received: 25 March 2019; Accepted: 10 May 2019; Published: 16 May 2019

 Abstract: Deforestation and forest degradation are occurring continuously and posing serious threats
 to forests and people worldwide. In Myanmar, poor regulation and unsustainable extraction of
 non-timber forest products (NTFPs) is affecting millions of hectares of natural forests; overexploitation
 of forest resources is one of the main drivers of forest degradation. Although evidence shows that
 the extraction of NTFPs results in forest degradation, there have been few studies on what drives
 rural people to depend on NTFPs and how to address these drivers in terms of policies and measures.
 Policies and measures are nationally enacted policies and actions that countries undertake to address
 the causes of deforestation and forest degradation. This study identifies which factors determine
 the dependence on NTFPs in forest-dependent communities. From these factors, we derived policy
 implications for the main causes of overexploitation of NTFPs to provide suggestions for developing
 policies and measures in the design of national Reducing Emissions from Deforestation and Forest
 Degradation (REDD+) strategies. Focusing on the Taungoo District as a case of dependence on
 NTFPs by local communities, we conducted a qualitative and quantitative data collection procedure
 based on interviewing households in the local communities. NTFPs contributed the most to total
 household income and the main types of NTFPs exploited were charcoal making and bamboo selling.
 Households with lower education level, less agricultural land, less income from off-farm activities,
 lived under the poverty line or used only charcoal were more dependent on NTFPs in the study areas.
 Poverty and fuelwood usage were factors affecting NTFPs dependence for landowners while rice
 insufficiency, off-farm income and fuelwood usage most affected the NTFPs dependence for landless
 people. The results suggested that national strategies for REDD+ should take into account local
 features such as income opportunities and land tenure in order to make local people cooperate with
 the government to avoid deforestation and forest degradation.

 Keywords: non-timber forest products; livelihood dependency; REDD+; policy; Myanmar

1. Introduction

1.1. Research Background
      Deforestation and forest degradation are serious threats to sustainable development; their
exponential rate of growth poses a severe risk to the world’s ecosystems. Forests are common property
resources in many parts of the world. As Hardin [1] argues, forests, if open to all for access without
restriction, can be overexploited and degraded. Many non-timber forest products (NTFPs) productions
operate in open or semi-open access systems of resource tenure, resulting in exploitation of NTFPs [2].
For the sustainability in NTFPs harvest, land and resource tenure are crucial [3]; rapid market expansion

Forests 2019, 10, 427; doi:10.3390/f10050427                                        www.mdpi.com/journal/forests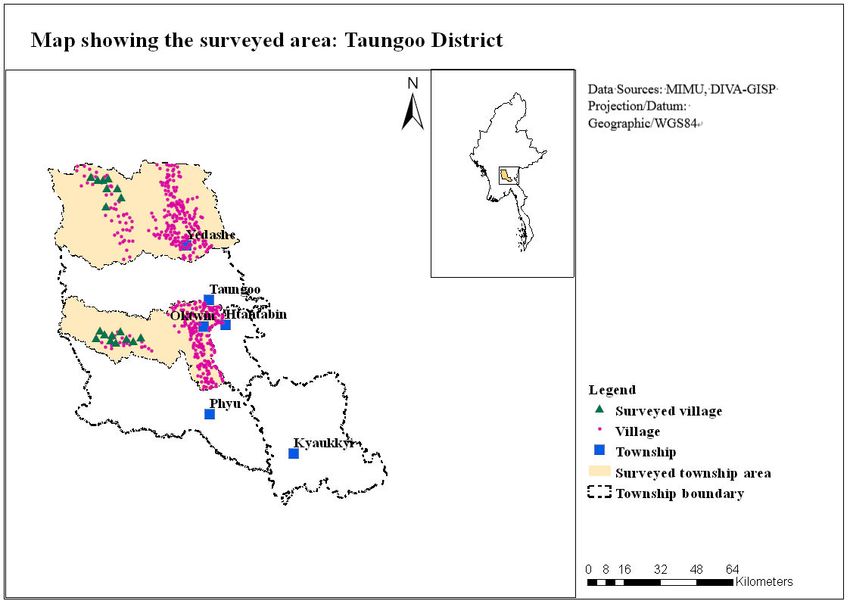
Forests 2019, 10, 427                                                                                2 of 25

of products with little or no tenure security leads to over-harvesting [4]. Nevertheless, the institutional
innovation, policies, and law enforcement at the local and international levels could help reduce the
tragedy of commons [5] and lead to the sustainable utilization of common resources.
      Forest degradation critically affects millions of people who depend, directly/indirectly or
fully/partially, on forest goods and services at the local, regional, and global levels [6]. This phenomenon
is a direct threat to the livelihood of forest-dependent communities as it reduces forest productivity.
Degradation often happens due to the complex interaction between direct drivers operating at the
local or regional levels and indirect drivers operating at the local, regional, national, and international
levels [7]. In terms of general causes, degradation is primarily due to human action in developing
countries, while natural events are usually the cause in developed countries [6]. Fuelwood collection,
charcoal making, and timber logging are the most severe problems fostering forest degradation in
Africa and subtropical Asia, while timber logging and uncontrolled fires are the main drivers of
degradation in Latin America [8,9]. Kissinger et al. [10] reported that the primary direct drivers of forest
degradation in Myanmar are illegal logging, overexploitation of forest resources, fuelwood collection,
and shifting cultivation. Overall, the common perception is that forest degradation in Myanmar is
due to anthropogenic activities, specifically the overexploitation of forest resources. However, little is
known about the reasons behind these activities driving forest degradation. It is thus important to
understand how much people depend on forest resources such as NTFPs and to identify the underlying
factors affecting this dependence.
      Reducing Emissions from Deforestation and Forest Degradation (REDD+) is an international voluntary
mechanism under the United Nations Framework Convention on Climate Change (UNFCCC) designed
to mitigate climate change by reducing greenhouse gases (GHG) emissions [11]. Since addressing the
drivers of deforestation and forest degradation taking into account both social and natural systems are at
the core of the REDD+ mechanism, understanding the underlying mechanisms behind the drivers of forest
degradation is imperative to achieve the goals of REDD+. In Myanmar, overexploitation of forest resources
resulting from the high dependence of the communities on these materials is one of the main causes of
forest degradation. Thus, investigating the underlying causes of the dependence on NTFPs would help
design and/or reform policies to address the problems under REDD+.
      Another aspect of our research on NTFP dependence by forest-dependent communities in
Myanmar is the potential for developing policies and measures (PAMs) that could be used to reduce
forest degradation and restore or otherwise improve forest management. PAMs are nationally
enacted policies and actions that countries undertake to address the causes of deforestation and forest
degradation [12,13]. The combination of PAMs from different sources are required to collectively
address priority direct drivers and barriers to implementation, in a coherent way [14]. Depending
on the country context (i.e., priority, political preference, capacity, and stakeholders involved), PAMs
may be a mixture of legal and institutional reforms, regulatory measures, and incentives taking
social and environmental safeguards into account as well as capacity building [15]. The Myanmar
National REDD+ Strategy specifies the PAMs to address the priority drivers of deforestation and forest
degradation and to overcome the barriers to the sustainable management of forests [16]. Some PAMs
such as legal or regulatory reform need to be implemented at the national level while some need to
be implemented at the local level [14]. Currently, Myanmar is at the finalizing stage of its National
Strategy. So, while some PAMs such as land tenure security and the recognition of customary rights
are still in development, others are already being implemented, including the distribution of efficient
cooking stoves, development of fuelwood plantations, raising environmental awareness in the local
communities, and capacity building of government and non-governmental organizations (NGOs)
staffs. The challenges to address the causes of forest degradation are in the implementation stage of
PAMs due to the limited information on the underlying causes of forest degradation and the complex
links between forests and the local communities. One study also conducted in Myanmar [17] reported
that REDD+ intervention did not have a significant impact on the livelihood of the local communities
except for contributing to an increase in environmental awareness. This situation highlights the need
Forests 2019, 10, 427 3 of 25
to further explore the underlying causes of deforestation and forest degradation and the dependence
of local communities on forest resources when the REDD+ plan is implemented in a specific region.
We postulate that to reduce overexploitation of NTFPs, a policy agenda could be developed based on a
close examination of the factors that influence local community dependence on NTFPs.
1.2. Literature Review
In this study, we used the definition of NTFPs [18], which is compatible with the features of NTFPs in
Myanmar. Thus, NTFPs are products that encompass “all biological materials other than timber which
are extracted from forests for human use” [18]. The NTFPs used by local communities include firewood,
charcoal, poles, thatching grass, bamboo, rattan, resins, ornamental plants, wildlife (products and live
animals), fibers, animal fodder, fruits, mushrooms, and other food and medicinal plants [18,19].
The contributions of forest ecosystem services to the livelihood of the local communities have been
highlighted by several studies [19–25]. In most developing countries, forest provisioning services are
especially important in terms of providing direct benefits to the local communities and, thus, represent a
major part of the total economic value of their livelihoods [26]. In addition to their role as a resource for
house construction, NTFPs are also used to generate biomass and energy, as well as they provide basic
needs such as food, clothing, and shelter. At first, the value of forests was recognized primarily in terms
of timber production at the national level. Later on, NTFPs became significant not only at the local level
but also at the national level. There is growing evidence that NTFPs contribute significantly to rural
livelihoods in developing countries, but are frequently underrepresented at the national level in terms
of economic reporting because they are often part of the informal economy [18,27–30]. Literature on the
factors influencing forest dependence indicated that off-farm employment opportunities, agricultural
income, and access to markets have a negative relationship with forest dependence [31,32].
The literature on the interaction between forests and people has focused on the contribution of forest
resources to the livelihood of rural people. Several studies reported the benefits of NTFPs to the livelihood
of local communities [18,19,27–30,32]. Some others argued that the commercialization of NTFPs adds to
the value of forest products by helping the conservation and development of local communities while
contributing to the regulation of forest services such as carbon sequestration, hydrological regulation,
and biodiversity conservation [33,34]. However, several works also confirmed the negative effects of
overexploitation and unsustainable extraction [35–39]. The disadvantages included altered regeneration,
species composition [37,38], and change in population structure and density of NTFP species, floristic
diversity [37,39,40], and forest degradation [35,36]. These studies supported the notion that the higher the
dependence on NTFPs, the higher the forest degradation. This is consistent with the current state of forest
degradation in Myanmar arising from the overexploitation of NTFPs.
To address the drivers of deforestation and forest degradation, the developing countries
participating in the UN-REDD program (United Nations Collaborative Programme on Reducing
Emissions from Deforestation and Forest Degradation) are encouraged to develop and implement
PAMs to support climate change mitigation and adaptation actions. Similar to other participant
countries, government bodies in Myanmar formulate PAMs as part of a national strategy and
implement them to meet the country’s mitigation targets. Studies on developing REDD+ PAMs are
relatively limited and this analysis is further complicated by the fact that the development and selection
of appropriate PAMs depends on region-specific deforestation and forest degradation drivers, national
circumstances, and the purposes of the national REDD+ strategy. Scriven [41] provided contextual data
and information to aid the development of PAMs targeted to the Peruvian Amazon and reported that
care must be taken to build and structure practical PAMs in the local context. As only a few countries
have submitted their national REDD+ strategy to the UNFCCC REDD+ platform, their strategies,
approaches and national programs are the only illustrations of PAM development available.Forests 2019, 10, 427 4 of 25
1.3. Rationale for the Study
A little more than a third of Myanmar’s land area consists of forest land—29 million hectares
out of a total land area of 65.8 million hectares [42]. Myanmar ranked third in annual net loss of
forest area during 2010–2015 [43] and the area of its degraded forests continues to increase at a
rate of 0.29% annually, which is much higher than the global average of 0.13% [44]. The estimated
indigenous population is approximately 14–19 million and most of the population live in or around
forest areas [45] and depend on forest resources for the collection of NTFPs for sustenance and for
generating income [45]. The rural population is approximately 70% of the total population [46] and the
extraction of NTFPs occurs in most of the protected areas (PAs) of the country. As a consequence, PAs
in Myanmar are threatened by grazing, hunting, fuelwood extraction, and permanent settlement of
rural communities [47].
Both the 1992 Forest Law and the 2016 Community Forestry Instructions (CFI) stipulate that
local communities have a right to extract a stipulated quantity of forest products for subsistence use,
but permission is needed if extraction activities take place on a commercial scale [48,49]. However,
common resources are vulnerable to powerful interests due to inadequate PAMs for the conservation
of forests. In particular, inefficient monitoring on the utilization of forest resources and inadequate
implementation of conservation programs are the limitations to address over-exploitation of forest
resources, illegal logging or illegal charcoal making and related activities. Thus, addressing these
drivers needs a new management regime considering PAM options.
Poor regulation and unsustainable extraction of NTFPs are affecting millions of hectares of natural
forest in Myanmar. According to the Taungoo District 10-year forest management plan [50], the demand
for bamboo in Oaktwin township in 2015–2016 was 3.45% higher than the estimated production from
reserved forests while the production in Yaetarshae township could meet the estimated demand in the
township. In the case of firewood and charcoal, the production of forests could not fulfill the demand
in both townships. A few studies have been conducted in different areas of Myanmar attempting to
explain the determinants of forest income, economic contribution of NTFPs to the rural livelihood,
and the relationship between basic needs and forest products [17,51–53]. Win et.al [54] studied the
consumption rates and patterns of firewood and charcoal in Yaetarshae township. They reported that
as the demand for firewood and charcoal is increasing, increased production of firewood and charcoal
could threaten further forest degradation in that area.
As overexploitation and unsustainable extraction of NTFPs lead to forest degradation [35,36] and
the tendency of further forest degradation in Myanmar, our research seeks to answer the question
concerning the factors that determine community dependence on NTFPs. Answering this question
provides a number of policy implications that can aid in the development of PAMs as part of a national
REDD+ strategy at a local scale.
2. Materials and Methods
2.1. Case Study Description and Data Collection
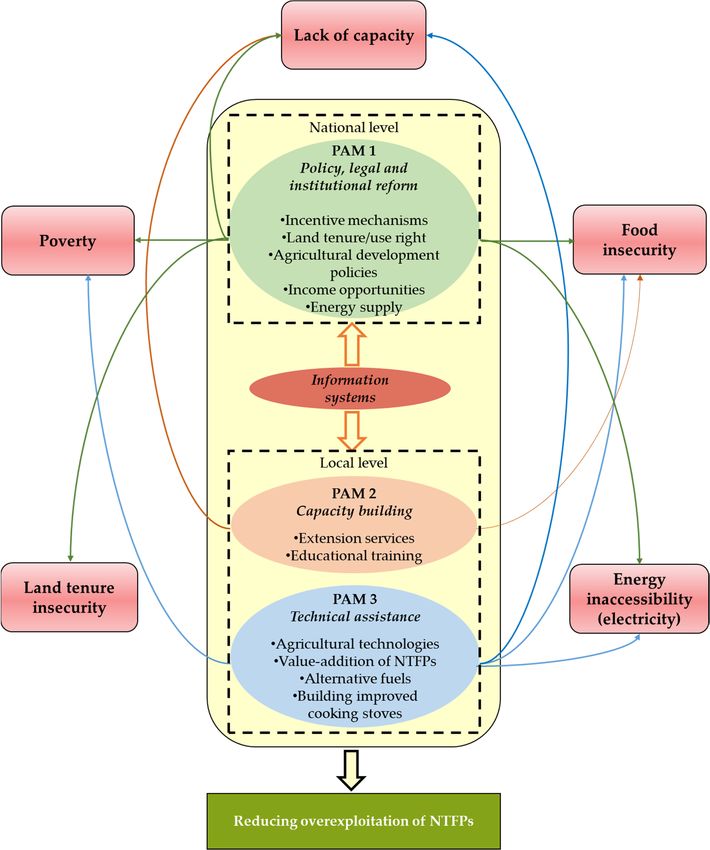
The study area, Taungoo District, is located in the northeastern part of the Bago Region in
Myanmar between 18◦ 80 and 19◦ 200 N and 95◦ 500 and 96◦ 450 E (see Figure 1). It is connected to Bago
Yoma (Yoma means mountain ranges) in the west, with the Kayin mountain ranges in the east and
plains from north to south [50]. With a population of approximately one million, almost 80% of the
people in the region live in rural areas [50]. The mean annual precipitation is between 1400–~2400 mm
and the average temperature is 27.18 ◦ C [50]. This district is along the Bago mountain range (Bago
Yoma), also known as the home of the Myanmar Teak (Techona grandis). At present, more than 80% of
the forest in the region is degraded [55]. The Taungoo District was chosen for the case study because of
this high percentage of degraded forest area, high rural population, and also due to the fact that it is
one of the main target areas for REDD+ implementation.Forests 2019, 10, 427 5 of 25
We designed our research to gather both secondary and primary data. The secondary data
concern forest cover, geographical information, demographic data, and area maps were collected
from township and district forest departments and the Forest Department at the Ministry of Natural
Resources and Environmental Conservation (MONREC). Two townships—Yaetarshae, located within
the lower mountainous areas (LMA), and Oaktwin, located within the higher mountainous areas
(HMA)—were selected as sampling areas for the field survey. Yaetarshae township occupies an area of
2619 km2 while Oaktwin township has 1385 km2 . The rural population in both areas were around
190 thousand (44,000 households) in LMA and 145 thousand (34,000 households) in HMA according
to the 2015 census [50]. The surveyed villages were located within low mountain ranges (ranging
in elevation from 251–500 m) and high mountain ranges (ranging in elevation from 501–750 m) [56].
Qualitative and quantitative data collection was conducted in October and November 2016 through
interviews with key informants, focus group discussions, and face-to-face individual interviews with
local residents. Five key informant interviews with government officials (senior officers, foresters)
of forest departments at township and district levels were conducted at Yaetarshae and Oaktwin
townships and Taungoo District. Interviews with key informants were conducted to understand the
geographical conditions of the study areas, forest cover, forest resources extraction and the general
livelihood conditions of communities. Moreover, four focus group discussions which included
5–7 village leaders and elders at four village tracts covering 18 villages were organized to understand
the general conditions of the villages, livelihood of the communities, forest resource use, and the main
types of NTFPs extracted from the surrounding forests. Households were randomly selected from a
total of 77,863 rural households and face-to-face interviews were performed using semi-structured
questionnaires. Ultimately, 330 sampled households with valid answers were selected for analysis.
Forests 2019, 10, 427 6 of 28
Figure 1. Study area: Taungoo District in the Bago Region, Myanmar. Note: Map created, February
Figure 1. Study area: Taungoo District in the Bago Region, Myanmar. Note: Map created, February
2018. MIMU: Myanmar Information Management Unit; DIVA-GISP: DIVA geographic information
2018. MIMU:system
Myanmar Information Management Unit; DIVA-GISP: DIVA geographic information
data portal.
system data portal.
2.2. Variable Descriptions
2.2. Variable Descriptions
The field survey was conducted to collect socio-economic and demographic information about
forest-dependent households and their use of NTFPs.
The field survey was conducted
NTFP dependence. The dependent to collect
variable socio-economic and demographic
measuring NTFP dependence is defined as the information
relative about
forest-dependent households and their use of NTFPs.
share of income from NTFPs in total household income, following the definition of forest dependency
in [30,32], and is denoted as DEPEND. The definitions of the explanatory variables are given in Table
NTFP dependence. The dependent variable measuring NTFP dependence is defined as the relative
1.
share of income Hypothesis
from NTFPs on the in total
effect householdand
of socio-economic income, following
demographic theondefinition
characteristics of forest
NTFP dependence. The dependency
in [30,32], and is denoted
variables as DEPEND.
postulated to influenceThe NTFPdefinitions
dependenceofinclude
the explanatory
socio-economic variables are given in Table 1.
and demographic
characteristics. The effect of each explanatory variable on the dependent variable was hypothesized
based on previous studies (see Table 1).Forests 2019, 10, 427 6 of 25
Table 1. Description of the explanatory variables.
Hypothesized
Variable Description Unit Literatures
Effect
Older rural people are assumed to have greater knowledge of the utilization and extraction of
AGE Household head age Years Positive
NTFPs than younger ones and their dependence would therefore be higher [29,57].
Men appeared to be more likely to engage in high-return NTFPs extraction activities than
female-headed households [30,53,58] while some argued that women are more dependent on
Male = 1
SEX Household head sex Positive subsistence forest income [59] and their involvement in NTFPs collection is more noteable than
Female = 0
men [60–63]. However, some studies pointed out that sex of household head is no longer
significant to forest dependence [57,64].
Household head
EDU completed schooling Years Negative Education level is expected to have a negative effect [30,52,57,59].
years
Number of family The more labor available, the more participation in labor intensive NTFP extraction activities
HHSIZE Persons Positive
members should be reported, thus implying more dependence on NTFPs [51,64,65].
In general, greater land ownership and level of food-sufficiency characterize wealthier
LANDAC Size of owned land Acres Negative households in Myanmar’s rural communities. The size of owned land has a negative effect on
NTFP dependence [53].
Number of rice
The number of rice insufficient months within a year
RICINSUF insufficiency months Months Positive
was hypothesized to have a positive effect on NTFP dependence [30,64].
in a year
Income from off-farm Households lacking other employment opportunities appear to be more dependence on
OFFINCOM US$/year Negative
employment NTFPs [64].
Regional poverty Poverty = 1 As forest products help as safety nets, support of current consumption, and as a pathway out of
POV Positive
level a Non-poverty = 0 poverty [3,32,66], people under the poverty line depend more on NTFP extraction [22,32].
Residency in high and
HMA = 1 Remote areas may have fewer income opportunities and higher dependency on forest resources
RESIDE low mountainous Positive
LMA = 0 than those areas with better infrastructure.
areas (HMA, LMA)
CCUSE Charcoal user = 1 Positive
Utilization of wood Fuelwood usage by local people may have an effect on NTFP dependence. The annual household
FWUSE Firewood user = 2 Negative
fuel income for charcoal users was significantly higher on average than for firewood users [67].
BOTHUSE User of both fuels = 3 Positive
a (based on 387,785 Myanmar Kyats, MMK/year = $308/year, as of November, 2016) [68]. NTFPs: non-timber forest products; Variable refers to the independent (explanatory variables) on
which the dependent variable (relative share of income from NTFPs in total household income) depends. Description refers to the explanation of the abbreviations of the independent
variables. Unit refers to the measuring unit for continuous variables and the denotation of categorical variables. Hypothesized effect on dependent variable refers to the estimated effect of
each explanatory variable on the dependent variable.Forests 2019, 10, 427 7 of 25
Hypothesis on the effect of socio-economic and demographic characteristics on NTFP dependence.
The variables postulated to influence NTFP dependence include socio-economic and demographic
characteristics. The effect of each explanatory variable on the dependent variable was hypothesized
based on previous studies (see Table 1).
2.3. Methods
Income accounting. We define household annual income as the sum of the cash income generated
from different activities (e.g., crop cultivation, livestock raising, collecting NTFPs, income from migrant
family workers, casual labor, and small scale businesses) and the monetary income equivalent to the
value of the output of those activities (non-cash income) [66]. Income accounting for the annual income
of forest-dependent households was calculated as follows:
Household annual income = (NTFP income + migration income + casual labor income + crop
cultivation income + livestock income + other income)
n
X
Ytincome = [],
i=1
where Ytincome is total household income and Si stands for income from source i.
Income from NTFPs was calculated by adding cash and non-cash income received from NTFPs,
where non-cash income is the non-monetary income or in-kind value of NTFPs consumed by the
households for their self-usage and cash income is the value received from selling them. As we suppose
that households have market access, both cash income from selling NTFPs and non-cash income were
calculated using market prices or the household self-reported value. If the household receives the
wages sent by the household members working outside of the study area, that wage is referred to as
migration income. Casual labor income is the income received by working as daily laborers receiving
daily wages. Other income is the one generated from small business activities such as home shops.
In addition, ‘off-farm income’ was calculated to examine its effect on NTFP dependency. Off-farm
income is the combination of all income activities apart from agricultural production income, thus it is
calculated by adding migration income, casual labor income, livestock raising income, and income
from other small business activities.
For the calculation of crop cultivation income, we use the income definition in [69]:
n
X m
X
I= pi yi − q jv j,
i=1 j=i
where I is gross income value, namely, (price x quantities of all n products)—total costs (price x
quantities) of m purchased inputs (e.g., seeds, hired labor) including family labor costs. Income from
livestock includes the sales of livestock, livestock products, and associated services but excludes
incremental stock value changes.
To understand the diversity of income activities in the households, an income diversification
index was calculated by using the inverse Simpson index of diversity [70] as implemented in [29,71]:
N
X
Index of diversity = 1/ P2I ,
i=1
where N is the number of different income sources, P1 , P2 , . . . , and Pn represent the proportion of
income source i in total household income. The denominator of the index of diversity may be further
decomposed as:
N 2 !2 2
X
2 I1 I2 In
Pi = + +···+ ,
IT IT IT
i=1Forests 2019, 10, 427 8 of 25
where I1 , I2 , . . . , In are the values of the different income sources (cash and non-cash) and IT is the total
income of household T. Thus, a household with a higher number of income-generating activities can
be said to be more diversified and will get higher diversity value.
Household poverty was determined based on the annual per capita income of the sampled
households compared with the regional poverty line (387,785 Myanmar Kyats (MMK/year) = $308/year,
as of November 2016) for the study area in the Eastern Bago Region estimated in [72]. If the annual per
capita income of a household is below the poverty line, then the variable poverty is 1 and 0 otherwise.
2.4. Empirical Model
A multiple regression model was developed to explain NTFP dependence as a function of
socio-economic and demographic characteristics of the forest-dependent communities. The multiple
linear regression equation is specified as:
Ŷ = β0 + β1 X1 + β2 X2 + · · · + βp Xp + ε,
where Ŷ is the predicted value of NTFPs dependence, β0 is the intercept, β1 . . . βp are the regression
coefficients, X1 . . . Xp are the predictor variables, and ε is the disturbance or error term.
In this study, we built three multiple regression models to explain NTFP dependence. Model 1
includes all sampled households; Model 2-1 only includes landowners; Model 2-2 only includes the
landless households. The models were estimated using the Statistical Package for Social Sciences IBM
SPSS Statistics 23.0 [73].
3. Results
3.1. Descriptive Analysis of the Livelihood of Forest-Dependent Communities
In the communities surveyed, most households were forest-dependent farmers with 98% of
the households engaged in the exploitation of NTFPs and/or related activities for subsistence and
commercial use. According to our survey, around 70% of households were agricultural land owners,
including official and non-official land tenure holders and farm-forestry tenants, while the rest
were casual laborers and small business owners. In LMA, almost all land-owning households
practiced upland cultivation of rice, groundnut, and sesame, while rice, groundnut and corn were
mainly cultivated in HMA and shifting cultivation is their main farming system. The categorical
socio-economic characteristics of the respondents are shown in Table 2. Among the respondents, only
3% were the female-headed households. None of the communities in the study area had access to
government-supplied electricity, so more than 50% of the households used only firewood for cooking,
whereas 37% used only charcoal and the remainder used both wood fuels. Myanmar suffers from
significant energy insufficiency as only 13% of the population has access to electricity [74]. Current
electricity consumption in Myanmar is relatively low with only 16% of people who used electricity for
cooking in 2014, while over 90% of the rural and 50% of the urban population use firewood or charcoal
for cooking [46,72].
According to the focus group discussion, some of the households’ farm lands were lost due to
the lack of secure land tenure and most of them expected alternative income opportunities especially
in the HMA. Moreover, only a few villages participated in the extension programs such as extension
on farming technologies and community forestry and participated in plantations while some did
not even notice the programs. Although they showed a positive attitude towards the conservation
programs generally, their main concern was getting job opportunities. Key informant interviews with
government officials from forest department explained the existence of illegal charcoal making in the
study areas and the limitations for monitoring those activities were mainly due to the lack of human
capacity and the huge area of forest.Forests 2019, 10, 427 9 of 25
Table 2. Descriptive statistics for the categorical socio-economic characteristics of sampled households.
Total Landowner Landless
χ2
Variable (n = 330) (n = 238) (n = 92)
Freq. a % Freq. a % Freq. a %
Male 320 97.0 233 97.9 87 94.6 2.510
Gender
Female 10 3.0 5 2.1 5 5.4 (p = 0.113)
Charcoal user 122 37.0 72 30.3 50 54.3
Fuelwood 16.757
Firewood user 174 52.0 140 58.8 34 37.0
usage (p = 0.000)
Both fuels user 34 10.3 26 10.9 8 8.7
No 101 30.6 79 33.2 22 23.9
Regional 1.961
level poverty Yes 229 69.4 159 66.8 70 76.1 (p = 0.161)
Low
mountainous 114 34.5 77 32.4 37 40.2
area 1.815
Residence (p = 0.178)
High
mountainous 216 65.5 161 67.6 55 59.8
area
a Number of responses.
The independent-samples t-test was used to compare the mean difference between landowner
and landless groups (see Table 3). The results proved that the landless households had a
statistically significant higher share of income from NTFPs (61.59 ± 40.52%) compared to landowners
(29.32 ± 28.56%), t(328) = −8.13, p = 0.000, explaining that landless households were more dependent
on NTFPs than landowners. This leads to a further question, namely, which socio-economic and
demographic characteristics other than land ownership are relevant for the dependence on NTFPs.
Thus, the descriptive statistics of non-categorical socio-economic characteristics of the respondents are
shown in Table 3. The mean age of landowners was 45.91 and 42.37 for the landless. The education
levels of households were determined based on their finished schooling years. The mean schooling year
of all sampled households was 3.69 which is equivalent to the primary school level. Landowners had
more family members than did the landless households. The possibility is that the households with land
owned can feed more family members compared to those without land owned. Among landowners,
around 90% of the households grew rice, thus the rice insufficient months were lower than that of
landless households. In the case of off-farm income (measured in USD/year), the landless households
earned a higher amount (590.77 USD/year) than the landowners (390.06 USD/year). Landowners
earned higher amount of per capita income (322.79 USD/year) than that of landless households
(303.14 USD/year). There was also a significant difference in income diversity between landowners
and the landless. In other words, landowners had more than two sources of income (2.17) whereas the
landless households generally had less than two sources of income (1.79).
3.1.1. Household Annual Subsistence Level and Cash Income from NTFPs
In this study, we focused on the major NTFPs consumed by households in the study areas. These
included bamboo, poles, wild vegetables, medicinal plants, firewood, and charcoal, all of which were
collected for subsistence and commercial purposes. The pattern of household NTFP utilization was
described in Figure 2. Among the NTFPs extracted, bamboo was the most common, accounting for
more than 90% of the households surveyed, followed by wild vegetables (85%), firewood (62%), pole
(33%), and charcoal (33%). Poles and firewood were extracted only for household use.Forests 2019, 10, 427 10 of 25
Table 3. Description of socio-economic characteristics of sampled households.
Total Samples Landowner Landless
t-Test Statistics,
Variable (n = 330) (n = 238) (n = 92)
p-Value
Mean
t(149.266) = −2.277,
Age 44.92 (12.08) 45.91 (11.56) 42.37 (13.06)
p = 0.024 **
t(166.027) = −0.210,
Education 3.69 (2.24) 3.71 (2.25) 3.65 (2.24)
p = 0.834
t(201.352) = −3.203,
Family size 5 (1.72) 5 (1.79) 4 (1.46)
p = 0.002 ***
Rice insufficient t(157.810) = 0.206,
1.48 (1.88) 1.46 (1.85) 1.51 (1.95)
months p = 0.837
t(124.201) = 1.748,
Off-farm income 446.01 (793.99) 390.06 (683.80) 590.77 (1015.93)
p = 0.083
NTFP income t(328) = 8.13,
28.32 (35.38) 29.32 (28.56) 61.59 (40.51)
composition p = 0.000 ***
Agricultural land t(237) = −15.067,
1.66 (2.25) 2.29 (2.35) 0
holding size p = 0.000 ***
t(267.232) = −0.502,
Per capita income 317.31 (391.06) 322.79 (430.82) 303.14 (263.05)
p = 0.616
Note: ** p < 0.05, and *** p < 0.01, Standard deviations (in parentheses). Variable refers to the continuous independent
and dependent variables included in the regression model. Mean refers to the mean value of each variable for total
sampled households, landowner group and landless group. The t-value refers to the value of t-test statistics. p-value
tells the likelihood
Forests 2019, 10, of
427the differences in means of each variables between two groups. 12 of 28
Extract Sell Self consumption
100
90
80
Sampled households (%)
70
60
50
40
30
20
10
0
Charcoal Bamboo Medicinal Wild Pole Firewood
plant vegetables
Types of NTFPs
Figure 2. NTFP utilization pattern by sample households. NTFPs: non-timber forest products.
Figure 2. NTFP utilization pattern by sample households. NTFPs: non-timber forest products.
Cash made up 77% of the total NTFP income while subsistence (non-cash) income was 23%
Cash(Table
made4).up 77%
Cash of the
income fromtotal NTFP
charcoal income
production was while subsistence
by far the (non-cash)
most important income
source of income for was 23%
(Table 4). households
Cash income fromfor
accounting charcoal production
43.8% of the was by
total NTFP income, far thebymost
followed bamboo important
cash incomesource
(30.5%),of income
and medicinal
for households plant cash
accounting forincome
43.8%(2.9%).
of theFirewood income income,
total NTFP only accounted for non-cash
followed in the study
by bamboo cash income
areas as the households collected firewood for their own use only. Nevertheless, the value for
(30.5%), and medicinal plant cash income (2.9%). Firewood income only accounted
firewood was calculated based on the market price in the nearest township. Income from poles for
for non-cash in
the study house
areas construction
as the households
and wild vegetables was mostly subsistence non-cash income. These results the value
collected firewood for their own use only. Nevertheless,
for firewood was calculatedthe
showed which NTFPs based on thewere
households market price in the
more dependent nearest
on for income township.
generation. Income from poles
for house construction and wild vegetables was mostly subsistence non-cash income. These results
showed which NTFPs the households were more dependent on for income generation.Forests 2019, 10, 427 11 of 25
Table 4. Household annual income from NTFPs, absolute and relative (%), Taungoo District, 2016.
NTFP Income Source Absolute NTFPs Income, ‘000 MMK a Relative NTFPs Income (%)
Charcoal 267 49.6
Subsistence 32 5.9
Cash 235 43.8
Bamboo 195 36.2
Subsistence 31 5.8
Cash 164 30.5
Poles 4 0.8
Subsistence 4 0.8
Cash 0 0.02
Wild vegetables 10 1.9
Subsistence 8 1.5
Cash 2 0.4
Firewood 46 8.6
Subsistence 46 8.6
Cash 0 0
Medicinal plants 15 2.9
Subsistence 0 0
Cash 15 2.9
a 1 USD = 1259 MMK (Myanmar Kyats), as of November 2016. Subsistence income refers to the non-monetary
income or in-kind value of NTFPs consumed by the households for their self-usage. Cash income refers to the
monetary income received from selling NTFPs.
3.1.2. Relative Annual Household Income
The relative annual household income by source is presented in Figure 3. Households were
engaged in at least two sources of income on average while almost 70% of the households surveyed
were below the poverty line. We may at this point postulate that the income sources in the study areas
may not have much effect on reducing poverty, thus suggesting that policies should explore the issue
of creating better income opportunities. According to the analysis, the share of NTFPs in total income
was the largest, accounting for 37% of total household income, followed by crop cultivation income
(33%), casual labor income (12%), and income from raising livestock (10%). Migration income was the
smallest contributor at 3%, whereas other income such as small business shops and tailoring accounted
for 5%. NTFP dependence can range widely depending on the diversity of the household income
sources and the geographical area [30,32]. Other studies on different areas of Myanmar [51,53,75]
reported that forest and NTFP income contributed to household income by 25–~55% of household
income, while the contribution rate varied with the conditions of different geographical areas and
socio-economic characteristics of the households.
3.2. Livelihood Dependence Estimation
Three multiple regression models were employed to identify the determinants of the dependence
on NTFPs. In Model 1, all sampled respondents (n = 330) were included in the sample and the
livelihood dependence on NTFPs was explained by the socio-economic, demographic variables and
fuelwood usage described in Table 1. Models 2-1 and 2-2 explained the livelihood dependence on
NTFPs for the sub-groups of landowners and landless, respectively. In these two models for sub-groups,
all socio-economic, demographic characteristics and fuelwood usage except the size of land owned
(LANDAC) were included as explanatory variables. The coefficient of determination (R2 ), adjusted R2 ,
and F-value were used to evaluate model fit. The results of our model estimations and their respective
fit were presented in Table 5.Forests 2019, 10, 427 12 of 25
Forests 2019, 10, 427 14 of 28
40
35
30
Income composition (%)
25
20
15
10
5
0
NTFP Crop Casual Livestock Other Migration
income cultivation labor income income income
income income
Income Sources
Figure 3. Relative annual household income by income source (n = 330), Taungoo District, 2016.
Figure 3. Relative annual household income by income source (n = 330), Taungoo District, 2016.
3.2. Livelihood Dependence Estimation
In Model 1, the level of education, land ownership, off-farm income, poverty, and type of
fuelwood used Threeweremultiple
foundregression
to be related models were employed
to livelihood dependenceto identify
on NTFPs the determinants
in the expected of the
directions.
dependence on NTFPs. In Model 1, all sampled respondents (n = 330) were included in the sample
Specifically, the higher the education level, size of land owned, and income from off-farm activities,
and the livelihood dependence on NTFPs was explained by the socio-economic, demographic
the lessvariables
dependent on NTFPs
and fuelwood the described
usage households are. 1.Households
in Table Models 2-1 and below the poverty
2-2 explained line were more
the livelihood
dependent on NTFPs.
dependence on NTFPsIn terms ofsub-groups
for the energy used, households
of landowners andthat usedrespectively.
landless, charcoal showed In these atworelatively
higher dependence than those
models for sub-groups, that used both
all socio-economic, charcoalcharacteristics
demographic and firewood. However,
and fuelwood theexcept
usage households
the size
using only of landwere
firewood owned less(LANDAC)
dependent wereon included
NTFPs than as explanatory
those thatvariables.
used both Thefuels.
coefficient of
Although not
determination (R 2), adjusted R2, and F-value were used to evaluate model fit. The results of our model
statistically significant, age, sex, family size, food shortage, and physical conditions of residence area
estimations and their respective fit were presented in Table 5.
were nevertheless related to dependence on NTFPs in the hypothesized directions.
In Model 1, the level of education, land ownership, off-farm income, poverty, and type of
Model 2-1 predicted
fuelwood used were that,
foundamongto belandowners, those who
related to livelihood had a higher
dependence level ofineducation
on NTFPs the expecteddepended
more ondirections.
NTFPs, Specifically,
while those thewho
higherwere under the
the education poverty
level, line,owned,
size of land and used only charcoal
and income were more
from off-farm
dependentactivities, the less Though
on NTFPs. dependentstatistically
on NTFPs the households
not significant are.at
Households below the
a higher level, the poverty
effect ofline were
food shortage
showed related to NTFP dependence. The higher coefficient of poverty for landowner group (B =
more dependent on NTFPs. In terms of energy used, households that used charcoal showed a 24.127)
relatively higher dependence than those that used both charcoal and firewood. However, the
explained that their option of earning income was extracting NTFPs once they came under the poverty
households using only firewood were less dependent on NTFPs than those that used both fuels.
line dueAlthough
to failure in agricultural production. Types of fuelwood used charcoal user (CCUSE) and
not statistically significant, age, sex, family size, food shortage, and physical conditions of
fuelwood user (FWUSE) were somewhat
residence area were nevertheless relatedsimilar to those
to dependence for theinentire
on NTFPs sample (Model
the hypothesized 1). However,
directions.
the directions of the
Model 2-1effect of family
predicted size in landowners,
that, among the case of landowners
those who had were different
a higher levelfrom Model 1.
of education
Thedepended
estimation more on NTFPs,
result for thewhile thosehousehold
landless who were under groupthe poverty2-2)
(Model line, andrevealed
also used onlythatcharcoal
a similar set
were more dependent on NTFPs. Though statistically not significant
of variables to Model 1 significantly influenced livelihood dependence on NTFPs. Food at a higher level, the effectshortages,
of
food shortage showed related to NTFP dependence. The higher coefficient of poverty for landowner
off-farm income, and type of fuelwood used were significant in explaining the dependence on NTFPs.
group (B = 24.127) explained that their option of earning income was extracting NTFPs once they
The longer
camethe ricethe
under insufficiency
poverty lineperiods and the
due to failure in higher off-farm
agricultural income
production. Typesof theof landless
fuelwood households,
used
the more these households depended on NTFPs. Similarly, among the landless
charcoal user (CCUSE) and fuelwood user (FWUSE) were somewhat similar to those for the entire households, those who
used only charcoal were more dependent on NTFPs. Although not statistically significant at a higher
sample (Model 1). However, the directions of the effect of family size in the case of landowners were
different
level, the effect from
of onlyModel 1.
firewood used was related to NTFP dependence.Forests 2019, 10, 427 13 of 25
Table 5. Estimation of the effect of socio-economic characteristics and fuelwood usage on NTFP dependence by household group: Full sample, landowners,
and landless.
Model 1, All Sampled Respondents (n = 330) Model 2-1, Landowners (n = 238) Model 2-2, Landless (n = 92)
Variables
B Std. Error t-Value p-Value B Std. Error t-Value p-Value B Std. Error t-Value p-Value
(Constant) 41.865 13.014 3.217 0.001 *** 15.879 13.757 1.154 0.250 34.630 23.915 1.448 0.151
AGE −0.079 0.120 −0.653 0.514 −0.043 0.121 −0.357 0.721 −0.061 0.223 −0.275 0.784
SEX 4.105 8.371 0.490 0.624 5.792 9.662 0.599 0.550 11.302 12.642 0.894 0.374
EDU −1.510 0.642 −2.353 0.019 ** −1.462 0.634 −2.307 0.022 ** −1.284 1.177 −1.091 0.278
HHSIZE 0.312 0.867 0.360 0.719 −0.542 0.805 −0.674 0.501 2.512 2.088 1.203 0.232
LANDAC −1.321 0.287 −4.603 0.000 ***
RICINSUF 1.211 0.808 1.498 0.135 1.308 0.774 1.690 0.092 3.583 1.639 2.187 0.032 **
OFFINCOM −0.007 0.002 −3.676 0.000 *** −0.003 0.002 −1.551 0.122 −0.009 0.003 −3.104 0.003 ***
POV 9.837 3.575 2.752 0.006 *** 24.127 3.565 6.768 0.000 *** 6.363 6.737 0.945 0.348
RESIDE 1.578 3.172 0.498 0.619 1.430 3.096 0.462 0.645 2.941 6.658 0.442 0.660
CCUSE 21.960 5.220 4.207 0.000 *** 18.849 5.197 3.627 0.000 *** 22.824 10.008 2.280 0.025 **
FWUSE −16.926 4.843 −3.495 0.001 *** −11.320 4.676 −2.421 0.016 ** −18.831 10.416 −1.808 0.074
R2 = 50.9% R2 = 48.8% R2 = 66.5%
Adjusted R2 = 49.2% Adjusted R2 = 46.5% Adjusted R2 = 62.3%
F11,318 = 29.922, F10,227 = 21.596, F10,81 = 16.051,
Significance level = 0.000 *** Significance level = 0.000 *** Significance level = 0.000 ***
Note: ** p < 0.05, and *** p < 0.01, Dependent variable = NTFP dependence (relative share of income from NTFPs).Forests 2019, 10, 427 14 of 25
4. Discussion
4.1. Factors Affecting NTFP Dependence by Forest-Dependent Communities
In Model 1, five explanatory variables were statistically significant for NTFP dependence in a
multiple regression analysis context. The negative effect of education may be due to the fact that more
educated households had better access to a wider range of income opportunities and the extraction
of NTFPs may not be their main income source. This is consistent with a previous study [52] on
Myanmar reporting that households with a low education level were more dependent on the forests.
Generally, wealthier households in rural Myanmar communities have more opportunities for education
and greater access to farmland. However, the descriptive analysis showed that there was not much
difference in education level of landless and landowner groups. Thus, we can postulate that although
education showed significance, it may not have an effective measure. It is possible that the households
with a higher education level in the study areas had better access to farmland and were more involved
in agriculture than in forest activities. Landownership had a negative effect on dependence on NTFPs
as well, indicating that the larger the size of the agricultural land, the less the household will depend
on NTFPs [29,32]. One can expect that if a household owns more land, there is a higher probability
of having both food security and cash income from agricultural farming. The finding that NTFP
dependence decreased with increases in off-farm income was consistent with previous results [53,59,76]
and was also consistent with our expectation that households who earned higher income from
raising livestock, casual labor, and other small businesses would depend less on labor-intensive NTFP
extraction activities. The estimation results suggested that poverty was positively related to NTFP
dependence as expected, indicating that the households that were under the poverty line depended
more on NTFPs as a fall back resource or as a means of income diversification. Previous studies [22,32]
supported our findings. In our models, households headed by men were seemingly more dependent
on NTFPs, yet it is not statistically significant, which is similar with the previous studies [57,64]. This
finding is contrary to other findings which argued that female involvement in NTFPs collection is
dominant [62,63,77], and higher number of female family labor has higher dependence on NTFPs [60].
We could postulate that this different dependence may rely on the market access, and types of NTFPs
mainly collected by households. In the study area, female-headed households sold NTFPs mostly at
the local market whereas male-headed households went to the township market to get a better price
for their products. Moreover, charcoal making had the highest share of NTFPs income among different
NTFPs extracted (Table 4), besides, that activity was mainly conducted by the male households due
to the hard work. Thus, there is a high chance of getting higher income from NTFPs for male than
female-headed households in the study area. Another possibility may be due to the huge difference in
the number of sampled male and female-headed households surveyed.
Our results were also supported by [2], which reported that NTFPs can fulfill several livelihood
requirements starting from subsistence to safety nets and cash income to alleviate poverty. The positive
effect of charcoal use on the NTFPs dependence implied that among the households that used fuelwoods,
those which only used charcoal for subsistence and/or selling were much more dependent on NTFPs
for their livelihood than those that used both charcoal and firewood. Among the households that
used charcoal for cooking, almost 70% made charcoal themselves not only for subsistence but also
for commercial purposes. This explained the hypothesis that the households were more dependent
on NTFPs if they could get non-cash as well as cash benefits as part of their income. As expected,
the utilization of firewood alone led to significantly less dependence on NTFPs than for the households
that used both fuels. This would imply a similar hypothesis to the one mentioned above where a
higher relative income from NTFPs may be expected when the contribution of income from charcoal
making was significantly higher than the subsistence income from firewood.
Contrary to our initial hypothesis, age, sex, family size, food shortage, and physical conditions
of residence areas were not significantly associated with dependence on NTFPs. We may postulate
that since there were limited income opportunities or non-forest income generating options in theForests 2019, 10, 427 15 of 25
study areas, then regardless of age, gender, and family size, local people were more dependent on the
extraction of NTFPs [30].
The results of Model 2-1 and Model 2-2 showed the comparative effects of socio-economic,
demographic characteristics of the respondents and their fuelwood usage who owned agricultural land
and those who did not. The charcoal usage was the only significant variable significant in both models,
and was consistent with the result of Model 1. As in the case of Model 1, education level, food shortage,
off-farm income, and poverty were significantly associated with NTFP dependence in Models 2-1 and
2-2. The positive significant effect of poverty on the dependence on NTFPs in Model 2-1 implied the
same effect in terms of direction, but with a higher magnitude than in Model 1. Therefore, among
the landowners, those who were under the poverty line tend to extract NTFPs as a fall back option
in times of emergency, thus increasing their dependence on NTFPs [22,32]. Longer periods of rice
insufficiency (RICINSUF) made the landless group in Model 2-2 more dependent on NTFPs. This is
possible because most of the landless people may be rice-insufficient due to their lack of agricultural
land so they tended to engage more in forest extraction activities. This hypothesis was supported by
previous studies [30,65]. Similar to Model 1, having a higher amount of off-farm income (OFFINCOM)
had a negative correlation with NTFP dependence in Model 2-2. This implied that among the landless
people, those who had higher off-farm income were less dependent on NTFPs [29]. It is therefore likely
that the presence of more diverse sources of income for the landless people would help reduce the
overexploitation of NTFPs.
The comparison between Models 2-1 and 2-2 highlighted the differences in terms of the dependence
of landowners and the landless people on NTFPs with respect to their socio-economic, demographic
characteristics and fuelwood used. As these models showed fuelwood usage it could help anticipate
NTFP exploitation trends in the study areas. Overall, landownership, off-farm income, poverty and
fuelwoods used were the most impactful variables on NTFPs for the study areas. These findings may
help to develop PAMs that would help reduce overexploitation of NTFPs in forest-dependent areas.
4.2. Policy Implications for REDD+
The findings from our study showed that poverty, food insecurity, land ownership, fuelwood
usage, and low education were the main causes of dependency on NTFPs in rural communities in
Myanmar (Model 1). Obviously, the study area was located in a region with limited development,
where the average finished schooling years of the respondents was 3.6 years, almost 70% of the
respondents lived under the poverty line, 45% reported rice insufficiency, 30% had no agricultural land,
and all depended solely on charcoal and firewood for cooking. Given this situation, addressing the
drivers of overexploitation of NTFPs could consider the livelihood of local communities and their living
conditions to develop effective policies and measures. Well-designed and comprehensive policies
are needed to reduce overexploitation of NTFPs in a socially, economically, and environmentally
sustainable way. For this reason, we suggested the following policy implications conceived with the
idea of long-term benefits for both local communities and the surrounding forests and the improvement
of existing policies.
4.2.1. Policy Implications for Poverty
The results revealed that NTFPs contributed substantially to the income of forest-dependent
communities as the average NTFP income share in total annual household income was 37% (see Figure 3).
Still, almost 3/4 of the respondents lived below the regional poverty line. In addition, our study
revealed that households below the poverty line were more dependent on NTFPs. This condition
was the root cause behind the increasing exploitation of NTFPs by the communities, thus increasing
forest degradation in the study area. An important conclusion we can draw from our results combined
with our examination from the focus group discussion was that the first reliable income option for
the recently landless respondents was the exploitation of NTFPs due to the lack of alternative income
opportunities in the area. Hence, policies creating non-farm employment opportunities would helpForests 2019, 10, 427 16 of 25
local communities become less dependent on NTFPs [78] while raising their income beyond the
subsistence level. Support for raising subsistence livestock would also be an alternative option as
it could create both cash and in-kind income while enabling the possibility to save for future needs.
In addition, providing technologies for adding value to NTFPs as well as developing the appropriate
marketing channels for those products [79] or supporting the extension services on harvesting NTFPs
in a sustainable way could help not only increase their benefits but also reduce forest degradation.
4.2.2. Policy Implications for Food Security
The respondents in the study area suffered from rice insufficiency for 1.5 months on average
per year. A high percentage of food insecurity among landowners revealed the need for agricultural
development policies in rural communities. Agricultural policies that focus on crop diversification
or agroforestry would help increase their production and ensure the yield [80]. However, these
policies could be implemented at the national level to prevent conversion of forestland to agricultural
land use or other related activities. Such policies could be accomplished through the support of
agricultural technologies, some of which have already been proposed by national specialists [80], and
the dissemination of information. Despite no significant difference in terms of food insecurity between
landless and landowners, agricultural land allocation or providing land leases for the landless people
to do agroforestry could help them to not only generate a steady flow of rice for consumption, but
would also help reduce overexploitation of NTFPs.
4.2.3. Policy Implications for Land Tenure Security
Our analysis reported that a proportion of NTFP income in the case of landless people was
twice as much as that of landowners. As income from agricultural production was the second
highest contribution to household total income, policy interventions allocating land or providing land
lease agreements especially formulated for the landless in forest-dependent households could help
reduce their dependency on NTFPs. Among landowners, some were farm-forestry tenants practicing
agroforestry while others were non-official landholders practicing shifting cultivation. Previous studies
suggested that forest tenure was the most critical factor behind overharvesting of NTFPs [81,82]. Thus,
social safeguards such as land tenure security and recognition of traditional land use rights could
be secured to implement REDD+ within the framework of Myanmar’s national land use policy as a
means to reduce forest degradation at the national level [83–85].
4.2.4. Policy Implications for Energy Supply
All the communities in the study area had no access to electricity and solely depended on charcoal
and firewood for cooking. The Myanmar energy poverty survey reported by [86] highlights the lack of
awareness about renewable energy equipment and alternative fuels by rural households [74]. One
study conducted in the same study areas in the Yaedarshae township revealed the effect of using
multiple fuels (mainly fuelwood, gas, and electricity) in urban areas on reducing the consumption of
firewood and charcoal [54], thus lessening the adverse impact on the forests. Pode et.al [87] showed
the possibility of the rice husk biomass power system as an affordable option for rural electrification in
Myanmar. Unless alternative fuels are provided, the rate of degradation of Myanmar forests will be
exacerbated. Thus, energy policies in Myanmar could focus on introducing and providing incentives
for the adoption of alternative fuels such as biomass waste and technologies on the biomass based
power system, as well as incentivizing the production and distribution of efficient cook stoves to reduce
charcoal and firewood consumption at the national level [16,88]. Such policies could be implemented
through extension services concentrating on how to effectively and easily use alternative fuels and/or
the improved cooking stoves. Technologies for building and improving cooking stoves could be
provided for long-term distribution. In addition, the development of fuelwood plantations with
participation by local communities could be implemented and accompanied with monitoring and
follow-up activities.You can also read