Polokwane Green Goal Energy Strategy Update and Implementation Plan 2016 - Urban Energy Support
←
→
Page content transcription
If your browser does not render page correctly, please read the page content below
Polokwane Green Goal Energy Strategy Update and
            Implementation Plan 2016

0|Page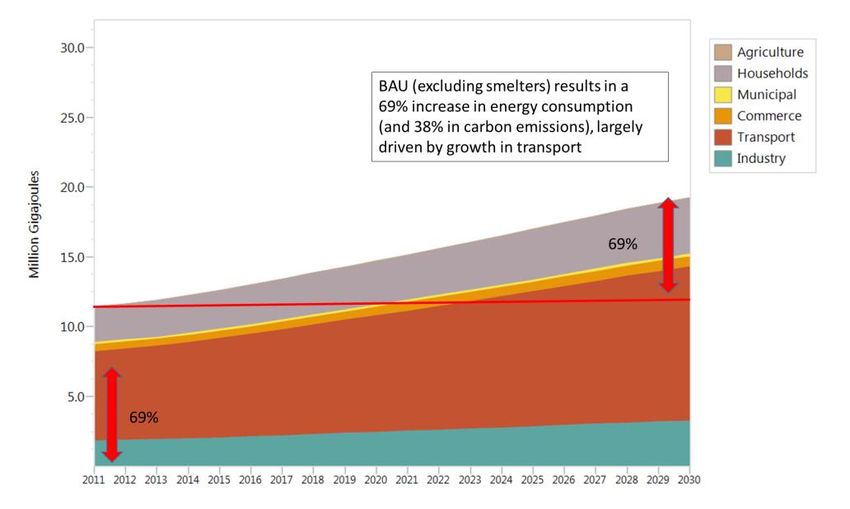
Foreword

Executive Mayor, Polokwane

Polokwane Municipality is one of the country’s fast growing ‘secondary’ cities. As the capital of
Limpopo Province it is the heart of the province and home to many of the educational, health and
administrative institutions that support the area. It also houses large industries that drive the local
and national economy. Energy is needed to keep this heart beating. Energy services are critical for
welfare and development; but energy systems also present a number of issues and challenges that
must be met.

Goal 7 of the new UNDP Sustainable Development Goals looks to: Ensure access to affordable,
reliable, sustainable and modern energy for all. Global leaders agree on the need to curb climate
change through a move away from fossil fuel generated energy. If we are to drive development in
our country in a transformative manner, we have to change the way we generate, supply and
consume energy.

As energy intensive locations and the frontline of the developmental state, municipalities have a
key role to play in forging a new energy future. We must build and develop towns that are efficient
and that support sustainable energy solutions. This is to support a more efficient economy as well
as in support of national government’s commitment to reducing the carbon footprint of the
country. Municipalities also carry the mandate to ensure that all citizens have access to affordable
and safe energy services.

In preparation for hosting the 2010 World Cup Polokwane established its Green Goal direction. This
has outlasted the World Cup and continues to guide the municipality towards meeting its vision of
sustainable development. This Green Goal Energy and Climate Mitigation Strategy supports this
ongoing work. It provides guidance on how to move forward to meet the challenges – turning
challenges into opportunities. The identification and prioritisation of projects provides a clear plan
of action and the strong data base provides the means to monitor and measure the impact of
activities.

Polokwane Municipality, through hard work and commitment of staff, has a number of existing
sustainability projects underway. It has also established a number of key partnerships to take this
area of work forward. We look forward to building on this strong foundation and taking the Green
Goal: Energy and Climate Mitigation forward together.

Cllr Thembi Simelane-Nkadimeng
Executive Mayor of Polokwane

1|Page
Contents
Contents ................................................................................................................................................. 2
1. Executive Summary........................................................................................................................ 7
2. Introduction and background ...................................................................................................... 11
2.1. Development of the strategy and implementation plan ...................................................... 11
2.2. Purpose of the strategy and implementation plan ............................................................... 11
2.3. Institutional framework ........................................................................................................ 12
2.4. Data sources and report method .......................................................................................... 13
3. Polokwane Energy Profile ............................................................................................................ 17
3.1. Polokwane municipality profile............................................................................................. 17
3.2. Energy data tables: Polokwane sustainable energy indicators and energy and emissions
overview tables ................................................................................................................................ 19
4. Polokwane energy demand ......................................................................................................... 21
4.1. Current energy picture .......................................................................................................... 21
4.2. Residential sector .................................................................................................................. 24
4.2.1. Lighting ........................................................................................................................... 26
4.2.2. Cooking .......................................................................................................................... 26
4.2.3. Water heating ................................................................................................................ 27
4.2.4. Space heating ................................................................................................................. 27
4.3. Commercial and industrial sectors........................................................................................ 28
4.4. Transport and Mobility.......................................................................................................... 29
4.5. Local government .................................................................................................................. 31
5. Polokwane energy supply ............................................................................................................ 34
5.1. Energy supply sources ........................................................................................................... 34
5.1.1. Coal ................................................................................................................................ 34
5.1.2. Liquid fuels and natural gas ........................................................................................... 34
5.1.3. Electricity........................................................................................................................ 35
5.1.4. Distributed and small scale embedded generation (SSEG) and energy efficiency ........ 36
5.1.5. Charcoal, wood and biomass ......................................................................................... 38
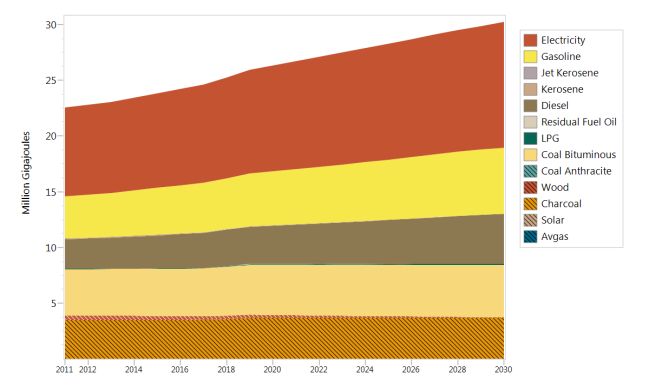
6. Polokwane Energy future............................................................................................................. 40
6.1. Business as Usual................................................................................................................... 40
6.2. An optimal energy future for Polokwane ............................................................................. 44
7. Polokwane energy strategy and implementation action plan .................................................... 49
7.1. 5 priority areas ...................................................................................................................... 49
7.2. Conclusion: current projects and programmes .................................................................... 60
8. References ................................................................................................................................... 61
2|Page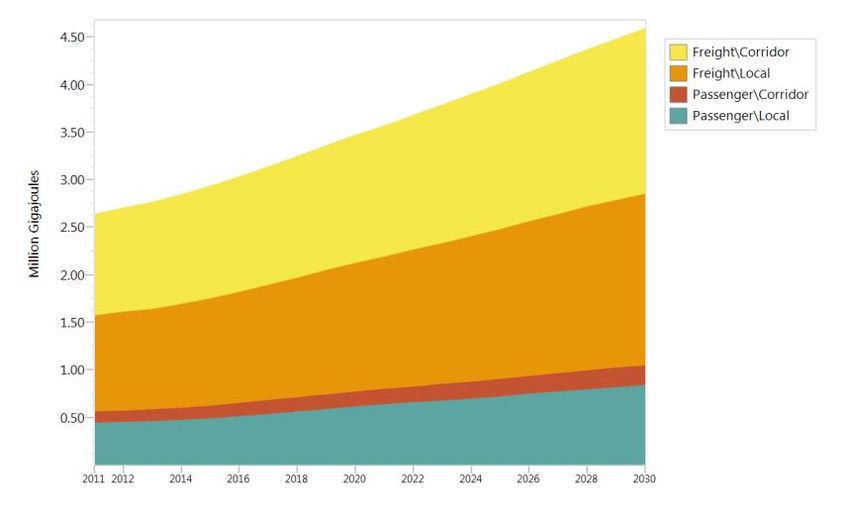
Figures
Figure 6: Polokwane energy consumption by sector, with and without smelters, 2011 ...................... 8
Figure 30: Possible future energy consumption by sector (optimal) compared to BAU scenario
(without smelters) and by cost. ............................................................................................................. 9
Figure 1. Polokwane Municipality organogram ................................................................................... 13
Figure 2: Polokwane Municipality (Spatial Development Framework, 2010) ..................................... 18
Figure 3. Energy consumption per capita across South African cities and towns, 2012 ..................... 21
Figure 4. Energy consumption of South African cities and towns as a share of national, 2012 ......... 22
Figure 5: Polokwane energy consumption and carbon emissions by energy source, 2011 ................ 23
Figure 6: Polokwane energy consumption and carbon emissions by sector, 2011 ............................ 24
Figure 7. Households using electricity for lighting (a proxy for electrification) 2001 - 2011 .............. 25
Figure 8: Fuels used for lighting by low-income households in Polokwane, 2011 .............................. 26
Figure 9: Fuels used for lighting by low-income and mid-high households in Polokwane, 2001 ....... 26
Figure 10: Fuels used for cooking by low-income and mid-high households in Polokwane, 2011 ..... 27
Figure 11: Fuels used for cooking by low-income and mid-high income households in Polokwane,
2001 ..................................................................................................................................................... 27
Figure 12: Fuels used for space heating by low-income and mid-high income households in
Polokwane, 2011.................................................................................................................................. 27
Figure 13: Fuels used for space heating by low-income and mid-high income households in
Polokwane, 2001.................................................................................................................................. 27
Figure 14. Proportion of houses with ceilings across income groups in Polokwane (Mthenthe survey,
SEA 2015) ............................................................................................................................................. 28
Figure 15. Industrial sector fuel breakdown ........................................................................................ 29
Figure 16. Number of people using motorised transport versus non-motorised in Polokwane, 2011
.............................................................................................................................................................. 30
Figure 17. Percentage of commuters using private or public transport modes in Polokwane, 2011. 30
Figure 18: Passenger transport energy split between private and public transport mode 2011
(extrapolated from the LEAP model, ERC, 2016) ................................................................................. 31
Figure 19. Local government energy consumption and carbon emissions by service sector, 2011 ... 32
Figure 20. Total primary energy consumption in South Africa, 2012 .................................................. 34
Figure 21: Revenue impact of SWH and EE rollout compared with solar PV revenue impact (as a % of
total electricity revenue) ..................................................................................................................... 38
Figure 22. The projected energy consumption for Polokwane through to 2030 for the BAU scenario
(smelters included) .............................................................................................................................. 41
Figure 23. The BAU scenario where the smelters have been excluded. ............................................. 41
Figure 24. Energy consumption by fuel type for Polokwane in the BAU scenario (with and without
smelters) .............................................................................................................................................. 42
Figure 25: Electricity consumption in Polokwane for the BAU scenario where the smelters have
been excluded ...................................................................................................................................... 42
Figure 26: Petrol consumption in Polokwane BAU scenario ............................................................... 43
Figure 27: Diesel consumption in Polokwane BAU scenario ............................................................... 43
Figure 28: The petrol consumption for local passengers in Polokwane is mainly for light passenger
vehicles................................................................................................................................................. 43
Figure 29. Possible future energy consumption (optimal) compared to BAU scenario (without
smelters) .............................................................................................................................................. 46

3|Page
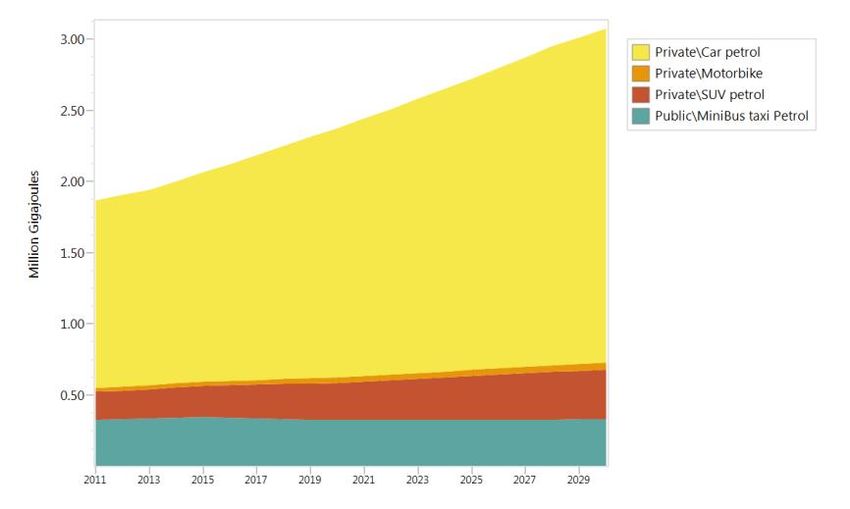
Figure 30: Possible future energy consumption by sector (optimal) compared to BAU scenario
(without smelters) ............................................................................................................................... 46
Figure 31: Possible future energy cost (optimal) compared to a BAU scenario (without smelters)... 47

Tables
Table 1: Energy data sources ............................................................................................................... 14
Table 2: Fuel supply data from Aurecon’s State of Energy report for Polokwane (2013) and
additional sources used to inform this update report ........................................................................ 15
Table 3: Energy conversion factors, South Africa ................................................................................ 16
Table 4: GHG emissions factors for South Africa ................................................................................. 16
Table 5: Key sustainable energy indicators for Polokwane, 2011 ....................................................... 19
Table 6: Energy demand (native units) in Polokwane by energy type and sector, 2011 .................... 20
Table 7: Energy demand (GJ) in Polokwane by energy type and sector, 2011 ................................... 20
Table 8: Energy-related GHG emissions by energy source and sector (tCO2e), 2011 ......................... 20
Table 9. The modal share for Polokwane commuters (source: Polokwane Integrated Transport Plan
2007) .................................................................................................................................................... 30
Table 10. Polokwane municipality interventions and savings achieved through the Department of
Energy Municipal EEDSM Programme, 2009 - 2014 ............................................................................ 32
Table 11: Revenue impact of solar PV uptake in Polokwane, as a % of total electricity revenue ...... 37
Table 12. Energy drivers to 2030: summary of key assumptions ........................................................ 44
Table 13. Energy efficient and demand interventions modelled for each sectors ............................. 44
Table 14. Energy Strategy Action Plan ................................................................................................. 51

4|Page
List of abbreviations and definitions
BRT       Bus Rapid Transport
CO2       Carbon dioxide
DoE       Department of Energy
DoRA      Division of Revenue Act
EEDSM     Energy efficiency demand side management
FBE       Free basic electricity
GDP       Gross domestic product
GHG       Greenhouse gas
GJ        Gigajoule
GPC       Global Protocol for Community-Scale Greenhouse Gas Emissions Inventories
GWh       Giga-watt hour
GVA       Gross value added
HFO       Heavy furnace oil
HVAC      Heating, Ventilation and Air Conditioning
IDP       Integrated Development Plan
IEP       Integrated energy plan
IPCC      Intergovernmental panel on climate change
IPP       Independent Power Producer
IRP       Integrated resources plan
IRPTS     Integrated Rapid Public Transport System
Koe       Kilogram of oil equivalent
KPI       Key Performance Indicator
LEAP      Long range energy alternatives planning
LED       Light emitting diode
LPG       Liquid petroleum gas
LPU       Large power user
LTMS      Long term mitigation scenario
MW        Mega-watt
MWh       Mega-watt hour
MYPD      Multi-year price determination
NDP       National development plan
NERSA     National electricity regulator of South Africa
NMT       Non-motorised transport
PV        Photovoltaic
REIPPP    Renewable Energy Independent Power Producers Programme
SAMSET    Supporting Sub-Saharan Africa’s municipalities with sustainable energy transitions
SALGA     South African Local Government Association
SANS      South African National Standard
SAPIA     South African petroleum industry association
SPU       Small power user
SSEG      Small-scale embedded generation
SWH       Solar Water Heater
WWTW      Waste water treatment works

5|Page
Acknowledgements

This update of Polokwane Municipality’s Energy Strategy is based on latest energy data gathered as
part of SAMSET-Supporting Sub-Saharan Municipalities with Energy Transitions, a project co-funded
by UK Aid from the UK Department for International Development (DFID), the Engineering &
Physical Science Research Council (EPSRC) and the Department for Energy & Climate Change
(DECC), for the benefit of developing countries.

The update builds on the solid foundational strategy developed through the South African Local
Government Association (SALGA) led Swiss Agency for Development and Cooperation’s (SDC)
“Energy Efficient Building Programme 2010-2014”. This first strategy was undertaken by
FutureWORKS and UrbanEARTH, based on baseline energy information prepared by Aurecon in a
2013 State of Energy in Polokwane report.

This Polokwane strategy update is a collaborative product of various stakeholders, led by the
Energy Services Department with the support of the SAMSET team (notably Sustainable Energy
Africa and the Energy Research Centre, University of Cape Town). This exercise has involved the
input and engagement of all key municipal departments and stakeholders from Eskom, SALGA, the
Provincial government and University of Limpopo.

The contributions and inputs are acknowledged with thanks.

        Authors: Sustainable Energy Africa: Megan Euston-Brown, Hlengiwe Radebe

6|Page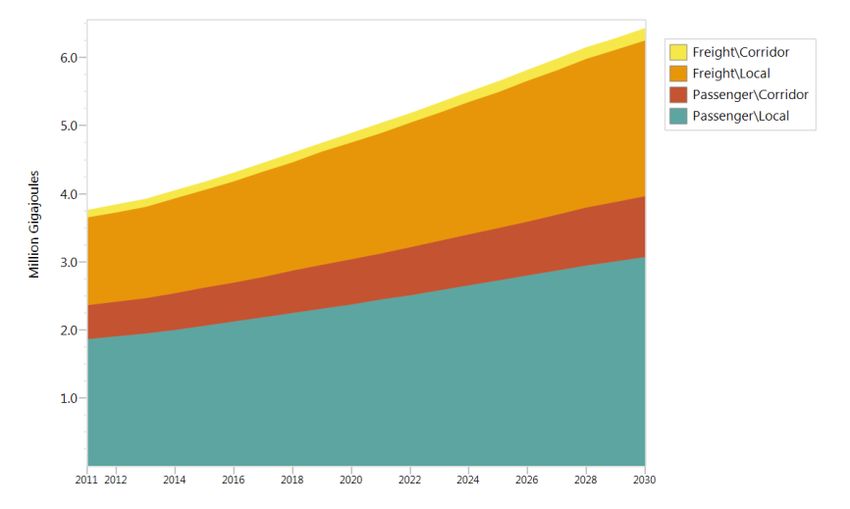
1. Executive Summary

The Polokwane Green Goal Energy Strategy involves an update of the data and strategy developed
through SALGA in 2013 and includes information from an energy futures modelling exercise
undertaken by the Energy Research Centre, University of Cape Town. The Strategy development
process has involved a number of workshops with municipal officials from various departments, as
well as key stakeholders. The intention of the document is to provide a sound statistical basis from
which to design a strategy that talks to the municipality’s commitment, as expressed in its mission
statement, to innovation and sustainable development (including carbon emissions reduction and
economic development) and its energy vision of reliable, safe and affordable energy services for all.
Linked to the strategy is an action plan to support implementation.

The total energy consumption within Polokwane municipality in the baseline year of 2011 was 22
GJ (inclusive of the large smelters), resulting in 3 mega tonnes of annual carbon emissions. Energy
per capita is on a par with metros in South Africa (at 35GJ/capita), and this would be lower if not for
the presence of heavy industry. The gigantic energy consumption of the smelters means that
industry is the largest energy consuming sector within Polokwane. However, when these are
excluded the Transport sector emerges as the largest energy consuming sector, followed by
industry, households/residential sector and the commercial sector.

7|Page
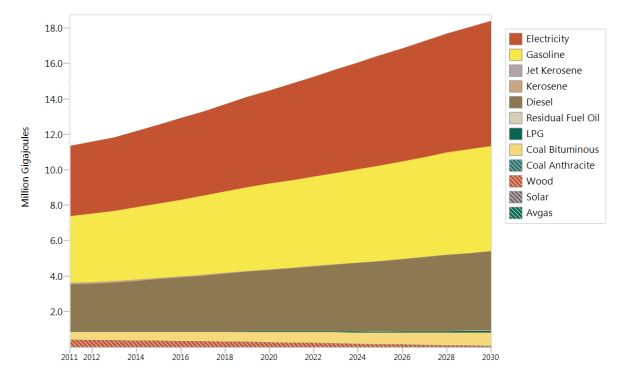
Figure 1: Polokwane energy consumption by sector, with and without smelters, 2011

Energy in Polokwane is met with three major fuels: electricity, petrol and diesel. These are all fossil
fuels and contribute to global warming.

Industrial fuel consumption includes the large smelters as well as a relatively large grouping of
heavy industry. These use both electricity and coal. Many industries form part of national or
multinational companies and may offer leadership in energy efficiency and alternative energy
development. Commercial energy consumption relates largely to office buildings and is relatively
small, but with the growth of Polokwane as the regional capital, ensuring an efficient built
environment offers important opportunities for energy savings, economic competitiveness and
enterprise development.

The residential sector (households) consume around 10% of energy in Polokwane, but as this is
heavily dependent on electricity, they contribute substantially to carbon emissions and, of
particular importance, to driving costly peak demand for electricity. The municipality has made
impressive strides with the electrification of low income households. This now stands at 83% of all
households and plans have been made with Eskom to tackle the backlog, which lies predominantly
in Eskom distribution areas. Electrification has seen an impressive decrease in dangerous and
harmful paraffin consumption by poor households. However, wood and candles are still used within
poor households, contributing to environmental degradation and household risk. Households also

8|Page
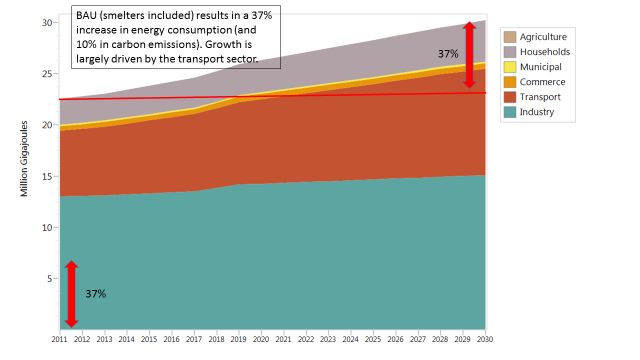
struggle to afford electricity and the municipality must continue to ensure basic grants reach all
indigent households.

Transport is a large energy consumer, despite the fact that some 68% of residents’ main form of
mobility remains walking. Ongoing support of walking and non-motorised transit is important.
Within motorised transport the figures indicate that some 25% of fuel consumption relates to
‘corridor’ traffic; the rest is used within Polokwane – for both freight and passenger purposes.
Within passenger transport, although 52% of commuters use public transport, this mode of
transport only consumes some 18% of all passenger fuel consumption. Private cars (moving half of
the 31% of motorised commuters) accounts for approximately 82% of passenger fuel consumption1.

Local government itself consumes a tiny portion of the municipal total – some 1%. However, it is an
important area in which to develop capacity that supports innovation in the energy sector and
demonstrate leadership. Polokwane municipality have an excellent track record with regards to
internal energy efficiency implementation, through the support of the Department of Energy
Municipal Energy Efficiency and Demand Side Management Programme.

The energy future model undertaken indicates that a ‘Business as Usual’ pathway for Polokwane
would result in an energy increase (excluding smelters) of around 69% by 2030, with an emissions
increase of 38%. This would render Polokwane vulnerable to rising fuel prices (often above inflation
and thus an economic drag) and potential carbon taxes. An alternative future, drawing on known
and viable efficiency and renewable energy interventions, will bring down rising energy demand,
emissions and will cost less, overall, than Business as Usual.

Figure 2: Possible future energy consumption by sector (optimal) compared to BAU scenario (without smelters) and
by cost.

This Green Goal energy future would be in line with the Polokwane mission and would support a
stronger economy and greater resilience amongst poor households. The Polokwane Green Goal
Energy and Climate Mitigation Strategy identifies 5 key goals in line with addressing the challenges
and opportunities identified within the exercise. These goals – efficiency, renewable energy,
alleviating poverty, public transport/NMT/urban form and institutional capacity – are supported by
a detailed action plan for implementation. A strong foundation of institutional capacity has been
laid to take this work forward.

1
  These figures are approximations made within the LEAP energy futures model, but they are plausible given total fuel
figures, national averages and are consistent with the patterns found in other South African cities.

9|Page
The development of this strategy update has been undertaken by Sustainable Energy Africa, through
the donor support of DFID/EPSRC (within the SAMSET Programme) and Bread for the World.

10 | P a g e
2. Introduction and background
2.1. Development of the strategy and implementation plan
At a Polokwane-SAMSET meeting of 29 January 2015, the decision was taken to review the
Polokwane Energy and climate change strategy, which was developed through a SALGA-led process
with Swiss Development Corporation funding, in 2013. The review was considered important as
new, improved energy data has become available and the energy sector is changing fast. There are
also new plans and developments underway in the municipality, including the IRPT plan. The need
to re-engage stakeholders, and through this ensure that the strategy is institutionalised across the
municipality, was also identified.
The strategy update process has involved an update of the energy data of the State of Energy
report (Aurecon, 2013), energy futures modelling (using the Long Range Energy Alternatives – LEAP
– software) and stakeholder engagements2. The energy futures model, available in a separate
report (Bryce Mccall, Adrian Stone, Polokwane LEAP model technical report, Energy Research Centre
University of Cape Town, 2016) provides an indication of what the energy picture in Polokwane
would look like up to 2040 on a Business-as-Usual trajectory, as well as under various, more
sustainable, ‘green goal’ energy pathways. This is a powerful strategic decision making tool. It has
been used to test and inform the key strategic priorities detailed in this report.
2.2. Purpose of the strategy and implementation plan
Local level energy strategies in the South African context support municipal service delivery, actions
and responses to national climate commitments, as detailed in the National Climate Change
Response White Paper (2011), as well as the areas of energy security, energy efficiency, access to
energy and renewable energy development as outlined in various pieces of energy-related
legislation and detailed in the 8 Objectives of the Draft Integrated Energy Strategy (DoE, 2012).
Polokwane’s Green Goal Energy and Climate Mitigation Strategy Update and Implementation Plan
provides an action agenda for the municipality relating to sustainable energy development to 2020.
It raises key issues of concern to Polokwane and identifies priority areas for attention. With the
help of energy futures modelling the strategy is able to assess the impact of inaction (“business as
usual”), as well as the impact of a range of sustainable energy interventions in the decades to
come.
Goals of a sustainable energy strategy
This strategy intends to develop understanding and a Reduce greenhouse gas
shared vision of Polokwane’s role in sustainable energy emissions
development and a common plan of action. It Maintain energy security
recognises and builds on the strengths and leadership Ensure access to safe, clean and
of the municipality, while identifying the gaps that affordable energy
exist in tackling this complex and challenging issue. The Maximise economic
opportunities
2
Stakeholder meetings were held in Polokwane on 29 January 2015, 22 March 2015 and 19 August 2015. These
meetings include a cross section of municipal departments, provincial government departments, SALGA, Eskom, and
the University of Limpopo.
11 | P a g estrategy provides a framework through which partners across the municipality can work together to
achieve the municipal energy vision of sustainable – reliable, safe, affordable – energy for all.
2.3. Institutional framework
Cities are increasingly orienting themselves to mitigate the risks associated with global climate
change, economic competitiveness and social inequity. Sustainable Energy is key in this and
ensuring that energy efficiency, renewable energy development and access of citizens to
affordable, reliable and safe energy is enhanced must be a priority of local government. Polokwane
municipality undertook a first State of Energy report and Strategy in 2013. This work was led by the
Energy Department and supported by the South African Local Government Association (SALGA).
Integrated Development Plan Municipal Vision:
“The ultimate in innovation and sustainable development.”
Energy and Climate Mitigation Strategy:
“The ultimate in energy innovation and leadership through the provision of sustainable energy
that is reliable, safe and affordable for all.”
A strong case exists that local government mandates include sustainable energy approaches3.
Further, the department derives its mandate from the Polokwane IDP Vision: “The ultimate in
innovation and sustainable development”. The Energy Department, falling with the Engineering
Services Directorate, continues to provide the institutional home for this work within Polokwane
municipality. An interdepartmental committee drawn from the Green Goal team has supported the
development and implementation of the strategy. This includes representation from Energy, Water
and Sanitation, Waste Management, Local Economic Development and Tourism, Facility
Management. Transport and Spatial Planning have been consulted, but are not yet regular
participants within the forum. This strategy is intended to become a more formal part of the Green
Goal Team’s mandate.
Polokwane Municipality is involved in local, national and global sustainable energy partnerships and
learning networks. Polokwane is a long-time member of the Association of Municipal Electricity
Undertakings (AMEU) and has been involved in the national Urban Energy network convened by
SEA-SALGA-SACN for a number of years. In 2013 Polokwane became a partner municipality within
the Supporting Sub Saharan Municipalities in Sustainable Energy Transition (SAMSET). Polokwane is
also part of the SEA-led, Bread for the World donor funded, Pioneering alternative energy services
models project. Polokwane has local partnerships with the University of Limpopo, Eskom regional
office and the provincial Local Economic Development, Environment and Tourism department
3
Section 152 of the Constitution of the Republic of South Africa (1996) contains two objectives that relate specifically to
the role of local government in achieving sustainable development through provision of services to communities in a
sustainable manner and promotion of a safe and healthy environment (Section 152 (1) (b) (d)). This object is reinforced
in the Municipal Systems Act (32 of 2000) and the Municipal Structures Act (117 of 1998), making it clear that municipal
functions must be interpreted with these goals in mind. The sustainable use of energy is clearly linked to a concern for a
healthy environment and a just and equitable distribution of resources (now and for future generations).
12 | P a g e(LEDET). Within Transport, Polokwane is engaged is large infrastructure projects involving partnerships with the German foreign donor agency, GIZ, amongst others. Figure 3. Polokwane Municipality organogram 2.4. Data sources and report method This report includes both a rapid update of energy data in Polokwane, drawing on the State of Energy undertaken for Polokwane by Aurecon (2013), with a base year of 2011 and an energy futures exercise that has involved detailed modelling of the Polokwane energy picture. A separate report on the Polokwane modelling exercise, undertaken by the Energy Research Centre of the University of Cape Town, is available (Bryce McCall, Adrian Stone, Polokwane LEAP model technical report, Energy Research Centre University of Cape Town, 2016). As far as possible the two reports have aligned data input4. An assessment of the state of energy and energy future in a municipal jurisdiction provides the basis for energy strategy development, target setting and action planning for a municipality. The study area is the municipal area of Polokwane. Consumption of energy is allocated to the city and 4 Data clarity on the exact composition of the electricity distribution figures is still required; this report and the LEAP model numbers have aligned, though the methods differ and confirmation of exact allocation of the Eskom ‘wheeled’ amount is still required. The LEAP model also scales up the difference between supply and distribution figures, whereas the Sate of Energy report records this as losses. Both are valid and offer particular insights. 13 | P a g e
the sectors according to a global protocols for local level energy and emissions accounting. Key
points about local scale energy data reporting include:
   a. All fuels sold in a local area are reported within that area, even if they may be physically
      consumed elsewhere, for example a car or aeroplane fills up with petrol in Polokwane, but
      journeys out of the area (note: the LEAP modelling exercise provides some important
      disaggregation of the Polokwane fuel picture in relation to in-city transport and corridor
      transport);
   b. All transport related energy consumption is assigned to a Transport sector, rather than to
      the respective sector, e.g. residential for passenger transport, commercial for freight, etc.
      This is because it is such a substantial sector, with particular dynamics that require a
      consolidated focus.
   c. The municipality is a “taker” of the national electricity mix, except where it independently
      purchases directly from another power supplier.

Table 1: Energy data sources

On the demand side:                               On the supply side:
Polokwane municipality: electricity sales data Eskom for electricity directly distributed from
and energy efficiency in municipal operations Eskom to Eskom customers within the municipal
sourced from the Energy Services Department.   boundaries.
StatsSA census 2001, 2011 and General National Department of Energy (DoE): for the
Household Survey 2012: for demographic and South African Petroleum Industry Association
energy data relating to Polokwane households. (SAPIA) liquid fuel data and national energy
                                              balance data.
Mthenthe household survey (2014). This survey As it is deregulated, coal data is difficult to
was commissioned by SEA to develop a more collect on any consistent basis, industries and
detailed understanding of household energy merchant data was explored.
consumption.

14 | P a g e
Table 2: Fuel supply data from Aurecon’s State of Energy report for Polokwane (2013) and additional
sources used to inform this update report
Fuel Quantity Units Year Source of data Sector
Avgas 177 420 Litres 2011 SAPIA Transport
Jet Fuel 120 021 Litres 2011 SAPIA Transport
Diesel 72 577 927 Litres 2011 SAPIA Transport
Diesel 680 000 Litres 2011 SAPIA Municipality
Petrol 119 734 125 Litres 2011 SAPIA Transport
Petrol 468 000 Litres 2011 SAPIA Municipality
HFO 1 681 770 Litres 2011 SAPIA Industry
LPG 391 893 Litres 2011 SAPIA Res/Comm
Paraffin 2 453 071 Litres 2011 SAPIA Residential
Coal 2 910 000 kg 2006 AQM 2006 Commerce
Coal 140 414 000 kg 2011/2006 Aurecon + AQM 2006 (adjusted so total all Industry
commerce/industrial coal = Aurecon 2013
Coal 71 646 kg 2011 total) for numeric error; Residential
Aurecon SoE 2013 (adjusted
= 1741 GJ)
Wood 5 429 353 kg 2011 Aurecon SoE 2013 (=92299 GJ) Residential
Charcoal 120 000 000 kg 2011 ERC Leap/Roundwood supply report Industry
Electricity 490 925 000 GWh 2011 Aurecon+Eskom+Nersa/Munic Households
Electricity 1 379 751 041 GWh 2011 Aurecon+Eskom+Nersa/Munic Industry
Electricity 97 739 000 GWh 2011 Aurecon+Eskom+Nersa/Munic Commerce
Electricity 450 000 GWh 2011 Aurecon+Eskom+Nersa/Munic Agriculture
Electricity 22 707 000 GWh 2011 Aurecon+Eskom+Nersa/Munic Municipality
In order to compare energy sources, units are converted to joules, the standard energy unit. The
conversion factors are drawn from the national Department of Energy, Draft 2012 Integrated
Energy Planning Report - Annexure B. The conversion factors used are given in the table below.
15 | P a g eTable 3: Energy conversion factors, South Africa
Density
Energy Carrier Energy Unit Energy Unit (kg/lit) MJ/kg
Aviation Gas (AvGas) 33.9 MJ/lit 0.0339 GJ/lit 0.73 46.4
Coal (general purpose) 24.3 MJ/kg 0.0243 GJ/kg
Diesel 38.1 MJ/lit 0.0381 GJ/lit 0.84 45.4
Electricity 3.6 MJ/kWh 0.0036 GJ/kWh
Heavy Fuel Oil (HFO) 41.6 MJ/lit 0.0416 GJ/lit 0.98 42.3
Jet Fuel 34.3 MJ/lit 0.0343 GJ/lit 0.79 43.3
LPG 26.7 MJ/lit 0.0267 GJ/lit 0.54 49.4
Natural Gas 41 MJ/m3 0.0410 GJ/m3
Paraffin Illuminating CSS
(StatsSA) Data 37 MJ/lit 0.0370 GJ/lit 0.79 47
Petrol 34.2 MJ/lit 0.0342 GJ/lit 0.72 47.3
Source: Department of Energy, Draft 2012 Integrated Energy Planning Report, Annexure B - Model Input and
Assumptions (Optimisation Model) (Published September 2013)
Table 4: GHG emissions factors for South Africa
South Africa: Emission Factors
CO2 CH4 N2O Default
Carbon
Energy source Unit Total tCO2e Reference
tonnes CO2e per unit Content
(tCO2e/GJ)
Diesel lit 0.0026870 0.000003626 0.000021760 0.002702000 0.07390
Petrol lit 0.0022640 0.000000327 0.000000020 0.002277000 0.06920
Aviation www.emissionfactors.
lit 0.0021920 0.000000313 0.000000019 0.002205000 0.07025
Gasoline com (Using 4th
Jet Kerosene lit 0.0025010 0.000000350 0.000000021 0.002516000 0.07175 Assessment Report
Illuminating GWP)
lit 0.0025620 0.000000356 0.000000021 0.002577000 0.07170
Paraffin
Heavy Furnace
lit 0.0029530 0.000000382 0.000000023 0.002968000 0.07720
Oil
Eskom Annual
Reports, 2011
Electricity kWh 0.001030000 0.30560
(excluding T&D
losses)
Natural Gas lit 0.0020090 0.000000179 0.000000004 0.000002013 0.05615
www.emissionfactors.
LPG lit 0.0016180 0.000128200 0.000002565 0.001622000 0.06320
com (Using 4th
Coal Assessment Report
kg 0.0026250 0.000000027 0.000000040 0.002810000 0.09440
(Bituminous) GWP)
Anthracite kg 0.0000001 0.000000000 0.000000000 0.002643000
Marine Fuels lit 0.0027667 0.000003000 0.000289800 0.003059500 0.07440 Set as same for diesel
Source: compiled by Sustainable Energy Africa, 2012
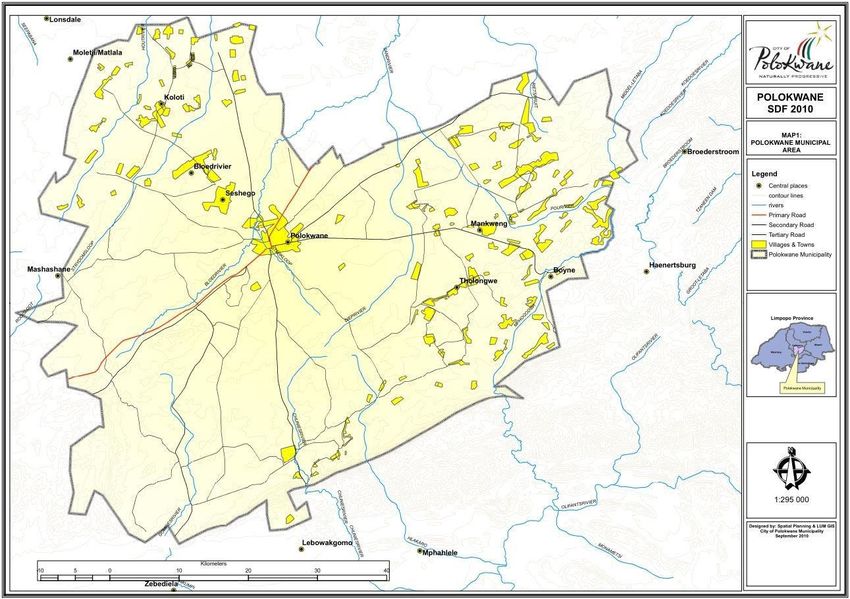
16 | P a g e3. Polokwane Energy Profile A sustainable approach to energy planning and management starts with the demand for energy – where and how is energy being used – and then strives to meet that energy demand in a manner that is equitable, affordable and with the minimum human and environmental harm. Polokwane’s energy demand is explored through these sectors: residential, commercial, industrial and transport. This is followed by an overview of how energy needs within Polokwane are currently met – the supply side picture. This energy data overview updates the more detailed report done by Aurecon in 2013, and is not a full State of Energy Report. 3.1. Polokwane municipality profile Polokwane Municipality is located in the central part of the Limpopo Province, in the Capricorn District. It is the administrative capital of the province, comprising 3% of the total surface area of the province, at 3775km2. According to Census 2011, the population of Polokwane was 628 999 people living in 178 001 households with an average of 3.4 persons per household. 45% of these households are female headed households. Population growth (average annual) in Polokwane has been 2.7% from 1996 – 2011 (with more rapid growth in the period 1996 – 2001 – 3.7%; and growth slowing from 2001 – 2011 to an average annual 2.2%). Households have grown more rapidly, at 5% average annual growth from 1996 – 2011, with household size decreasing over time from an average of 4.9 persons per household in 1996 to an average of 3.5 persons per household in 2011, i.e. households have ‘undbundled’, resulting in household growth outpacing population growth. The map below shows the spatial pattern of the municipality which is characterised by separate settlements. At the centre is the CBD, which houses the industrial area and range of social services - the economic drivers of the municipality - as well as the formal urban areas and together accounts for 23% of the geographic area of the municipality. On the outskirts are rural/peri-urban settlements, the main clusters being Seshego, Mankweng, Molepo and Moletjie, which account 71% of the city. Much of this land remains held in traditional land tenure systems. This presents particular challenges to the municipality in that it does not exercise authority over much of the land within its jurisdiction. This land is also effectively ‘free’ and not subject to rates and taxes, encouraging a dispersed settlement pattern that may challenge densification needed for greater investment in public transport systems. Although the physical composition of the city is largely rural/peri urban, 89.40% of the households reside in formal dwellings and informality is a relatively small phenomenon. Polokwane is a developing economy with Census 2011 data indicating 13.8% of households with no income and a further 55% of households earning an income of less than R3 200/month (i.e. under the poverty line). A total of 63.4% of the households earn an income of less than R76 400 per annum which is within the lower to middle income group (bracket). The total unemployment rate was 32.4% of the population in 2011. 17 | P a g e
Households that have registered in the indigent register for basic services in the municipality
receive 6kl of water per month for the Urban Regional Water Scheme. However, all households in
rural areas receive free basic water. Free basic services relating to energy include provision of
100kWh of electricity for households in the indigent register. Between 2013 and 2014, 23 113
households received free basic services for electricity and water. This represents a decline in the
number of households reached, but an improvement in the quantity of the service, from 50 –
100KWh/month (in 2011, 115 082 households received free basic water services and 27 000
households received free basic electricity).

Figure 4: Polokwane Municipality (Spatial Development Framework, 2010)

18 | P a g e
3.2. Energy data tables: Polokwane sustainable energy indicators and
     energy and emissions overview tables

Table 5: Key sustainable energy indicators for Polokwane, 2011 (including smelters)

 Energy and emissions overview                                      Value
 Energy per capita (GJ)                                             35
 Energy per GVA (GJ/R millions)                                     1 307
 GHG per capita (tonnes CO2e)                                       4.8
 GHG per GVA (tCO2e/R millions)                                     179
 General                                                            Value
 Population density (people/km2)                                    167
 Population growth (% p.a.)                                         2.2% (2001 – 2011)
 Unemployment (narrow)                                              32%
 Unemployment (broad)                                               40%
 Informal households (%)                                            9%
 Indigent households (
Table 6: Energy demand (native units) in Polokwane by energy type and sector, 2011 (including
smelters)
Fuel Residential Commercial Industrial Transport Government Agriculture Total
Electricity total (kWh) 490 925 000 97 739 000 1 379 751 041 - 22 707 000 450 000 2 099 171 421
Coal (kg) 71 646 2 910 000 155 154 000 - 158 135 646
Charcoal (kg) 120 000 000 120 000 000
Petrol (litres) 119 734 125 119 734 125
Diesel (litres) 75 577 927 75 577 927
Paraffin (litres) 2 453 071 - 2 453 071
LPG (litres) 97 973 97 973 195 947 - 391 893
Natural Gas (litres) - - -
HFO (litres) 1 681 770 - 1 681 770
Jet Fuel (litres) 120 021 120 021
Aviation Gas (litres) 177 420 177 420
Int Marine (litres) -
Wood (kg) 5 429 353 5 429 353
Losses
Electricity losses (calculated by subtracting sum of munic sales by sector from munic total) (kWh) 107 599 380
Electricity losses check (%) (generally ranges between 5-15%) 14%
Table 7: Energy demand (GJ) in Polokwane by energy type and sector, 2011 (including smelters)
GJ Residential Commercial Industrial Transport Government Agriculture Losses Total
Electricity 1 767 330 351 860 4 967 104 - 81 745 1 620 387 358 7 557 017
Coal 1 741 70 713 3 770 242 - - - - 3 842 696
Charcoal - - 3 600 000 - - - - 3 600 000
Petrol - - - 4 094 907 - - - 4 094 907
Diesel - - - 2 879 519 - - - 2 879 519
Paraffin 90 764 - - - - - - 90 764
LPG 2 616 2 616 5 232 - - - - 10 464
Heavy Furnace Oil - - 69 962 - - - - 69 962
Jet Fuel - - - 4 117 - - - 4 117
Aviation Gasoline - - - 6 015 - - - 6 015
International Marine - - - - - - - -
Wood 92 299 - - - - - - 92 299
TOTAL 1 954 750 425 189 12 412 539 6 984 557 81 745 1 620 387 358 22 247 758
Table 8: Energy-related GHG emissions by energy source and sector (tCO2e), 2011 (including smelters)
tCO2e Residential Commercial Industrial Transport Government Agriculture Losses Total
Electricity 505 653 100 671 1 421 144 - 23 388 464 110 827 2 162 147
Coal 176 7 155 381 474 - - - - 388 805
Charcoal - - - - - - - -
Petrol - - - 272 719 - - - 272 719
Diesel - - - 204 238 - - - 204 238
Paraffin 6 323 - - - - - - 6 323
LPG 159 159 318 - - - - 636
Heavy Furnace Oil - - 4 994 - - - - 4 994
Jet Fuel - - - 302 - - - 302
Aviation Gasoline - - - 391 - - - 391
International Marine - - - - - - - -
Wood - - - - - - - -
TOTAL 512 311 107 985 1 807 930 477 650 23 388 464 110 827 3 040 556
20 | P a g e4. Polokwane energy demand 4.1. Current energy picture The total amount of energy consumed in Polokwane in 2011 was 22 247 758 GJ, and 35 GJ per capita. This is indicative of Polokwane’s status as a fairly industrialised, administrative capital city: for the same year the national average was 52 GJ/capita, metros averaged at 36 GJ/capita and ten of the country’s major secondary cities (which include a number of heavy industries) averaged 65 GJ/capita (SEA, 2015). Figure 5. Energy consumption per capita across South African cities and towns, 2012 21 | P a g e
Figure 6. Energy consumption of South African cities and towns as a share of national, 2012

Polokwane’s energy picture (Figure 7) is dominated by electricity which is used to meet 34% of
the energy demand of the municipality and contributes 71% to carbon emissions. Petrol (18%)
and diesel (13%), if taken together, represent 31% of energy consumed, coal 17% and charcoal
16%. Paraffin accounts for a relatively small 1% of total demand (and liquid petroleum gas, heavy
furnace oil, jet fuel, aviation gasoline represent even less than 1%).

All of these fuels, save charcoal, are fossil-fuel derived. The substantial – 71% - contribution of
electricity to the city’s carbon emissions is due to the high carbon content of coal used to supply
electricity in South Africa. Coal, petrol and diesel (respectively) contribute the remainder of
carbon emissions.

22 | P a g e
Figure 7: Polokwane energy consumption and carbon emissions by energy source, 2011 (with smelters)

Within Polokwane’s municipal boundary there are two industrial smelters, which contribute to
Polokwane’s industrial sector being the highest energy consumer at 56%, followed by the
transport sector (31%), residential (9%) and commercial sector (2%) (Figure 8). The governmental
and agricultural sector have relatively insignificant contributions to the energy consumption in
the city. The largest contributor to greenhouse gas emissions is the industrial sector (59%),
followed by the residential sector (17%), transport (16%) and commercial sector (3%). Electricity

23 | P a g e
losses (technical and non-technical account for a sizeable 2% of total energy and 4% of total
carbon emissions. This is larger than that consumed by the municipality in carrying out its
functions, and equivalent to the commercial sector energy consumption.

Figure 8: Polokwane energy consumption and carbon emissions by sector, 2011 (with smelters)

4.2. Residential sector
Households in Polokwane consume 9% of the total energy in Polokwane and contribute 17% to
the municipality’s carbon emissions. Electricity meets the majority of household energy demand,
followed by candles used for lighting, LPG, paraffin and wood used for both cooking and space
heating. Although only 9% of total energy used, the residential sector accounts for 23% of
electricity consumed in the municipality. In addition, this sector is largely responsible for peak
demand (which is often costly for the municipality).

24 | P a g e
The electrification programme has boosted access to electricity and electrification in Polokwane
currently stands at 83% of households (a significant increase since 2001). Most unelectrified
households are in the Eskom distribution areas and the municipality has now begun to work with
Eskom towards electrification in these areas. This is a significant step towards meeting the energy
needs of some 30 000 households that remain without access to electricity.

Figure 9. Households using electricity for lighting (a proxy for electrification) 2001 - 2011

Electrification has seen an important decline in dangerous fuels such as paraffin and candles, as
well as fire wood, which contributes to indoor air pollution and environmental degradation.
These are all important gains that have been made. However, poor households are now
increasingly dependent on one fuel source – electricity – and rising costs must be managed to
ensure ongoing access to energy by the poor.

Expenditure on electricity varies across income group, with low income households (earning less
than R3 200/month) spending on average R268/month on electricity, mid-income (earning
R3 201 – R12 800) R365 and high income (above R12 800/month) R651 (SEA 2015, from
Mthenthe Household Survey data, 2014). Polokwane has a pro-poor electricity tariff structure
and, together with free basic electricity of 100kWh/month received by indigent households, has a
policy framework that enables access by the poor to electricity. An issue of potential concern is
the registration of indigent households: the indication from the Census data is that only some
32% of indigent households are registered to receive the FBE subsidy.

25 | P a g e
4.2.1. Lighting
Electricity is the major fuel used for lighting in both low (below R3 200/month) and mid-high
income households (all households above R3 200/month) even though it’s slightly higher in the
mid-high income households. Both low and mid-high income households use other fuels for
lighting, however, low-income households have a higher proportion of alternative energy fuel
use. After electricity, candles are the next major source of lighting. These pose substantial health
and fire risks to households and thus, although the use of candles has declined substantially since
2001, the continued use of them in just under 20% of households remains a concern.

Figure 10: Fuels used for lighting by low-income households in Polokwane, 2011

Figure 11: Fuels used for lighting by low-income and mid-high households in Polokwane, 2001

     4.2.2. Cooking
Electricity is the dominate energy fuel used for cooking across all income bands. Low-income
households have doubled in the use of electricity for cooking since 2001, which has reduced the
use of alternative energy fuel to less than 40% of households. Both low and mid-high income
households use alternative energy fuels for cooking with a higher fuel mix for cooking in low
income households. Wood has the highest proportion of use, followed by paraffin and LPG. The
prevalent use of wood and paraffin is due to its availability/ease of access. In some instances fire
wood may come ‘free’ as an environmental resource. However, the trend points to a sizeable
reduction in fire wood for cooking, which may represent a positive outcome for indoor air
pollution as well as environmental degradation.

26 | P a g e
Figure 12: Fuels used for cooking by low-income and mid-high households in Polokwane, 2011
Figure 13: Fuels used for cooking by low-income and mid-high income households in Polokwane, 2001
4.2.3. Water heating
Along with lighting and cooking, water heating is a major consumer of household energy. The
dominant water heating appliance used is conventional geysers in high income households (53%)
and the kettle in mid-income households (61%) and low income households (40%). Combined,
paraffin and electric stoves are used to heat water in 50% of low income households.
4.2.4. Space heating
Similar to cooking, households in Polokwane use a mixture of fuel sources to meet their space
heating needs. Electricity remains the dominant fuel used however, since 2001 the number of
mid-high households using electricity for space heating has decreased. A significant percentage of
low-income households use wood for space heating, as well as LPG and paraffin. Wood and
paraffin carry potential health and disaster risks. It is not clear whether the increase in no use of
fuel for space heating is due to the rising cost of fuels (particularly electricity), or simply relates to
census question shifts.
Figure 14: Fuels used for space heating by low-income and mid-high income households in Polokwane, 2011
Figure 15: Fuels used for space heating by low-income and mid-high income households in Polokwane, 2001
27 | P a g eSpace heating energy needs are in part an indication of thermal performance of the houses in Polokwane. Thermal insulation in houses ensures that indoor temperatures are kept constant throughout the year which allows households to spend less money on space heating and cooling. A study conducted in Polokwane involving 250 households involving all households’ types; high, mid and low income households indicated that 69% of high income households owned houses with ceilings while in mid and low income households more than 50% of the households in both households types did not have ceilings. This is attributed to the type of dwelling poor households reside in, which is informal housing often shacks or government subsidised houses that often do not have ceiling. Figure 16. Proportion of houses with ceilings across income groups in Polokwane (Mthenthe survey, SEA 2015) 4.3. Commercial and industrial sectors The industrial sector accounts for 56% of energy consumption compared to the commercial sector that only accounts for 2% of the energy consumed in Polokwane. The commercial sector is predominantly electricity based, with a small amount of coal and LPG usage. Although in relative proportions this is a small sector, commercial buildings within Polokwane, particularly relating to its location as a regional capital, are on the increase. Greater knowledge of this sector would be valuable. A number of dry cleaners, hospitals and schools use coal for dry cleaning/laundry purposes. Within industry, heavy industry, in the form of the two smelters (Anglo Platinum and Silicon) dominates the energy picture. These smelters use substantial amounts of electricity, supplied directly from Eskom and coal for heating purposes. Charcoal is used as a reducing agent in the Silicon smelter works. It has been included in the energy picture, however the percentage actual energy used from this fuel source is not known. Other, smaller industries include Coca Cola plant, Sasko, Enterprise Foods, and South African Breweries (SAB). 28 | P a g e
Figure 17. Industrial sector fuel breakdown

4.4. Transport and Mobility
The size of the transport sector in Polokwane is slightly masked by the presence of heavy
industry, but at 31% it represents a substantial portion of energy demand. If heavy industry (i.e.
the smelters) is excluded, transport accounts for well over half of energy demand in Polokwane.

Polokwane is on the N1 and services this major transport corridor connecting the north with
Gauteng. Analysis within the LEAP model provides some valuable analysis of the relative
contrbution of corridor transport to total fuel consumption. The indication is that the corridor
transport accounts for around 25% of total transport fuel; with 75% being used for local transport
– passenger and freight5.

Various factors within Polokwane will influence the mobility patterns and consequent fuel usage.
This can include settlement patterns - Polokwane has both rural and urban components and
traditional land ownership opportunities may encourage fairly sprawling settlement patterns.
Analysis done within the LEAP energy futures modelling exericse indicates a potentially high use
of bakkie’s, which would be consistent with the rural aspect of the municipality. Within rural
parts of the municipality, walking is still a norm and the small size of the city centre also enables
walking to remain a viable means of getting around. An astonishing 68% of mobility in
Polokwane is achieved through walking (cited as a person’s major form of mobility within the
census 2011). This modal form may account for the majority of people, but would represent a
small proportion of the passenger kilometers undertaken within the city.

5
    McCall and Stone, 2016.
29 | P a g e
Table 9. The modal share for Polokwane commuters (source: Polokwane Integrated Transport Plan 2007) MODE OF TRAVEL % of total trips Bus 6.58% Minibus Taxi 9.69% Train 0.30% Car (Driver) 7.46% Car (Passenger) 7.25% Motorcycle 0.32% Bicycle 0.55% Foot 67.48% Other 0.36% Total 100% Figure 18. Number of people using motorised transport versus non-motorised in Polokwane, 2011 From the perspective of number of commuters, motorised transport is dominated by the use of public transport, representing 52.6% of all commuter trips. Figure 19. Percentage of commuters using private or public transport modes in Polokwane, 2011 Although the majority of citizens use public transport or NMT, this sector only accounts for a relatively small amount of the petrol consumed. The major fuel consumption within passenger transport in Polokwane may be attributed to private car use: 30 | P a g e
You can also read