Joint Multi-Sector Needs Assessment - (J-MSNA) COX'S BAZAR, BANGLADESH - Published May 2021 - ReliefWeb
←
→
Page content transcription
If your browser does not render page correctly, please read the page content below
COX’S BAZAR, BANGLADESH

Joint Multi-Sector
Needs Assessment
(J-MSNA)

Host Community

Published May 2021

Joint Multi-Sector Needs Assessment (J-MSNA), Host Communities
COORDINATED BY:
FUNDED BY:
TECHNICAL CONTRIBUTIONS:
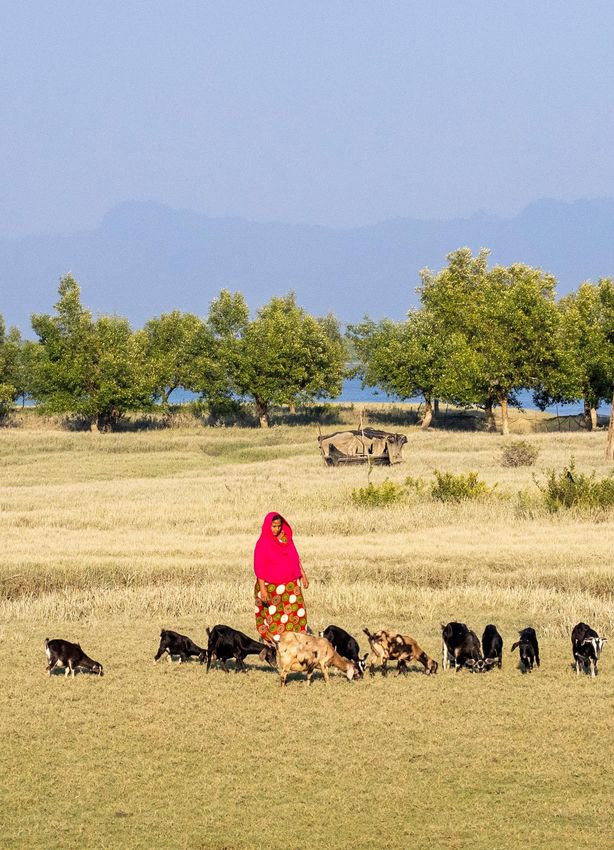
Photo credit: © ISCG: S. Mojumder
Please note the findings of the Joint Multi-Sector Needs Assessment (MSNA) provide information and insights which are current
at the time when the assessment was completed. However, in a dynamic setting, as is the case in a humanitarian response, the
situation may change. Interventions and aid distribution may be increased or reduced, and this can change the context of the data
collected between the MSNA and the situation at the present time.
This publication has been produced with the assistance of the Office of the United Nations High Commissioner for Refugees
(UNHCR). The contents of this publication are the sole responsibility of the MSNA TWG and can in no way be taken to reflect the
views of UNHCR.
This document covers humanitarian aid activities implemented with financial assistance of the European Union. The views
expressed herein should not be taken, in any way, to reflect the official opinion of the European Union, and the European
Commission is not responsible for any use that may be made of the information it contains.
This publication has been produced with the assistance of the International Organization for Migration (IOM). The contents of this
publication are the sole responsibility of the MSNA TWG and can in no way be taken to reflect the views of IOM.
2
Joint Multi-Sector Needs Assessment (J-MSNA), Host Communities

EXECUTIVE SUMMARY

 The District of Cox’s Bazar, located in southern Bangladesh, has some of the poorest living conditions in the country.1
 At the same time, over the last four decades, in successive waves, it has received Rohingya refugees fleeing from
 targeted violence and persecution in Rakhine State, Myanmar. Since August 2017, an estimated 745,000 Rohingya
 refugees have fled to Cox’s Bazar District, where approximately 860,000 refugees are now residing in 34 camps in
 Ukhiya and Teknaf Upazilas.2 Needs among the host communities in Ukhiya and Teknaf arise mainly from existing
 development challenges, but may have been compounded by the refugee influx.3 With the refugee population being
 almost double the host community population in the two upazilas,4 the massive increase in population density following
 the influx, coupled with the pre-existing lack of livelihoods, levels of poverty and vulnerability among the host community
 population, has led to tensions over labour competition, falling wages and price hikes of daily essentials. Perceived
 increases in crime, security concerns, and high pressures on the environment leading to deforestation and depleting
 water sources have further been reported as sources of tension.5 The outbreak of the COVID-19 pandemic and
 associated containment measures put in place nationwide on 22 March 2020 severely disrupted livelihoods among the
 host community populations, which is likely to have exacerbated pre-existing needs. As such, sustained assistance
 and effective prioritisation for 2021 will be essential to be able to meet persisting levels of need.

 As the response has moved beyond the initial emergency phase, there is a continued need for up-to-date information
 on the needs and vulnerabilities of the host community, in order to inform the design and implementation of effective
 inter-sectoral programming. At the same time, an understanding of the impact of the COVID-19 outbreak and
 associated containment measures on household-level multi-sectoral needs, capacities and access to services will be
 essential for a full understanding of priority needs for 2021. Against this background, a Joint Multi-Sector Needs
 Assessment (J-MSNA) was conducted across host community populations to inform evidence-based strategic planning
 of humanitarian response activities by the Strategic Executive Group (SEG), the Inter Sector Coordination Group
 (ISCG) Secretariat, sectors, and sector partners. The J-MSNA further aimed to provide an analytical basis for the
 development of the 2021 Joint Response Plan (JRP). It built on previous MSNAs, in particular the 2019 J-MSNA with
 the goal to facilitate an understanding of the evolution of needs and service gaps across time, and was implemented
 through the ISCG’s MSNA Technical Working Group (TWG) of the Information Management and Assessment Working
 Group (IMAWG), which is led by the ISCG and comprised of the United Nations High Commissioner for Refugees
 (UNHCR), the International Organization for Migration Needs and Population Monitoring (IOM NPM), ACAPS, and
 REACH. Sectors were actively involved in research design, preparations for data collection, and the discussion of
 results and analyses.

 The J-MSNA targeted all host community households residing in Ukhiya and Teknaf Upazilas. Sectors covered
 included Food Security, WASH, Shelter and Non-food items (NFIs), Protection, including the Child Protection and
 Gender-Based Violence Sub-Sectors, Health, Education, Nutrition, and Communication with Communities (CwC). Both
 quantitative and qualitative data was collected. For the quantitative component, households were sampled from

 1 ACAPS, Cox’s Bazar: Upazila Profiles (September 2020) (Cox’s Bazar, 2020). Available here (accessed 23 November 2020).
 2 Inter Sector Coordination Group (ISCG), Situation Report Rohingya Refugee Crisis, Cox’s Bazar, Bangladesh, June 2020 (Cox’s Bazar, 2020a). Available here
 (accessed 23 November 2020).
 3 Inter Sector Coordination Group, 2020 Joint Response Plan, Rohingya Humanitarian Crisis, January – December 2020, Bangladesh (Cox’s Bazar, 2019). Available

 here (accessed 23 November 2020).
 4 Bangladesh Bureau of Statistics, Population & Housing Census-2011, National Volume-2: Union Statistics (Dhaka, 2011).
 5 ACAPS, 2020; ISCG, Joint Multi-Sector Needs Assessment (J-MSNA): Host Communities – In-Depth | August – September 2019 (Cox’s Bazar, 2019). Available

 here (accessed 23 November 2020).

                                                                                                                                                            3
Joint Multi-Sector Needs Assessment (J-MSNA), Host Communities
UNHCR survey data as well as UNHCR and IOM beneficiary databases, using a stratified probability-proportional-to-
size (PPS) random sampling approach, with stratification at the upazila level and a PPS sampling approach at the
union and ward levels, as well as by gender of respondent. Results are representative of the population included in the
sampling frame, i.e. households living in the vicinity of UNHCR camps and/or being UNHCR/IOM project beneficiaries,
registered with phone numbers and in areas with mobile reception, at the upazila level at a 95% confidence level and
with a 5% margin of error. A total of 911 interviews were carried out between 28 July and 13 August 2020. Basic
descriptive analysis was conducted, complemented by testing for statistically significant differences in outcomes
between households of different socio-economic characteristics, and a comparison of 2019 and 2020 results, where
possible. Qualitative key informant interviews (KIIs) were used to supplement quantitative data collection, contextualise
and validate findings, and draw qualitative links between sectoral outcomes. A total of 23 KIIs were conducted with
ward members between 20 and 30 August 2020.
Quantitative data collection was conducted remotely over the phone, while qualitative data collection was conducted
both in-person and remotely. The remote data collection modality limited the type and quantity of information that could
be collected and therefore the depth of analysis, and put constraints on the populations that could be included in the
sampling frame. While the KIIs and a secondary data review, as well as the sampling approach, mitigated the impact
of those constraints, results should be interpreted cognisant of possible gaps and biases, for instance resulting from
the exclusion of sensitive topics from the household survey, phone ownership being slightly biased towards men and
better educated households, as well as mobile reception being unequal across different areas. Lastly, while current
levels of need have to be explained within the context of the COVID-19 outbreak and associated containment
measures, it was beyond the scope of this assessment to analyse expected levels of need if the containment measures
had not been put into place. The findings are therefore intended as an overview of existing levels of need and not as
an evaluation of the lockdown or COVID-19 containment measures.
Key findings
The COVID-19 outbreak and associated containment measures severely disrupted income-earning among host
community households, and compared to 2019,6 in particular needs related to food security, health-seeking behaviour,
education and (child) protection increased. At the same time, households’ capacity to meet their needs and cope with
service gaps, including recurring ones, such as monsoon-induced shelter damage, has been considerably reduced. As
a result, households are increasingly adopting coping mechanisms, including crisis-level ones. Even following
the lifting of the lockdown, this can be expected to be reflected in household levels of need and capacity to
cope with those as well as possible future shocks in the near and medium term, with households that were
already most vulnerable pre-COVID-19 likely to continue to also be most negatively affected by its secondary
impacts.
Needs prioritised by households included access to food (reported by 55% of households among their top
three priority needs), access to cash (54%) and shelter materials (40%). This was followed by access to income-
generating activities (IGAs) (30%) and access to clean drinking water (26%). Compared to 2019,7 especially the
proportions of households considering access to food and access to IGAs priority needs (42% and 22% in 2019 –
access to cash was not assessed in 2019) increased considerably, likely reflecting the impact of the COVID-19
outbreak on food security and livelihoods.
6 ISCG, 2019.
7 Ibid.
4Joint Multi-Sector Needs Assessment (J-MSNA), Host Communities
Certain needs and service gaps that had already existed pre-COVID-19 remained unchanged, while others were
exacerbated. Similar to 2019,8 roughly a quarter of households (24%) reported not having made any
improvements to their housing in the six months prior to data collection despite having reported issues, largely
due to a lack of money to pay for materials and/or labour. Over 40% of households reported having used purchased
and/or self-collected firewood as a source of cooking fuel in the four weeks prior to data collection, and only 26%
reported having used exclusively LPG.
The majority of households reported accessing improved drinking water sources. However, 23% reported not having
enough water to meet all domestic needs and several KIs reported water quality to be an issue. In addition, sanitation
and waste management remained problems, with 14% of households reporting adult household members
sometimes practising open defecation and 11% of households reporting often or sometimes finding visible
waste in the vicinity of their accommodation.
The COVID-19 outbreak and associated containment measures severely disrupted income-earning and
considerably reduced households’ levels of income compared to pre-COVID-19 levels. Likely linked to the
reduced levels of income, by July, Food Consumption Scores (FCS) had dropped considerably compared to last
year, with a doubling in the proportion of households with a poor FCS from 4% to 8%, and a drop in acceptable FCS
from 72% to 43%. The overall high proportion of households reporting having adopted food-based coping strategies in
the seven days prior to data collection due to a lack of food (76%) is further indicative of food shortages and
consumption gaps.
In addition, overall health outcomes may have been negatively affected by the impact of the COVID-19 outbreak
on health-seeking behaviour, with the proportion of individuals reported sick enough to require medical treatment
having dropped from 31% in 2019 to 14% in 2020. This is likely to reflect a drop in the proportion of individuals that
sought treatment when they should have, and thus a reduction in health-seeking behaviour. Pre-existing barriers to
seeking treatment, such as distance to health facilities and a lack of money to seek treatment, may have been
compounded by health centres having closed and the number of health staff having been reduced at the start of the
lockdown.
Moreover, the proportion of households with pregnant/lactating women (PLWs) reporting PLWs to be enrolled
in nutrition-feeding programmes remained low (12%), as did the proportion of children aged 6 to 59 months
reportedly enrolled in nutrition-feeding programmes (15%). This is likely linked to more limited nutrition
programming in host communities compared to camps, but also to low levels of awareness or understanding of nutrition
services and their benefits.
School enrolment rates also remained low, with 40% of individuals aged 4 to 24 reportedly not having attended any
type of formal schooling for at least four days a week in the 30 days prior to school closures in mid-March due to the
COVID-19 outbreak. Less educated households and those with high dependency ratios were significantly more likely
to report out-of-school children.
School closures possibly also contributed to an exacerbation of protection risks for children, reportedly posing concerns
not only related to education but also to children’s well-being. Child protection issues were reported to have
8 Ibid.
5Joint Multi-Sector Needs Assessment (J-MSNA), Host Communities
increased since the lockdown, in particular child labour, which was reported to have increased in communities by
almost half the households (49%).
Lastly, almost half the households (48%) reported never having been consulted on needs, preferences, or the
delivery of humanitarian assistance since the COVID-19 outbreak, and 45% reported not having received clear
awareness messages on both cyclone early warning and/or sources of information.
Increased levels of need, coupled with reduced levels of income led to an increasing adoption of livelihoods-based
coping strategies, including crisis-level coping mechanisms. As households were less able to rely on previously
common coping strategies, such as borrowing money, they increasingly eroded assets and savings and adopted more
crisis-level mechanisms. Such an erosion of coping capacities will likely render households more vulnerable to future
shocks, such as a second disruption to assistance or a further loss of livelihood opportunities. It can further be expected
to have negative repercussions on health, food security and nutrition as well as household exposure to
extreme protection risks.
Households that were more vulnerable pre-COVID-19 are likely to also have been most vulnerable to the
secondary impacts of the COVID-19 outbreak, including female-headed households or households without a
working-age or adult male, households with persons with disability (PWDs), and large households or
households with high dependency ratios. Households without adult males were significantly more likely to report
having adopted a number of food-based coping strategies and to have relied on food rations or support from family or
friends as the only sources of food and income due to a lack of money to meet basic needs. Households with PWDs
were also significantly more likely to report having adopted emergency coping strategies as well as food-based coping
strategies, as well as having relied on assistance or community support to obtain food, and/or having gone into debt to
cover health expenses. Lastly, large households were significantly more likely as well to report having adopted
emergency coping strategies due to a lack of money to meet basic needs in the 30 days prior to data collection.
Host communities largely lacked information on the types of humanitarian assistance available to them, with
the majority of households reporting not having received enough information on any type of humanitarian assistance
since the COVID-19 outbreak, with the exception of food assistance. Household levels of satisfaction with
assistance before and after the COVID-19 outbreak were similarly low. However, households with female
respondents more frequently reported that households had not received different types of assistance at all, while
households with male respondents more frequently reported not having been satisfied.
Given the exacerbated needs and the severe erosion of coping capacities, as well as the quickly changing levels of
need that can be expected as the pandemic evolves and humanitarian programming continues to be adapted, in the
near and medium term, it will be of great importance to continue to closely monitor needs and service gaps to allow
for continued evidence-based programming. Moreover, additional information on the impact of the lockdown on
levels of security, protection-related incidents and their impacts on household and individual well-being is
required to be able to effectively counter negative trends. Furthermore, a better understanding of the impacts of the
COVID-19 outbreak and associated containment measures on the most vulnerable households may help more
effectively alleviate those. Both will require carefully designed in-person data collection. In the long term and in the
context of future MSNAs, a more comprehensive assessment of key barriers to accessing different types of
services faced by different groups of households and individuals may contribute to reducing persisting
vulnerabilities in the long run.
6Joint Multi-Sector Needs Assessment (J-MSNA), Host Communities
CONTENTS
EXECUTIVE SUMMARY ...............................................................................................................................................3
Key findings ...............................................................................................................................................................4
CONTENTS ...................................................................................................................................................................7
List of Acronyms ........................................................................................................................................................8
Geographical Classifications .....................................................................................................................................9
List of Figures, Tables and Maps ...............................................................................................................................9
INTRODUCTION..........................................................................................................................................................11
METHODOLOGY.........................................................................................................................................................13
Specific objectives and research questions .............................................................................................................13
Scope and tool development ...................................................................................................................................13
Sampling strategy ....................................................................................................................................................14
Data collection .........................................................................................................................................................15
Data analysis ...........................................................................................................................................................17
Secondary data review ............................................................................................................................................18
Ethical considerations and dissemination ................................................................................................................18
Challenges and limitations .......................................................................................................................................19
FINDINGS ....................................................................................................................................................................21
Priority needs...........................................................................................................................................................21
Needs and service gaps ..........................................................................................................................................22
Erosion of coping capacities ....................................................................................................................................32
Vulnerability .............................................................................................................................................................33
Accountability to Affected Populations .....................................................................................................................40
CONCLUSION .............................................................................................................................................................43
ANNEXES ....................................................................................................................................................................45
Annex 1: Household surveys completed per union..................................................................................................45
Annex 2: Key informant interviews completed by gender and union .......................................................................46
Annex 3: Agenda of enumerator training .................................................................................................................47
Annex 4: Partners involved in the assessment ........................................................................................................50
7Joint Multi-Sector Needs Assessment (J-MSNA), Host Communities
List of Acronyms
AAP Accountability to Affected Populations
BDT Bangladeshi Taka
COVID-19 Coronavirus Disease 2019
CP Child protection
CwC Communication with Communities
DAP Data analysis plan
DC Deputy Commissioner
ECHO Directorate-General for European Civil Protection and Humanitarian Aid Operations
FCS Food Consumption Score
IGA Income-generating activities
IMAWG Information Management and Assessment Working Group
ISCG Inter Sector Coordination Group
IOM NPM International Organization for Migration Needs and Population Monitoring
J-MSNA Joint Multi-Sector Needs Assessment
JRP Joint Response Plan
KI Key informant
KII Key informant interview
LPG Liquefied petroleum gas
NFI Non-Food Item
NGO Non-Governmental Organisation
PLW Pregnant/lactating women
PPS Probability-proportional-to-size
PSEA Protection against sexual exploitation and abuse
PWD Person with disability
RRRC Refugee Relief and Repatriation Commissioner
SDR Secondary data report
SEG Strategic Executive Group
SGBV Sexual and gender-based violence
SOP Standard Operating Procedure
TWG Technical Working Group
UNHCR United Nations High Commissioner for Refugees
UNO Upazila Nirbahi Officer
WASH Water, Sanitation and Hygiene
WFS Women-friendly spaces
WFP World Food Programme
8Joint Multi-Sector Needs Assessment (J-MSNA), Host Communities
Geographical Classifications
District Third tier of administration in Bangladesh, forming sub-units of divisions
Upazila Fourth tier of administration in Bangladesh, forming sub-units of districts
Union Fifth tier of administration in Bangladesh, forming sub-units of upazilas
Ward Sixth tier of administration in Bangladesh, forming sub-units of unions
List of Figures, Tables and Maps
Figure 1 % of households reporting priority needs, overall and by gender of respondent (top 5) ...............................21
Figure 2 % of households reporting preferred modality to receive assistance ............................................................22
Figure 3 % of households reporting source of cooking fuel in the 4 weeks prior to data collection .............................23
Figure 4 % of households reporting out-of-school children by the highest level of education in the household ..........25
Figure 5 % of households reporting out-of-school children by dependency ratio (p-value ≤ 0.01)..............................25
Figure 6 % of households reporting having received clear awareness information on different topics .......................26
Figure 7 % of households reporting impact of the COVID-19 outbreak on the household ..........................................27
Figure 8 % of households by Food Consumption Score .............................................................................................28
Figure 9 % of individuals reported to have had an illness serious enough to require medical treatment or to require a
regular medical check-up in the 30 days prior to data collection ..................................................................................29
Figure 10 % of individuals reported to have had an illness serious enough to require medical treatment or to require a
medical check-up in the 30 days before data collection, for whom treatment was sought and who sought treatment at
a private clinic ..............................................................................................................................................................29
Figure 11 % of households reporting having to walk more than one hour to the nearest health facility ......................29
Figure 12 % of households reporting having received a visit from a community health worker in the 14 days prior to
data collection ..............................................................................................................................................................29
Figure 13 % of households reporting having engaged in coping mechanisms due to a lack of money to meet basic
needs in the 30 days prior to data collection ................................................................................................................33
Figure 14 % of households reporting an individual working in the 30 days prior to data collection by presence of adult
males (p-value ≤ 0.0001) .............................................................................................................................................34
Figure 15 % of households reporting labour/employment and/or an own business as source of income in the 30 days
prior to data collection by presence of adult males (p-value ≤ 0.0001)........................................................................34
Figure 16 % of households reporting cash (p-value ≤ 0.0001), borrowing (p-value ≤ 0.001), and/or support (p-value
≤ 0.001) as main sources of food in the seven days prior to data collection by presence of adult males ....................35
Figure 17 % of households reporting assistance from relatives/friends as income source in the 30 days prior to data
collection by presence of adult males (p-value ≤ 0.01) ................................................................................................35
Figure 18 % of households reporting having relied on food rations and/or support from friends/relatives as the only
food/income source in the 30 days prior to data collection by presence of adult males (p-value ≤ 0.0001) ................35
Figure 19 % of households reporting having adopted different food-based coping strategies due to a lack of food in
the seven days prior to data collection by presence of adult males .............................................................................35
Figure 20 % of households reporting having bought LPG (p-value ≤ 0.01) and/or collected firewood (p-value ≤ 0.05)
as a source of fuelwood in the four weeks prior to data collection by presence of adult males ...................................36
Figure 21 % of households reporting that women can go alone to certain spaces by gender of respondent..............36
9Joint Multi-Sector Needs Assessment (J-MSNA), Host Communities
Figure 22 % of households reporting preferred point-of-contact if they needed to refer a friend that had been sexually
assaulted by gender of respondent ..............................................................................................................................37
Figure 23 % of households reporting having to walk more than an hour to the nearest health facility by presence of
adult males (p-value ≤ 0.01) ........................................................................................................................................37
Figure 24 % of households reporting out-of-school children by presence of adult males (p-value ≤ 0.01) .................37
Figure 25 % of households reporting never having been consulted on needs, preferences, or the delivery of
humanitarian assistance since the COVID-19 outbreak by presence of adult males (p-value ≤ 0.05) ........................38
Figure 26 % of households reporting not having received clear awareness information by presence of adult males (p-
value ≤ 0.05) ................................................................................................................................................................38
Figure 27 % of households reporting no door-to-door information-sharing as a reason for not having received enough
information on different types of humanitarian assistance available to them by gender of respondent (p-value ≤ 0.0001)
.....................................................................................................................................................................................38
Figure 28 % of households reporting having adopted emergency coping strategies by presence of disabled household
members (p-value ≤ 0.01)............................................................................................................................................39
Figure 29 % of households reporting having adopted food-based coping strategies by presence of disabled household
members (p-value ≤ 0.05)............................................................................................................................................39
Figure 30 % of households reporting having relied on food assistance/community support by presence of disabled
household members (p-value ≤ 0.01) ..........................................................................................................................39
Figure 31 % of households reporting having gone into debt to cover health expenses by presence of disabled
household members (p-value ≤ 0.01) ..........................................................................................................................39
Figure 32 % of households reporting having adopted emergency coping strategies due to a lack of money to meet
basic needs in the 30 days prior to data collection by household size (p-value ≤ 0.01) ..............................................40
Figure 33 % of households reporting out-of-school children by upazila (p-value ≤ 0.0001)........................................40
Figure 34 % of individuals enrolled in government schools (p-value ≤ 0.0001) or no formal education (p-value
≤ 0.0001) by upazila ....................................................................................................................................................40
Figure 35 % of households reporting primary education or less as highest level of education in household by upazila
(p-value ≤ 0.0001) .......................................................................................................................................................40
Figure 36 % of households reporting having received enough information about humanitarian services/types of
assistance since the COVID-19 outbreak ....................................................................................................................41
Figure 37 % of households reporting satisfaction with assistance since the COVID-19 outbreak by gender of
respondent ...................................................................................................................................................................42
Figure 38 Agenda of enumerator training (for both host community and refugee survey) ..........................................47
Table 1 List of surveys completed per union against union population and targeted minimum number of surveys ....45
Table 2 List of key informants completed per camp, overall and by gender of respondent .........................................46
Table 3 List of partners involved in each stage of the assessment .............................................................................50
Map 1 Assessed unions in Ukhiya and Teknaf Upazilas, Cox’s Bazar ........................................................................14
10Joint Multi-Sector Needs Assessment (J-MSNA), Host Communities
INTRODUCTION
The District of Cox’s Bazar, located in southern Bangladesh, has some of the poorest living conditions in the country.
It is characterised by low access to basic infrastructure and services compared to the national average.9 At the same
time, over the past four decades, in successive waves, the district has received Rohingya refugees fleeing violence in
Rakhine State, Myanmar. Since August 2017, an estimated 745,000 Rohingya refugees have fled to Cox’s Bazar
District, where approximately 860,000 refugees are now residing in 34 camps in Ukhiya and Teknaf Upazilas.10
Ukhiya Upazila is characterised by above-average levels of poverty and poor living conditions compared to the rest of
the country. It is ranked the poorest upazila in Cox’s Bazar District and among the 50 most socially deprived in the
country. Despite all of Ukhiya being under the rural electrification network, the majority of the population does not have
access to electricity. The upazila has the highest open defecation rate in the district, high rates of child labour, and low
levels of food security. Evidence suggests that the refugee influx further exacerbated levels of poverty in Ukhiya.11
Teknaf is also among the poorest upazilas in Cox’s Bazar and ranking among the 50 most socially deprived in the
country. Levels of food insecurity are high, as is the population’s level of vulnerability to market price fluctuations. The
upazila is also characterised by low levels of access to electricity, and limited access to drinking water, sanitation and
health facilities. It has the lowest literacy rate in Cox’s Bazar District and a high prevalence of child labour. Both may
have been compounded by the refugee influx – on the one hand, by host community teachers having left schools to
work for higher wages in camps, and on the other hand, by boys increasingly having dropped out of school to make
use of increased working opportunities in and around camps.12
Needs in Ukhiya and Teknaf arise mainly from existing development challenges, but may have been compounded by
the refugee influx.13 With the refugee population being almost double the host community population in the two
upazilas,14 the massive increase in population density following the influx, coupled with the pre-existing lack of
livelihoods, levels of poverty and vulnerability among the host community population, has led to tensions over labour
competition, falling wages and price hikes of daily essentials. Perceived increases in crime, security concerns, and
high pressures on the environment leading to deforestation and depleting water sources have further been reported as
sources of tension.15
With the refugees unlikely to return to Myanmar in the near or medium term16, and the response having moved beyond
the initial emergency phase, comprehensive information on the needs and vulnerabilities of all affected populations is
needed in order to inform the design and implementation of effective inter-sectoral programming. Moreover, the
challenges presented by the monsoon and cyclone seasons require regularly updated analyses of household needs
and access to services. At the same time, the outbreak of the COVID-19 pandemic in early 2020 and associated
9 ACAPS, Cox’s Bazar: Upazila Profiles (September 2020) (Cox’s Bazar, 2020). Available here (accessed 23 November 2020).
10 Inter Sector Coordination Group (ISCG), Situation Report Rohingya Refugee Crisis, Cox’s Bazar, Bangladesh, June 2020 (Cox’s Bazar, 2020a). Available here
(accessed 23 November 2020).
11 ACAPS, 2020
12 Ibid.
13 Inter Sector Coordination Group, 2020 Joint Response Plan, Rohingya Humanitarian Crisis, January – December 2020, Bangladesh (Cox’s Bazar, 2019).
Available here (accessed 23 November 2020).
14 Bangladesh Bureau of Statistics, Population & Housing Census-2011, National Volume-2: Union Statistics (Dhaka, 2011).
15 ACAPS, 2020; ISCG, Joint Multi-Sector Needs Assessment (J-MSNA): Host Communities – In-Depth | August – September 2019 (Cox’s Bazar, 2019). Available
here (accessed 23 November 2020).
16 International Crisis Group (ICG), A Sustainable Policy for Rohingya Refugees in Bangladesh, Asia Report N°303, 27 December 2019 (Brussels, 2019). Available
here (accessed 13 November 2020).
11Joint Multi-Sector Needs Assessment (J-MSNA), Host Communities
containment measures put thousands of people in Cox’s Bazar at risk of losing their livelihoods and income.17 On 22
March 2020, all non-essential businesses and offices were closed nationwide, and people called upon to stay at home,
except when needed to meet essential needs.18 Cox’s Bazar was among the first districts opting for an official lockdown
starting on 8 April 2020. As a result, a majority of households experienced substantial disruptions to their livelihoods
and decreases in levels of income.19 Given the likely magnitude of the impact of the restrictions on livelihoods, as well
as access to basic goods and services, an understanding of household-level multi-sectoral needs, capacities and
access to services within the context of the COVID-19 containment measures will therefore be essential for a full
understanding of priority needs for 2021.
Against this background, a Joint Multi-Sector Needs Assessment (J-MSNA) was conducted across host community
populations to support detailed humanitarian planning and enhance the ability of operational partners to meet the
strategic aims of donors and coordinating bodies. The general objective of the J-MSNA was to inform evidence-based
strategic planning of humanitarian response activities by the Strategic Executive Group (SEG), the Inter Sector
Coordination Group (ISCG) Secretariat, sectors, and sector partners, through the provision of up-to-date, relevant and
comparable information on the multi-sectoral needs of host community populations in Cox’s Bazar District.
The 2020 J-MSNA built on previous MSNAs, most notably the 2019 J-MSNA, with the aim to facilitate an understanding
of the evolution of needs and service gaps across time, where possible. It was implemented through the ISCG’s MSNA
Technical Working Group (TWG) of the Information Management and Assessment Working Group (IMAWG), which is
led by the ISCG and comprised of the United Nations High Commissioner for Refugees (UNHCR), the International
Organization for Migration Needs and Population Monitoring (IOM NPM), ACAPS, and REACH. Sectors were actively
involved in research design, preparations for data collection, and the discussion of results and analyses.
In the following chapter, the specific objectives of the assessment and the research questions will be introduced. The
scope of the assessment and the methodology will be outlined, including the sampling strategy, data collection
parameters, data analysis and secondary data review. Moreover, ethical considerations, and challenges and limitations
will be highlighted. Thereafter, findings will be presented, with a focus on needs and service gaps within the context of
the COVID-19 containment measures. The findings section will conclude with a summary of results related to
Accountability to Affected Populations (AAP). The report will then close with a concluding summary and outlook.
17 Food and Agriculture Organization of the United Nations, Bangladesh – Cox’s Bazar, Revised humanitarian response, Coronavirus disease 2019 (COVID-19),
May-December 2020 (Cox’s Bazar, 2020). Available here (accessed 23 November 2020).
18 ISCG, 2020 COVID-19 Response Plan, Addendum to the Joint Response Plan 2020, Rohingya Humanitarian Crisis, April – December 2020 (Cox’s Bazar,
2020b). Available here (accessed 23 November 2020).
19 World Food Programme, Cox’s Bazar Urban Vulnerability Assessment (Cox’s Bazar, 2020a). Available here (accessed 23 November 2020).
12Joint Multi-Sector Needs Assessment (J-MSNA), Host Communities
METHODOLOGY
Specific objectives and research questions
Aiming to expand the body of analysis and address key information gaps by providing an accurate snapshot of the
situation, the 2020 J-MSNA was conducted with the specific objectives to:
1. Provide a comprehensive evidence base of the diverse multi-sectoral needs among host communities to
inform the 2021 Joint Response Plan (JRP);20
2. Provide an analysis of how host community needs have changed in 2020 with an emphasis on the impact of
the COVID-19 pandemic on multi-sectoral needs;
3. Provide the basis for a joint multi-stakeholder analysis process.
To this end, the J-MSNA sought to answer the following research questions:
1. What are the needs and service gaps within host communities?
2. What are the characteristics of households most in need?
3. What are the immediate and structural factors associated with these needs?
4. To what extent have these needs and service gaps been impacted by the COVID-19 pandemic?
5. What behaviours and coping strategies are households undertaking in order to meet their needs, in particular
in view of the COVID-19 crisis, and what factors influence these behaviours?
6. What are households’ perspectives on aid delivery, as well as their preferences, and priorities with regards to
aid delivery for 2021?
Scope and tool development
In line with the geographical coverage and population targeted by both the previous and the 2021 JRP, the assessment
targeted all Bangladeshi households living in Ukhiya and Teknaf Upazilas. Sectors covered included Food Security,
WASH, Shelter and Non-food items (NFIs), Protection, including the Child Protection and Gender-Based Violence Sub-
Sectors, Health, Education, Nutrition and Communication with Communities (CwC). All sectors as well as the Gender
Hub were consulted during tool design. Both quantitative and qualitative data was collected.
Quantitative component
For the quantitative household survey, the 2019 J-MSNA tool and indicators were reviewed and adaptions to the current
context discussed during a first round of consultations with sectors. The MSNA TWG then developed a preliminary
version of the 2020 J-MSNA questionnaire. As interviews had to be conducted remotely over the phone, however,
questionnaire length had to be limited. Therefore, in a second step, sectors prioritised the indicators included in the
preliminary version of the tool, which was subsequently finalised by the MSNA TWG giving priority to questions as
indicated by sectors. The tool was translated to Bangla prior to enumerator training and data collection.
20 A separate J-MSNA with the same objectives was simultaneously conducted in the refugee community.
13Joint Multi-Sector Needs Assessment (J-MSNA), Host Communities
Qualitative component
For the semi-structured key informant interviews (KIIs), the MSNA TWG, guided by the research questions least
addressed by the quantitative tool, proposed topics and questions for inclusion to sectors. Sectors then revised and
also prioritised the questions. The KII tool was subsequently finalised by the MSNA TWG based on sector feedback. It
was translated to Bangla prior to enumerator training and data collection. The tool was structured into a section on
CwC and AAP, and seven sectoral sections. Due to time constraints, each key informant (KI) was to be interviewed on
CwC and AAP as well as two sectors of his/her choice, reflecting the sectors for which the KI thought assistance was
generally hardest to access, had become significantly harder to access since the lockdown and/or represented the
most urgent needs/biggest service gaps since the lockdown.
Map 1 Assessed unions in Ukhiya and Teknaf Upazilas, Cox’s Bazar
Sampling strategy
Quantitative component
Households, defined as a group of people living together, and generally eating from one pot (sharing food), were the
unit of measurement for this assessment. Due to the absence of a comprehensive sampling frame, the sampling frame
was constructed from partners’ household survey and beneficiary databases. A stratified probability-proportional-to-
size (PPS) random sampling approach was used, with stratification at the upazila level and the aim of generating results
14Joint Multi-Sector Needs Assessment (J-MSNA), Host Communities
representative at the upazila level at a 95% confidence level and with a 5% margin of error. The primary source of
population data was UNHCR survey data covering host community populations living within 6 km of UNHCR camps.
The proportion of the sample for each union drawn from this database was equal to the proportion of households from
the union included in the database. The remaining share of the sample was drawn from IOM and UNHCR beneficiary
databases, covering wards within the targeted unions not included in the UNHCR database. In cases, in which a ward
not included in the UNHCR survey data was included both in the IOM and the UNHCR beneficiary databases, the
sample was drawn only from the database with the larger number of beneficiaries for that ward, as it could not be
ensured that households were not drawn twice when sampling the same ward from both databases. For each database,
sample size at the ward level was proportional to the ward-level population included in the database for each union.
Moreover, as phone ownership was known to be more prevalent among men, in order to ensure adequate
representation of female respondents, female-headed households were sampled proportionately to their representation
in the databases. The final sampling frame only included host community households living within the vicinity of UNHCR
camps and/or being UNHCR/IOM project beneficiaries. Further, only households registered with phone numbers could
be included. Lastly, households in areas with little or no phone connection could not be reached.
An estimated buffer was included into all sample size calculations to account for (1) non-eligible households, such as
mixed refugee-host community households registered as refugee households; (2) non-response, including non-
functional phone numbers, households without mobile reception, or switched off phones; (3) non-consenting
households, including households not consenting to or not finishing the survey; (4) households without an appropriate
respondent, including all households without a consenting individual aged 18 and above; and (5) data cleaning/errors,
including completed surveys that would be removed during data cleaning and therefore not be part of the final sample.
The interviews were conducted with the person answering the phone, usually expected to be the head of household,
provided that consent was given and that the respondent was aged 18 or above. The enumerator teams were
composed of roughly equal numbers of male and female enumerators. While female enumerators could interview
respondents of either gender, male enumerators were instructed to only interview male respondents, and agree on a
time with female respondents for a female enumerator to call them back. Overall, 33% of respondents were female
and 67% of respondents were male. Forty-nine percent (49%) of female respondents and 1% of male respondents
reported having replied on behalf of a female-headed household, with the remaining respondents having replied on
behalf of a male-headed household.
Qualitative component
For the KIIs, a total of four interviews per union was targeted. KIs were purposively sampled and included male and
female ward members (local government representatives).
Data collection
Quantitative component
Quantitative data collection took place between 28 July and 13 August 2020. A total of 911 households, composed of
5,046 individuals, were surveyed across all unions.21 This included 470 households from Teknaf, and 441 households
21 A full list of completed interviews by union is included in annex 1.
15Joint Multi-Sector Needs Assessment (J-MSNA), Host Communities
from Ukhiya. Results are therefore representative at the upazila level of all host community households included in the
sampling frame, i.e. households living in the vicinity of UNHCR camps and/or being UNHCR/IOM project beneficiaries,
registered with phone numbers and in areas with mobile reception, at a 95% confidence level and with a 5% margin of
error. They can further serve as a proxy of the entire host community population in Teknaf and Ukhiya. Data collection
was led by REACH and data collected by 3 teams of UNHCR enumerators, consisting of 9 to 11 enumerators each,
as well as 2 teams of IOM NPM enumerators, consisting of 6 enumerators each (43 enumerators in total).
Prior to data collection, enumerators underwent a four-day online training to familiarise themselves with the tool and
data collection protocols.22 Sector representatives facilitated training sessions on the questionnaire sections pertaining
to their sectors to ensure that the intent and wording of each question was well understood. The tool and data collection
protocols were piloted with a sample of host community households during a two-day remote piloting exercise to identify
and rectify problems before the full roll-out of data collection. Following the piloting, the tool was further refined based
on lessons learnt during the pilot related to phrasing/understanding of the questions by both the enumerators and the
respondents, displaying/sequencing of questions on the screen or missing response options.
During the interviews, data was entered directly into tablets using the KoBoCollect software. At the end of each day,
surveys were uploaded to the UNHCR server, where raw data was accessible only to one individual within REACH.
Data was checked and cleaned on a daily basis according to a set of pre-established Standard Operating Procedures
(SoPs) in line with defined minimum standards, including outlier checks, the correct categorisation of “other” responses,
the identification and removal or replacement of incomplete, inaccurate or incoherent records, and the recoding and
standardisation of entries. All changes to the data were documented in a data cleaning log. Based on observations
during the pilot, 20 minutes was established as the minimum length of the interview required to ensure an acceptable
level of data quality. Any interviews falling below this threshold were excluded from the final dataset. Moreover, each
respondent in the sample was allocated an ID, based on which and together with information on location (union and
ward number), it was attempted to verify that the correct households had been interviewed. In total, 32 of 943 completed
interviews were deleted from the final dataset due to quality issues related to timing or duplicate respondent IDs that
could not be corrected.
Qualitative component
Qualitative data collection took place between 20 and 30 August 2020. A total of 23 KIs were interviewed, including 13
male and 10 female KIs. For security reasons and due to a lack of permissions, no KIIs were conducted in Haldia
Palong, Raja Palong, Ratna Palong, Sabrang and Teknaf Pourashava.23 The sectoral sections of the questionnaire
were discussed by a minimum of three (Shelter/Non-food items (NFIs) and Food Security) and a maximum of eight
(WASH), or an average of five KIs each. Given this limited number of interviews per sector, while serving as a basis
for the contextualisation and validation of quantitative findings, results should be interpreted cognisant of the fact that
data saturation was likely not reached.
Data collection was led by REACH and conducted with a team of eight REACH and IOM NPM enumerators. Prior to
data collection, enumerators underwent a one-day online training to familiarise themselves with the tool, and data
collection protocols. The training included practice sessions to test the phrasing and understanding of the questions.
22 The enumerator training agenda is included in annex 3
23 A full list of completed KIIs is included in annex 2.
16Joint Multi-Sector Needs Assessment (J-MSNA), Host Communities
Following the training and prior to the start of data collection, the tool was finalised based on enumerator feedback
during the training.
The interviews were in part conducted remotely over the phone and in part in-person. The phone interviews were
recorded and the recordings used as a basis for transcription and analysis. During the in-person interviews,
enumerators took notes that supported transcription and analysis.
Data analysis
Results were analysed by sector. The requirement to limit questionnaire length also imposed constraints on the types
of analysis that could meaningfully be conducted. As such, no comprehensive quantitative inter-sectoral analysis was
carried out. The estimation of the proportion of households in need and corresponding caseloads was also beyond the
scope of this assessment. However, qualitative results and the secondary data review provided a foundation, based
on which qualitative links between sectoral outcomes could be drawn and a more holistic picture of needs and service
gaps be provided. Lastly, while current levels of need have to be explained within the context of the COVID-19 outbreak
and associated containment measures, it was beyond the scope of this assessment to analyse expected levels of need
if the containment measures had not been put into place. The findings are therefore intended as an overview of existing
levels of need and not as an evaluation of the lockdown or COVID-19 containment measures.
Quantitative component
A basic data analysis plan (DAP) was drafted, outlining stratifications, additional composite indicators to be constructed
and the basic descriptive statistics to be calculated for each indicator. The DAP was reviewed by sectors and finalised
by the MSNA TWG based on sector inputs. To account for the unequal distribution of households across the two
upazilas, results were weighted at the upazila level during the basic descriptive analysis.
Secondly, based on sector characterisations of vulnerable households, the MSNA TWG identified a range of indicators,
for which the existence of statistically significant differences in outcomes between households of different socio-
economic characteristics was tested. Pearson’s chi-square test of independence was used to determine whether or
not there was an association between the household characteristics and indicator outcomes. Relationships were
determined to be statistically significant for p-values ≤ 0.05. For tests involving more than two distinct groups of
households across a certain characteristic, if a significant difference was generally found to exist between the groups,
a post-hoc analysis based on the residuals of the chi-square test was conducted to determine the group(s) driving the
significant difference. Data was further analysed by upazila, and by gender of respondent for indicators for which
differences in perceptions between male and female respondents were expected. Moreover, basic statistics were
calculated disaggregated by the gender of the head of household as well as by the presence or absence of adult males
in the household. The latter was expected to serve as a proxy of female-headed households with a female person also
being the main decision-maker in the household. For selected indicators, the existence of statistically significant
differences between upazilas, households with male and female respondents, as well as households with and without
adult males was tested.
Lastly, in cases in which indicators were comparable, 2020 J-MSNA results were compared to 2019 J-MSNA results.
No statistical significance testing was conducted for 2019 to 2020 comparisons because of very different sample sizes.
17You can also read