City Planning and Design Group Wellington City Council
←
→
Page content transcription
If your browser does not render page correctly, please read the page content below
HOUSING AND COMMUNITY
                                                                   DELIVERING AFFORDABLE PROPERTY SOLUTIONS TO THE COMMUNITY SECTOR
THE PROPERTY GROUP LIMITED’S REPORT FOR

City Planning and Design Group
Wellington City Council

The Housing Forces Report
Reflections on the Drivers for Housing Change In Wellington City

15 April 2014
TABLE OF CONTENTS

1.     Executive Summary ................................................................................................................. 5
     1.1      Introduction................................................................................................................................................ 5
     1.2      Housing Stocktake ..................................................................................................................................... 5
     1.3      Housing Forces .......................................................................................................................................... 6
     1.4      Looking forward over the next ten to twenty years ............................................................................. 8
     1.5      Planning Considerations ......................................................................................................................... 10
2.     Introduction ............................................................................................................................ 12
     2.1      Context ...................................................................................................................................................... 12
     2.2      Methodology ............................................................................................................................................ 12
     2.3      Disclaimer ................................................................................................................................................. 14
3.     A Brief History of Housing in Wellington .............................................................................. 15
     3.1      Early beginnings and Natural Forces ................................................................................................... 15
     3.2      From Settlement to Capital City ........................................................................................................... 16
     3.3      Eliminating the Physical Barriers to Housing Growth ...................................................................... 17
     3.4      To the suburbs and back ........................................................................................................................ 19
4.     Wellington Housing Stocktake ............................................................................................... 21
     4.1      Location and Age..................................................................................................................................... 21
     4.2      Housing Type and Size ........................................................................................................................... 24
     4.3      Rating Values ............................................................................................................................................ 26
     4.4      Net Growth Trends ................................................................................................................................ 26
5.     The Wellington Housing Marketplace .................................................................................. 29
     5.1      Is there such a thing a ‘Wellington City Housing Market’? .............................................................. 29
     5.2      Recent Wellington Housing Market Activity ...................................................................................... 32
     5.3      The New-Build Housing Market........................................................................................................... 38
     5.4      Housing Affordability ............................................................................................................................. 41
6.     Who Lives Where, and Why?.................................................................................................. 48
     6.1      Population ................................................................................................................................................. 48
     6.2      Households ............................................................................................................................................... 51
     6.3      Housing Utilisation.................................................................................................................................. 53
     6.4      Tenure ....................................................................................................................................................... 55
     6.5      Employment, Income and Business Sector Impacts ......................................................................... 58
7.     Looking Forward: The Next 10-20 Years .............................................................................. 64
     7.1      Population ................................................................................................................................................. 64
     7.2      Households ............................................................................................................................................... 65
     7.3      What sort of housing should we be building over the next 10-20 years? ....................................... 68
     7.4      Planning Considerations ......................................................................................................................... 72

                                                                                                                                                                             2
Wellington City Housing
Housing Forces Report – April 2014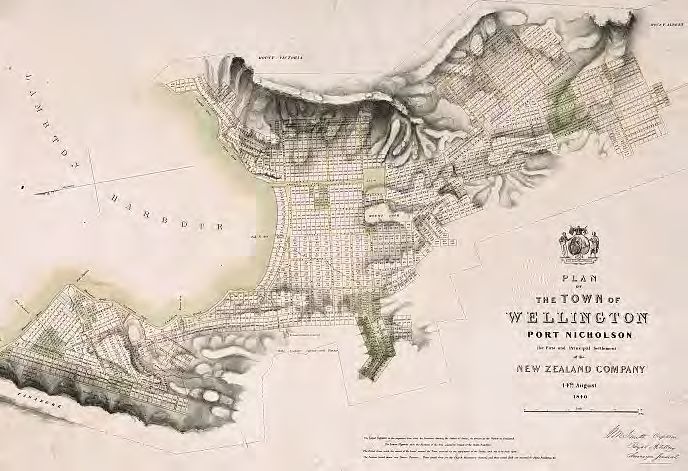
Pictures
Pic 1: New Zealand Company Plan for Wellington 1840 .................................................................................. 15
Pic 2: Wellington waterfront 1868 ......................................................................................................................... 16
Pic 3: Te Aro housing in 1940 with St Peters in background (Bruce Orchiston) .......................................... 17
Pic 4 : Seatoun Tunnel 1920’s ................................................................................................................................. 17
Pic 5: Arrival of the first train at Johnsonville (NZR Publicity Photo) ........................................................... 18
Pic 6: Northern Motorway under construction (1960’s) .................................................................................... 19
Pic 7: Paparangi looking towards Churton Park ................................................................................................... 19
Pic 8: Mount Victoria 2006 ..................................................................................................................................... 20

Tables
Table 1: Wellington Metro Centres January 2014: Median House Prices as a Multiple of Selected
          Household Incomes ................................................................................................................................. 30
Table 2: Wellington City Housing Market January 2014 – Home Ownership Affordability ...................... 43
Table 3: Wellington City Rental Market June-November 2013 – Lower Quartile Rents ............................ 45
Table 4: Wellington Rental Housing Affordability ............................................................................................ 47
Table 5: Wellington City 2001-13 – Household Growth by Household Type ................................................ 51
Table 6: Wellington City Households 2013 – by Household Type and Tenure............................................. 57
Table 7: Wellington City Households 2013 – by Household Type .................................................................. 61
Table 8: Wellington City 2011-13 –Projected Household Growth by Household Type .............................. 65
Table 9: Wellington City 2011-31 - Projected Net Household Growth .......................................................... 67
Table 10: Wellington Neighbourhoods - Projected Net Household Growth by Household Type ............. 68
Table 11: Wellington City Housing Shortfall 2013-31 – Indicative Assessment ........................................... 70

Figures
Figure 1: Wellington’s Housing Future – Net Growth Scenario 2013-31 – Suburban Markets.................... 9
Figure 2: Wellington’s Housing Future – Net Growth Scenario 2013-31 – Inner City ................................ 10
Figure 3: Wellington City 2013 – Private Residential Dwellings by Age and Location ................................ 22
Figure 4: Wellington City 2013 – Private Residential Dwellings by Type and Location............................... 23
Figure 5: Wellington City 2013 – Private Residential Dwellings by Year of Construction and Type......... 24
Figure 6: Wellington City 2013 – Private Residential Dwellings by Type and Number of Bedrooms ....... 25
Figure 7: Wellington City 2013 – Private Residential Dwellings by Type and General Area ....................... 25
Figure 8: Wellington City 2013 – Private Residential Dwellings by Bedrooms and General Area ............. 26
Figure 9: Wellington City 2001-13 – Net Growth in Private Dwellings by Type and Bedrooms ............... 26
Figure 10: Wellington City 2013 – Average Rating Valuation by Neighbourhood and Housing Type ..... 27
Figure 11: Wellington City 2001-13 – Net growth in Residential Dwellings by Bedrooms and Area ........ 28
Figure 12: Wellington Metropolitan Housing Market – CBD Catchment Areas ........................................... 29
Figure 13: Wellington Metropolitan Housing Market January 2014– Indicative Rentals for Two and
           Three Bedroom Dwellings – by Location and Number of Bedrooms ........................................ 31
Figure 14: Wellington and other Urban Housing Markets 2008-13 – Average Dwelling Values ................ 32
Figure 15: Housing Market Activity January 2004 to December 2013 – Northern & Western Suburbs... 33
Figure 16: Housing Market Activity January 2004 to December 2013 – Southern and Eastern Suburbs . 33
Figure 17: Housing Market Activity January 2004 to December 2013 - Wellington Central ....................... 34
                                                                                                                                                                 3
Wellington City Housing
Housing Forces Report – April 2014
Figure 18: Wellington City – Indicative Prices of Housing for Sale in January 2014 .................................... 35
Figure 19: Wellington City June-November 2013 – Rental Market Activity by Location ............................ 36
Figure 20: Wellington City June-November 2013 – Rental Market Activity by Type ................................... 36
Figure 21: Wellington City – Indicative Weekly Rent Levels in January 2014................................................ 37
Figure 22: The Wellington New-Build Housing Market - Who's Buying? ...................................................... 38
Figure 23: Wellington City 2003-13 – Consented New Housing by location and Project Size ................... 40
Figure 24: Wellington City 2003-13 – Consented New Housing by WCC Type Code ................................ 40
Figure 25: Wellington City Rental Market – Indicative Gross Yields .............................................................. 41
Figure 26: Wellington Metropolitan Area 2013 – Census Night Population Count ..................................... 48
Figure 27:Wellington Metropolitan Area 2001-13 – Net Population Growth by Age ................................... 49
Figure 28:Wellington Metropolitan Area – Population Profile by Age............................................................. 49
Figure 29: Wellington City – Persons Aged 15+ Living Outside the City Five years Ago by Previous
           Address ................................................................................................................................................... 50
Figure 30:Wellington City 2013 – Persons Aged 15+ Living Outside the City Five years Ago by Age and
           Ethnicity.................................................................................................................................................. 50
Figure 31:Wellington City 2013 –Household Type as Percentage of General Area ....................................... 51
Figure 32: Wellington City 2013 – Households by Type, Location and Householder Age .......................... 52
Figure 33: Wellington City 2013 – Indicative Household Utilisation Rates – by Dwelling/Household Size
           and Area .................................................................................................................................................. 53
Figure 34: Wellington City 2013 – Indicative Household Utilisation Rates – ................................................ 54
Figure 35: Wellington Households by Tenure ..................................................................................................... 55
Figure 36: Wellington City 2013 – Households by Location and Tenure ....................................................... 56
Figure 37: Wellington City 2001-2013 – Net Household Growth by Location and Tenure ....................... 56
Figure 38: Wellington City 2001-2013 – Changing Tenure Patterns – by Age of Householder ................. 57
Figure 39: Wellington City Households 2001-2013 – Net Household Growth by Type and Tenure ....... 58
Figure 40: Wellington City 2012 – Employment by Business Sector ................................................................ 59
Figure 41: Wellington City 2002 - 2012 – Net Employment Growth by Business Sector ........................... 60
Figure 42: Wellington City 2013 – Smaller Households with Incomes of $50,000 or Less – by Tenure... 61
Figure 43: Wellington City 2013 – Full Time Student Population by Location and Housing Type ........... 62
Figure 44: Wellington City 2001-13 – Growth in Full-time Student Population by Residential Location 62
Figure 45: Wellington Inner City 2001-2013 - Students a Proportion of All Households ........................... 63
Figure 46: Wellington City 2011-31 – Projected Population growth by Age.................................................. 64
Figure 47: Wellington City 2011-31 – Projected Net Population Growth – by Age ..................................... 65
Figure 48: Wellington City 2011-31 – Projected Net Population Growth 2011-31 – by Age and Area .... 66
Figure 49: Wellington City 2011-31 - Projected Net Household Growth- by Type and Area ................... 67
Figure 50: Wellington City Net Housing requirement to 2013-31 – Indicative Assessment ....................... 69
Figure 51: Wellington’s Housing Future – Net Growth Scenario 2013-31 – Suburban Markets ............... 71
Figure 52: Wellington’s Housing Future – Net Growth Scenario 2013-31 – Inner City Markets .............. 72

                                                                                                                                                                       4
Wellington City Housing
Housing Forces Report – April 2014
1. EXECUTIVE SUMMARY
1.1 Introduction
This paper summarises the results of research by The Property Group Limited (“TPG”) into the
forces shaping demand for new housing in Wellington City. The paper has been commissioned
by Wellington City Council’s (“WCC”) City Planning and Design Group.
The paper is based on a three-stage research approach:
Firstly TPG has compiled a stocktake of Wellington’s current housing portfolio, and
who lives here
Secondly, we have attempted to map changes to the Wellington housing
environment over the past 5-10 years.
Thirdly, we have used this to inform our view about what sort of new housing is
needed over the next 10-20 years, and where it should be built.
The paper also includes a brief history of housing in Wellington, which chronicles the impact of
road and rail on the form and distribution of the City’s housing stock.
1.2 Housing Stocktake
According to the Wellington City Council rating database, the City has about 72,000 private
residential dwellings, sitting on 32,000 hectares of land, with a total value of about $34 billion.
Along with another 25,000 hectares of vacant land zoned current or future residential, the City’s
residential zones make up about 75% of Wellington’s total urban area.
About 50% of Wellington housing is more than 50 years old, which means that many suburbs
have retained their character, despite expansion, infill and redevelopment in later years.
About 40% of all housing units in Wellington are multi-unit in character, although standalone
housing remains the predominant housing form – especially in suburban areas built up since the
1940’s, where upwards of 80% of all housing is single-lot housing.
Housing type is a significant determinant of size, with 75% of all one and two-bedroom units in
Wellington being multi-units. By contrast, more than 80% of dwellings with three bedrooms are
single-lot standalone housing.
Multi-unit housing is distributed unevenly throughout the city. In the northern suburbs, only
about 20% of all housing are multi-units, compared to 67% for the CBD and periphery suburbs.
In the City’s heart (CBD and Te Aro) multi-unit housing now makes up more almost 95% of all
available housing stock.
5
Wellington City Housing
Housing Forces Report – April 2014
Housing Growth over the past 10-12 years
Wellington’s housing portfolio grew by about 9,000 units between the 2001 and 2013 Censuses,
with growth being evenly split between new greenfields areas, existing suburbs, and high-rise
development in the CBD, Te Aro, and City edge communities. Te Aro has become Wellington’s
fastest-growing new housing area.
The bulk of smaller housing (two bedrooms or less) was multi-unit housing, either suburban
infill or multi-unit development in the CBD. New standalone housing has grown larger with
most new housing in greenfields subdivisions being four bedrooms or more.
Where do we live? And why?
The city’s outer areas are largely made up of family and ‘empty nester’ households, although many singles
and couples still prefer a suburban lifestyle.
This contrasts sharply with the CBD, Te Aro and city edge communities, where younger households hold
sway. This has made renting the dominant tenure in city edge neighbourhoods like Thorndon, Mount
Cook, Mount Victoria and the Aro Valley/Highbury, where renting households now make up at least
60% of all households.
Rental housing is also a significant component of Wellington’s southern and eastern suburbs, particularly
in Newtown (62%), Behampore (53%) and Kilbirnie/Rongotai (47%).
1.3 Housing Forces
A range of factors (or ‘housing forces’) are transforming the Wellington housing environment.
These include the workings of the housing market, demographic change, and other socio-
economic considerations
Market Forces
Although this report focuses on Wellington City, it is important to remember that the city is part
of a Wellington metropolitan housing marketplace.
Wellington is the employment, commercial and cultural centre of the metropolitan marketplace,
so values are likely to climb faster than outlying areas, and change in the urban fabric is likely to
be more pronounced.
Our analysis suggests that Wellington’s housing marketplace is already more dynamic than other
sub-markets within metropolitan area, for instance:
More than a third Wellington’s usually resident population lived outside the city five years
ago1, with those coming from outside New Zealand (including returning New Zealanders)
making up about 35% of all recent arrivals
Many Wellington residents are just passing through, for instance, tertiary students, who
make up more than 20% of the inner-city’s resident population, and almost 50% of those
living in group housing.
1 Excluding those not born five years ago
6
Wellington City Housing
Housing Forces Report – April 2014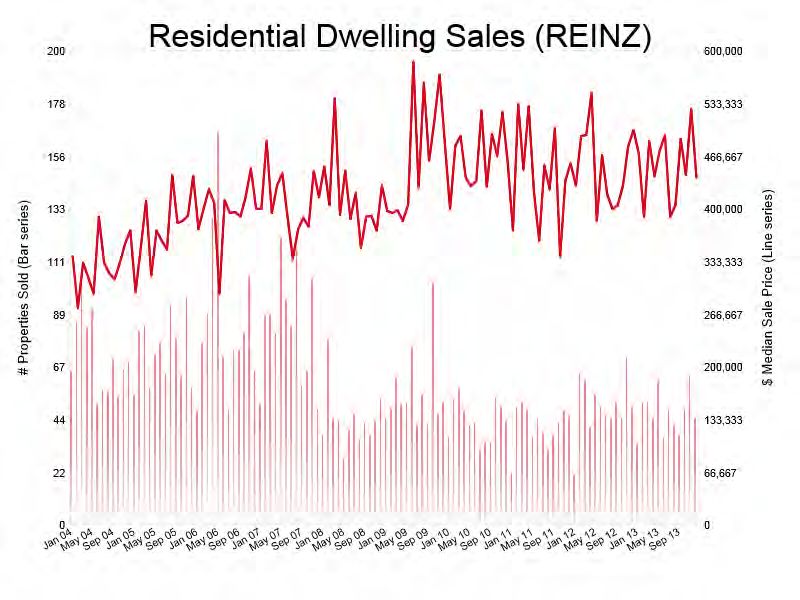
A growing number of Wellington households are willing to live in compact housing and pay
more to live close to the city centre.
These factors have supported a steady rise in house values over the past 10-20 years (at least
compared to other metropolitan centres), and a renaissance in multi-unit housing construction.
Te Aro is now Wellington’s fastest growing new housing area.
Despite recent growth in smaller-sized housing, however, much of Wellington’s housing stock is
under-utilised. Many suburban family homes are occupied by single person and couple-only
households.
Underutilisation is more apparent in owner-occupier housing in established suburbs like
Khandallah and Karori, where demographic forces could undermine the social and commercial
infrastructure of these once-thriving family suburbs.
Population and Household Forces
Based on preliminary results from the 2013 Census, we estimate that Wellington has a
population of around 200,000, living in about 74,000 households:
In 2013, family-with-children households (including single parent households) made
up only 36% of all Wellington households.
In almost all of Wellington’s 31 neighbourhoods and communities, family-with-
children households (including sole parent families) make up less than 50% of all
households,
This reduces to 20% for the CBD, Te Aro, and city edge communities.
Single person or couple households now make up more than 50% of all Wellington
households
Group households (two or more unrelated people living in the same dwelling) make
up about 12%
Between 2011 and 2031, Wellington’s population is projected to increase by about 30,000 (16%)
to 230,000. The total household count will increase by 14,000 (20%).
Single person and couple-only households are expected to make up about 66% of
net household growth
Family households with children will increase by about 3,000 (20%)
Multi person households (10%) and other households will make lesser
contributions.
Growth has slowed since considerably since 2006, however, which means that WCC’s current
community-based growth projections can no longer be relied upon for detailed planning
purposes.
Demographic Drivers
Like all New Zealand cities, Wellington’s housing future will be affected by an aging population.
We estimate that the population aged 60 years and over will grow by at least 10,000 (50%)
between 2011 and 2031.
7
Wellington City Housing
Housing Forces Report – April 2014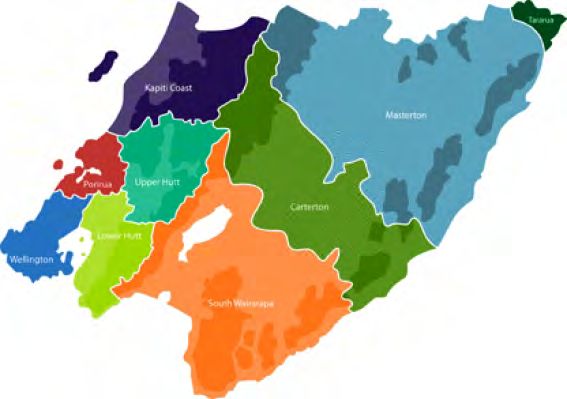
The number of students and younger working people (18-34 years) is also projected to increase
by 10,000 over the same period (16%).

Tenure Trends

Net household growth between 2001 and 2013 suggests that the current balance between tenures
is being gradually reversed. The number of renting households grew by more than 5,000
between 2001 and 2013, an increase of almost 25%. This compares to 3,500 (10%) net growth in
owner-occupier households.
Rental households made up 60% of net household growth between 2001 and 2013. Based on
these trends, renting households will make up about 45% of all households in Wellington by
2031.
One of the most significant drivers of rental housing growth is a shift in housing behaviour of
30-44 year-olds, who have historically moved to home ownership during the family-formation
phase of their life-cycle. Between 2001 and 2013, home ownership rates for this age group
dropped by 15%, in part because of deferred family formation, but also because of changing
lifestyle preferences.
Rates for younger households have also declined, suggesting a continuation of the trend for
younger households to spend longer in the rental market. Those who are unable to make the
transition to home ownership at a later stage will become part of the ‘intermediate housing
market’, which is generally defined as those who can afford to pay market rents (with or without
the help of an Accommodation Supplement) but are unable to purchase a home in their
preferred location.

Social and Economic Drivers for Change

Despite the Global Financial Crisis (GFC) and public sector restructuring, Wellington’s
workforce grew by more than 10,000 between 2001 and 2013.
Most growth has occurred in higher-wage sectors like public administration and professional
services, although the capital has also lost some of its higher-wage financial services and
information technology capacity to Auckland.
Secondary industries like warehousing and wholesale have also relocated elsewhere within the
wider metropolitan area, which has reduced the quantum of secondary sector jobs available.
Positive employment and wage growth should stimulate construction of new housing, especially
in the inner city, although slow growth and job uncertainty has affected market confidence in
recent times. In our view, this is cyclical, and will soon be replaced by more buoyant housing
market fed by deferred demand.

1.4      Looking forward over the next ten to twenty years

The Housing Forces Report concludes with an assessment of what new housing is needed to
meet net new demand for housing. In our view, suburban sub-markets will take a different path
to the CBD, Te Aro and City Edge communities.

                                                                                              8
Wellington City Housing
Housing Forces Report – April 2014
Suburban Areas

 Suburban markets should experience a significant upsurge of demand from single person and
 couple households, mostly as a result of existing residents selling larger family homes but wanting
 to stay in a suburban environment. Net demand for family housing will continue in most areas,
 although (as discussed earlier) some areas face the risk of negative growth.
 Based on recent tenure trends, we expect about 40% of all net growth in suburban housing
 supply will be rental – either purpose-built new rental housing, or via transfer of existing housing
 stock from owner-occupier to rental
 An increase in 70-plus age groups should also see increasing demand for supported housing for
 older people, and possibly other innovations in the older persons housing market.
Figure 1: Wellington’s Housing Future – Net Growth Scenario 2013-31 – Suburban Housing Markets
 6,000

 5,000

 4,000

 3,000

 2,000

 1,000

    ‐
          Northern   Johnsonville & Broadmeadows   Western         Southern      Eastern                     Owned          Rented
          Suburbs      Newlands       to Crofton   Suburbs         Suburbs       Suburbs
                                        Downs

              Group Housing      Single person or couple housing       Family housing      Other older peoples housing options?

 The Inner City Housing Market

 Based on ForecastID projections, the CBD, Te Aro and surrounding suburbs will grow by
 almost about 6,500 households between 2013 and 2031
 We expect that about 1,000 new multi-person housing options will be required – mostly to cater
 for about 3,500 new 18-24 year-old residents expected by 2031.
 However, the bulk of demand growth will come from single person and couple households.
 About 3-3,500 new units will be required, with strong demand across all age cohorts from 25-34
 years to 70 years and over – the latter reflecting a proportion of suburban empty-nesters moving
 from the suburbs.
 About 2,000 new units will also be required to cater for increases in demand from family-with-
 children households, although the supply channel has yet to factor this market segment into their
 development plans.
 There may also be an increase in boarding-house and collective housing for those who cannot
 access more mainstream housing product. This market segment is easy to overlook.

                                                                                                                                     9
 Wellington City Housing
 Housing Forces Report – April 2014
60% of net demand will be for rental housing. This means that housing investors will play a
significant role in determining the type and quality of new housing in the inner city and city-edge
communities.
Figure 2: Wellington’s Housing Future – Net Growth Scenario 2013-31 – Inner City Housing Markets
4,500
4,000
3,500
3,000
2,500
2,000
1,500
1,000
500
‐
City Edge West & Wellington Central & City Edge East and Owned Rented
North Te Aro South
Group Housing Single person or couple housing Family housing Other older peoples housing options?
1.5 Planning Considerations
Our analysis suggests that the trend towards more compact forms will continue over the next 10-
20 years, but achieving the tight balance of new housing will be a challenge. In our view, the key
considerations for planners are:
Promoting better utilisation of suburban housing stock?
In our view, wellington already has an adequate supply of well-located family housing, and social
infrastructure needed to support family-with-children households. The problem is that much of
this stock is occupied by single person and couple only households.
Facilitating the transfer of existing family housing stock will go some way to revitalising suburban
communities and enabling them to play a greater role in Wellington’s housing future. Three
factors are relevant here:
Promoting the development of quality, well-located, compact housing near suburban
centres, so that empty-nesters have more housing choice in their preferred locations.
Removing barriers to better utilisation of existing housing, for instance, conversion to flats
or partial redevelopment.
Retaining community character, by preserving core amenity values in established suburbs.
Encouraging diversity in Greenfields locations
Based on our research for the housing forces and housing viewpoints reports, we believe that
the market will demand a greater variety of housing forms in greenfields areas over the next 10-
20 years.
10
Wellington City Housing
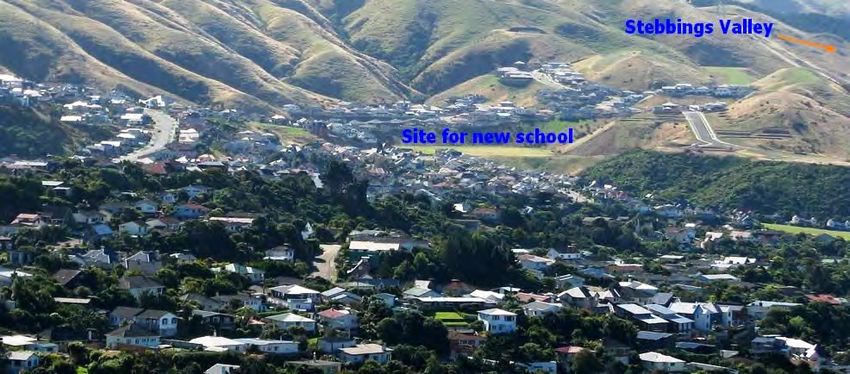
Housing Forces Report – April 2014Recent trends towards bigger houses will be reversed, which will require a rethink of how land is
subdivided and serviced. Current responses, for instance duplexes on single lots on otherwise
unchanged suburban layouts (e.g. Churton Park), are unlikely to result in cohesive communities.
Family Housing Options in the CBD, Te Aro and City-Edge Communities?
At present, developers of new-build housing in the CBD, Te Aro and surrounding suburbs do
not regard family-with-children households as a viable market segment. Notwithstanding this,
current projections suggest that 2,000 new housing units are needed in these locations to meet
demand growth from families.
In our view, more families will be willing to pay more to live close to the city, and trade off
suburban amenity values for the benefits of urban living. But can family-friendly townhouse-
style (and possibly lower-level apartment’s) compete with more intensive housing targeted at
other sectors?
Developments like Altair in Newtown suggest that compact family housing is possible, but
future developments may need to be supported by a more prescriptive planning approach.
Older Persons Housing Options
Although some of Wellington’s aging population will decamp to Kapiti and other locations,
Wellington’s oldest-old population is expected to increase sharply over the next ten years –
perhaps more sharply than provided for in WCC’s current estimates 2 . More innovative
approaches to older persons housing will, we believe, go some way to closing the housing gap.
Monitor growth of non-traditional housing forms?
In the absence of a new housing supply response, we may see an accelerated transformation in
the way existing housing stock is used, for instance more housing turned into flats, and more
older-age single people living in group housing situations.
Other options for low-income non-family households wanting to stay closer to the City include
boarding houses, hostels and multiple occupancy flats (rented on a room by room basis) – all of
which have their own planning and compliance challenges
The student housing market also needs to be better understood, especially as up to 1,000 new
households will be attributable to this sector. Our research suggests that not all housing
available to students is currently captured on WCC’s residential database, and that the housing
drivers for this market segment are quite different to other segments.
Revisit current growth assumptions?
Lastly, our analysis suggests that the Wellington housing market may have shifted over the past
seven years, to the extent that some of WCC’s local growth assumptions may need to be
revisited.
2 Statistics New Zealand’s population projections for Wellington (2006 base) that WCC’s current projections)
suggest that growth in the 60+ age groups may be 50% higher than current WCC/ForecastIDprojections (also 2006
base)
11
Wellington City Housing
Housing Forces Report – April 20142. INTRODUCTION
This paper summarises the results of research by The Property Group Limited (“TPG”) into the
forces shaping demand for new housing in Wellington City. The paper has been commissioned
by Wellington City Council’s (“WCC”) City Planning and Design Group.
2.1 Context
Wellington City Council (“WCC”) is currently revisiting its policies and strategic approach to
housing issues. Work underway or at the planning stages includes a new Housing Strategy and a
Spatial Plan that will either update or supersede the Council’s existing Urban Development
Strategy.
The new approach will be informed by emerging trends in the local housing market, and by
wider considerations, for instance:
The Government’s housing reforms, which aim to improve housing affordability in
major centres, and increase the supply of residentially-zoned development land.
The interrelationship between Wellington City’s housing market and the regional
housing marketplace, which takes in Kapiti, Porirua City, the Hutt Valley and (to a
lesser extent) southern Wairarapa.
Growing public awareness about housing issues, especially housing quality and
affordability, building safety and the growth of the intermediate rental housing
market
A willingness on the part of WCC to play a more active role in shaping Wellington’s
housing future, preferably in partnership with other key players (developers, HNZC
and third-sector housing providers, local communities etc.).
To support work on the Spatial Plan and Housing Strategy, WCC has asked The Property Group
Limited (“TPG”) to carry out research into the demographic and other forces shaping future
housing need in Wellington. As part of a separate work stream, TPG has also been asked to
survey housing developers and consumers about their housing preferences and more general
views on the housing market. A summary of this work stream can be found in The Wellington City
Housing Viewpoints Report (April 2014) (to be covered in a separate work stream report).
2.2 Methodology
In this this paper, we have concentrated our research efforts on three key housing demand
drivers (or ‘housing forces’) in Wellington City:
Market Forces
This includes a discussion of how Wellington’s current housing stock is distributed and
utilised, and who is driving the market for new and existing housing We also discuss such
items as the changing tenure balance in the city, house prices and affordability, and
supply-side responsiveness.
12
Wellington City Housing
Housing Forces Report – April 2014Population Forces
This includes an analysis of Wellington’s population by age and household type, with
particular emphasis on the impact of growing numbers of non-family households and an
aging population on future housing demand.
Social and Economic Forces
This includes an assessment of the impact of ongoing changes to the city’s social and
economic base. We note, for instance, that Wellington’s manufacturing and warehousing
sectors have been largely displaced by growth in the education sector, and higher-wage
sectors like professional/technical services and pubic administration. The result is a
higher proportion of younger and highly mobile households whose housing
consumptions are markedly different than previous generations,
The paper is based on a three-step research approach:
Firstly, we have compiled a stocktake of the current situation, derived from 2013 Census
data, WCC’s rates and consents databases, and other sources.
Secondly, we have attempted to map changes to Wellington’s housing environment that
have occurred over the past 5-10 years
Thirdly, we have used this trend data to forecast future demand for housing, and identify
key opportunities and constraints on the housing market’s ability to respond to future
housing demand.
Longer term population and household projections are derived from ForecastID data on the
Council’s own website, disaggregated to community level. Note that these projections use the
2006 census as a base and could (based on initial results from the 2013 Census) may overstate
long-term growth.
Unit of Analysis
A WCC’s request, we have attempted to deliver separate findings for each of the 31
neighbourhoods and communities that make up Wellington City as a whole. The logic is that
each neighbourhood or community has a discrete identity, including population and household
characteristics that differentiate it from adjoining neighbourhoods.
For the summary report, we have aggregated the 31 communities into nine ‘General Areas’
which are themselves subsets of Wellington’s three main sub-markets – Suburban, Inner
Residential and Central City/Te Aro. The general areas are:
Northern Suburbs from Tawa to Churton Park and Paparangi. These are Wellington’s
newest suburbs and contain the bulk of greenfields expansion capacity
Johnsonville and Newlands – established suburban urban areas at the end of
Wellington’s transport corridor.
Mature suburbs in the inner north including Ngaio, Khandallah and more recent
expansion areas of Broadmeadows and Crofton Downs
The Western Suburbs, in particular Karori, which into the 1960’s had the distinction
of being the Southern Hemisphere’s largest suburb.
13
Wellington City Housing
Housing Forces Report – April 2014 The CBD and Te Aro, which have substantially grown their residential capacity over
the past 20 years. Te Aro in particular is returning to its roots as a predominantly
residential neighbourhood.
Communities on the edge of the City, including established higher-value suburbs like
Wadestown, Kelburn and Roseneath, where the price and attractiveness of existing
housing stock has acted as a brake on redevelopment
Other suburbs at the periphery like Mount Cook, Aro Valley, the lower slopes of
Mount Victoria, and inner areas of Newtown, where recent residential
redevelopment has aided by comparatively lower land values, the demise of large
segments of the City’s light industrial and engineering sector, and growth in the
scale of the tertiary sector
Southern Suburbs, stretching from Newtown through to Island/Ohiro Bays and
Southgate.
The Eastern Suburbs, which take in communities from Haitaitai to Seatoun/Breaker
Bay.
Readers should note that TPG’s neighbourhood/community boundaries are not 100% aligned
with those used by ForecastID and Statistics New Zealand (SNZ). In particular some of the
boundaries between the CBD and Te Aro, and CBD periphery neighbourhood/communities
such as Mount Cook, Newtown and Aro Valley/Highbury may vary.
Market information provided by the Real Estate Institute of New Zealand (REINZ), Quotable
Value (QV) and the Ministry of Business Innovation and Employment (MBIE) is also based on a
different sets of boundaries, but still paints a useful-enough picture of the workings of
Wellington’s housing market to warrant inclusion in this report.
2.3 Disclaimer
This report summarises TPG’s research into the forces shaping Wellington’s housing market
over the next 10-20 years. The report has been prepared expressly for the City Planning and
Design Group within Wellington City Council. The report may not be distributed, cited or
reproduced without TPG’s express permission. Any views expressed in the report are those of
the author, and should not be taken to reflect the policies or intentions of WCC or TPG. All
conclusions and statistical summaries are derived from the author’s own research (E&OE).
TPG accepts no responsibility for non-authorised uses of this report.
14
Wellington City Housing
Housing Forces Report – April 20143. A BRIEF HISTORY OF HOUSING IN WELLINGTON
In this section we take a backwards look at the role of natural forces, topography, and key events
in Wellington’s history over the past 175 years, in shaping the form and location of the city’s
current housing stock.
3.1 Early beginnings and Natural Forces
Wellington City had its beginnings in 1839, when the first settlers were embraced by Te
Whanganui a Tara’s natural harbour and protecting hills. The New Zealand Company had long
regarded the harbour as an ideal location for its first commercial settlement, to be named
Wellington in recognition of the Iron Duke’s strong support for the company's colonisation
principles.
The City actually began life at Pito-One, near the mouth of the Hutt River but, after a series of
floods had carried away the original settlers’ makeshift homes, a decision was soon made to
relocate to more elevated land at Te Aro. The New Zealand Company’s legal claim to some of
the land it occupied was debateable, but it wasted no time in marketing the ‘new’ Wellington to
prospective colonists.
By August 1840, Wellington’s had its first ‘spatial plan’, prepared by William Mein Smith
‘…Captain of Artillery and the Company’s first Surveyor General’. The plan contained 1,100
lots averaging 1 acre, sandwiched between Mounts Albert and Victoria, and the Tinakore hills.
Most lots were to be allocated by ballot to fee-paying colonists, who were promised extra
farming land outside the settlement once they had cleared their original lot.
The original plan still dictates much of Wellington’s inner-city skeletal form, and perhaps
explains the questionable logic behind some of Wellington’s steepest streets.
Pic 1: New Zealand Company Plan for Wellington 1840
15
Wellington City Housing
Housing Forces Report – April 2014By the end of 1840, Wellington had a colonial population of about 1,200 settlers and 800 Maori.
The European population had grown to 4,750 by 1864, effectively displacing the formerly-
resident Maori population. By 1857, a small but regionally-significant commercial centre had
established itself on reclaimed land next to Plimmers Ark, and waterfront facilities had been
upgraded to accommodate overseas trading vessels.
The Wellington settlement had also begun to take on a more permanent look, but not before
absorbing lessons from the 1855 earthquake, which put paid to notions of the settlement
becoming a facsimile of British architectural styles. Timber, not bricks and mortar, was to
remain the main building method well into the 20th century, for rich and poor house builders
alike.
Pic 2: Wellington waterfront 1868
3.2 From Settlement to Capital City
Despite its increasing importance as a regional centre, Wellington’s financial future was not
assured until 1865, when Parliament and Central Government administrative functions were
relocated from Auckland to Wellington. Public administration became even more centralised in
Wellington after the abolition of the Provinces in 1876.
Wellington’s elevation to the nation’s Capital did much to lay the foundations for the city as we
know it today. Between 1865 and 1900, Wellington’s population had increased tenfold to almost
50,000, fuelled by exponential growth in Government expenditure and a flood of new British
migrants. Wellington became New Zealand’s busiest port during this time, and quickly replaced
Dunedin as New Zealand’s pre-eminent financial centre.
The residential impact of such rapid growth was initially managed through an early form of infill
housing. The large plots envisaged in W M Smith’s plan were subdivided into progressively
smaller lots – size largely dependent on topographical considerations and social class.
16
Wellington City Housing
Housing Forces Report – April 2014Areas which had seen only limited development were ‘reimagined’ into denser housing areas –
perhaps best illustrated by older parts of Newtown, and residual pockets of original housing in
Mount Cook and Te Aro.
Pic 3: Te Aro housing in 1940 with St Peters in background (Bruce Orchiston)
3.3 Eliminating the Physical Barriers to Housing Growth
By the end of the 19th Century, an extensive public works programme had begun to connect
Wellington City with its neighbouring (mainly rural) boroughs to the East and West. The
founders of Miramar and Karori had long seen residential subdivision as a pathway to prosperity,
and had prepared subdivision plans as early as the 1870’s, in anticipation of Wellington spilling
over the Te Aro basin’s natural barriers.
Pic 4 : Seatoun Tunnel 1920’s
17
Wellington City Housing
Housing Forces Report – April 2014By the time the Karori Tunnel was completed in 1900, Wellington’s had a thriving commuter
culture. Continuous improvements to the city’s public transport system (both land and sea)
allowed workers to travel freely between home and the CBD – and in some cases, home for a
midday meal.
By 1910, Wellington’s tramway systems ran all the way to Miramar and Seatoun, aided by
improvements to waterfront roads leading to Kilbirnie and the Watts peninsula, and completion
of the Seatoun Tunnel and Miramar Cutting. Local Government amalgamation was also a
feature of this period, with Karori and Miramar both being absorbed by Wellington City by
1921.
In 1940, Wellington City’s population had grown to almost 120,000, and the City was again
pursuing opportunities to expand its residential capacity. Improvements to the northern rail
corridor in the 1920’s and 30’s accelerated residential development in the northern suburbs3.
Pic 5: Arrival of the first train at Johnsonville (NZR Publicity Photo)
The foundations 4for Wellington’s first ‘car-dependent’ suburbs had also begun to be laid, with
construction of the Centennial Highway, an ambitious project that included massive
improvements to Ngauranga Gorge and the Hutt Road in the early 1940’s.
Construction of Wellington’s urban motorway system in the 1960’s and 1970’s effectively
eliminated travel-based constraints on housing. By car or by public transport, Lambton Quay
was 30 minutes away from just about anywhere in the City.
3 The Wellington to Johnsonville line, was electrified and became a dedicated domestic route in 1938, although the growth of small boroughs
along the line had been enabled as early as 1880, when the Wellington to Horowhenua rail link was completed, taking in existing settlements
further North such as Tawa and Paekakariki
4
18
Wellington City Housing
Housing Forces Report – April 2014Pic 6: Northern Motorway under construction (1960’s)
3.4 To the suburbs and back
Between the 1950’s and 1970’s, the suburbs continued to grow - both in size and as a proportion
of Wellington’s total housing stock. A sluggish start to housing construction in the immediate
post-war period gave way to a new housing boom in the 1960’s and 70’s.
New housing in the suburbs became more accessible to low and modest-income family
households, thanks to low cost housing loans for families and expanded state rental
programmes. Closer to the City, social housing was being built for older residents displaced by
change, and other low-income non-family households, including WCC’s own Arlington and
Central Park complexes.
Pic 7: Paparangi looking towards Churton Park
Overall, however, the population’s contemporary preference for suburban living served to
diminish the residential importance of the inner city. Housing stock in the city’s heart made way
for growth in commercial and government activity. Flat areas around the CBD periphery
(Thorndon, Te Aro, Mount Victoria and Mount Cook) became home for Wellington City’s light
industrial and warehousing activity.
19
Wellington City Housing
Housing Forces Report – April 2014Those pockets of housing that remained within W M Smith’s original city boundary became even
more sharply differentiated by privilege and location. Older established suburbs like Wadestown
and Roseneath remained popular with professionals more urban-focused family households,
while lesser-cost housing areas became ‘zones of transition’ for Wellington’s new migrant
populations and the City’s growing tertiary student population.
Pic 8: Mount Victoria 2006
Since the 1980’s we have witnessed a reversal of sorts. Continued population growth has put
greater pressure on Wellington’s transport infrastructure. Arguably, it takes longer in 2014 to
travel from suburb to city than it did in 1984. The inner city itself has become a more attractive
place to live. Gentrification and other reinvestment has improved the quality of much of the
housing stock.
More people are now choosing to stay in the inner city, and appreciating the character of older
refurbished housing or (more recently) apartment-style living.
The inner City is also no longer haemorrhaging a substantial proportion of its housing stock for
motorways and other arterial links, although further losses can be expected in the short term.
The impacts of Wellington’s latest inner-city motorway project, for instance, have been widely
publicised, although its actual housing impact will be negligible compared to earlier projects.
In our view, the infrastructural blueprint for new residential activity is substantially complete, and
Wellington’s housing future over the next 10-20 years will be determined by other forces.
20
Wellington City Housing
Housing Forces Report – April 20144. WELLINGTON HOUSING STOCKTAKE
In this section, we provide an overview of Wellington’s City’s residential portfolio, and comment
on the type and location of housing added to the portfolio in the past ten years. Our findings are
based on an analysis of the Wellington City Council ratings database, and recently-released
Census data.
In summary:
At the end of 2013, WCC’s residential database listed about 72,000 private
residential dwellings within urban-zoned areas, not including student
accommodation and housing associated with other uses.
The Wellington housing portfolio had a total value of around $34 billion, and a land
value (including vacant land) approaching $15 billion.
The 72,000 dwelling units consumed about 32,000 hectares of land, not including
roads, parks and other residential infrastructure. Farming activity and lifestyle
blocks within the urban area consumed another 20,000 hectares.
About 5,000 hectares of subdivided residential land was either vacant or under
development at the end of 2013.
In total, the City’s residential zones make up about 75% of the Wellington City
urban area
About 80% of all housing in the Northern Suburbs has been built since the creation of the
Wellington motorway system (half of this since 1980). A higher proportion of contemporary
housing is also evident in Johnsonville, inner-northern suburbs (e.g.
Khandallah/Broadmeadows) and Karori, where greenfields capacity was able to support
substantial new dwelling construction well into the 1990’s.
4.1 Location and Age
The figures overleaf summarises the location, type and era of construction for all residentially-
zoned housing units on the WCC rating database.
Our summary assessment is that the urban character of many older communities is substantially
intact, although densities have built up within Wellington’s earliest suburbs of Miramar and
Karori. Southern and eastern suburbs in particular have been transformed by infill housing,
conversion of existing housing into flats and (latterly) an upswing in multi-unit construction.
A surprising number of houses in communities around the City’s edge are also original, although
many have subsequently been divided into flats. In the CBD and Te Aro, only pockets of
original housing remain.
21
Wellington City Housing
Housing Forces Report – April 2014Figure 3: Wellington City 2013 – Private Residential Dwellings by Age and Location
4000
3500
3000
2500
Total Units Built
2000
1500
1000
500
0
Northern Suburbs Johnsonville‐ Broadmeadows to Western Suburbs CBD Periphery West CBD & Te Aro CBD Periphery East Southern Suburbs Eastern Suburbs
Newlands Crofton Downs and North and South
Area and Size of Project
Prior to 1900 1900‐19 1920‐39 1940‐59 1960‐79 1980‐99 After 2000 Other incl mixed/ Remodeled
WCC Rating Database January 2014
22
Wellington City Housing
Housing Forces Report – April 2014Figure 4: Wellington City 2013 – Private Residential Dwellings by Type and Location
Seatoun ‐ Karaka Bays ‐ Breaker Bay
Strathmore Park
Miramar ‐ Maupuia
Lyall Bay
Kilbirnie ‐ Rongotai ‐ Moa Point
Hataitai
Southgate ‐ Houghton Bay ‐ Melrose
Island Bay ‐ Owhiro Bay
Berhampore
Kingston ‐ Mornington ‐ Vogeltown
Newtown
Roseneath ‐ Oriental Bay
Mt Victoria
Brooklyn
Mt Cook
Aro Valley ‐ Highbury
Te Aro
Wellington Central
Thorndon Pipitea
Wadestown
Kelburn
Northland‐Wilton
Karori
Ohariu ‐ Makara ‐ Makara Beach
Ngaio ‐ Crofton Downs
Khandallah‐Broadmeadows‐Kaiwharawhara
Newlands ‐ Ngauranga
Johnsonville
Churton Park ‐ Glenside
Grenada Village ‐ Paparangi ‐ Woodridge ‐ Horokiwi
Tawa ‐ Grenada North ‐ Takapu Valley
‐ 1,000 2,000 3,000 4,000 5,000 6,000
Vacant or under development Residential on large block Single Unit Multi‐unit
WCC Rating Database January 2014
23
Wellington City Housing
Housing Forces Report – April 20144.2 Housing Type and Size
According to the WCC rating database, 60% of all residential dwellings in the Wellington urban
area are single-lot, standalone houses, which means that 40% are multi-unit in character. This is
consistent with the 2013 Census count, which recorded 35% of all occupied dwellings as multi-
units, with a further 5% being ‘other than’ a separate dwelling5.
Based on WCC data, it would appear that multi-unit housing has always been a feature of the
Wellington housing scene. Almost 4,000 multi-units on the database are listed as being built
before 1919. In the inter-war and immediate post-war periods, most of the housing constructed
was single lot.
The 1960’s and 1970’s saw a substantial increase in multi-unit construction, in part due to
Central and Local Government willingness to play a greater role in the housing supply chain.
During this period, there was an expectation that the state would actively provide for the older
people and low income singles, who had hitherto relied mostly on private board and boarding
houses. We estimate that as much as 40% of all multi-unit construction over this period was
initiated by state or local government agencies.
Figure 5: Wellington City 2013 – Private Residential Dwellings by Year of Construction and Housing Type
12000
10000
8000
6000
4000
2000
0
Prior to 1900 1900‐19 1920‐39 1940‐59 1960‐79 1980‐99 After 2000 Other incl
mixed/
Remodeled
Single Units Multi‐Units
WCC Rating Database January 2014
Housing type is a significant determinant of housing size, with about 75% of all one and two
bedroom dwellings in Wellington being multi-units. By contrast only 17% of all dwellings with
three bedrooms or more are multi-units, with more than 80% being standalone dwellings.
5A multi-unit is defined by both WCC and SNZ as including townhouses, semi-detached units with some outside
space, apartments and standalone housing broken into flats, but may vary in the treatment of other permanent
accommodation like student housing complexes, serviced apartments etc
24You can also read