National Policy Statement on Urban Development: Housing and Business Assessment for Tasman - Tasman ...
←
→
Page content transcription
If your browser does not render page correctly, please read the page content below
National Policy Statement on
       Urban Development:
Housing and Business Assessment
                     for Tasman
                        July 2021
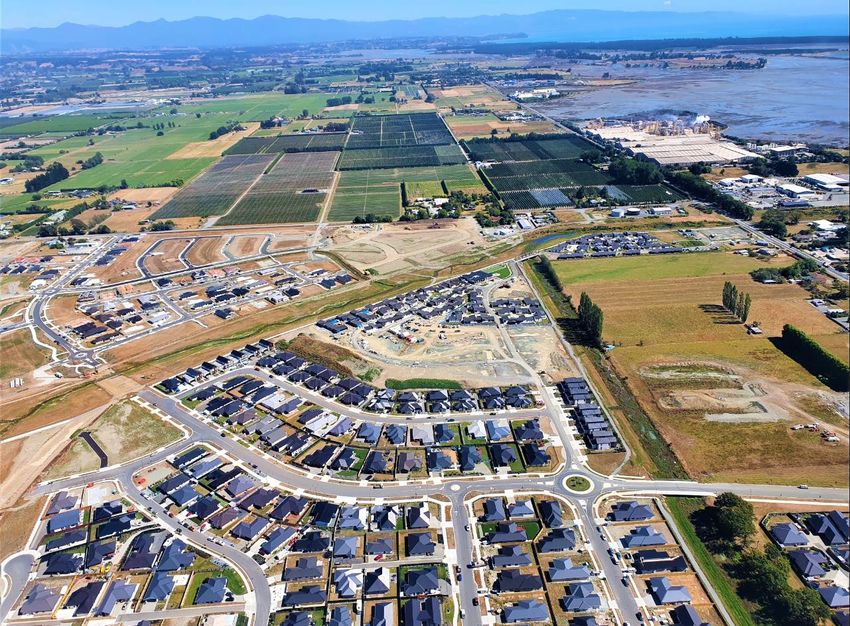
Cover Page: Photograph showing the largest housing developments currently underway in Tasman, at Lower
Queen Street, Richmond, comprising 1,200 dwellings
Contents
Contents ............................................................................................................................... 2

1.        Executive Summary .................................................................................................... 1
          1.1        Affordability Context........................................................................................................... 1
          1.2        Population Growth.............................................................................................................. 2
          1.3        Residential Demand ............................................................................................................ 2
          1.4        Residential Capacity ............................................................................................................ 3
          1.5        Business Demand and Capacity .......................................................................................... 4
          1.6        Housing Bottom Lines ......................................................................................................... 4

2.        Introduction ............................................................................................................... 6
          2.1        Purpose and Objectives ...................................................................................................... 6
          2.2        The Tier 2 Urban Environment and its Geographic Areas .................................................. 6
          2.3        Relationship between Nelson City and Tasman District Territorial Authorities ................. 9
          2.4        Background to Assessment ............................................................................................... 10

3.        Methodology and Approach ..................................................................................... 14
          3.1        Population Growth and Projections ................................................................................. 14
          3.2        Household Size .................................................................................................................. 18
          3.3        Business Land Projections................................................................................................. 18
          3.4        Housing Preferences Survey 2021 .................................................................................... 18
          3.5        Consideration of Other Growth Scenarios........................................................................ 18
          3.6        Growth Model Methodology ............................................................................................ 20

4.        Residential Demand ................................................................................................. 21
          4.1        Demand for Dwellings....................................................................................................... 21
          4.2        Demand by Location ......................................................................................................... 22
          4.3        Different Growth Scenarios and Effect on Composition of Age Group and Household
                     Type................................................................................................................................... 23
          4.4        Demand for Type of Dwellings.......................................................................................... 24
          4.5        Demand for Dwellings by Different Household Groups ................................................... 25
          4.6        Unmet Demand................................................................................................................. 32
          4.7        Consultation on Housing................................................................................................... 33
5.   Residential Capacity ................................................................................................. 35
     5.1       Introduction ...................................................................................................................... 36
     5.2       Rollout Strategy and Provision of Housing by Location .................................................... 37
     5.3       Residential Growth Strategy ............................................................................................. 38
     5.4       Dwellings ‘reasonably expected to be realised’ ............................................................... 38
     5.5       Appropriate Zoning for Capacity....................................................................................... 40
     5.6       Feasibility .......................................................................................................................... 41
     5.7       Development Capacity including Competitiveness Margin in the Urban Environment ... 48
     5.8       Residential Capacity: Short Term: (zoned and serviced) in the Urban Environment
               years 1-3............................................................................................................................ 48
     5.9       Residential Capacity: Medium Term (zoned and serviced) in the Urban Environment
               years 4-10.......................................................................................................................... 49
     5.10      Residential Capacity: Long Term (land identified in FDS and planned to be serviced in LTP
               or in Infrastructure Strategy) in the Urban Environment years 11-30 ............................. 49
     5.11      Residential Demand, Rollout and Remaining Capacity: short, medium and long term in
               the rest of Tasman District years 1-30 .............................................................................. 50
     5.12      Servicing of land required ................................................................................................. 52
     5.13      Housing Type/Choice/Location ......................................................................................... 57
     5.14      How Planning and Infrastructure Decisions impact the Competitiveness and Affordability
               of the Local Housing Market ............................................................................................. 59

6.   Business Land Demand and Capacity ........................................................................ 62
     6.1       Introduction ...................................................................................................................... 62
     6.2       Demand for Business Land................................................................................................ 62
     6.3       Demand and Rollout of Business Land ............................................................................. 63
     6.4       Business Land reasonably expected to be realised .......................................................... 64
     6.5       Competitiveness Margin ................................................................................................... 65
     6.6       Any Insufficient Business Capacity.................................................................................... 66
     6.7       Suitability of Business Land Capacity (location and site size as a minimum) (feasibility) 66

7.   Conclusions and Recommendations .......................................................................... 69
     7.1       Sufficiency of Housing capacity ........................................................................................ 70
     7.2       Sufficiency of Business Capacity ....................................................................................... 70
     7.3       Housing Bottom Lines to be inserted into RPS and District Plan ...................................... 70
     7.4       Assumptions/Limitations .................................................................................................. 71
1.          Executive Summary
This report is one of three that comprise the Nelson Tasman Tier 2 Urban Environment Housing and
Business Capacity Assessments 2021. Together these reports provide the analysis to assess the
sufficiency of Nelson and Tasman’s residential and business land capacity to meet future needs over 30
years 2021-2051. The Tier 2 Urban Environment includes the following city and towns: Nelson,
Richmond, Motueka, Māpua, Wakefield, Brightwater, Cable Bay and Hira, in recognition that these
communities are part of the same labour and housing market, and these areas are, or are intended to
be, predominantly urban in character.1

Tasman District Council (TDC), in this report assesses housing and business capacity for both its part of
the Tier 2 Urban Environment and the remainder of the District. There is a third bridging report
prepared by both Councils, called “National Policy Statement on Urban Development – Nelson-Tasman
Tier 2 Urban Environment”. The overview report summarises the capacity assessment for the Urban
Environment covering both Councils.

The purpose of this Housing and Business Assessment is to inform Resource Management Act (RMA)
planning documents, the Future Development Strategy (FDS) and Long-Term Plans (LTPs). The analysis
contained within this assessment has already been used to inform the LTP 2021-2031 and will be used to
inform the review of the 2019 FDS. In 2022/23 further housing and business analysis will take place to
inform the LTP 2024-2034.

1.1         Affordability Context
Tasman District and Nelson City operate and function as a single economic market and business activity
flows both ways across the Territorial Authority boundaries. Consequently, Tasman and Nelson also
function as a single housing market. Infometrics recently estimated a median multiple (house price to
income multiple) in Tasman of 8.0, making it the fourth least affordable local authority, equal to
Auckland. There are a number of indicators measuring affordability of house prices, but they all point to
Tasman being severely unaffordable. This is not helped by lower than national average household
incomes, which are 13% below the New Zealand (NZ) average and have only caught up by 2% in the last
20 years. Nelson Tasman is second lowest in NZ.

The Government’s measure of housing affordability (Housing Affordability Measure Buy (HAM Buy) ,
shows that at December 2018, about 81% of first-time buyer households in Tasman could not afford a
typical ‘first home’ priced house, spending more than 30% of income on housing costs. Mean incomes in
Nelson Tasman are 13% below the NZ average. As at November 2020, the Massey University Home
Affordability Index showed Tasman remained the second least affordable region in the country, after
Auckland, as it has done for over two years.

According to the Ministry of Housing and Urban Development’s (MHUD’s) dashboard, house prices have
increased by 64% in Tasman since 2015. The Real Estate Institute of NZ (REINZ) also monitors house
prices in the region, and it finds that the median house price in Tasman was a record $850,000 in May
2021, an increase of 21% since May 2020. According to REINZ, there are only two regions in the country
currently with higher median house prices – Auckland and Wellington. These unaffordable house prices

1
    Resolution of the Joint Committee of Tasman District and Nelson City Councils 10th November 2020

National Policy Statement on Urban Development: Housing and Business Assessment for Tasman                  1
are against a backdrop of record consenting activity for Tasman. Building consents for dwellings for year
ending March 2021 reached a new record high of 601. Sections created and resource consents for
housing are also trending upwards.

1.2      Population Growth
Tasman’s population continues to grow, outstripping predictions by Stats NZ, with average annual
growth between 2015-2020 averaging 2.2%. In the year ending 30 June 2020, the population grew by
2.4%. Most of this growth is from net migration gains and, importantly for Tasman, a sizable proportion
of this is from internal migration. Population is projected to increase in Tasman by 7,700 residents
between 2021 and 2031, from 56,600 to 64,300 (13%) and then slowing but still by a further 11,810
residents to 2051 (18%), totalling 76,110. Population growth projections in the urban environment are
slightly higher at 18% for the first 10 years and 18% for the following 20 years. Highest growth continues
to be in the 65+ age group, of which the proportion is projected to increase in Tasman from 21% in 2018
to 34% in 2048. The ageing population, driving an increase in one-person households and couples
without children, continues to mean smaller average household sizes across the District. Council has its
own growth model, now on its sixth iteration that forecasts land requirements for housing and business.
A Housing Preferences Survey was undertaken earlier this year of the Urban Environment to also inform
housing demand.

1.3      Residential Demand
As with population growth, dwelling demand is expected to decrease District wide over time, averaging
451 dwellings a year in the short term, 427 per year medium term and 416 per year long term. However,
for the Urban Environment, dwelling demand remains constant over the 30 years; 67% of the dwellings
required in the District are needed in the Urban Environment. This demonstrates the role these towns
are playing in providing locations to live within commutable distance to the major employment areas of
Richmond and Nelson. Richmond and Motueka, the two largest towns, need the most new dwellings in
the future. While the actual number of dwellings varies significantly between the low, medium and high
scenarios, the composition by age group and household type remains relatively similar. Unmet demand
(new dwellings consented versus actual household growth) amounts to approximately only 260
dwellings in total for the last ten years.

In considering different household group needs, the greatest concentration of Māori residents is in
Motueka, where 15% of the population identify as Māori (compared with 8% for the total Tasman
population). Tasman’s Māori population is projected to increase from 8% of Tasman’s population in
2018 to 12% in 2038. Despite having more residents per household, Māori are slightly more likely to live
in smaller homes than the general population, but this could be due to affordability constraints.

Home ownership proportions in Tasman have been one of the highest nationally since 2006. Dwellings
owned or held in a family trust had increased slightly from 75% to 75.6% between 2013 and 2018,
despite affordability worsening. Housing affordability is an issue across all the District, but Motueka and
Golden Bay have the highest proportion of households on relatively low incomes and a greater need for
affordable housing options. There are about 5,500 seasonal workers in Tasman in a given season and
about 1,500 -1,700 of these are Recognised Seasonal Employees (RSEs). In towns such as Motueka and
Riuwaka, growers face particular seasonal accommodation challenges with lack of motor camps and
motels.

National Policy Statement on Urban Development: Housing and Business Assessment for Tasman                2
The Housing Preferences Survey 2021 shows that while the majority (71%) of respondents prefer stand
alone dwellings, an increased proportion prefer attached dwellings, when compared with previous
surveys – 25%. 4% prefer apartments. The majority (62%) of older residents prefer standalone
dwellings, but a significant proportion also prefer attached dwellings (31%) and these would generally
be smaller dwellings. A further 6% of older people prefer apartments. Overall, 34% of respondents could
not afford to buy a dwelling and only 5% of these could afford to rent.

1.4      Residential Capacity
Overall, in Tasman District, there is sufficient development capacity for housing to meet demand under
the medium growth population scenario for 30 years. In its latest LTP, Council has aimed for housing
capacity that is ‘reasonably expected to be realised’ to equal demand District-wide, by Ward and for
most individual towns. However, some towns are providing capacity for others where demand cannot
be met. For example, capacity in Richmond in the next 10 years will also meet partial short-term
demand for Brightwater and Motueka. Council has prioritised infrastructure delivery in the LTP for
Motueka West to commence shortly. Since Motueka’s further development is constrained by a
combination of natural hazards, low lying land and productive land, a climate change adaptation
strategy is required, together with stormwater and river modelling, before brownfield intensification can
proceed here. Further greenfield expansion in Motueka is limited to already zoned land. Therefore, a
longer-term growth site in Lower Moutere identified in the FDS could provide for longer term demand
from Motueka. Such a location is between Richmond and Motueka, located 6km from the centre of
Motueka. The Housing Preferences Survey 2021 has shown that income constrained demand in areas
like Lower Moutere is higher than the unconstrained demand. Some of the urban demand may be
driven into these more rural areas of Tasman, constrained by affordability issues.

On commercial feasibility for brownfield intensification, using the rules of the intensification Plan
Change for Richmond, resource consents have yielded a net addition of 52 dwellings in two years.
According to Quotable Value (QV), the very existence of the Richmond Intensive Development Area
(RIDA) has caused land values to rise where there is potential for redevelopment.

Representative greenfield sites within the Urban Environment have been analysed for commercial
viability to a developer using the National Policy Statement on Urban Development Capacity (NPS UDC)
development feasibility tool. These were all found to be commercially feasible at varying densities,
depending on the individual site.

In terms of type of capacity (location and typology), the inability of Council to currently provide for all
demand in Motueka is highlighted. Motueka is the worst mismatch according to the Housing
Preferences Survey with double the amount of people wanting to live there than can actually afford to.
Motueka is facing particular housing demands, in terms of opportunities generally, affordable options,
needs of Māori residents, seasonal workers and renter needs. Affordability is an issue for the whole
District but is worse in Motueka and Golden Bay due to lower incomes. Additional seasonal worker
accommodation is needed in the Motueka area where campground facilities are smaller and fewer.

The Housing Preferences Survey 2021 showed that for renters, location is key, underlining once more
the importance of meeting demand in specific locations.

National Policy Statement on Urban Development: Housing and Business Assessment for Tasman                    3
1.5      Business Demand and Capacity
The Property Economics model (2016 extrapolated) has been used to estimate business land demand
for Tasman’s Urban Environment and rest of District. Council has very recently procured a new business
model from Sense Partners, and this will be used in the FDS review and next HBA. Business land demand
for Tasman District (including the Urban Environment) has decreased from the Property Economics
model to the more recent Sense Partners model. This HBA is therefore based on the upper extreme of
business land demand and future assessments are likely to be lower. That said, the Sense Partners
model states that Tasman District needs to provide for 89% of the future business land demand
requirements for the Nelson Tasman region, hence the importance of business land capacity in Tasman.
The business land capacity includes vacant and underutilised zoned business land in Tasman. These
levels of vacant land have been recently ground-truthed by Council with on site surveys in 2018/19.
There is sufficient business land for the Urban Environment and rest of District for the 30-year period.
While a small shortfall of industrial land exists in the long term in the Urban Environment, there is a
surplus of land in the short and medium terms which would meet this longer-term demand.

1.6      Housing Bottom Lines
As soon as practicable after this HBA is made publicly available, Tasman District Council will insert into
its Regional Policy Statement and District Plan, a housing bottom line for the short, medium and long
term for the Urban Environment. The housing bottom line only refers to the Urban Environment
because the NPS-UD requires this obligation in relation to the Urban Environment. The rest of Tasman
District is the rural remainder.

The housing bottom lines for the Urban Environment are the amount of feasible, reasonably expected to
be realised development capacity along with the competitiveness margin for the short, medium and
long terms. These are:

                                                                 Short term
                             Urban Environment              Years 1-3 (2021-2024)
                                                            Number of dwellings
                      Richmond                                       398
                      Brightwater                                     77
                      Māpua/Ruby Bay                                 109
                      Wakefield                                       64
                      Motueka                                        262
                      Total                                          910

                                                                Medium term
                             Urban Environment              Years 4-10 (2025-2031)
                                                             Number of dwellings
                      Richmond                                       1006
                      Brightwater                                     175
                      Māpua/Ruby Bay                                  268
                      Wakefield                                       145
                      Motueka                                         631
                      Total                                          2225

National Policy Statement on Urban Development: Housing and Business Assessment for Tasman                   4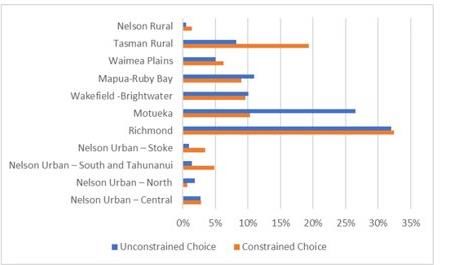
Long term
                            Urban Environment             Years 11-30 (2032-2051)
                                                           Number of dwellings
                      Richmond                                     2697
                      Brightwater                                   412
                      Māpua/Ruby Bay                                722
                      Wakefield                                     377
                      Motueka                                      1812
                      Total                                        6020

National Policy Statement on Urban Development: Housing and Business Assessment for Tasman   5
2.       Introduction
Parts of Tasman District form the Nelson Tasman Tier 2 Urban Environment under the NPS-UD
2020. These comprise Richmond, Brightwater, Wakefield, Māpua and Motueka. Tasman
District and Nelson City operate and function as a single economic market and business activity
flows both ways across the Territorial Authority boundaries. Consequently, Tasman and Nelson
also function as a single housing market. Infometrics recently estimated a median multiple
(house price to income multiple) in Tasman of 8.0, making it the fourth least affordable local
authority, equal to Auckland. According to MHUD’s dashboard, house prices have increased by
64% in Tasman since 2015. REINZ also monitors house prices in the region, and it finds that the
median house price in Tasman was a record $801,000 in March 2021, an increase of 19.6%
since March 2020. According to REINZ there are only three regions in the country currently with
higher median house prices – Auckland, Bay of Plenty and Wellington. These unaffordable
house prices are against a backdrop of record consenting activity for Tasman. Building consents
for dwellings for year ending March 2021 reached a new record high of 601. Sections created
and resource consents for housing are also all trending upwards in Tasman.

2.1      Purpose and Objectives
This HBA has been prepared to meet requirements under the NPS-UD 2020, particularly Policy 2 and
implementation clause 3.10 of the NPS-UD. Nelson Tasman is identified as a Tier 2 Urban Environment in
the NPS-UD.

Policy 2 of the NPS-UD requires Tier 2 local authorities, at all times to provide at least sufficient
development capacity to meet expected demand for housing and for business land over the short,
medium and long term.

The purpose of this HBA is to inform RMA Planning documents, the FDS and LTPs. The analysis contained
within this assessment has been used to inform the LTP 2021-2031 and will be used to inform the
preparation of a new FDS in 2021. In 2022/23 further housing and business analysis will take place to
inform the LTP 2024-2034.

This HBA provides an introduction to the assessment, explains the methodology and approach, analyses
residential and business demand and capacity, and makes conclusions on sufficiency.

2.2      The Tier 2 Urban Environment and its Geographic Areas
“Urban environment” is defined in the NPS UD as any area of land (regardless of size, and irrespective of
local authority or statistical boundaries) that: (a) is, or is intended to be, predominantly urban in
character; and (b) is, or is intended to be, part of a housing and labour market of at least 10,000 people.

Richmond is the only town in Tasman with a population of more than 10,000 people and according to
latest medium growth population projections (commissioned privately), no other town would have a
population of more 10,000 by itself by 2051. However, as Ministry for the Environment (MfE) confirmed
by email (22nd Sept 2020), the definition of urban environment includes non-contiguous areas of urban
land – so long as they are part of the same housing and labour market that is greater than 10,000
people.

National Policy Statement on Urban Development: Housing and Business Assessment for Tasman                6
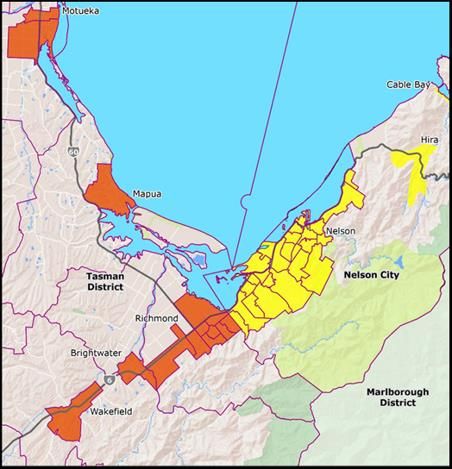
In determining whether a town in Tasman is part of the Richmond housing and labour market, Council
has considered commuter patterns for work and education, travel time to Richmond or Nelson,
connectivity to Richmond or Nelson and the real estate market - whether people are likely to move
house within this Urban Environment.

Statistical Area 2 (SA2) data was used “New Zealand Commutes – 2018 Census, Main means of travel to
work and education” New Zealand Commutes - Flowmap.blue to understand commuter patterns. The
towns included show significant numbers of commuters to Richmond. In addition, some residents of
these towns commute beyond Richmond to Nelson. These are (outside of Richmond) Brightwater,
Wakefield, Māpua and Motueka. There could also be some smaller towns with relatively high numbers
of commuters to Richmond and Nelson, for work and education, but the SA2 area encompassing these
towns is too large to be able to draw accurate conclusions; for example, the Moutere Hills SA2 area
includes Upper Moutere but is very large at 98 sq km.

The Joint Nelson Tasman Committee resolved on 10 November 2020 that the Nelson Tasman Urban
Environment comprises the following city and towns: Nelson, Richmond, Motueka, Māpua, Wakefield,
Brightwater, Cable Bay and Hira, in recognition that these communities are part of the same labour and
housing market, and these areas are or are intended to be predominantly urban in character. The map
below highlights these areas:

National Policy Statement on Urban Development: Housing and Business Assessment for Tasman               7
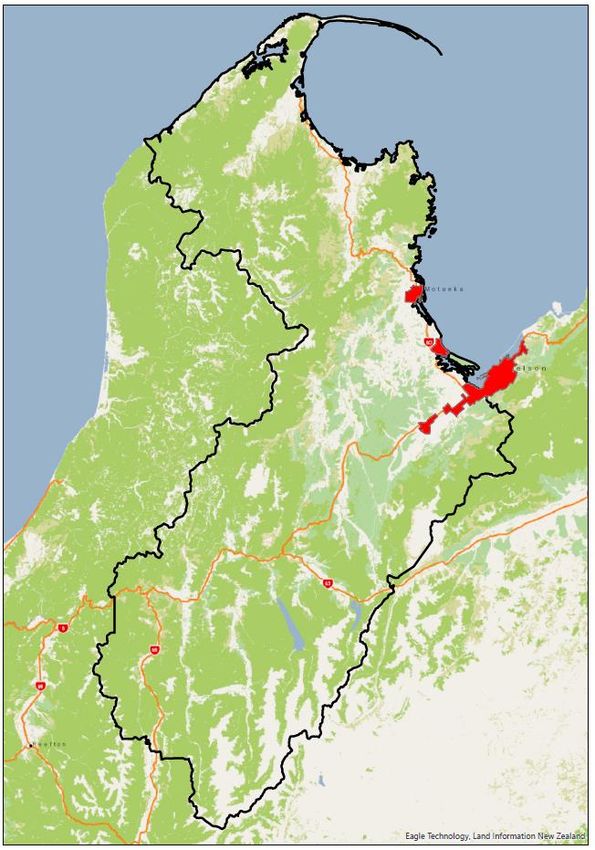
Figure 1: Map showing Tier 2 Nelson Tasman Urban Environment, across both Districts

The Urban Environment within Tasman comprises a very small component of the overall 10,000 sq km
land area of the District, as shown in Figure 2 below (black boundary represents Tasman District Council
boundary, excluding the Coastal Environment):

National Policy Statement on Urban Development: Housing and Business Assessment for Tasman             8
Figure 2: Map showing the Urban Environment within Tasman District as a whole

2.3      Relationship between Nelson City and Tasman District
         Territorial Authorities
Tasman District and Nelson City operate and function as a single economic market and business activity
flows both ways across the Territorial Authority boundaries. The relative isolation of the Tasman and
Nelson markets, reinforces this interconnectedness. Tasman and Nelson rely, to varying degrees, on
each other to sustain their respective economies and generate significant economic benefits for each
other.

Consequently, Tasman and Nelson also function as a single housing market. For these reasons, the Tier 2
Nelson Tasman Urban Environment covers a relatively large non-contiguous area.

National Policy Statement on Urban Development: Housing and Business Assessment for Tasman               9
2.4 Background to Assessment Housing affordability is usually measured by house prices in relation to incomes. The Demographia International Housing Affordability2 uses the “median multiple” to rate middle-income housing affordability. The Median multiple is a price-to-income ratio of the median house price divided by the gross median household income. Middle-income housing affordability is rated in four categories, ranging from the most affordable (“Affordable”) to the least affordable (“Severely unaffordable”), as is indicated in Table 1. Table 1: Housing Affordability Ratings (Source International Demographia Survey 2021) According to Demographia, in the late 1980s, the median multiple (price to income multiple) in NZ was approximately three but had risen to seven in 2019. In March 2021, infometrics estimated a ratio of 7.5 between Tasman’s average house values and average household incomes, making it one of NZ’s least affordable local authorities.3 The Government’s measure of housing affordability HAM Buy, shows that at December 2018, about 81% of first-time buyer households in Tasman could not afford a typical ‘first home’ priced house, spending more than 30% of income on housing costs – which are defined as lower quartile price point of housing in the area. The HAM Buy has not been updated since. Mean incomes in Nelson Tasman are 13% below the NZ average and have only caught up by 2% in the last 20 years. Nelson Tasman is second lowest in NZ, second only to Gisborne.4 The MHUD’s website comments that the “affordability of buying a first home for those in the South Island is better than for those living in Auckland, except in Tasman, Nelson and Otago" (Tasman is in fact the worst.) 5 2 Demographia International Housing Affordability - 2021 Edition 3 Insights - Do Business - NelsonTasman.NZ and Infometrics 4 Project Kōkiri Nelson Tasman Economic Recovery and Regeneration Plan Discussion Document March 2021 5 Experimental Housing Affordability Measure for potential first home buyers | Te Tūāpapa Kura Kāinga - Ministry of Housing and Urban Development (hud.govt.nz) National Policy Statement on Urban Development: Housing and Business Assessment for Tasman 10
Figure 3: Government’s measure of housing affordability HAM Buy for Tasman District

According to the Government’s HAM Rent measure, as at December 2018, 38% of renting households
are spending more than 30% of their income on rent.

Another affordability measure updated more regularly is the Massey Home Affordability Index, which
takes into account the cost of borrowing as well as house prices and wage levels. The income data is for
both renting and owner occupier households. As at May 2021, Tasman remained the second least
affordable region in the country behind Auckland, as had been the case for nearly two years. In August
2020, the Massey index showed Tasman as the third least affordable region in the country, after
Auckland and Nelson.

According to MHUD’s dashboard, house prices have increased strongly in Tasman since 2015. Compared
with six years ago, since March 2015 median house prices in Tasman have increased by around 64%.
Note that this data has recently been revised by MHUD following an error on the dashboard. The
median actual sale price for the year ended 31 March 2021 was $689,507 in Tasman. Compared with
31 December 2019, when median house prices were $614,995, prices have increased in Tasman by 11%.

REINZ also monitors house prices in the region, and it finds that the median house price in Tasman was a
record $850,000 in May 2021, an increase of 21% since May 2020. According to REINZ there are only
two regions in the country currently with higher median house prices – Auckland and Wellington. 6 The
report notes for the Nelson/Tasman/Marlborough region, “attendance at open homes eased slightly,
however, interest from out-of-town prospective purchasers has remained strong. A shortage of available
stock in the region has continued to put upward pressure on prices and resulted in a number of multi-
offers being placed on homes. Sales of million dollar plus properties increased from 5.3% in May 2020 of
the market to 17.6% in May 2021. Activity is expected to remain steady over the winter months before
picking up again in spring.”

6
    REINZ Monthly Property Report - May 2021.pdf

National Policy Statement on Urban Development: Housing and Business Assessment for Tasman            11
2.4.1 Residential Consent Activity
Council’s latest annual monitoring report under the NPS UDC, covering the year ending June 2020
(Monitoring reports | Tasman District Council) noted building consents in Tasman reached a high of 491:
Figure 4: Annual number of new dwellings consented, 2016-2020, Tasman District
Since this annual report, building consents have actually further increased for the year ending March
2021 when they reached a new record high of 601. Returning to the year ending June 2020, 322 sections
on residentially zoned land were created, with Richmond accounting for 75% of these sections. Excluded
from this count of new sections are a further 92 sections created in the Coastal Tasman Area for
residential purposes (Rural 3 zoned land), for the year ending 30 June 2020. These are not counted as
they are not on residentially zoned land, but importantly are adding to the District’s potential supply of
housing.
Similar trends can be seen in the resource consents for residential units. For the year ended 30 June
2020, in Tasman, resource consents were granted for 680 residential lots. This includes a special housing
area in Richmond in the September quarter and nine subdivision resource consents granted for
intensification within the Richmond intensive development area. There were also additional resource
consents granted that did not involve subdivision.
Tasman District and Nelson City Councils adopted their first FDS in 20197. This is a high-level plan
showing future growth areas across the region that will accommodate future housing and business
demands over the next 30 years. It shows the location of future growth, the form of development
expected, and the type of infrastructure required. While most of these future growth sites are not zoned
appropriately, the review of the Resource Management Plan has commenced. 8 The first round of public
engagement occurred late 2020. This new Plan will propose the growth sites for rezoning.
7
Future Development Strategy FDS | Tasman District Council
8
Aorere ki uta Aorere ki tai - Tasman Environment Plan | Tasman District Council
National Policy Statement on Urban Development: Housing and Business Assessment for Tasman 12There are a number of factors affecting affordability. Council has obligations under RMA to ensure there
is sufficient housing and business land to meet expected demands of the region. Council also has
obligations under the NPS-UD as a Tier 2 Urban Environment:
Planning decisions should seek to improve housing affordability by supporting competitive land
and development markets.
Tier 2 authorities, at all times, provide at least sufficient capacity to meet expected demand for
housing and for business land over short, medium and long term.
A number of special housing areas (SHAs) are currently under construction in Lower Queen Street,
Richmond and demographic sales data has been provided by the developers to the Council. For stages
recently released, between 42% and 50% of sales are to investors and speculative buyers. As Central
Government acknowledged in March 2021 in its housing announcement, this level of speculation in the
property market is further inflating property prices. Providing zoned, serviced land is therefore only part
of the affordability puzzle. Other factors affecting affordability include:
Figure 5: Other factors affecting affordability of housing
National Policy Statement on Urban Development: Housing and Business Assessment for Tasman 133. Methodology and Approach
Tasman’s population continues to grow, outstripping predictions by Stats NZ, with average
annual growth between 2015-2020 averaging 2.2%. In the year ending 30 June 2020, the
population grew by 2.4%. Most of this growth is from net migration gains and importantly for
Tasman a sizable proportion of this is from internal migration. Population is projected to
increase in Tasman by 7,700 residents between 2021 and 2031, from 56,600 to 64,300 (13%)
and then slowing but still by a further 11,810 residents to 2051 (18%), totaling 76,110.
Population growth in the Urban Environment is slightly higher at 18% for the first 10 years and
18% for the following 20 years. Highest growth continues to be in the 65+ age group, of which
the proportion will increase in Tasman from 21% in 2018 to 34% in 2048. The ageing
population, increase in one-person households and couples without children, continues to
mean smaller average household sizes across the District. Council has its own growth model,
now on its sixth iteration that forecasts land requirements for housing and business. A Housing
Preferences Survey was undertaken earlier this year of the Urban Environment to also inform
housing demand.
3.1 Population Growth and Projections
Tasman’s population growth has been significantly higher in recent years, than during the previous
decade:
the annual average population growth over the last ten years to 2020, was 1.8% (which included
an increase in 2011 following the Canterbury earthquakes)
in the five years between 2015 and 2020, average annual growth increased to 2.2% (ranging
between 1.9% and 2.4%)
the latest provisional Stats NZ population estimate for Tasman, estimates the population grew by
2.4%, or 1300 residents, in the last year, to 56,400 as at 30 June 2020
Most of the growth was net migration gains, with half from rest of NZ and half from overseas. Looking at
past trends, it is typical for half or more of Tasman’s migration to be internal rather than from overseas.
In the year ending June 2019, net internal migration accounted for at least three-quarters of the
population growth.
Statistics NZ had previously projected that the Nelson Urban Area’s population was likely to grow by not
more than 9.95% in the ten years between 2013 and 2023, meaning it was classified as ‘medium
growth’, according to the NPS-UDC, falling just below the ten percent threshold defining ‘high growth’
urban areas. We have exceeded this by some margin, growing by over 15% in the seven years between
2013 and 2020. The Tasman part of the Urban Area grew by 20%, Nelson’s by 10%.
In the absence of up-to-date Stats NZ population projections, Council engaged Natalie Jackson
Demographics Ltd (NJD)9 to provide District and Ward population and household projections (2018-
9
Tasman District Projections 2018-2053 provided by Natalie Jackson Demographics Ltd, November 2019 “Tasman
District Council and Wards – Population, Household and Dwelling Projections 2018-2053”
National Policy Statement on Urban Development: Housing and Business Assessment for Tasman 14base), with low, medium, high scenarios10. The projections were based on Tasman’s long-term
demographic trends (births and deaths) and observed migration trends since 2006. After considering
recent estimated population and dwelling growth rates, Council has assumed the medium growth
scenario for the LTP. The Covid-19 pandemic has created more uncertainty in the development of this
LTP.
The effects of Covid-19 were considered on the preferred medium population growth trend but for the
following reasons, it remained unchanged:
Population growth in Tasman is driven by net gains in people moving from other parts of New
Zealand, rather than overseas
During the Global Financial Crisis in 2008, Tasman’s population growth rate appears to be
relatively unaffected
Strong growth continues in new dwellings built
The Tasman economy has a relatively strong economic contribution from the primary sector –
agriculture, forestry and fishing is Tasman’s largest employer, followed by manufacturing, retail
trade and construction. These industries account for over half of all employment in Tasman.
Tasman Region saw the largest rise nationally in economic activity in the September 2020 quarter
according to Infometrics estimates, rising 5.1%p.a. “More people in the region, and a sustained
boost in construction activity, has supported the local economy.” Stats NZ report on national GDP11
notes that “the September quarter reflected a bounce back after a slump in the June quarter, due
to the COVID-19 national lockdown when many businesses were shut for weeks."
In the December quarter, GDP for Tasman was down 0.9% for the year to December 2020,
compared to a year earlier. Although growth was still higher than in NZ generally (-2.6%)
Tasman District Council applies up to date population projections to its own growth model every two-
three years to inform the LTP. The growth model projections span 30 years in total. The latest
projections are for annual population growth of 1.3% for the next 10 years, 2021-2031, based on the
medium growth scenario12. These are based on population projections undertaken by Dr Natalie
Jackson, which note that the projections result in relatively modest annual average growth rates when
compared with recent years, but advised against assuming growth would continue at a high level
unabated. The report also notes that the projections already assumed relatively high net migration
compared with previous Stats NZ projections, and growth rates are likely to decline over time as
structural ageing increases. The rates for the medium scenario aligned well with the average growth
over 2006-2018.
Figure 6 shows the three growth scenarios for Tasman’s population growth between 2018 and 2053.
The graph also shows Stats NZ’s population estimates for 2003 to 2018. The three population
projections (low, medium, and high growth) incorporate different fertility, mortality, and migration
assumptions for Tasman. Further information on the population projections is available in Dr Natalie
Jackson’s report.
10
Due to delays in Census 2018 data, Stats NZ population projections were not updated in time to inform the
growth model and the LTP.
11
December 2020 quarter GDP drops 1.0 percent after record September rebound | Stats NZ
12
Growth model | Tasman District Council
National Policy Statement on Urban Development: Housing and Business Assessment for Tasman 15Tasman District Population Estimates and Projections
100000
80000
60000
40000
2003 2008 2013 2018 2023 2028 2033 2038 2043 2048 2053
High Projection Scenario
Medium Projection Scenario (LTP Assumption)
Low Projection Scenario
Figure 6: Estimated and projected population series, 2003-2053, Tasman District
Consequently, in adopting the medium projection scenario, the overall population of Tasman is
expected to increase by 7,700 residents between 2021 and 2031, from 56,600 to 64,300 (13%) and then
slowing but still by a further 11,810 residents to 2051 (18%), totalling 76,110. Most of the overall
population growth will be driven by net migration gains (more people moving to Tasman District than
leaving).
As at 2019, 55% of Tasman’s population is estimated to live in the Urban Environment. Population
within the urban environment is forecast to grow by 18% between 2021 and 2031 and a further 18% to
2051.
Under the medium scenario, the Motueka, Moutere-Waimea and Richmond Wards are projected to
experience the greatest growth in population, parts of which form part of the Nelson Tasman Tier 2
Urban Environment. The Golden Bay Ward population is projected to peak in the 2030’s and then
decline slightly, offsetting some of the growth in 2018-2028. The Lakes-Murchison Ward population is
projected to plateau around 2038. These projections reflect each Ward’s age structure and its migration
trends (net gains/losses) for different age groups.
Table 2: Summary of Population Projections (*towns forming part of the Nelson Tasman Tier 2
Environment)
Growth model Area Total Population (as at 30 June)
2019 2021 2031 2041 2051
Richmond* 15,169 15,606 19,277 21,388 23,255
Brightwater* 2,294 2,391 2,654 2,975 3,307
Māpua/Ruby Bay* 2,657 2,779 3,399 4,005 4,500
Motueka* 8,027 8,306 8,962 9,803 9,409
Wakefield* 2,453 2,528 3,063 3,382 3,662
Subtotal urban environment 30,600 31,610 37,355 41,553 44,133
Collingwood 270 273 283 274 247
National Policy Statement on Urban Development: Housing and Business Assessment for Tasman 16Growth model Area Total Population (as at 30 June)
2019 2021 2031 2041 2051
Kaiteriteri 367 371 391 404 415
Mārahau 142 149 186 212 177
Moutere 5,682 5,908 7,069 8,936 11,386
Murchison 479 491 541 555 542
Pōhara/Ligar/Tata Bay 600 606 632 633 612
Riuwaka 617 620 625 597 575
St Arnaud 114 120 136 132 118
Tākaka 1,387 1,402 1,458 1,449 1,396
Tapawera 305 309 327 330 324
Ward Remainder Golden Bay 3,148 3,177 3,280 3,257 3,167
Ward Remainder Lakes Murchison 2,863 2,892 3,024 3,076 3,049
Ward Remainder Motueka 1,844 1,904 1,975 2,217 2,474
Ward Remainder Moutere Waimea 4,258 4,333 4,497 4,697 4,884
Ward Remainder Richmond 2,403 2,418 2,491 2,558 2,611
Total District 55,076 56,583 64,269 70,881 76,110
Under the medium scenario, all age groups in Tasman are projected to experience growth. However, the
highest growth continues to be in the 65+ age group, of which the proportion will increase from 21% in
2018 to 34% in 2048. This increase, known as structural ageing, means that total population growth
rates are projected to slow down over time. Once a population has more than 20% aged 65 years and
over, it is usually approaching the end of natural increase.
30,000
25,000
20,000
Population
15,000
10,000
5,000
-
0-14 Years 15-39 Years 40-64 Years 65 Years and over
2008 2013 2018 2023 2028 2033 2038 2043 2048 2053
Figure 7 Estimated and projected population by age group, 2008-2053, Tasman District
National Policy Statement on Urban Development: Housing and Business Assessment for Tasman 173.2 Household Size
The ageing population is driving a change in the average household size across the District, projected to
decrease from 2.5 residents per household in 2018, to 2.4 in 2028 and 2.3 in 2038. The numbers of one-
person households and couple-without-children households are also projected to increase. There are
variations in the projected household size across the District. Focusing on the towns in the Urban
Environment, Brightwater and Wakefield are projected to have above average household sizes across all
the time series.
3.3 Business Land Projections
The medium growth scenario for Tasman13 also informs demand for business land in Tasman. The
Nelson-Tasman business land forecasting model, provided in 2016 by Property Economics, estimates
future land requirements for three different types of business land (industrial, office, retail). The model
incorporates national and regional economic and demographic trends, employment projections, and
employment to land ratios. Further information on how business land projections are calculated are
provided in Appendix 3. The land requirements assume that development will be ‘at grade’, i.e., single
storey. For Tasman, this is appropriate with few two storey business developments.
3.4 Housing Preferences Survey 2021
Tasman District and Nelson City Councils procured a Housing Preferences Survey in 2021 and results of
this are discussed in the housing demand section of this report. Appendix 1 outlines the methodology of
the survey.
3.5 Consideration of Other Growth Scenarios
Since Council adopted population projections for its LTP, Stats NZ released the Territorial Authority
population projections (2018 based) in March 2021. The Stats NZ high projection is very close to
Council’s adopted population projections for the LTP:
13
Tasman District Projections 2018-2053 provided by Natalie Jackson Demographics Ltd, November 2019
National Policy Statement on Urban Development: Housing and Business Assessment for Tasman 18Forecast Period High
Population Medium Low
LTP Actual
80,000
75,000
70,000
65,000
60,000
55,000
50,000
45,000
40,000
1996 2006 2016 2026 2036 2046
Figure 8: Tasman’s LTP population projections compared with Stats NZ Territorial Authority
Population Projections (2018 based)
Stats NZ has underestimated population growth for Tasman District since at least 2013. The adopted LTP
medium scenario population projections are considered robust as they reflect average growth between
2006 and 2018.
There is always a degree of uncertainty when making assumptions about the future. There are several
factors which are difficult to predict such as, population migration (either to/from overseas or within
NZ); the proportion of dwellings used as holiday houses; developer and landowner activity; and natural
events. Positive net migration is the major contributor to the District’s population growth and can be
affected by housing supply, house prices and incomes in other regions and countries.
In providing the population projections, Dr Natalie Jackson provided three sets, ‘high’, ‘medium’ and
‘low’, and noted “changing economic, political and social circumstances can have an impact on the
underlying assumptions regarding births, deaths, and especially migration, and cause trends to fluctuate
between the upper and lower bounds.” 14 It is conventional for the medium scenario to forecast the
most likely scenario. However, the high and low scenarios should also be considered for potential effects
on Council’s financial estimates, infrastructure needs, and zoning requirements. The Council considered
these other scenarios and adopted the medium growth projection.
If population growth is higher than assumed, debt incurred by Council will be repaid faster to fund the
growth-related portion of infrastructure than assumed under the medium scenario. This is through the
payment of development contributions to Council. However, higher growth than planned could also
result in an insufficient amount of serviced land for development and a potential worsening of housing
affordability. Regular monitoring of consents and population trends will inform Council, if it is required
to undertake further urgent plan changes to the Tasman Resource Management Plan, rather than wait
for the emerging new Tasman Environment Plan and/or increase its investment in infrastructure to
14
Growth model | Tasman District Council
National Policy Statement on Urban Development: Housing and Business Assessment for Tasman 19make more land available for development. Council is currently considering such an urgent growth plan change. If population growth is lower than assumed, it may take longer for development contributions to pay off debt incurred to fund growth related infrastructure. Council may need to revise its capital works programme for growth related infrastructure. The forecast increases in rates and development contributions may be smaller than anticipated. The Nelson Tasman FDS (Future Development Strategy FDS | Tasman District Council) will be reviewed in July 2021, to be adopted in July 2022. The growth model will be updated in 2022/23, and the next HBA will be prepared in time to inform the next LTP (2024-2034). 3.6 Growth Model Methodology Appendix 2 provides a summary of Council’s growth model methodology. The Council’s growth model was run for a sixth time in 2019/20 to inform this HBA. Estimates of dwellings to be built are made for the period 2019-2021 based on consents, physical constraints of the land, yields allowing consideration of stormwater, roading and the zoning and known developer intentions. Projections are then made for the period 2021-2051. The model has been externally peer reviewed in 2019 and minor changes were made. National Policy Statement on Urban Development: Housing and Business Assessment for Tasman 20
4. Residential Demand
As with population growth, dwelling demand is expected to decrease District wide over time,
averaging 451 dwellings a year in the short term, 427 per year medium term and 416 per year
long term. However, for the Urban Environment, dwelling demand remains constant over the
30 years. 67% of the dwellings required in the District are needed in the Urban Environment,
demonstrating the role these towns are playing in providing locations to live within
commutable distance to the major employment areas of Richmond and Nelson. Richmond and
Motueka, the two largest towns, need the most new dwellings in the future. While the actual
number of dwellings varies significantly between the low, medium and high scenarios, the
composition by age group and household type remains relatively similar. Unmet demand (new
dwellings consented versus actual household growth) amounts to approximately only 260
dwellings in total for the last ten years.
In considering different household needs, the greatest concentration of Māori residents is in
Motueka, where 15% of the population identify as Māori (compared with 8% for the total
Tasman population). Tasman’s Māori population is projected to increase from 8% of Tasman’s
population in 2018 to 12% in 2038. Despite having more residents per household, Māori are
slightly more likely to live in smaller homes than the general population, but this could be due
to affordability constraints.
Home ownership proportions in Tasman have been one of the highest nationally since 2006.
Dwellings owned or held in a family trust had increased slightly from 75% to 75.6% between
2013 and 2018, despite affordability worsening. Housing affordability is an issue across all of
the District, but Motueka and Golden Bay have the highest proportion of households on
relatively low incomes and a greater need for affordable housing options. There are about
5,500 seasonal workers in Tasman in a given season and about 1,500 -1,700 of these are RSE
workers. In towns such as Motueka and Riuwaka, growers face particular seasonal
accommodation challenges with lack of motor camps and motels.
The Housing Preferences Survey 2021 shows that while the majority (71%) of respondents
prefer stand alone dwellings, an increased proportion prefer attached dwellings, when
compared with previous surveys – 25%. 4% prefer apartments. The majority (62%) of older
residents prefer standalone dwellings, but a significant proportion also prefer attached
dwellings (31%) and these would generally be smaller dwellings.
4.1 Demand for Dwellings
As with population growth, dwelling demand is expected to decrease District wide over time, whereas
for the Urban Environment, demand remains constant over the 30 years:
Over the 30-year period, 11,757 dwellings are required to meet District wide demand
For the Urban Environment only, 7,847 dwellings are required to meet demand
District wide, the growth model projects an average of 451 new dwellings a year for 2021-
National Policy Statement on Urban Development: Housing and Business Assessment for Tasman 212024 (short term), dropping to 427 a year for 2025-2031 (medium term), 416 a year for
2032-2041 and 337 dwellings a year for 2042 -2051 (long term). Figure 9 below illustrates
this.
Average annual number of new dwellings
Projected for 2021-2051
500 451
427 416
400
337
300
200
100
0
Years 1-3 Years 4-10 Years 11-20 Years 21-30
Figure 9: Annual average number of new dwellings projected, 2021-2051, Tasman District
4.2 Demand by Location
Table 3: Demand for new dwellings – Tasman District (*towns forming part of the Nelson
Tasman Urban Environment)
Town or ward area Demand for new Demand for new
dwellings dwellings
Years 1-10 (2021-2031) Years 11-30 (2032-2051)
Brightwater* 210 358
Māpua/Ruby Bay* 314 628
Motueka* 744 1,576
Richmond* 1,170 2,345
Wakefield* 174 328
Subtotal for Urban Environment 2,612 5,235
Collingwood 13 2
Kaiteriteri 46 77
Mārahau 32 60
Moutere area 569 1,130
Murchison 37 25
Pōhara/Ligar/Tata Bay 52 33
Riuwaka 17 33
St Arnaud 74 17
Tākaka 54 25
National Policy Statement on Urban Development: Housing and Business Assessment for Tasman 22Town or ward area Demand for new Demand for new
dwellings dwellings
Years 1-10 (2021-2031) Years 11-30 (2032-2051)
Tapawera 14 10
Ward Remainder Golden Bay 132 74
Ward Remainder Lakes Murchison 109 120
Ward Remainder Motueka 165 305
Ward Remainder Moutere Waimea 210 331
Ward Remainder Richmond 61 124
Subtotal for remainder of District 1,585 2,325
TOTAL DISTRICT 4,197 7,560
67% of the dwellings required in the District are needed in the Urban Environment. This demonstrates
the role these towns are playing in providing locations to live within commutable distance to the major
employment areas of Richmond and Nelson. Richmond and Motueka, already the two largest towns by
some margin in the District need the most new dwellings in the future.
4.3 Different Growth Scenarios and Effect on Composition of Age
Group and Household Type
While the actual number of dwellings varies significantly between the low, medium and high scenarios15,
the composition by age group and household type remains relatively similar. The population is slightly
younger on average under the high scenario, and slightly older under the lower scenario. The majority of
households by 2038 under all three growth scenarios are of similar composition, with couples-without-
children and one person households the only types expected to increase in number by 2038:
Table 4: Different growth scenarios and effect on age group and household type
Types of
Age composition Family or household Number of dwellings
dwellings
differences type differences required
needed
High Population slightly No significant Demand for All Tasman wards
growth younger on average, difference to the types of experience significantly
scenario due to fertility rate medium or low dwellings higher population
and net migration all scenario. Under all likely to be growth and demand for
being higher. scenarios majority of similar to new dwellings over the
households by 2038 medium next 30 years, including
Proportion of 65+
are expected to be growth Golden Bay and Lakes-
years is slightly
couples-without- scenario Murchison (which
lower, reaching 32%
children (41%), are otherwise projected
by 2053 compared
followed by one- to stop growing beyond
with 34% under the
person households 2033 under the medium
medium scenario
(30%) growth scenario)
15
Growth model | Tasman District Council
National Policy Statement on Urban Development: Housing and Business Assessment for Tasman 23You can also read