Computing climate-smart urban land use with the Integrated Urban Complexity model (IUCm 1.0)
←
→
Page content transcription
If your browser does not render page correctly, please read the page content below
Geosci. Model Dev., 12, 525–539, 2019
https://doi.org/10.5194/gmd-12-525-2019
© Author(s) 2019. This work is distributed under
the Creative Commons Attribution 4.0 License.

Computing climate-smart urban land use with the Integrated Urban
Complexity model (IUCm 1.0)
Roger Cremades1 and Philipp S. Sommer2
1 Climate     Service Center Germany (GERICS), Chilehaus Eingang B, Fischertwiete 1, 20095 Hamburg, Germany
2 Institute   of Earth Surface Dynamics (IDYST), University of Lausanne, Lausanne, Switzerland

Correspondence: Roger Cremades (roger.cremades@hzg.de)

Received: 28 March 2018 – Discussion started: 18 June 2018
Revised: 13 November 2018 – Accepted: 5 December 2018 – Published: 1 February 2019

Abstract. Cities are fundamental to climate change mitiga-      density is not a primary determinant of energy-intensive
tion, and although there is increasing understanding about      forms of mobility (Ewing and Cervero, 2010), other sources
the relationship between emissions and urban form, this re-     suggest that once the density is augmented the reduction in
lationship has not been used to provide planning advice for     the energy consumption of urban mobility is not immediate
urban land use so far. Here we present the Integrated Urban     and takes a longer time to realize (van Wee and Handy, 2014).
Complexity model (IUCm 1.0) that computes “climate-smart        Similarly, there is still a lack of complete understanding of
urban forms”, which are able to cut emissions related to en-    the interaction between urban form and energy consump-
ergy consumption from urban mobility in half. Furthermore,      tion and derived CO2 emissions (Seto et al., 2014). Going
we show the complex features that go beyond the normal de-      beyond other approaches, Le Néchet (2012) suggests that,
bates about urban sprawl vs. compactness. Our results show      beyond density, the energy consumed in mobility is signifi-
how to reinforce fractal hierarchies and population density     cantly correlated with the urban form, most specifically with
clusters within climate risk constraints to significantly de-   measures of urban form related to a complexity science ap-
crease the energy consumption of urban mobility. The new        proach to density. The full potential of cities for mitigating
model that we present aims to produce new advice about how      climate change can only be achieved through the considera-
cities can combat climate change.                               tion of the influence of the urban form on the energy needed
                                                                for mobility. Hence, these measures of the urban form show-
                                                                ing a significant correlation with energy consumption for mo-
                                                                bility can be used to guide urban growth and transformation.
1   Introduction                                                Indeed, policy recommendations for the urban form in rela-
                                                                tion to energy consumption and derived CO2 emissions have
Cities are crucial for a decarbonized society. Urban areas      not been yet produced systematically, although it is clear that
emit roughly three quarters of global carbon emissions (Seto    a lack of urban planning increases congestion and pollution
et al., 2014). Cities are self-organized emergent structures    (Moreno et al., 2016).
with fractal qualities (Batty, 2007). They are classical ex-       Furthermore, there is an opportunity to combine these spa-
amples of complex adaptive systems, which call for models       tially explicit insights about mitigation of CO2 emissions
combining spatial explicitness with a complex systems ap-       from energy consumption for mobility with spatially explicit
proach (White, 1998; Clarke et al., 1997).                      information of climate risks. We therefore aim to cover this
   The spatial distribution of urban land use and the density   gap in urban planning by producing a new type of spatially
of population define the urban form. The debate in urban        explicit model, a model that optimizes urban forms and is
planning about the influence of population density and urban    able to take into account climate risks, and that should be
forms in mobility and derived energy is a long one. While       designed to produce planning suggestions that decrease the
some American-focussed analyses suggest that population

Published by Copernicus Publications on behalf of the European Geosciences Union.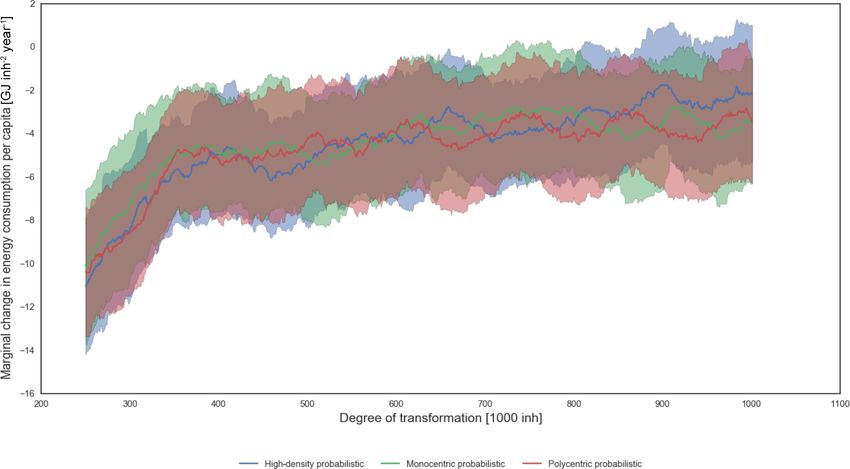
526                                  R. Cremades and P. S. Sommer: The Integrated Urban Complexity model (IUCm 1.0)

energy consumption of urban mobility, and the derived emis-          via spatial entropy, average distance between citizens and
sions and pollution, while taking into account climate risks.        with the slope of the rank–size rule, amongst other factors.
   We present the first version of the Integrated Urban Com-         The slope of the rank–size regression line applied to a city
plexity model (IUCm 1.0) and its first results, as a first step      measures intra-urban polycentrism (Le Néchet, 2012). The
of an urban research agenda focussing on co-benefits be-             average distance of the population measures the degree of ur-
tween adaptation to, and mitigation of, climate change. The          ban sprawl, which influences the distance to urban services
goals of this applied research agenda are to incorporate in          and activities (work, commerce, health, education, leisure)
urban planning the adaptation to the most important climate          and thus the energy needed to have access to them (Ewing,
risks impacting cities, i.e. floods, droughts and heat-island ef-    2008). Spatial entropy measures how organized the distribu-
fect, while capturing the co-benefits with mitigation of green-      tion of population within the urban space is (Batty, 1974).
house gas (GHG) emissions leading to climate change and              Further details of these parameters are provided below in
other forms of urban pollution. We find that the first results       Sect. 2.2.1. The contribution of these parameters to the en-
from this research agenda are already worthy of consider-            ergy consumption of urban mobility has been quantified with
ation: a new type of urban planning advice providing spa-            statistical regressions at a 1 km scale, showing the statistical
tially explicit insights on co-benefits between adaptation and       significance of these relationships (Le Néchet, 2012).
mitigation shows in some cases a halving in the energy con-             Second, a multi-objective function to optimize urban
sumption of urban mobility while constraining urban plan-            forms is derived from the statistical evidence described
ning to flood risks (see Sect. 3.4 below). After the meth-           above. This function reproduces the statistically significant
ods and results we present here, which include the IUCm              influence of the above parameters on the energy consump-
1.0 and its first results, the following steps of this agenda        tion of urban mobility, using a probabilistic approach to deal
include (i) detail of urban transportation networks and infras-      with the uncertainties related to the parameters.
tructures, (ii) detail of urban water supply and drought risks          Third, a cellular automaton departs from the density of
(Cremades, 2017), and (iii) three-dimensional depiction of           population for each cell of the urban land use at the scale
cities, land use and building covers to analyse the heat-island      measured by the statistical evidence. In each step of the cel-
effect together with a climate model.                                lular automaton model the simulated urban complex system
   In this IUCm 1.0, we drive the evolution of a cellular au-        evolves according to the rule of the multi-objective function
tomaton model depicting the urban form and initially use sta-        above, to minimize the energy consumption of urban mo-
tistical evidence to capture its implications in the energy con-     bility, while being constrained by information about climate
sumption of urban mobility. IUCm 1.0 provides a methodol-            risks and stakeholders’ preferences.
ogy to compute the first “climate-smart urban forms”, a novel           To showcase how the IUCm 1.0 suggests the transforma-
concept in urban land use that has been applied to agriculture       tion of cities, it is first applied to three idealized city forms.
before (Lipper et al., 2014). We first apply IUCm 1.0 to three       Then the results are provided for a real example: the high-
idealized city forms representing the planning challenges of         density urban cluster formed by Frankfurt, Offenbach and
diverse types of real cities, and then we apply this to a real ex-   connected urban areas of lower density.
ample: Frankfurt. Rather than just suggesting the concentra-            The idealized city forms are used exclusively to show
tion of density in the city centre, climate-smart urban forms        the model behaviour and represent the planning challenges
are characterized by strengthened density hierarchies and im-        of diverse types of real cities. The idealized city forms are
proved connections between urban clusters. We believe that           (i) a polycentric city, (ii) a monocentric city with satellite
applying our approach is crucial to the development of urban         towns and (iii) a city characterized by a unique high-density
strategies for climate action.                                       centre (Fig. 1). The polycentric city example presents chal-
                                                                     lenges similar to those of Berlin while the challenges of the
                                                                     monocentric city form are in the same domain of those of
2     Methods                                                        Paris. The problems of the idealized dense city could be com-
                                                                     pared to those of Barcelona.
2.1    Introduction to the Integrated Urban Complexity                  To illustrate the options in the model to incorporate in-
       model (IUCm 1.0)                                              formation constraining the evolution of a city, in relation to
                                                                     climate-change-related risks, the transformation of Frankfurt
We propose a model with three major methodological con-              and surrounding areas is constrained by the urban surfaces
stituents generating a new type of spatially explicit algorithm      currently under a flood return period of 100 years. The pop-
relating to changes in urban form with a decrease in the en-         ulation from those locations with unmanageable risk is re-
ergy consumption of urban mobility, by combining cellular            located by IUCm 1.0 with the same principles above, thus
automata (CA) with an evidence-driven optimization pro-              achieving the lowest energy consumption of urban mobility.
cess.
   First, the energy needed for urban mobility is related to the
urban form. The urban form can be quantitatively analysed

Geosci. Model Dev., 12, 525–539, 2019                                                    www.geosci-model-dev.net/12/525/2019/
R. Cremades and P. S. Sommer: The Integrated Urban Complexity model (IUCm 1.0)                                                            527

Figure 1. The evolution of each of the three idealized cities using the probabilistic approach departs from an initial state and undergoes a
number of transformations in the urban form; the degree of transformation is measured by the portion of the population that is moved to
another cell with lower energetic implications. After the initial state, an intermediate state and the final state are shown; these are a small
subset of the model steps that appear in the movies of the Supplement (Cremades and Sommer, 2018a, b, c).

2.2     Model description                                                 where wx corresponds to the weight of the corresponding
                                                                          variable x. This weight is calculated from a normal distribu-
The IUCm 1.0 integrates data and methods from a diver-                    tion in the probabilistic set-up through the mean of the weight
sity of disciplines. So, the methodological components of the             and its standard error after Le Néchet (2012) (Table 1); in the
model are first outlined and then finally their combined func-            deterministic approach, only the mean of the weight is used.
tioning is detailed.                                                         The variable energy was obtained by the UITP (Union In-
                                                                          ternationale des Transports Publics, or International Associa-
2.2.1    Evidence for the impact of urban form and                        tion of Public Transport) in their Mobility in Cities Database
         density on the energy consumption of urban                       through consultation with local authorities in each metropoli-
         mobility                                                         tan area about each type of fuel or electricity consumed per
                                                                          each mobility type, as reported in local statistics in 2001, or
Le Néchet (2012) provides significant statistical evidence on             by extrapolation of periodic surveys into 2001; the informa-
which urban morphological measures matter for the energy                  tion was provided only for those cities where there was suf-
consumption of urban mobility in European cities; this ev-                ficient information.
idence can be summarized in Table 1. The relevance in the                    The rank–size slope coefficient r is calculated via least-
objective function (Eq. 1) of the urban morphological mea-                squares minimization of the formula
sures discussed in the article is weighted by the econometric
results presented in Table 1. These measures are calculated
                                                                                       Pk
according to Eqs. (2), (3) and (4).                                       r ln(k) = ln        ,                                            (2)
   Let EM be the energy required for urban mobility, d the                             Ptot
average distance between citizens, E the spatial entropy and
r the rank–size slope (Table 1). Following Le Néchet (2012),              where Pk is the population of the kth ranking cell and Ptot is
whose estimations for energy required for urban mobility                  the total population.
have a correlation with the observed values characterized by                 The slope of the rank–size rule indicates the degree of
an R 2 value of 0.56, we calculate the energy consumption via             polycentricity. Cities with a uniform distribution of urban
                                                                          densities have values lower than 1, cities with pre-eminent
EM = K + wd d + wE E + wr r,                                     (1)      cells with high-density values (surpassing all other values)

www.geosci-model-dev.net/12/525/2019/                                                            Geosci. Model Dev., 12, 525–539, 2019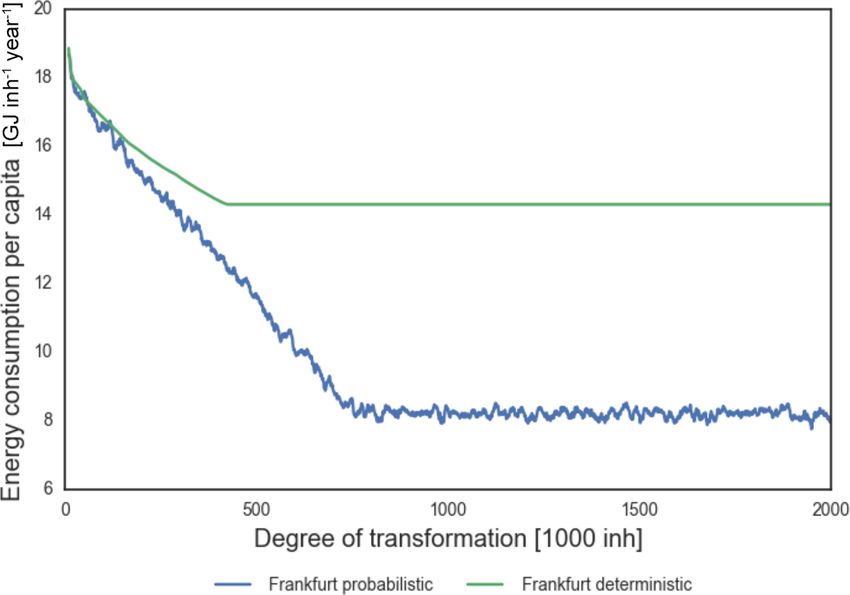
528                                         R. Cremades and P. S. Sommer: The Integrated Urban Complexity model (IUCm 1.0)

Table 1. Estimates of the urban-form-related determinants of energy consumption of urban mobility.

                                                                    Energy consumption of urban mobility,                        Standard error,
                                                                    MJ inhabitant−1 year−1                               MJ inhabitant−1 year−1
               Average distance between citizens (km)               279∗∗∗∗                                                               74.88
               Spatial entropy (adimensional)                       21 700∗∗                                                               9172
               Rank–size slope (adimensional)                       −9340∗∗∗                                                               2776

             Notes: ∗∗∗∗ p < 0.001, ∗∗∗ p < 0.01, ∗∗ p < 0.05, ∗ p < 0.1. Source: Le Néchet, personal communication, 2012.

have values larger than 1 and cities with values close to 1                           values is to display the behaviour of the model in connection
exhibit a rank–size relationship.                                                     to different types of cities. The density values of idealized
   In this rank–size relationship the densities of each cell in                       city forms are selected to represent high and low densities,
the city follow an order characterized by a statistical relation-                     and since they are part of an idealized city these values follow
ship between the population density in the cell and the rank                          random values within the ranges of high and low densities.
of population densities in the city’s cells (Wong and Fother-
ingham, 1990), in which the number of cells within subse-                             2.2.3     Data for real urban forms and model
quent ranks of population densities decreases with higher-                                      transferability to other cities
density values.
   Furthermore, the rank–size distribution has been described                         The data for Frankfurt, detailing its urban land use and the
as a type of fractal model (Chen and Zhou, 2003). Indeed the                          spatial distribution of its population, come from the Global
rank–size distribution is equivalent to a fractal, self-similar                       Human Settlement Layer (Freire et al., 2015). The popula-
hierarchical structure for a large number of ranks (Chen,                             tion grid of the Global Human Settlement Layer provides the
2012), and our model increases the number of ranks along                              basis for characterizing urban forms and population density
the transformation of cities while making cities less homo-                           globally, by combining data from remote sensing and popu-
geneous.                                                                              lation census, and we use this grid at 1 km of cell size. The
   The next model variable, the entropy, is calculated via                            urban area used in the real example is defined by the settle-
      PN Pi  Pi                                                                     ment grid of the Global Human Settlement Layer, particu-
         i=1 Ptot ln Ptot
E=                        ,                                   (3)                     larly from the high-density cluster containing Frankfurt am
             ln(N )                                                                   Main, Offenbach am Main and the connected lower-density
where N is the total number of cells in the city and Pi the                           urban areas. The product for 1 km of pixel size is freely avail-
population in cell i.                                                                 able worldwide at https://ghsl.jrc.ec.europa.eu (last access:
   Entropy measures the degree of organization of the cities’                         16 January 2019). Because the products used from the Global
densities. So, a perfect order of all cells having the same den-                      Human Settlement Layer are freely available for the entire
sity would give a value of 1, whilst having all the population                        globe, and because there is evidence for the model for Eu-
in a single cell would yield 0 (Batty, 1974; Le Néchet, 2012).                        rope, the application of this model to a European city can be
   Finally, the average distance between citizens is calculated                       done on an immediate basis, by adapting the format of the
via                                                                                   Global Human Settlement Layer to the requirements of the
      PN                                                                              model. The model can be applied to European cities using the
        i,j =1 dij Pi Pj                                                              existing evidence as described in Eq. (1) in Sect. 2.2.1. This
d=                       ,                                   (4)
       Ptot (Ptot − 1)                                                                evidence is implemented in the code available as described
with dij representing the distance between the cells i and j .                        in Sect. 6.
  The average distance between citizens is higher for large                              Spatially explicit data about flood risks in particular lo-
urban areas with citizens spread in low-density cells and                             cations can often be obtained from the websites of their
lower for smaller urban areas with higher densities.                                  local or regional administrations, frequently from thematic
                                                                                      web servers about risk management (e.g. the reference of
2.2.2   Portraying idealized urban forms                                              data for the German federal state of Hesse can be found in
                                                                                      Sect. 2.2.4).
The idealized city forms display the density of population                               The mentioned high-density cluster has been selected be-
in square cells of 1 km. All their densities have been allo-                          cause (i) it is a large metropolitan area where the size of the
cated randomly between 11 000 and 15 000 inhabitants per                              pixels of the data of origin (1000 m) allow for a meaning-
square kilometre for the dense areas and between 1000 and                             ful analysis; (ii) it is an area with an uncomplicated orog-
4000 inhabitants per square kilometre for the immediate sur-                          raphy that would allow for the clear representation of the
roundings. The purpose of these city forms and their density                          results of the first version of the model; (iii) Frankfurt is

Geosci. Model Dev., 12, 525–539, 2019                                                                          www.geosci-model-dev.net/12/525/2019/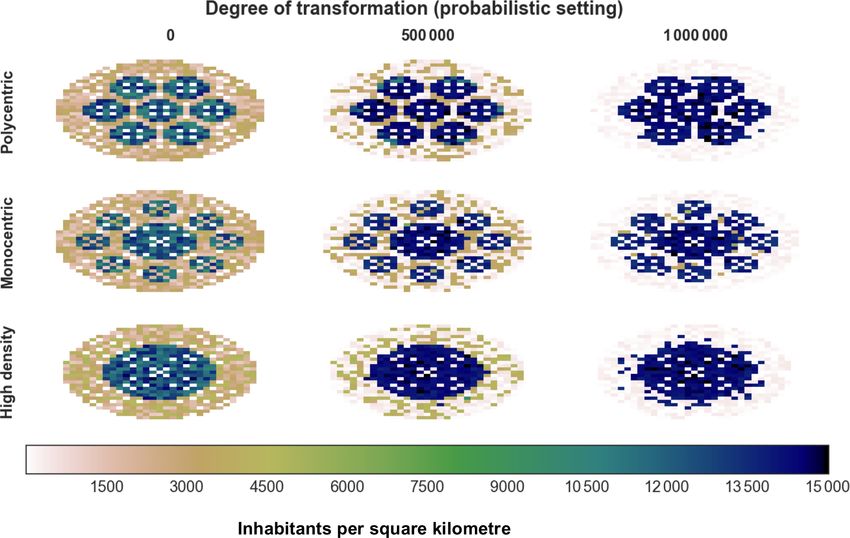
R. Cremades and P. S. Sommer: The Integrated Urban Complexity model (IUCm 1.0)                                                  529

an affluent city, with a higher likeliness of considering a        provide results from a probabilistic approach in the algo-
large-scale transformation or growth based on our insights;        rithm of the model. Instead of evaluating Eq. (1) for only
and finally (iv), choosing Frankfurt was convenient for in-        the means in Table 1, the probabilistic version draws 1000
stitutional reasons related to the country of affiliation of the   sets of weights, where each weight is drawn randomly from a
main author. The second reason (orography) thereby could           normal distribution defined through the corresponding mean
appear as a confirmation bias (see Flyvbjerg, 2006) but this       and standard error presented in Table 1. This results in 1000
can safely be negated. The interpretation of the a priori data     (non-unique) cells that are candidates for the best scenario,
would not allow a human to infer the results we present, es-       one cell for each set of weights. The 1000 inhabitants that
pecially the shape in the formation of hierarchies of densities    are moved within one transformation step are then distributed
and the halving of the energy consumption for urban mobility       equally within the 1000 cells; i.e. the more often a cell is clas-
as presented in Sect. 3.                                           sified as being the best scenario, the stronger the transforma-
                                                                   tion is in this cell. In our simulations, the unique number of
2.2.4   Data about flooding in urban areas                         cells ranges from 1 to 18 for 1000 sets of weights.
The model allows us to limit population from areas under           2.2.7   Cellular automata (CA)
risk of urban flooding, by limiting the population in those
cells subject to flood risks; and if there is a population den-    CA are a set of spatially discrete cells that evolve in suc-
sity exceeding the limit, we move it to other cells following      cessive steps following certain rules. Those models display
the model algorithm, as described below under Sect. 2.2.9          complex emergent behaviour. CA have already been applied
“Functioning of the IUCm 1.0”.                                     to urban contexts (Batty, 2007). The OR problem above rep-
   The model constrains the cells to a maximum of 15 000           resents a variation of CA, in which the concept of neighbour-
inhabitants per square kilometre (see Sect. 2.2.5 “Operations      ing cells influencing the evolution of the CA is applied to
research”); in the case of areas with risk of floods, the cell     all the cells representing the spatial distribution of the urban
suffers a decrease in the 15 000 maximum, proportional to          population at 1 km of cell size. The discrete values of the
the surface occupied by areas of flood risk in the cell.           cells evolve ranging between 0 and 15 000 (see Sect. 2.2.2
   The data for the simulated areas under flood risk for Frank-    and 2.2.5 for details). The rule defining the evolution of the
furt represent those surfaces under risk of floods with a recur-   CA is a mathematical optimization rule, which is the mini-
rence interval of 100 years. These data are available via WFS      mization of Eq. (1).
Server (Geoportal Hessen, 2017).
                                                                   2.2.8   Complexity in the IUCm 1.0
2.2.5   Operations research
                                                                   The model currently includes two methodological aspects
In each step of the evolution of the CA (see Sect. 2.2.7           linked to complexity. First, rank–size slope can be a measure
below), the model performs a multi-objective spatially ex-         of the fractal structure of a city. Rank–size slope captures
plicit mathematical optimization routine, which is applied in      the multi-scale hierarchy of densities inside urban settle-
a probabilistic set-up that considers the uncertainties in the     ments. Second, the CA method is suited for modelling com-
objective function (Eq. 1) (see Sect. 2.2.6 below), as well as     plex systems like cities (Batty, 2007; White, 1998; Clarke
in a deterministic set-up. In both cases, the objective function   et al., 1997). CA allow the emergence of complex urban
is constrained in each cell to keep population values equal        structures, and the combination of CA with a multi-objective
or below 15 000 inhabitants per square kilometre, reflecting       function guides this emergence towards climate-smart urban
suggestions about maximum density for urban sustainability         forms. A third complexity aspect is planned, which involves
from Lohrey and Creutzig (2016).                                   network science applied to urban transportation in urban set-
   In the deterministic set-up, the routine applied selects the    tlements.
next step in the transformation of the city that minimizes en-
ergy consumption as described in the objective function (for       2.2.9   Functioning of the IUCm 1.0
details see Sect. 2.2.9 below). Our model therefore defines an
operations research (OR) spatially explicit problem.               Urban transformation is simulated with consecutive negative
                                                                   and positive changes in population of 1000 inhabitants. This
2.2.6   Probabilistic approach accounting for                      quantity is relatively small in comparison with the size of the
        uncertainty                                                modelled cities, and it has been chosen due to the computa-
                                                                   tional constraints created by the time spent in the calculations
The deterministic approach decides, based upon the weights         included in the model. Each model step in the probabilistic
of Le Néchet (2012) (Table 1, first column), what the sce-         set-up follows the following algorithm:
nario with the lowest energy consumption based upon Eq. (1)
is. However, to account for the uncertainty in the weights
from Le Néchet (2012) (standard errors in Table 1), we also

www.geosci-model-dev.net/12/525/2019/                                                   Geosci. Model Dev., 12, 525–539, 2019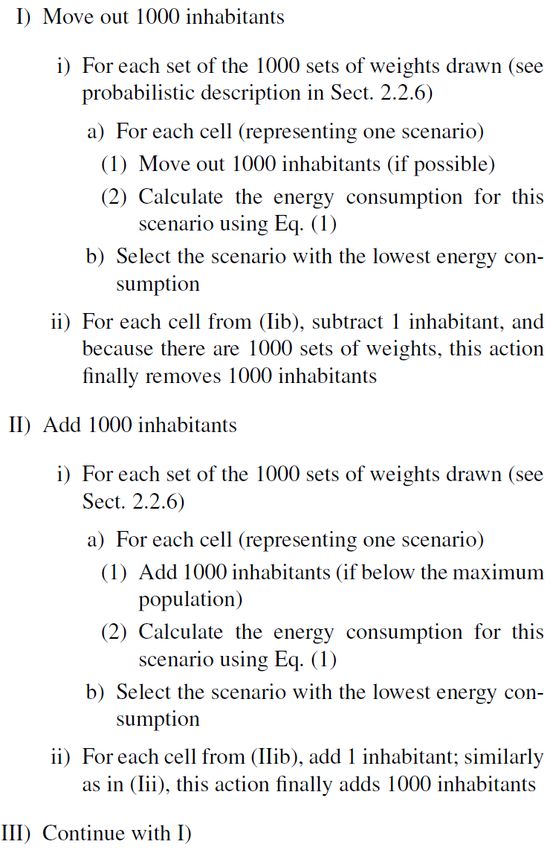
530 R. Cremades and P. S. Sommer: The Integrated Urban Complexity model (IUCm 1.0)
3 Results
3.1 Application cases of the IUCm 1.0
The IUCm 1.0 has three main applications: urban growth,
urban transformation and comparison of urban development
plans. We provide results showing examples of urban growth
and urban transformation for Frankfurt and of urban trans-
formation for idealized city forms to explore the functioning
of the model.
The simplest application case is the comparison of urban
development plans. The implications in urban densities of
two or more possible urban development plans can be used to
compute the related energy consumption for urban mobility
as explained above (Sect. 2.2.9) while detailing the function-
ing of the IUCm 1.0. Specifically its steps (Iia2) can be used
for calculating the energy for each of the alternative urban
development plans and step (Iib) for comparing each of the
plans.
In the application of urban growth, the initial scenario
evolves optimizing the progressive location of additional
urban densities: in every step, the model suggests where
1000 additional inhabitants would have a lower impact on
the energy consumption for urban mobility, so that from
Sect. 2.2.9, only step (II) would be applied. An example of
application for urban growth is presented below for Frankfurt
in Sect. 3.3.3.
In the hypothetical application of urban transformation the
model alternatively finds where to add density, like in the ap-
plication of urban growth above, and where to remove pop-
The maximum population in step (IIia1) is set to 15 000 ulation density from those places with the highest impact
inhabitants per each cell of a square kilometre. In cases with on energy consumption for urban mobility, so there are al-
unmanageable climate risks related to riverine floods, this ternate steps in which one step is like in urban growth and
maximum population is decreased by a multiplication with another moves out the population density from somewhere
the fraction of the grid cell that is not subject to unmanage- else, with the highest implications in energy consumption for
able flood risk (see Sect. 2.2.4). With other risks, e.g. related urban mobility, proceeding as detailed above in Sect. 2.2.9.
to sea level rise, the procedure would be analogous. Two examples of applications of urban transformation are
The model also excludes areas covered by forests, green presented: one for idealized city forms in the next section
urban areas, water bodies, airports and port areas through the and one for Frankfurt in Sect. 3.4.
same principle as the flood risk, by decreasing the maximum
allowed population through a multiplication with the fraction 3.2 Results for idealized urban forms
of the grid cell that is not covered by forests, green urban
areas, etc. The data for these excluded areas come from the For the sole purpose of making a preliminary analysis of the
European Urban Atlas (EEA, 2017). results of the IUCm 1.0, we created idealized urban forms
Repeating the algorithm above allows us to simulate and applied an urban transformation to them. When simulat-
the transformation of the city towards a climate-smart ur- ing the transformation of the urban form, the population is
ban form. This is achieved by moving out the population moved out from those places that have higher energetic im-
from those areas with the highest energetic implications and plications and added to those places with lower energetic im-
adding it to those areas with the lowest energetic implica- plications. This is done with 1000 inhabitants for each model
tions, with constrains related to climate risks and potentially step. The number of people moved within the urban form
to all other aspects desired by planners and citizens, such as reflects the degree of transformation (Fig. 1). The positive
gardens, green corridors or areas with historical or other local impacts of the transformation are visible in the reduction in
values not subject to transformation. energy consumption for urban mobility (Fig. 2).
Overall, it is clear that the IUCm 1.0 reinforces existing
and potential hierarchies of densities within the urban land
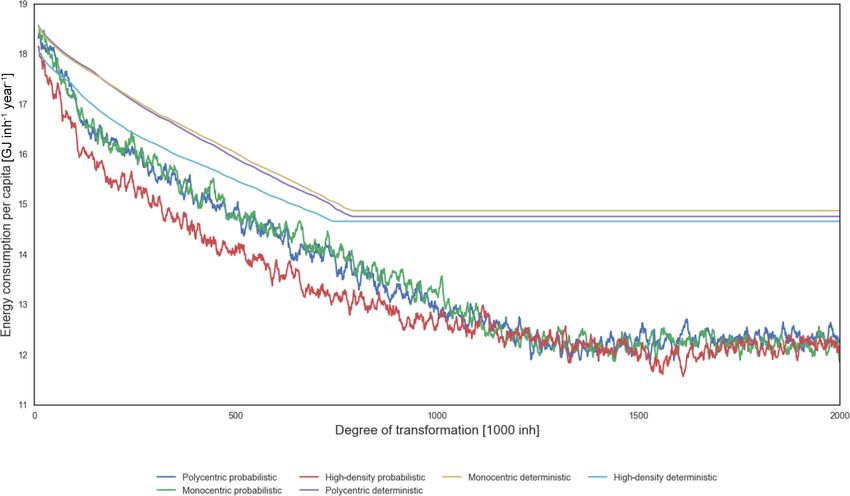
Geosci. Model Dev., 12, 525–539, 2019 www.geosci-model-dev.net/12/525/2019/R. Cremades and P. S. Sommer: The Integrated Urban Complexity model (IUCm 1.0) 531 Figure 2. The energy consumption for urban mobility per capita is reduced along the transformation of the urban form. The deterministic approach does not account for uncertainty and its evolution appears more stable, although its insights are limited compared to those of the probabilistic approach, which helps in overcoming non-convexities in the feasible space of the optimization process, thus overcoming the limitations of a spatially explicit optimization in a changing urban form. use (see movies in the Supplement and Fig. 1). This effect is reinforces connections between higher-density clusters, im- related to the slope of the rank–size regression line (Eq. 1). plying that it is possible to give advice on how polycen- The objective function optimizes the slope of the rank–size tric cities can be further optimized. In the high-density case, regression line (Eq. 1) while making the city less homoge- the initial dense centre characterized by a few cells with the neous. In this way it produces urban forms with a higher frac- highest density values is transformed into a complex hier- tal order, i.e. reinforces spatially scaled entities – in terms of archy of high-density clusters. In the monocentric case with density – inside the urban form, along the evolution of the satellite towns, the IUCm 1.0 emphasizes existing hierarchies cellular automata. of higher-density clusters and reinforces the connections be- The IUCm 1.0 strengthens existing higher-density urban tween them, letting a more complex structure emerge. The clusters (Fig. 1), as a consequence of optimizing the spa- sensitivity to the initial conditions makes the model produce tial entropy and the average distance between citizens, which results that are unrelated in every example, just having in promotes the creation of higher-density clusters. Overall, the common an increased hierarchy of urban densities that math- low-density areas surrounding the high-density clusters are ematically corresponds with an increased fractal order. reduced, and some higher-density features appear in the ar- With regard to the results in energy reduction, these fol- eas contacting with the central high-density clusters. Besides, low an expected decrease in marginal returns along the trans- across the examples in Fig. 1, it can be consistently observed formation effort, especially when using the probabilistic ap- that the evolution of the cells keeps some spaces within the proach (Figs. 2 and 3). Also according to expectations, the hierarchies of densities empty. This could be a consequence high-density case initially achieved lower energy consump- of the reinforced density in clusters and the enhancement tion per capita values with less effort than other idealized of the fractal order. This implies that a mitigation-oriented city types (Fig. 2). In counterfactual terms, the moving aver- urban space leaves ample room for designing adaptation- age of the marginal change in the energy consumption along oriented measures in the urban form, such as air corridors the transformation does not differ between the idealized city and urban green areas. types (Fig. 3). There are also case-specific remarkable features (Fig. 1), the details and evolution of which are better observed in the movies accompanying this article (see movies in the Sup- plement). In the polycentric city the IUCm 1.0 creates and www.geosci-model-dev.net/12/525/2019/ Geosci. Model Dev., 12, 525–539, 2019
532                                    R. Cremades and P. S. Sommer: The Integrated Urban Complexity model (IUCm 1.0)

Figure 3. The moving average (50 model steps) of the marginal contribution to energy consumption for urban mobility when moving out
1000 inhabitants in each model step in the probabilistic model setting and its standard deviation do not visibly differ between city types. The
overall trends show the expected decreased returns of the transformation efforts along the model steps.

3.3   Urban growth in Frankfurt: optimizing the
      location of urban densities for a 2030 population
      forecast

Applying the probabilistic setting to urban growth in Frank-
furt, following the increase of 58 000 inhabitants projected
by the United Nations (2014) for the period 2015–2030,
provides an increase in densities in different parts of the
high-density cluster of the Frankfurt metropolitan area (see
Sect. 2.2.3 for details). The location of these increased den-
sities in the results is strongly determined by the constraints
introduced in the model, namely areas under risk of floods
with a return period of 100 years and green urban areas and
water bodies (see Sect. 2.2.4 for details). The impact on these
areas is visible in Movie S1 (Cremades and Sommer, 2018d;
see Supplement), where the result of an unconstrained model
run not taking into account these constraints is shown on the             Figure 4. Moving average (five model steps) of the average dis-
                                                                          tance between citizens along the model runs minimizing the energy
left side, and on the right side the result of a model run that
                                                                          consumption for urban mobility in Frankfurt.
takes into account these flood risks and other important urban
infrastructure is shown. These urban features can also allevi-
ate climate impacts related to the heat-island effect, like in
the case of urban green areas..                                              Comparing the smoothness of the lines in Figs. 4, 5 and 6
   The rapid increase in the value of the slope of the rank–size          with the energy display in Movie S1, the more irregular value
rule (Fig. 6) suggests the application of the IUCm 1.0 to ur-             shown in the video corresponds to the probabilistic setting
ban growth can have rapid and positive effects, by suggesting             picking the weights as explained in Sect. 2.2.6. Nonetheless,
where to improve the polycentricity of an urban settlement.               we can see that the video shows how, in both cases, the model
Figures 4 and 5 show milder impacts on the values of average              is able to find locations for increasing population density that
distance between citizens and spatial entropy, respectively.              produce a lower energy consumption for urban mobility per
                                                                          capita. The quantity reduction in energy for urban mobility
                                                                          per capita is roughly of 1 GJ per capita and per year in both

Geosci. Model Dev., 12, 525–539, 2019                                                          www.geosci-model-dev.net/12/525/2019/
R. Cremades and P. S. Sommer: The Integrated Urban Complexity model (IUCm 1.0) 533
Figure 7. Changes in energy consumption per capita along the
Figure 5. Moving average (five model steps) of the spatial entropy transformation of the urban form of Frankfurt. The probabilistic ap-
along the model runs minimizing the energy consumption for urban proach creates some steps that punctually increase the energy con-
mobility in Frankfurt. sumption; nevertheless it doubles the decrease in energy consump-
tion for transportation overall.
0.72, which shows that the homogeneity of the density of the
cells has been reduced. Finally, the slope of the rank–size rule
increased from 0.34 to 0.96, close to 1, which improves the
polycentric properties of the city. It also improves the order
of the rank–size relationship of the population density of all
city cells, creating rank-ordered fractal hierarchies without a
high degree of primacy.
In the application of urban transformation to the urban
form of Frankfurt the reduction goes beyond a remarkable
50 % using the probabilistic approach (Figs. 7 and 8); the
minima of the deterministic approach in Fig. 7 appear to be
related to non-convexities in the solution space of the opti-
mization process.
Nevertheless, the influence of climate-smart urban forms
Figure 6. Moving average (five model steps) of the slope of the goes beyond a 50 % reduction. Indeed, other policies to pull
rank–size rule along the model runs minimizing the energy con- (e.g. improvement of mass transportation systems) and push
sumption for urban mobility in Frankfurt. (congestion charges) a reduction in emissions from trans-
portation require supportive urban forms in order to succeed
(Combs and Rodríguez, 2014; Noordegraaf et al., 2014).
cases, with a final value of 17.7 GJ per capita and per year
for the constrained simulation. It is noteworthy that the con-
straints in the simulation do not limit the opportunities for 4 Discussion
energy reduction – they just drive a different solution, at least
for a relatively small increase of 58 000 inhabitants. The presented IUCm 1.0 drives the emergence of reinforced
density hierarchies and higher-density clusters within urban
3.4 Results of a hypothetical transformation of the planning. This new fractal order of hierarchies and connected
urban form of the Frankfurt metropolitan area clusters, which depart from the existing city, goes beyond
the sprawl vs. compact city debate. This suggests that neither
We first analyse the resulting values for average distance be- linear planning nor unique centre–periphery logic should be
tween citizens, spatial entropy and rank–size slope in the considered for making a city sustainable and that policy rec-
probabilistic model run of the Frankfurt example depicted in ommendations about urban forms are only conceivable when
Fig. 8. The model reduces the average distance between cit- modelling the city as a data-driven spatially explicit complex
izens from 12.01 to 6.54, which significantly decreases the system.
urban sprawl. The spatial entropy is reduced from 0.92 to
www.geosci-model-dev.net/12/525/2019/ Geosci. Model Dev., 12, 525–539, 2019534 R. Cremades and P. S. Sommer: The Integrated Urban Complexity model (IUCm 1.0) Figure 8. Evolution of the transformation of the urban form of Frankfurt using the probabilistic approach. The feasibility of the urban growth application suggested human settlements in both the developed and the developing above is especially high for fast-growing cities expanding world. Outstanding amongst these relocation examples are beyond their current centre, and also the idea of urban den- cases of entire towns relocating far away within a decadal sification for existing centres seems feasible, as it is not a timescale with a rationale unrelated to global public inter- new concept in the scientific literature (Jenks and Burgess, ests but to the mining industry, like Malmberget and part of 2000; Fregolent et al., 2017). After this experimental case, Kiruna in Sweden (Nilsson, 2010); Picher, Cardin and Hock- in a real application the consideration of the preferences of erville in the United States (Shriver and Kennedy, 2005); or the urban stakeholders and additional climate risks, like the Leigh Creek in Australia (Robertson and Blackwell, 2016). urban-heat-island effect, is a must. In a real application of The debate on relocation in relation to adaptation to cli- our model for urban growth, the cases so far discussed with mate change is significant in many world regions (the Arc- policymakers relate to (i) a large number of small areas with tic, Florida, Mozambique and the South Pacific, among other opportunities for development and densification spread in a places), and, although a negative view prevails at the national metropolitan area and (ii) an application to choose between a level, at the local level relocation has become an adapta- set of different planning alternatives. In these contexts, what tion and resilience tool for entire communities. Furthermore, is the meaning of step-by-step model results that provide pol- planned anticipatory relocations show higher signs of suc- icy recommendations for urban growth? In the second case cess than reactive relocations (Petz, 2015). In some cases, just mentioned, what matters would be the result in energy relocation is not only seen as a tool for adaptation, but also consumption computed by the step (Iia2) of the algorithm in as an opportunity (McNamara et al., 2018). Urban relocation Sect. 2.2.9. In the first case, which appears to be a topical sit- in relation to mitigation of emissions is not explicitly dis- uation in urban planning, the model would provide density cussed in the literature, but it is implicit in research pointing suggestions that would help policymakers to plan the city out that urban form can contribute to mitigation (see Seto et for an increased population figure; however, the precise or- al., 2014). Densification is also implicit in debates about how der of the stepwise results would matter much less for the much arable land could be kept by avoiding future increases policymakers than the suggested densities and their location in urban land (Bren d’Amour et al., 2017). To summarize, in space. the intra-urban relocation suggested by our application of ur- The feasibility of the type of transformation we suggest is ban transformation is feasible and can be an opportunity for seemingly low, at least in the short term; however it is sup- synergies between sustainable development goals (SDGs). ported by literature about the abandonment of human set- Within the multilevel nature of urban decision-making tlements (Schilling and Logan, 2008) and the relocation of framed for example by subnational regions, metropolitan ar- Geosci. Model Dev., 12, 525–539, 2019 www.geosci-model-dev.net/12/525/2019/
R. Cremades and P. S. Sommer: The Integrated Urban Complexity model (IUCm 1.0)                                                    535

eas, municipalities and districts (Betsill and Bulkeley, 2006;       tainable human settlement planning, and 11.b when dealing
Hooghe and Marks, 2003), our planning suggestions for                with integrated plans for resource efficiency, climate change
high-density clusters and connected lower-density urban ar-          and resilience to disasters (Nilsson et al., 2016).
eas provide an overall framework, which can be understood               Beyond its implications on SDG 11, we analyse climate-
as a system of boundary conditions for other types of plan-          smart urban forms in the light of the other SDGs to under-
ning decisions at a finer spatial resolution.                        stand the interactions with the diversity of goals of a sus-
   In any case, the suggested densities should be imple-             tainable city. Further direct implications appear on climate
mented with the least-energy-intensive strategy and prioritiz-       action (SDG 13), reduced energy consumption (SDG 7) and
ing citizen comfort. Both depend upon multiple interrelated          reduced air pollution (SDG 3). There is room for co-benefits
factors, other than density, that correspond to lower-scale de-      facilitated by urban form in several cases: more land avail-
cision levels that are beyond the scope of this study. These         able for ecosystem services (SDG 15) and food production
multiple factors include building expected lifetime, design,         (SDG 2); decreased impermeable land surfaces implying less
layout, height, shape, materials and type of surface cover, in-      water pollution from urban run-off (SDG 14); information
tegration with green and blue urban landscapes, and orienta-         and communication technologies (SDG 9) supporting the
tion and size of the houses, all of which have a significant im-     pull and push policies mentioned above (see Sect. 3), for ex-
pact both on the embodied and operational energy and on the          ample with real-time metering and charging per road use; and
personal preferences of inhabitants (Seto et al., 2014; Pan,         increased resource and infrastructure efficiency and higher
2014; Kennedy and Buys, 2010).                                       economic productivity (SDG 8), with the latter in relation to
   Concerning the personal preferences of inhabitants, to            denser social networks (Pentland, 2014). It has been shown
limit negative externalities of high density, the model in-          too that a lack of urban planning contributes to the worsening
cludes a limit of 15 000 inhabitants per square kilometre to         of climate impacts (Eliasson, 2000), which have differential
avoid densities that are expected to create discomfort for ur-       effects depending upon social status (USCGRP, 2014). So
ban inhabitants. Nevertheless, the local context or the pref-        improving planning would ameliorate inequality (SDG 10).
erences of the population with regard to living in areas of          No substantial implications from our results were found on
higher density, as suggested by the results of the model, are        poverty (SDG 1), education (SDG 4), gender (SDG 5), and
not considered in the context of the normative results of our        responsible consumption and production (SDG 12).
model. A possible avenue to consider these would be to dis-             In relation to existing institutions and partnerships (SDGs
cuss with local stakeholder the maximum density and the              16 and 17), we found significant challenges to transforming
above factors leading to citizen comfort and livability that         a city under current urban governance structures, which al-
could make a difference to the local population. The prefer-         low urban planning with short-term objectives that produce
ences of stakeholders can be captured by participatory geo-          unsustainable lock-ins (Nevens et al., 2013). Our innovative
graphic information system (GIS) techniques enabling them            advice requires innovative governance approaches, which are
to express where and how much the increase in densities              necessary to achieve successful transformations in other sus-
should be limited. The underlying reasons of the prospective         tainability domains (Loorbach, 2016). Rather than requesting
limitations are specific to every city and its idiosyncrasies: its   that our normative results for Frankfurt be implemented, we
cultural heritage areas; its history; and other multiple social,     provide a new window of opportunity for urban sustainabil-
economic and environmental features could be sources of              ity, in which we put Frankfurt forward as an example for the
preferences for limitations in density and landscape change.         potential of such transformation, namely halving the energy
                                                                     consumption for urban mobility per capita. Our results push
4.1   Implications for the sustainable development goals             forward current urban debates by challenging the ordinary
      (SDGs) of the Agenda 2030                                      way of thinking about cities; the actual sustainability poten-
                                                                     tial of their existing institutions; the magnitude of their policy
The IUCm 1.0 adds information on the spatial distribution of         gaps; and the mindset of urban decision makers, practitioners
the population about how to reduce the energy consumption            and other stakeholders and policy partners.
and therefore emissions of urban mobility. This delineates
climate-smart urban forms on the one hand using real-world           4.2   Outlook
evidence that connects urban land use with energy, thus mit-
igating GHG emissions, and on the other hand constraining            In financial terms, the usual Keynesian governmental invest-
the evolution of the city with spatially explicit information        ments on carbon-intensive road infrastructure could be redi-
about unmanageable climate-related risks – e.g. floods or            rected here. Indeed, the potential micro- and macroeconomic
sea-level rise – like it is assumed in Frankfurt, and in that        positive effects should be investigated in the future and com-
way adapting the city to climate change. Climate-smart ur-           pared with other types of Keynesian investments. A valuable
ban forms provide policy guidance for the achievement of             experiment would be a combination of the IUCm results with
the SDG 11 (sustainable cities and communities), specifi-            a cost–benefit analysis. This could then inform policymak-
cally its targets 11.3 when dealing with integrated and sus-         ers where the suggested transformations of the IUCm should

www.geosci-model-dev.net/12/525/2019/                                                     Geosci. Model Dev., 12, 525–539, 2019
536 R. Cremades and P. S. Sommer: The Integrated Urban Complexity model (IUCm 1.0) first take place. Additionally, from a scientific point of view, infrastructures, transportation and street networks to improve it would highlight the factors controlling the difference be- how the model accounts for accessibility, to extend the cur- tween a cost–benefit analysis and a model guided by a goal of rently used information about population density with data resource efficiency. In order to provide this analysis, many of of points of interest and of the location of jobs to proxy land the environmental externalities and multiple factors detailed use mixes and to study the interaction of these factors with above in relation to the preferences of citizens would how- energy consumption as derived from network transit models. ever need to be quantified and their interactions understood, Concerning the three-dimensional properties of urban struc- in order to provide a full account of the benefits. tures, a most realistic depiction of the urban-heat-island ef- Carbon-neutral and near-zero carbon building strategies fect would require coupling with a low-spatial-resolution ur- show how savings in operational energy can offset embod- ban climate model able to analyse scenarios including three- ied carbon in 50 years (Pan, 2014; Zuo et al., 2013), which dimensional features and building covers; hence we plan a together with further effects of density on decreased energy three-dimensional representation of cities to model land use use for domestic heating (Liu and Sweeney, 2012) suggests and building covers and analyse the heat-island effect to- that the overall impact of the transformation could trigger gether with a climate model, which would allow us to sug- further reductions in energy consumption. However a spe- gest ventilation corridors and the use of vegetation in urban cific analysis using life-cycle techniques, taking into account surfaces to reduce maximum temperatures and deal with ad- the multiple factors mentioned above, would be necessary to ditional climate risks like the urban-heat-island effect. These understand how to improve the potential for minimizing en- model developments are planned to integrate adaptation and ergy consumption at lower scales. mitigation at lower scales (Li et al., 2016; Koch et al., 2012). We assume that the statistical relationship between urban Despite the limitations identified, the methodology that form and energy consumption for urban mobility holds for we present goes beyond current exercises on global change the future as well, and, to a degree, a change in this re- in urban areas, like the spatially explicit population scenar- lationship could be captured by the probabilistic set-up we ios launched consistently with the Shared Socioeconomic are using. Because of this assumption, our results should be Pathways (Jones and O’Neill, 2016). So far these scenarios discussed also from the perspective of a possible future sce- only consider the concentration of population versus sprawl nario of successful emissions reduction driven by automated and leave out crucial considerations of polycentrism, fractals shared vehicles, either powered by an energy mix combin- and complexity in urban forms when providing information ing different sources and including fossil fuels or powered about sustainability. Besides, combining both adaptation to by 100 % renewable energy. Currently electricity is supplied and mitigation of climate change in urban plans and policies by an energy mix combining different sources that includes effectively in a qualitative way (without a quantitative spa- fossil fuels, so in the case of a 100 % renewables our plan- tially explicit model) has proved to be a challenge leading ning suggestions would still provide useful advice to further to conflicting, rather than co-beneficial, outcomes (Hamin reclaim space from private mobility, making that space free and Gurran, 2009). Summarizing, our planning advice is for citizens’ use (Karsten and van Vliet, 2006), whilst reduc- based on significant statistical measures relating the urban ing other environmental impacts related to the production of form to the energy consumption for urban mobility and sug- renewable energy (Leung and Yang, 2012). Such future sce- gests the most efficient way of making urban forms not only narios can be conceptualized with smart fees based on the more dense, but also less homogeneous and more fractal-like, time spent on the road (Raccuja, 2017). whilst constrained by climate-change-related risks. This approach has limitations due to the low availability of data and econometric evidence for driving the IUCm 1.0 out- side Europe, both on mitigation and on adaptation to climate 5 Conclusions change (UITP, 2015). Further global evidence should be pro- duced that incorporates either the location of urban services Whilst it is widely accepted that a lack of urban planning in- or land use types. Once this evidence is created the model creases congestion and pollution, urban planners aiming to could be available for a practical application in other world transform cities and decrease greenhouse gas emissions re- regions. quire spatially explicit policy recommendations for decreas- Research should follow to improve the detail of the model ing urban energy for urban mobility. and of the evidence driving it, mostly studying further de- Delivering climate-smart guidance on urban land use plan- tails of infrastructure, accessibility measures and transport ning is a major step towards urban sustainability and will sig- systems, land use types and diversity of activities in land nificantly help the efforts of cities to combat climate change. use mixes, and the three-dimensional properties of cities. As Our unique results show how to put into operation complex- mentioned above we plan to include further details of ur- ity and intra-urban polycentrism for the design of climate- ban transportation networks and infrastructures by applying smart urban forms that question the simplicity of the sprawl a network-based model to urban transportation in urban set- vs. compact city debate. In this regard, the reinforced frac- tlements; a deeper layer of information is planned to include tal order within climate risk constraints, the multiplicity of Geosci. Model Dev., 12, 525–539, 2019 www.geosci-model-dev.net/12/525/2019/
R. Cremades and P. S. Sommer: The Integrated Urban Complexity model (IUCm 1.0)                                                         537

clusters and the existing lower-density spaces in between are         References
emergent features that go beyond that debate.
   Our approach presents a new tool for improved urban plan-
ning and is crucial to the development of mitigation strategies       Batty, M.: Spatial entropy, Geogr. Anal., 6, 1–31, 1974.
                                                                      Batty, M.: Cities and complexity: Understanding cities with cellular
for cities, as required by the New Urban Agenda adopted
                                                                         automata, agent-based models, and fractals, MIT press, Boston,
after the United Nations Conference on Housing and Sus-                  2007.
tainable Urban Development (Moreno et al., 2016). Climate-            Betsill, M. M. and Bulkeley, H.: Cities and the Multilevel Gover-
smart urban forms are essential if cities are to achieve                 nance of Global Climate Change, Glob. Gov., 12, 141–159, 2006.
the 11th sustainable development goal, related to “Sustain-           Bren d’Amour, C., Reitsma, F., Baiocchi, G., Barthel, S., Guneralp,
able Cities and Communities” (SDG 11). Further research                  B., Erb, K. H., Haberl, H., Creutzig, F., and and Seto, K. C.: Fu-
should incorporate more climate-related risks, an improved               ture urban land expansion and implications for global croplands,
urban depiction (including three-dimensional structures), ur-            P. Natl. Acad. Sci. USA, 114, 8939–8944, 2017.
ban services, and the urban planning nexus of climate change          Chen, Y.: The mathematical relationship between Zipf’s law and the
and inequality.                                                          hierarchical scaling law, Physica A, 391, 3285–3299, 2012.
                                                                      Chen, Y. and Zhou, Y.: The rank-size rule and fractal hierarchies
                                                                         of cities: mathematical models and empirical analyses, Environ.
                                                                         Plann. B, 30, 799–818, 2003.
Code availability. IUCm 1.0 is an open-source software, and
                                                                      Clarke, K. C., Hoppen, S., and Gaydos, L.: A self-modifying cellu-
the code and complete documentation are available at https://
                                                                         lar automaton model of historical urbanization in the San Fran-
github.com/Chilipp/iucm (last access: 16 January 2019) and at
                                                                         cisco Bay area, Environ. Plann. B, 24, 247–261, 1997.
https://doi.org/10.5281/zenodo.1982565 (Sommer and Cremades,
                                                                      Combs, T. S. and Rodríguez, D. A.: Joint impacts of Bus Rapid
2018). The model is written in Python mainly using the numerical
                                                                         Transit and urban form on vehicle ownership: New evidence
Python libraries numpy and scipy (Jones et al., 2001), statsmod-
                                                                         from a quasi-longitudinal analysis in Bogotá, Colombia, Trans-
els (Seabold and Perktold, 2010), and matplotlib (Hunter, 2007)
                                                                         port. Res. A-Pol., 69, 272–285, 2014.
and psyplot (Sommer, 2017) for the visualization. Detailed instal-
                                                                      Cremades, R.: Climate Services for the Water-Energy-Land
lation instructions can be found in the user manual: https://iucm.
                                                                         Nexus (CLISWELN), available at: http://www.jpi-climate.eu/
readthedocs.io (last access: 16 January 2019).
                                                                         nl/25223443-CLISWELN.html (last access: 16 January 2019),
                                                                         2017.
                                                                      Cremades, R. and Sommer, P. S.: Movie S2. Evolution of the trans-
Supplement. The supplement related to this article is available          formation of the idealized example of a polycentric city, with
online at: https://doi.org/10.5194/gmd-12-525-2019-supplement.           a probabilistic model setting, showing its transformation until
                                                                         1M inhabitants would be moved, in steps of 1,000 inhabitants,
                                                                         https://doi.org/10.5446/35430, 2018a.
Author contributions. RC conceived the research, RC and PSS con-      Cremades, R. and Sommer, P. S.: Movie S3. Evolution of the trans-
ducted the research, and RC and PSS wrote the manuscript.                formation of the idealized example of a monocentric city, with
                                                                         a probabilistic model setting, showing its transformation until
                                                                         1M inhabitants would be moved, in steps of 1,000 inhabitants,
Competing interests. The authors declare that they have no conflict      https://doi.org/10.5446/35431, 2018b.
of interest.                                                          Cremades, R. and Sommer, P. S.: Movie S4. Evolution of the trans-
                                                                         formation of the idealized example of a high-density city, with
                                                                         a probabilistic model setting, showing its transformation until
Acknowledgements. The authors wish to express their gratitude            1M inhabitants would be moved, in steps of 1,000 inhabitants,
to Youba Sokona, Hermann Held, Diego Rybski, Jürgen P. Kropp,            https://doi.org/10.5446/35432, 2018c.
Wolfgang Lucht and Andreas Haensler for their helpful comments.       Cremades, R. and Sommer, P. S.: Movie S1. Evolution of the ap-
The authors thank Florent Le Néchet for providing further infor-         plication of growth to Frankfurt, with a probabilistic model set-
mation and statistical details about his publications. The authors       ting, showing how it would growth 58,000 inhabitants, in steps
also thank Walter Sauf and Lars Buntemeyer for their support in          of 1,000 inhabitants, https://doi.org/10.5446/35429, 2018d.
using the facilities of the German Climate Computation Center         EEA (European Environment Agency): European Urban At-
(DKRZ). Philipp S. Sommer gratefully acknowledges funding                las, available at: https://www.eea.europa.eu/data-and-maps/
from the Swiss National Science Foundation (SNF), namely                 data/copernicus-land-monitoring-service-urban-atlas (last ac-
the ACACIA grant (CR10I2_146314) and the HORNET grant                    cess: 16 January 2019), 2017.
(200021_169598). Roger Cremades gratefully acknowledges               Eliasson, I.: The use of climate knowledge in urban planning, Land-
support from the Earth-Doc programme of the Earth League. The            scape Urban Plan., 48, 31–44, 2000.
authors thank five anonymous reviewers who substantially helped       Ewing, R. H.: Characteristics, causes, and effects of sprawl: A liter-
to improve the manuscript.                                               ature review, Urban Ecol., 21, 1–15, 2008.
                                                                      Ewing, R. and Cervero, R.: Travel and the built environment: a
Edited by: Christoph Müller                                              meta-analysis, J. Am. Plann. Assoc., 76, 265–294, 2010.
Reviewed by: Simon Nieland and one anonymous referee                  Flyvbjerg, F.: Five Misunderstandings About Case-Study Research,
                                                                         Qual. Inq., 12, 219–245, 2006.

www.geosci-model-dev.net/12/525/2019/                                                        Geosci. Model Dev., 12, 525–539, 2019
You can also read