Latest Technology Developments in Consumer Electronics and Their Impacts on Household Energy Use and the Design of Policies and Programmes in ...
←
→
Page content transcription
If your browser does not render page correctly, please read the page content below
Latest Technology Developments
in Consumer Electronics and Their
Impacts on Household Energy Use
and the Design of Policies and
Programmes in Developing Countries

Xianli Zhu
Technical University of Denmark

                                  JANUARY 2021
Copenhagen Centre on Energy Efficiency
UNEP DTU Partnership
UN-City Copenhagen
Abstract
Marmorvej 51, 2100 Copenhagen Ø,
Denmark
https://c2e2.unepdtu.org/
https://unepdtu.org/
Twitter: @UNEPDTU
ISBN: 978-87-93458-94-9
Suggested citation:
Zhu, X., 2021. "Latest Technology Technology developments reflect changes in market
Developments in Consumer Electronics demand and can further influence the energy use
and Their Impacts on Household Energy
of domestic appliances. This report examines the
Use and the Design of Policies and
Programmes in Developing Countries".
major development trends in household appliances
Report of the Copenhagen Centre on for entertainment purposes, also known as consumer
Energy Efficiency, UNEP DTU Partnership. electronics, and their impacts on the energy use of
Published in January 2021 in Copenhagen. these appliances. It analyses the design and imple
ISBN: 978-87-93458-94-9.
mentation of policies and programmes to influence
Design and layout
consumers’ purchase choices and everyday appli
Kowsky / nicoline@kowsky.dk ance use for energy efficiency and conservation.
Ultimately, the paper further aligns policy and pro
Language editing gramme design and implementation with the cir
Michael Logan
cumstances in developing countries and emerging
Front cover economies at different stages of appliance penetra
Photo courtesy of Colourbox. tion and energy efficiency regulation.
Media technology illustration with mobile
phone and icons, Sergey Nivens.
Acknowledgement
This paper was presented at the 10th
International Conference on Energy
Efficiency in Domestic Appliances and
Lighting (EEDAL’19) held during 6-8
November 2019 in Jinan, China. The
author would like to thank the EEDAL’19
organisers for the review comments and
the feedbacks during the conference.
Disclaimer
The findings, opinions, interpretations and
conclusions expressed in this report are
entirely those of the author and should
not be attributed in any manner to the
UNEP DTU Partnership and the Technical
University of Denmark.
21. Introduction
Consumer electronics are electronic products for It changed the business landscape in many sectors.
entertainment purposes, including TV sets, radios, Globally, IT companies such as Facebook, Netflix,
video players, personal computers (PCs), gadgets Apple, Google and Microsoft rapidly overtook tra
like iPads and tablets, and mobile phones. Compared ditional manufacturing enterprises and became the
with other household appliances, the technology for most valuable enterprises on earth. E-commerce has
consumer electronics has developed much faster in not only created such giants as Amazon, eBay and
the past three decades, especially in smart equip Alibaba, but has also transformed many segments of
ment, digitalization, and Internet access. the service sector, from travel and restaurant book
ings to publishing, advertising, retail and financial
Consumers account for most Internet traffic. Accor payments. Global e-commerce reached USD 3 tril
ding to a CISCO report, in 2017 global IP traffic is 122 lion in 2017 in volume and is expected to double by
petabyte (PB) per month, of which 100 PB was used 2022 (Bansal et al., 2018). Smart use of online and
by consumers, while the rest was used by businesses. social media tools was quoted as a main reason for
In the coming years, Internet video will see the fastest Barack Obama winning the US presidential elections
growth in data consumption (CISCO, 2019). in 2008 (Michaelsen, 2015).
Rapid technological progress has brought about The increasing ownership and use of consumer elec
enormous changes to people’s entertainment activi tronics causes dramatic social changes and brings
ties at home over the last three decades. TV sets have about energy and environmental impacts. Globally,
become thinner, with larger screens, better picture on average, people with Internet access spend sev
and audio quality. They are also becoming smart. eral hours every day surfing the Internet for informa
People can select and change the packages and chan tion, news, and entertainment, visiting and updating
nels for their subscription and record their favourite their social accounts, checking their emails, watching
programmes and watch them when they have time. videos, listening to music and playing games.
They can also access the Internet to see films, vid
eos and pictures on their TV, or even to listen to the People can put their personal opinions and views on
radio on their TVs. Moreover, ever-faster web speed, the Internet and tend to search and associate with
decreasing prices of Internet access and the availabil others of similar opinions. There is a lack of incen
ity of mobile data and Wi-Fi enables people to access tives and requirements for people to clean up the
the sea of information, video and audio online at any mass of information they put online. People’s online
time and from anywhere. The era of touch-screen activities leave a large amount of information waste
mobile phones, tablets, and even laptops, makes online, which is stored in servers and clouds. Storing
consumer electronics ever more user-friendly. The the information and making it accessible all the time
rise of social media is making people move their consumes electricity and causes energy waste.
social life online.
Despite efficiency improvements from technol
The Internet connects people worldwide, and its ogy progress, information and data storage on the
enormous influence is manifested in many aspects. Internet and Internet use is causing increases in elec
1. Introduction 3tricity consumption, not only in consumers’ homes Governments have many policy options to maximize
but in the global Internet infrastructure, as well as the benefits from ICT technology progress and curtail
the data centres that help store and process the data. the negative impacts, including tapping the poten
Globally, the information and communication tech tial of using ICT technology to reduce energy waste
nology (ICT) sector contributes to around 5 per cent and resource waste, tackling the issues of Internet
of global electricity consumption. The further spread security, and setting minimum energy performance
ing of Internet use in developing countries means standards for consumer electronics, Internet infra
global energy use and related carbon emissions will structure and data centres. They can also require
continue growing in the absence of effective policy producers to offer disposal solutions and obligations
interventions. so that that e-waste treatment can be addressed from
the source. Moreover, they can deal with the problem
Another significant impact of booming consumer from the end-user side, raise public awareness about
electronics ownership and use is the increases in the energy use and environmental impacts of the
electronic waste (see Table 1). Due to rapid techno Internet, encourage the reduction of junk data and
logical progress and continuous price decrease, many information storage and sharing in the cloud, and
mobile phones, computers, DVD players and TV sets promote the repair, maintenance and longer use of
are dumped before the end of their useful life. For consumer electronics.
example, many people replace their mobile phones
within two years. Globally, in 2016, 46.6 million met
ric tonnes of electronic waste was generated (Baldé
et al., 2017). E-waste contains many hazardous ele
ments, including mercury, copper, other heavy met
als, rare earth, plastics and glass. How to recycle and
treat e-waste is a global challenge.
Table 1. Global ICT penetration, 2018
Mobile phone Individuals using Fixed telephone Active Fixed-broadband
subscriptions the Internet subscriptions mobile-broad- subscriptions
band subscrip-
tions
Per 100 inhabitants 107 51.2 12.4 69.3 12.4
Source: ITU World Telecommunications/ICT Indicators database
1. Introduction 42. Progress in consumer
electronics in the
information age
Since the 1990s, personal computers (PCs) – includ Behind this lifestyle change is the rapid progress
ing desktops and laptops – are becoming faster and and breakthroughs in ICT technologies, in terms
more powerful in data storage, processing, retrieval of thinner and bigger devices, touch screens, rapid
and transmission. Meanwhile simple versions for increases in the operating speed and storage capac
Internet access, which can be used for browsing the ity of consumer electronics, high speed and uni
Internet, are spreading quickly. The most import versal access to the Internet via mobile data, Wi-Fi,
ant drivers behind the recent changes in consumer inter-device Internet access sharing, cable fibre, as
electronics include display technologies, informa well as ever-decreasing prices for both consumer
tion technologies and communication technologies. electronics and Internet access.
Reading devices like the Amazon Kindle are also con
Table 2. Evolution of global Internet traffic
sumer electronics and can have Internet access.
Year Global Internet Traffic
2.1 P
rogress in consumer electronics 1992 100 GB per day
technologies 1997 100 GB per hour
2002 100 GB per second
The differences in functions between phones, com 2007 2,000 GB per second
puters and televisions are vanishing – people used
2017 46,600 GB per second
to send photos and documents through their com
2022 150,700 GB per second
puters; nowadays they can watch their photos and
Source: Cisco, 2019.
videos on their TVs and computers and browse the
Internet on their phones, smart TVs and tablets.
Smartphones are phones that have touch screens
The amount of data circulating the Internet has been and can access the Internet. The rise of the smart
growing by almost a thousand times every decade phone in consumer electronics started in 2007 when
since the early 1990s (see Table 2). The ICT sector’s Apple released its first generation of iPhone and sold
electricity use for hosting, transferring and process 1.39 million units during the year (Statista, 2019). The
ing data already accounts for more than 2 per cent vast popularity of the smartphones attracted other
of global electricity use (IEA, 2017). As most phones producers into the market, and smartphone sales
and computers have an average use life of around quickly picked up. In 2009, worldwide sales of smart
three years, the massive quantity of electronic waste phones reached 173 million (Statista, 2019a). Since
produced every year also means increasing envi then, the annual sales of smartphones have grown
ronmental impacts. Therefore, reducing the time, exponentially. In 2018, there were around 1.56 billion
resources, and electricity consumption due to peo smartphones sold worldwide; that means approxi
ple’s use of consumer electronics for entertainment mately 20 per cent of the world population got a new
purposes is of great importance to the achievement smartphone that year (Statista, 2019a).
of the sustainable development goals for sustainable
and clean energy, environmental protection and cli Today’s smartphones can meet people’s entertain
mate change mitigation. ment needs: calling other people, taking pictures and
2. P
rogress in consumer electronics in the information age 5Table 3. Changing trends of consumer electronics ownership among households in the UK
Type of device 2008 2018 Type of device 2008 2018
Digital TV 84% 95% DAB radio 27% 64%
Smartphone 17% 78% Smart TV (2012) 5% 42%
DVD player 83% 64% Desktop PC 69% 28%
Laptop (2009) 44% 63% MP3 player 44% 27%
Tablet (2011) 2% 58% Smart speaker no data 13%
Digital video recorder 20% 56% VR headset no data 5%
(DVR)
Game console 46% 44%
Source: OfCom, 2018b
videos, reading news and books, searching for infor 2018b), see Table 3. Smartphone ownership growth
mation, sharing content, downloading and watching saw the biggest increase, followed by tablets, smart
videos, listening to music. A smartphone can func TVs and DAB radio. At the same time, the ownerships
tion as a pocket camera and recording machine. of some traditional consumer electronics – like DVD
They have many other functions and replace a long players, game consoles, desktop PCs and MP3 play
list of different things, including timers and alarms, ers – declined in the decade from 2008 to 2018.
landline phones and telephone boxes, photo albums,
calendars, phonebooks, timepieces, calculators, One example is the development of the built-in digi
torches, compasses, maps, GPS devices, notepads, tal cameras of smart mobile phones. As smartphones
mirrors and music players. They can also function as are small and carried around most of the time, the
a newspaper, a small TV, a handheld games console built-in digital camera and ubiquitous Internet access
and a small laptop. Moreover, mobile phones can be enables consumers to take photos, record videos and
used to make payments, replacing the functions of share them with others. The first mobile phone with a
credit cards and wallets. built-in digital camera was sold in 2000 in Japan and
Korea. Since then, the digital camera has undergone
ICT technology progress also ushered in the era of tremendous development.
e-commerce. People’s online time is not only for
entertainment, but also for shopping, education, Globally, digital camera sales by main producers
information and social connections. With net bank peaked in 2010, at 121.4 million. They fell 84 per cent
ing and mobile pay, people can pay bills and order to 12.4 million in 2018 (CIPA, 2019)1.
almost everything online. Businesses are also going
online for advertising, marketing, sales, and services. Apple and Samsung are leading companies in smart
phone technology progress. The evolution of iPhones
HDTVs, PCs, mobile phones and tablets can be used is a good indicator of smartphone technology pro
for both work and entertainment. For example, in gresses. Since it released iPhone 1 in June 2007, Apple
many workplaces, HDTVs are used for video con has launched a new generation of iPhone each year.
ferences and as projectors. The PC is more a tool for The iPhone 1 had a storage capacity of 4 GB, a cam
work, while HDTVs, mobile phones and tablets are era of 2.0 megapixels (MP), and a memory of 128 MB.
mainly for individual uses and entertainment. The iPhone XS released in 2018 is equipped with 64
GB storage, 12 MB + 12 MP dual camera, up to 512
The last decade witnessed a big change in household GB internal memory and storage capacity. In 11
consumer electronics toward smart and digital elec years, smartphones had experienced many technol
tronics. A report by OfCom in 2018 offered a clear
illustration of the increased penetration of consumer 1
CIPA (Camera & Image Product Association) is an international indus
products among households in the UK (OfCom, try association. Its members include such main camera producers as
Olympus, Casio, Canon, Kodak, Sony and Nikon.
2. P
rogress in consumer electronics in the information age 6ogy breakthroughs, including touch screens, faster time of computational capacity and memory for per
and more powerful data processing, and many new sonal computers was 1.5 years between 1975 to 2009
functions. (Roser & Ritchie, 2019).
By the end of 2018, 1.5 billion iPhones had been sold, Another indicator is the constant decrease in the
making Apple one of the most valuable companies in price of consumer electronics and other ICT prod
the world and iPhones one of the most used smart ucts. From 1997 to 2017, the price index of TV
phones in the world (Statista, 2019). sets declined by 96 per cent in the US, that of soft
ware declined by 67 per cent. The price of new cars
2.2 Progress in communication remained roughly the same over the same period
technologies (Roser & Ritchie, 2019).
Another group of technologies behind consumer ICT technology progress and the quick decrease in
electronics’ wide application is progress in telecom prices, as well as ICT companies offering free cloud
munications technology. Since 1G in the 1980s, tele storage for consumers in exchange of their attention,
communication technologies have passed 2G, 3G, mean that people are only a few clicks away from the
and 4G. 5G is being rolled out. The progress enabled ocean of free and downloadable documents, books,
faster and more convenient data exchange. A com audio and videos. As a result, most people accumu
parison of the different generation of communication late a large number of documents on their comput
technologies is provided in Table 4. ers; share documents, pictures, videos and audios
through emails and social accounts; and rarely take
Moore’s Law is the observation that the number of time to delete or clean up the huge amount of infor
transistors on integrated circuits doubles approxi mation they harnessed. As a result, the data in mobile
mately every two years. It describes the exponential phones, gadgets, personal computers, servers and
technological progress and computational power in data centres keep growing. The exponential expan
terms of operations that can be performed per sec sion of knowledge and information provides many
ond by computers. The power and speed of comput options and new sources of information.
ers have been increasing exponentially; the doubling
Table 4. The main differences between 1G to 5G telecommunication technologies
Generation 1G 2G 3G 4G 5G
Approximate 1980s 1990s 2000s 2010s 2020s
deployment date
Primary service Analogue phone Digital phone Phone calls, All IP services Dynamic information
calls calls and mes- messaging, data (including voice, access, wearable
saging messaging) devices with AI capa-
bilities
Key differentiator Mobility Secure, mass Better Internet Faster broadband SSimultaneous
adoption experience Internet and low, access to different
lower latency wireless technologies
– complete wireless
communication
Weakness Poor spectral Limited data Real perfor- Due to speeds, High-band spectrum
(addressed by efficiency, major rates – diffi- mance failed to bandwidth, and may lead to some
subsequent security issues cult to support match the hype, latency constraints, reliability issue
generation) demand for failure of WAP capacity unable
Internet/email for Internet to accommodate
access "Internet of things"
Theoretical 2kbit/s 384kbit/s 56Mbit/s 1Gbit/s 10Gbit/s
download speed
Latency N/A 629ms 212ms 60-98ms3. R
ocketing Internet use via
consumer electronics and the
trends in developing countries
The price of smart mobile phones are steadily declin mobile phones. The second most popular Internet
ing due to lower costs of production and manufactur activity among mobile users was checking emails
ing, while the capabilities of mobile phones increase. while using social media came third (Statista, 2019b).
Other factors contributing to the dramatic increase of The same survey found that daily social media usage
people’s time online includes continuously cheaper in 2018 amounted to 136 minutes per day, up from
and faster and widely available Internet access, 135 the previous year (Statista, 2019b). The global
through Wi-Fi and LANs, and mobile data packages. penetration rate of social media is 37 per cent and
Often such access is based on subscription, making the most popular social media platforms include
the marginal cost of Internet use close to zero. Facebook, WeChat, Twitter, Instagram, Tumblr and
Sina Weibo. Around 70 per cent of social media time
3.1 What people do with their time online is spent on smartphones (Statista, 2019b).
Consumer electronics are changing people’s life Data about the time people spend on the Internet
styles. Users spend nearly 70 per cent of their media are based on household and individual surveys.
time on smartphones on average (Statista, 2019b). Different sources may provide different data. For
People spend hours every day on their phones to example, Kanter IMRB, based on random sampling
check and update their social media account, read and face-to-face interviews of more than 80,000 rural
news, search for information, play games and watch and urban households, estimated that on average
videos. Among the global Internet traffic, in 2018, Internet users in India spend 77 to 78 minutes per
51% of the global Internet traffic is from smart day online (Bhattacharjee & Pansari, 2019). This is
phones, TVs, tablets, and PCs (Cisco, 2020), meaning less than the World Web Index’s estimate, which is
that more than half of global energy use by the ICT that in India Internet users on average spend 2 hours
sector can also be attributed to the use of consumer 32 minutes on social media (see Table 5) (Global
electronics. WebIndex, 2019).
Watching movies/videos online is the most popu According to the Global WebIndex survey conducted
lar mobile Internet activity. In 2018, 52.2 per cent of in the 2nd and 3rd quarters of 2018, the average dura
all website traffic worldwide was generated through tion of both time online and time on social media,
Table 5. Social media time spent by Internet users among main regions
Region Europe North South Africa and Asia and the Global
America America the Middle Pacific average
East
Average daily time 1:53 2:06 3:29 3:19 2:16 2:22
spending on social
media (in hour: minutes)
Source: Global WebIndex, 2019
3. Rocketing Internet use via consumer electronics and the trends in developing countries 8Table 6. Average daily time spending on social media by Internet users
Year 2012 2013 2014 2015 2016 2017 2018
Duration (hour:min) 1:30 01:35 01:41 01:49 02:06 02:15 02:22
Source: Global WebIndex, 2019
Table 7. Duration of daily time spent on social media by Internet users of different age groups
Age groups (years) 16-24 25-34 35-44 45-54 66-64
Duration (hour:min.) 03:01 02:37 02:04 01:39 01:13
Source: Global WebIndex, 2019
for users aged between 16 and 64 years old, is much week, or 3 hours 42 minutes per day online (see Table
higher in developing countries than in the developed 7) (Center for the Digital Future, 2017).
world.
Even after excluding the online time at work, the
The series of Internet user surveys conducted by the average American spends 2 hours 31 minutes a day
Global Webindex on Internet users indicate that the online at home. This was more than double the
time an average Internet user spends on social media 9.4 hours reported in 2000, when Internet use was
has been continually increasing during the past few already widespread in the US. Moreover, 82 per cent
years, from 1 hour 30 minutes per day in 2012 to 2 of users go online on a mobile phone (see Table 8).
hours 22 minutes in 2018, an increase of 36 per cent
Table 8. Internet use among Americans of 12 years
(See Table 6).
old or above, 2016
Apart from surfing the Internet for information, news, Indicator Quantity
entertainment and social connections, people also Percentage of American Internet users 92%
use their Internet for work and education. Online Average hours per week online 23.6
payment and e-commerce mean people can order Average hours per week online at 17.6
home
food, buy and sell various things, or attend courses
online. Internet users who go online on a 82%
mobile phone
Hours online at work (weekly) 14.3
In 2018, 52.2 per cent of all website traffic worldwide
Hours actively using the Internet at 10.1
was generated through mobile phones; in 2009, the work (weekly)
share was only 0.7 per cent (Statista, 2019c). Britons
Source: Center for the Digital Future, 2017
are now so addicted to their phones that they check
them every 12 minutes. The report, “A decade of
Digital Dependency”, says that 40 per cent of adults 3.2 Future trends
look at their phone within five minutes of waking up,
rising to 65 per cent of those aged under 35 (OfCom, The sea of information and applications online is
2018a). increasing every day, and will continue. As indicated
in Table 9, Cisco projected that Internet users would
15 years of annual surveys on Internet use in the increase from 3.4 billion to 4.6 billion during the five
United States indicated that in 2016 the average dura years from 2017, and the number of devices and con
tion of Internet use among Americans of 12 years nections, and broadband speed, will experience even
old and above reached a new high of 23.6 hours per faster growth. Moreover, people will spend a higher
proportion of their online time watching videos.
3. Rocketing Internet use via consumer electronics and the trends in developing countries 9Table 9. Future trends of global Internet growth
2017 2022
Internet users 3.4 billion 4.6 billion
Devices and connections 18 billion 28.5 billion
Broadband speed 39.0 Mbps 75.4 Mbps
Video viewing 75% of traffic 82% of traffic
Source: Cisco, 2018
Table 10. Global IP traffic by devices, 2017-2022
2017 2022
Smartphones 18% 44%
TVs 32% 24%
PCs 41% 19%
M2M (Machine to machine) 3% 6%
Tablets 5% 6%
Non-smartphones 0.1% 0.1%
Other 0.01% 0.02%
Source: CISCO, 2018
As indicated in Table 10, in 2017 people mainly
accessed the Internet via PCs, TVs, smartphones,
and tablets. By 2022, the smartphone will become the
most important Internet access device, followed by
TVs and PCs. At the same time, with the spreading of
the Internet of Things, the share of M2M (machine-
to-machine) data traffic will double, reaching 6 per
cent of total Internet traffic.
3. Rocketing Internet use via consumer electronics and the trends in developing countries 104. The energy and environmental
impacts of consumer electronics
use and policy recommendations
for developing countries
Apart from entertainment, consumer electronics can the company of their family and friends, or do sports.
be used for many other functions, including learning, Based on a systematic review of reviews, Stiglic and
communication, home offices and business. There is Viner (2019) found that higher levels of screen time
no doubt about the huge benefits they bring, yet they are associated with a variety of health harms for chil
can also cause negative impacts and even dangers. It dren and young people, with evidence strongest for
is necessary to use government policies to help peo adiposity, unhealthy diet, depressive symptoms and
ple benefit from the penetration and usage of con quality of life. Zhao et al. (2018) studied a sample of
sumer electronics and control the negative impacts. over 20,000 preschool children in Shanghai and found
the existence of excessive screen time during early
4.1 T
he positive and negative social childhood exists in Shanghai preschool children.
impacts of consumer electronics Their study indicates that excessive screen exposure
was associated with poor psychosocial well-being in
The social impacts of consumer electronics include preschool children via a number of mediators, mostly
helping people to access knowledge and information by reducing parent-child interaction.
and enable people to collaborate across the globe.
For instance, it enables remote learning and meet Ofcom’s survey indicated that the Britons are so
ings and the rapid sharing of ideas, enhances the suc addicted to their smartphones that they check it them
cess rate of new products, shortens time-to-market, every 12 minutes; young people between 15 and 24
ensures compliance and minimizes costs. Therefore, years old check their phones every 8.6 minutes, more
access to consumer electronics and the Internet can frequently than any other age group (OfCom, 2018).
help narrow social gaps and reduce poverty. OfCom’s report illustrated the far-reaching influences
of the era of digitalization and consumer electronics
First, it is necessary to control screen time among usage on people’s lives (Hymas, 2018).
young people and children. The processing capacity
of the conscious mind is estimated at 120 bytes per Governments and education authorities are already
second. This sets the speed limit for the information taking actions to reduce screen time among children
flow that one can pay conscious attention to at any and young people. The examples of existing policies
time. People can at most do two things at the same and measures include controlling screen time among
time; information overload and constant distraction children and young people at kindergartens and
cause stress and frustration (Levitin, 2014). schools, limiting the airing hours of childrens’ TV
channels, restricting the hours each day when online
People only have 24 hours a day. Apart from sleep platforms can provide young players access to online
ing, their daily work, meals, commuting and doing games, and raising public awareness about the health
chores, an ordinary person only has a few hours of and psychological impacts.
free time. High screen time can cause health and
mental problems among people, especially among The Internet offers a wealth of opportunities, but
children and young people. The time spent online it also brings dangers. The most common Internet
eats into the valuable time people need to relax, enjoy security issues users may face include hackers,
4. T
he energy and environmental impacts of consumer electronics use 11
and policy recommendations for developing countriesviruses, spyware, phishing, spamming, and identity information, and mal-information. Disinformation
theft. There are various software options and tech is false information deliberately created to harm
niques, as well as services provided by different com a person, social group, organization or country.
panies, to address the security threats. Misinformation is information that is false but not
created with the intention of causing harm. Mal-
The government needs to make people aware of information is genuine information shared to cause
the security threats they can face online through harm. Kumar & Shah (2018) divided false information
awareness-raising and hold major online platforms into two broad categories based on knowledge: opin
accountable for the economic losses and harmful ion-based fake information (e.g. fake reviews) and
contents that they host. The government can improve fact-based information (e.g. false news and hoaxes).
Internet security through legislation and the enact
ment of various requirements and rules. Experts are evenly split on whether false and mis
leading narratives online will decline in the com
Another issue is about the contents people put online. ing decade. Some believe the situation will improve
Since CERN made the World Wide Web (“www” for because of technological fixes and societal solutions.
short) technology available on a royalty-free basis Others think the dark side of human nature will
to the public domain, the web has been flourishing. dominate, and the situation will become worse (Pew
According to Internet Live Stats (2019), in 2019 there Research Center, 2017).
were around 1.7 billion websites on the web, of which
only 200 million are active. In other words, 88 per There are already laws and international collab
cent of the websites are not active. orations to tackle online criminal activities and
hold online platforms and social media companies
In the age of digitalization and social media, people responsible for the content they publish. The EU
save a lot of contents online and share documents, published the General Data Protection Regulation
photos, audio and videos. With technological prog (GDPR) in 2016 to protect online data privacy.
ress, the size of data and information shared and
stored online has been growing exponentially. Social Governments from different countries need to coop
media and portal site companies get their revenues erate in the governance of the Internet: to clean up
from selling advertisement space on their websites. the online space by deleting dormant and out-of-
To attract users, they often offer free email boxes, date information, requesting information creators
online space, and even cloud saving space to indi and platform owners to delete misinformation and
vidual consumers free of charge. The sufficiency false information, and setting duration limits on the
of free online space offers consumers no incentive information people put online. In this way, they can
to delete useless emails in their email boxes, their reduce harmful, false and repetitive information
posts and the documents they shared. At the same online, hence reducing the data stored at data centres
time, popular platforms like YouTube and Facebook and the energy and resource use to keep such infor
do not delete videos and pictures uploaded by their mation readily accessible (Council of Europe, 2017).
users. The information is stored in the servers in data
centres. Around 54 per cent of emails sent every day 4.2 T
he energy and carbon footprint of
are unsolicited spam mails, such as advertisements, consumer electronics usage
scams, hoax virus warnings and hoax charity appeals
(Statista, 2020). Increasing ownership and use of consumer electron
ics lead to higher household energy consumption.
A large share of the huge amount of information put Usually, the Internet involves two-way data traffic –
online and shared on social media platforms every requests to the server for the webpage, document,
day is fake news and false information. The Council audio and video, and the sending of the file, webpage,
of Europe (2017) divided the issue of online informa or document to the Internet user. The whole process
tion disorder into three types: disinformation, mis involves electricity use at the consumer’s electronic
4. T
he energy and environmental impacts of consumer electronics use 12
and policy recommendations for developing countriesNetwork Infrastructure
Figure 1. Digital energy consumption, 2017 Despite constant technology progress and improve
ment in energy efficiency, the rapid growth of con
sumer electronics and online data traffic more than
6% offset the gains from energy efficiency improvement.
19% As a result, it is projected that the electricity use of
11%
ICT will continue to grow. In 2017, ICT consumed
around 2000 TWh of power, or roughly 10 per cent
of global electricity demand. By 2030, the ICT share
17% 16%
in global electricity consumption is predicted to be
between 8 and 21 per cent, depending on whether
11% the ICT sector continues on its current development
20%
path, pursues a highly sustainable development path,
or follows a worst-case path (Andrae & Edler, 2015).
Datacentre Smartphones Other
– production – production
As indicated in Table 11, data traffic has increased
Networks Computers one billion times in the past three decades. Data cen
– production tres, are energy-intensive not only to provide power
Consumer TV – production for the servers but also to keep the temperature rel
– utilisation
atively low so that the computers and services can
Source: The Shift Project, 2019 function properly.
product, the cables and connections, and the data Data centres worldwide consumed around 194 ter
centres where the data is stored. awatt-hours (TWh) of electricity in 2014 and contrib
uted about 1 per cent of total global demand (IEA,
Electricity usage from ICT can be divided into four 2017). Data networks, which form the backbone of
principal categories (Andrae & Edler, 2015): the digital world, consumed around 185 TWh glob
• consumer devices, including personal computers, ally in 2015, or another 1 per cent of total demand,
mobile phones, TVs and home entertainment sys while mobile networks accounted for around two-
tems; thirds of the total (IEA, 2017). Due to improvements
• network infrastructure; in Internet data-transfer efficiency, energy use for
• data centre computation and storage; those tasks has declined rapidly, halving every two or
• production of the above categories. so years, although it remains significant (Aslan et al.,
2017). A meta-analysis of the energy use associated
Figure 1. shows the energy consumption by the global with data transfer across the Internet – from the point
digital sector in 2017. It can be seen that compared at which the data leaves the data centre to where it
with the energy consumption by consumers only reaches the user – estimated this energy use at 0.027
accounted for 20% of the total, another 35% was for kWh/GB (Aslan et al., 2017).
data centres and networks, while the production of
various digital products contributed 45% of the total Gaming is responsible for more than one-third of all
energy footprint of the digital sector. digital media consumption in the US. For televisions
or displays in general, increases in screen size, res
Table 11. The Exponential Growth of Internet Data Traffic
Year 1987 1997 2007 2017
Traffic to & from 2TB 60 PB 50 EB 1.1 ZB
data centres
Note: TB, terabyte, 1012 bytes PB, petabyte, 1015 bytes EB, Exabyte, 1018 bytes ZB, zettabyte, 1021 bytes
Source: IEA, 2017
4. T
he energy and environmental impacts of consumer electronics use 13
and policy recommendations for developing countriesolution and picture quality counteract the effect of 4.4 T
he challenge of growing electronic
energy savings (Lane et al., 2019). waste – status, trends, and policy
recommendations
In such situations, the government need to establish
minimum energy performance standards for all con E-waste is the shortened form of the term electronic
sumer electronics, telecommunication infrastructure waste and is the waste material generated from elec
and data centres. Due to rapid technological progress tronic products. It refers to electrical or electronic
and a large variety of consumer electronics products, materials that are unwanted, discarded, obsolete
only a small proportion of products are covered by or broken. Some of the sources of this category of
energy efficiency standards and labels. For example, waste include radio and television sets, computers,
the EU’s energy labelling requirements cover televi monitors, all types of phones, fax machines and copi
sions, but other consumer electronics – like personal ers, personal digital assistants and electronics from
computers, tablets and mobile phones – are not on industrial sources (Onyeje, 2009).
the list of the European Product Database for Energy
Labelling (EPREL). Standby power use is another After consumer electronics are damaged, out of order,
aspect that affects the energy use of a product. or replaced with new ones with better performance
and new functions, they either end up in corners of
Minimum energy performance standards and label collecting dust or being recycled, landfilled or incin
ling, energy auditing and management for data cen erated. Developed countries generally have systems
tres and telecommunications infrastructure, as well for e-waste collection. With their strict environmental
as top-runner programmes to encourage technology regulations and high labour costs, they often donate
innovation, are important to reduce the energy foot or sell their e-waste as used products or export them
print from consumer electronics use. as waste to developing countries for processing. For
over two and a half decades, more than half of global
4.3 E
nergy saving based on smart trash export has been sent to China for processing
technologies and recycling. This changed when several Chinese
ministries enacted a ban on trash import, by includ
Home automation allows homeowners to control ing waste paper, plastics, as well as electrical and
their appliances through smartphone apps, cre electronic waste in the catalogue of products subject
ating many new ways to save energy and adjust to import ban from 1 January 2018 (MEE et al., 2017).
the time of energy consumption. People can use The ban is due to environmental and health concerns
smartphones to schedule when appliances turn on and efforts to increase domestic waste sorting and
and off and reduce the energy waste from forget recycling. This regulation changes the global flow of
ting to turn appliances off when they are not in use. e-waste trade, and developed countries are trying to
They can choose to turn on dishwashers, washing find a new market for their waste.
machines and clothes dryers during off-peak hour,
when renewable energy is sufficient and electricity E-waste is recycled because they contain a long list of
is cheap. Smartphones make it possible for people usable materials and components, such as plastics,
to work from home, and video conferences can iron and steel, glass, copper, silver and gold. When
save time and energy use for transport. they are disassembled, the materials can be recy
cled for different uses. Compared with producing
Governments in many countries are building smart new materials, it is often cheaper to obtain materials
cities, providing government services online, and from recycling. That’s why enterprises in developing
tapping into the potential of smart technologies and countries find it an attractive business to import and
consumer electronics to support energy-saving and process e-waste. However, the e-waste also contains
green development. some toxic and polluting elements such as mercury,
lead, cadmium, beryllium, or brominated flame
retardants. Recycling and disposal of e-waste, espe
4. T
he energy and environmental impacts of consumer electronics use 14
and policy recommendations for developing countriescially in the absence of proper equipment and per monitors that contain cathode ray tubes, LCD desk
sonal protection, may involve significant risks to the top monitors, LCD televisions, plasma televisions
health of the workers and communities. Therefore, it and portable DVD players with LCD screens.
is important to take measures to avoid unsafe expo
sure in recycling operations and leakage of materi An estimated 60-90 per cent of e-waste is illegally
als such as mercury and heavy metals into the waste traded or dumped, according to UNEP’s “Waste
system and land. Electronic items that are considered Crimes, Waste Risks: Gaps and Challenges in the
to be hazardous include: televisions and computer Waste Sector”, published in 2015. The global volume
of e-waste created each year is growing at an average
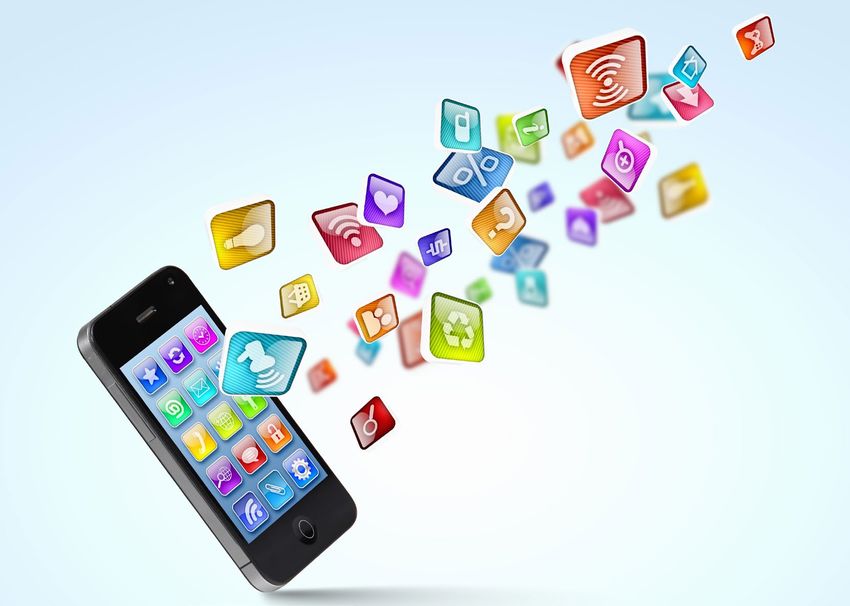
Figure 2. Internet users’ daily time spent on social speed of 3-4 per cent per year (Kumar et al., 2017).
media in different countries Currently, the majority of e-waste is produced by
developed countries, and developed countries are
Philippines 04:12
addressing the issue through systematic collection,
Brazil 03:34
16%
Colombia 03:31
but the rate of e-waste growth in some developing
Argentine 03:18 countries is alarming. For example, e-waste in India
Nigeria 03:17 has been growing at 25 per cent per year in recent
Mexico 03:12
years (Garlapati, 2016). On top of that, developing
Thailand 03:11
Ghana 03:07 countries face the additional challenge of e-waste
Egypt 03:04 export from developed countries (Park et al., 2017).
U.A.E 02:59 E-waste contains a wide range of materials; they can
Malaysia 02:58
Saudi Arabia 02:50
generally be classified into substances found in large
South Africa 02:48 quantities, substances found in small quantities, and
Kenya 02:47 elements found in trace amounts.
Turkey 02:46
Morocco 02:33
Vietnam 02:32
Existing international initiatives on e-waste stretch
India 02:32 from policy development, statistical work and train
Russia 02:16 ing to designing out hazardous elements from prod
Worldwide 02:16
ucts (UN Environment Management Group, 2018).
Portugal 02:09
Singapore 02:08 Developing countries need to establish environmen
USA 02:04 tal and health rules and regulations on e-waste dis
China 01:57
posal and processing to promote clean processing
Ireland 01:53
Taiwan 01:52
and address leakages and pollution in the e-waste
Italy 01:51 treatment process. Meanwhile, it is also important to
UK 01:50 require consumer electronics manufacturers to con
Sweden 01:49
sider product recycling and disposal in the product
Canada 01:47
Hong Kong 01:47 design stage and provide technical support to the
Poland 01:45 disposal and recycling of their products at the end of
New Zealand 01:43 their useful life.
Spain 01:39
Australia 01:31
Belgium 01:31 4.5 T
he situation in developing countries
Denmark 01:31
and policy recommendations
France 01:17
Netherlands 01:16
Switzerland 01:16
The situation in developing countries includes a
Austria 01:12 rapid increase in ownership and use of consumer
South Korea 01:09 electronics, less strict regulations and standards on
Germany 01:04
energy efficiency, incomplete e-waste sorting and
Japan 00:36
recycling systems, and poor coverage and enforce
Source: Global WebIndex, 2019
4. T
he energy and environmental impacts of consumer electronics use 15
and policy recommendations for developing countriesment of environmental and health rules regarding tems for consumer electronics. Rapid technological
e-waste disposal. progress, a great variety of products, and constant
market entry of new products make any energy effi
Figure 2 is the result of a survey on people’s daily ciency standard quickly out of date.
time spent on social media in different countries. It
is noteworthy that, generally, people in developing More importantly, consumer electronics products
countries spend a longer time on social media than and information technology can also help save
people in developed countries. One possible expla energy. For example, video conferences and joint
nation could be that people in developing countries work online can help avoid business trips; smart
generally have longer working hours, fewer options sensors and programming capacity can help avoid
of outdoor activities, low-cost of using the Internet energy waste.
on smartphones, as well as the wide availability of
Internet connections. When people cannot find time In recognition of the huge energy use by data cen
to meet their friends, and when family members tres, developed countries have established rules and
are not living together, or when people lack a sense standards on the energy performance of data centres.
of security in cities after dark, they are more likely However, most developing countries do not have
to resort to social media for keeping in touch with them yet.
friends and families. Another factor is that young
people tend to spend more time on social media and To promote energy efficiency, governments need to
online than older people. The lower average age and take a long list of actions, including awareness-rais
higher proportions younger people could be another ing through standards and labelling, educating and
reason for the higher social media use in developing training professionals and technicians, public pro
countries. curement, and providing economic incentives for
enterprises and the general public to opt for ener
4.5.1 O
wnership and use of consumer gy-efficient products.
electronics
4.5.3 Dumping sites of e-waste
In developing countries, ownerships of consumer
electronics is growing fast, especially among young Lower-income levels mean that a higher proportion
people and expanding middle classes. Consumer of consumer electronics are on the lower price end in
electronics’ rapid technology progress leads to con developing countries. They are also the destinations
stant price declines, making it more affordable to of used consumer electronics and e-waste from devel
own and use consumer electronics. oping countries due to their less strict environmental
rules, and lower labour cost for e-waste processing.
The government can play an important role through However, as evidence shows, primitive processing of
consumer information and awareness-raising, as e-waste can cause serious environmental and health
well as establishing rules and regulations to promote problems to the workers and local communities, due
the benefits of the Internet while restricting the harm to the leakage of heavy metals and the landfilling and
it can cause. For example, they can learn from the incineration of components that are of low commer
experiences of developed countries, clean up the cial value. Governments need to establish rules and
Internet, and raise awareness about the energy foot promote good practices for e-waste recycling and
print and potential risks of people’s online activities. processing.
4.5.2 E
nergy use and energy performance
of consumer electronics
Around the world, only a small number of countries
have energy efficiency standards and labelling sys
4. T
he energy and environmental impacts of consumer electronics use 16
and policy recommendations for developing countries5. Conclusions
In the last three decades, tremendous technological and data centres. Internet use is expected to further
progress has led to major changes to the ownership increase, both among the people and the Internet
and use of consumer electronics in all countries and of Things. In such situations, countries, especially
regions. Today, more than half of the world’s pop developing ones, need to speed up their effort to pro
ulation are regular Internet users. This makes the mote the energy efficiency of consumer electronics,
Internet a powerful tool in shaping people’s knowl Internet infrastructure, and data centres.
edge and views. Going back 20 years, few people
could have imagined having a multipurpose device Finally, most consumer electronics are designed
so small in your pocket. The smartphone is the Swiss for a short life of only a few years. Rapid technolog
army knife of the 21st century. ical progresses, the constant introduction of newer
products with better and faster functions, and con
While enjoying the benefits of technological prog tinuous cost reduction in consumer electronics and
ress, a few side effects from consumer electronics uti Internet access means many consumer electronics
lization need to be tackled. This includes improving are dumped even before the end of their useful life.
Internet security and fighting against criminal activ Globally, total e-waste reached 46 million tonnes in
ities online, through spreading malware and spy 2017. A large share of the e-waste from developed
ware, scams, false information and misinformation. countries is shipped to developing countries for
Another issue is the health impact of information processing and recycling. E-waste contains many
overload and Internet addiction. Many people spend recyclable and valuable components, making its
hours every day surfing the Internet, watching vid processing a profitable business for some countries
eos, playing games and communicating with others and regions. However, e-waste also contain some
on social media platforms. Online time is the longest hazardous components and parts that are low value.
among young people. This can cause distractions, The leakage of heavy metals and incineration and
stress and reduction in time with family, face-to-face landfill of e-waste can cause serious environmental
meeting with friends, and work and education. and health problems to workers and local commu
nities. Countries need to collaborate to tackle these
Another issue is the energy use from people’s online environmental and social problems from the infor
time. This includes not only household energy use, mation age through awareness-raising, legislation,
but the energy use by the cables, routers, switches policies and regulations.
5. Conclusions 17References Andrae, A. & Edler, T., 2015. On Global Electricity CISCO, 2020. Cisco Annual Internet Report (2018– Usage of Communication Technology: Trends to 2023) White Paper, updated in March 2020. 2030. Challenges 6, 117–157 (2015). Council of Europe, 2017. Information Disorder: Aslan, J., K. Mayers, J.G. Koomey, and C. France. Toward an interdisciplinary framework for 2017. “Electricity Intensity of Internet Data research and policymaking, prepared by Claire Transmission: Untangling the Estimates.” Journal Wardle, PhD and Hossein Derakhshan. Council of of Industrial Ecology. Doi:10.1111/jiec.12630 Europe report DGI(2017)09 Baldé, C.P., Forti V., Gray, V., Kuehr, R., Stegmann, Garlapati, V.,K., 2016. E-waste in India and devel P., 2017. The Global E-waste Monitor 2017: oped countries: Management, recycling, busi Quantities, Flows and Resources. United ness and biotechnological initiatives. Renew and Nations University (UNU), International Sustain Ener Rev 54: 874-881, 2016. Telecommunication Union (ITU) & International Global WebIndex, 2019. Digital 2019 Global Digital Solid Waste Association (ISWA), Bonn/Geneva/ Overview (January 2019) v01. Vienna. Hymas, C., 2018. A decade of smartphones: We now Bansal, S., Bruno, P., Denecker, O., Goparaju, M., spend an entire day every week online. 2 August Niederkorn, M., 2018. Global payments 2018: A 2018, the Telegraph. dynamic industry continues to break new ground. IEA, 2017. Digitalisation and Energy. International McKinsey & Company, October 2018 Energy Agency, Paris. Bhattacharjee, B. & Pansari, S., 2019. ICUBE 2019 Internet Live Stats, 2019. https://www.internetlives Highlights-Digital adoption & usage trends: tats.com/. Accessed in August 2019. Internet in India. PowerPoint document is avail ITU, 2018. Setting the Scene for 5G: Opportunities able at the website of Kantar IMRB. Accessed on & Challenges. https://www.itu.int/en/ITU-D/ 10 July 2019. Documents/ITU_5G_REPORT-2018.pdf Center for the Digital Future, 2017. The 2018 Digital [Accessed on 20 July 2020] Future Report – Surveying the Digital Future (Year Kumar, A., Holuszko, M., Espinosa, D.C.R., 2017. Sixteen). Center for the Digital Future, University E-waste: An overview on generation, collection, of Southern California, Annenberg, 2018. legislation and recycling practices. Res Conser CISCO, 2018. CISCO VNI Global IP Traffic Forecast, and Recyc 122: 32-42. 2017-2022. https://newsroom.cisco.com/ Kumar, S., Shah, N., 2018. False Information on Web press-release-content?type=webcontent&arti and Social Media: A Survey. arXiv:1804.08559v1 cleId=1955935 [Accessed on 10 July 2020]. [cs.SI] 23 April 2018. , Vol. 1, No. 1, Article. Cisco, 2019. Cisco Visual Networking Index: Publication date: April 2018. Forecast and Trends, 2017–2022 White Paper. Lane, K., Thibaut Abergel, T., Dulac, J., 2019. Updated: 27 February 2019. https://www.cisco. “Appliances & equipment -Tracking Clean Energy com/c/en/us/solutions/collateral/service-pro Progress”. https://www.iea.org/tcep/buildings/ vider/visual-networking-index-vni/white-pa appliances/ [Accessed on 7 July 2019]. per-c11-741490.html [Accessed on 30 June 2020]. References 18
Levitin, D.J., 2014. The Organized Mind – Thinking Statista, 2019. Apple iPhone sales worldwide Straight in the Age of Information Overload. 2007-2018. https://www.statista.com/statis Published by Penguin Books. ISBN: 978-0-241- tics/276306/global-apple-iphone-sales-since-fis 96578-8. cal-year-2007/ [Accessed on 30 June 2020]. MEE et al., 2017. “Updated Catalogue of Products Statista, 2019a. Global smartphone shipments from Subject to Import Ban”, jointly issued on 10 2009 to 2018 (in million units). https://www. August 2017 by the Chinese Ministry of Ecology statista.com/statistics/271491/worldwide-ship and Environment (MEE), the Ministry of ments-of-smartphones-since-2009/ [Accessed on Commerce, the National Development and 30 June 2020]. Reform Commission (NDRC), the General Statista, 2019b. Daily time spent on social network Administration of Customs, and the General ing by internet users worldwide from 2012 to 2018 Administration of Quality Supervision, (in minutes). Inspection, and Quarantine. Statista, 2019c. “Percentage of all global web pages Michaelsen, A., 2015. “Brand Obama: How Barack served to mobile phones from 2009 to 2018” Obama Revolutionised Political Campaign Statista, 2020. “Global spam volume as percentage Marketing in the 2008 Presidential Election”. CMC of total email traffic from January 2014 to March Senior Theses. 990. https://scholarship.claremont. 2020, by month”. edu/cmc_theses/990 [Accessed on 10 July 2020]. Stiglic, N. and Viner, R.M., 2019. Effects of scre OfCom, 2018a. A decade of Digital Dependency. entime on the health and well-being of chil August 2018. dren and adolescents: a systematic review of OfCom, 2018b. The Communications Market 2018. reviews. BMJ Open 2019;9:e023191. doi:10.1136/ 2 August 2018, OfCom. Available at https://www. bmjopen-2018-023191 ofcom.org.uk/research-and-data/multi-sector-re The Shift Project, 2019. Lean ICT – towards Digital search/cmr/cmr-2018 [Accessed on 10 July 2020]. Sobriety – Report of the Working Group Directed Onyeje, I.N., 2009. Creating Wealth from e-waste by Hugues Ferreboeuf for the Think Tank the Shift in the Third World countries. The Heartland Project – March 2019. Engineer 4, (1), 2009, 10-14 UN Environment Management Group, 2018. The Park JK, Hoerning L, Watry S, Burgett T, Matthias S., United Nations and E-waste – System-wide 2017. Effects of Electronic Waste on Developing Action on Addressing the Full Life-cycle of Countries. Adv Recycling Waste Manag 2:128. Electrical and Electronic Equipment. doi:10.4172/2475-7675.1000128 Zhao, J., Zhang, Y., Jiang, F., Ip, P., Ho, F., Zhang, Y., Pew Research Center, 2017. “The Future of Truth Huang, H. (2018). Excessive Screen Time and and Misinformation Online”. 19 October 2017. Psychosocial Well-Being: The Mediating Role of Roser, M., Ritchie, H., 2019. “Technological Body Mass Index, Sleep Duration, and Parent- Progress”. Published online at OurWorldInData. Child Interaction. The Journal of Pediatrics. 202. org. Retrieved from: https://ourworldindata. 10.1016/j.jpeds.2018.06.029. org/technological-progress [Accessed on 10 July 2020]. Scott, M., 2018. Cambridge Analytics helped ‘cheat’ Brexit vote and US election, claims whis tle-blower. MARK SCOTT, 3/27/18. Article at https://www.politico.eu/ [Accessed on 10 July 2020]. Sood R., Garg, A., 2014. Digital Society from 1G to 5G: A Comparative Study. International Journal of Application or Innovation in Engineering & Management (IJAIEM), Volume 3, Issue 2, February 2014 References 19
You can also read