Capture & Analysis of Active Reading Behaviors for Interactive Articles on the Web
←
→
Page content transcription
If your browser does not render page correctly, please read the page content below
Eurographics Conference on Visualization (EuroVis) 2019                                                                           Volume 38 (2019), Number 3
M. Gleicher, H. Leitte, and I. Viola
(Guest Editors)

                          Capture & Analysis of Active Reading Behaviors
                                for Interactive Articles on the Web

                                                      Matthew Conlen1      , Alex Kale1    , and Jeffrey Heer1
                                          1   Paul G. Allen School of Computer Science & Engineering, University of Washington

Figure 1: An online interactive article How To: Tune A Guitar (left) and visualizations of collected reader activity data. HopScroll (center)
visualizes reader progress over time, revealing reading patterns and fixation points. Readuction (right) uses dimensionality reduction of
reader feature vectors to enable nuanced segment analysis; linked views show timing and event information for selected points. Along with
these tools we present Idyll language extensions for automating the collection of detailed log data, and discuss reading patterns discovered.

        Abstract
        Journalists, educators, and technical writers are increasingly publishing interactive content on the web. However, popular
        analytics tools provide only coarse information about how readers interact with individual pages, and laboratory studies often
        fail to capture the variability of a real-world audience. We contribute extensions to the Idyll markup language to automate
        the detailed instrumentation of interactive articles and corresponding visual analysis tools for inspecting reader behavior at
        both micro- and macro-levels. We present three case studies of interactive articles that were instrumented, posted online, and
        promoted via social media to reach broad audiences, and share data from over 50,000 reader sessions. We demonstrate the
        use of our tools to characterize article-specific interaction patterns, compare behavior across desktop and mobile devices,
        and reveal reading patterns common across articles. Our contributed findings, tools, and corpus of behavioral data can help
        advance and inform more comprehensive studies of narrative visualization.

1. Introduction                                                                            Visualization practitioners have debated whether interactive
                                                                                        components are effective and worth the significant effort and ex-
The interactive article is a form of web content increasing in popu-
                                                                                        pense necessary to create them [Tse16, Bau17, Ais18]. Researchers
larity. Newspapers publish interactive graphics and visualizations
                                                                                        have called for more data to be collected on these articles, in a
in addition to more traditional articles. Educators and technical
                                                                                        more realistic context than the laboratory [KM13]. To advance
communicators enrich text with multimedia in an effort to further
                                                                                        more comprehensive and realistic studies of narrative visualization
engage their readers. These interactive pieces often resonate with
                                                                                        use, we contribute capture and analysis tools for reader sessions of
a wide audience [GB18] and may more effectively communicate
                                                                                        interactive articles. We first present extensions to the Idyll markup
complex topics [May02]. Publishers understand that interactive ar-
                                                                                        language that automate the detailed instrumentation of interactive
ticles can bring both acclaim and a broad readership [HR15]. How-
                                                                                        articles. The logger captures browser metadata, scroll position, and
ever, due to time constraints and a lack of tooling, these articles
                                                                                        time-series data of mutations to Idyll’s article state model, which
are seldom analyzed to see if their interactive features are effective
                                                                                        tightly corresponds to article feature usage.
at engaging readers and delivering the desired message. Interactive
articles suffer from the additional issue that there are no clearly de-                   We next present visual analysis tools to enable exploration of
fined metrics or evaluation methods to measure their effectiveness.                     collected reader data. HopScroll plots user scroll positions over

 c 2019 The Author(s)
Computer Graphics Forum c 2019 The Eurographics Association and John
Wiley & Sons Ltd. Published by John Wiley & Sons Ltd.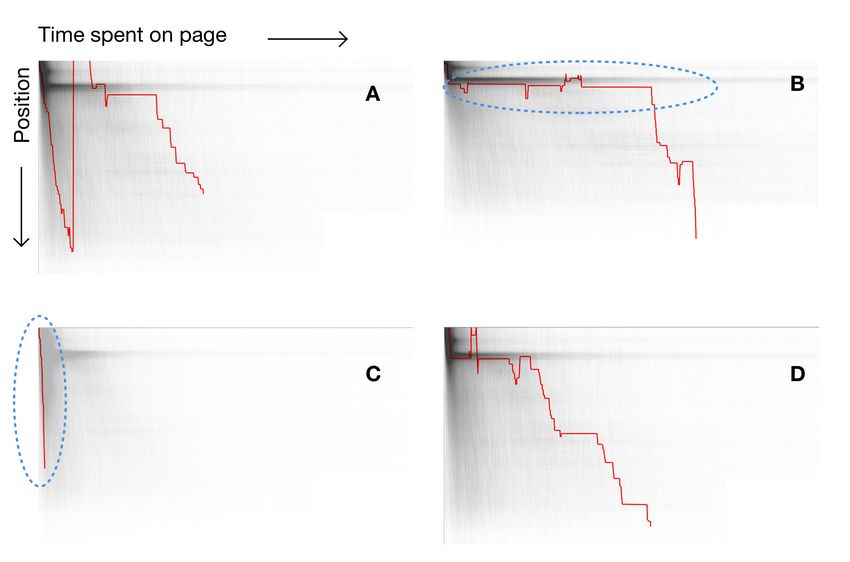
M. Conlen, A. Kale, & J. Heer / Capture & Analysis of Active Reading Behaviors for Interactive Articles on the Web

                                                                                to describe non-linear, branching text [Zie89], and interactive non-
                                                                                fiction which has been used to refer to similar techniques applied
                                                                                in a journalistic context [SZ11]. Explorable Explanations [Vic11]
                                                                                are one notable type of interactive article that promote active read-
                                                                                ing and inquiry into the details of a topic. This type of article is
                                                                                becoming increasingly prevalent on the web [exp18]. Explorable
                                                                                explanations share design techniques with interactive articles pub-
                                                                                lished by news outlets, however they have not been widely studied.
                                                                                   The use of narration alongside graphics has been broadly studied
                                                                                by education researchers. Mayer [May02] aggregates principles of
                                                                                multimedia learning that can inform designers of interactive edu-
                                                                                cational content. In a classroom setting the effectiveness of educa-
                                                                                tional content might be assessed via tests or quizzes given directly
Figure 2: Beat Basics was produced by an undergraduate com-                     to students. However, in contrast to a classroom or MOOC setting,
puter science student. She designed it to teach curious readers the             we are interested in content published to broad audiences who are
basics of rhythmic time signatures in music.                                    not externally motivated, for example, by being enrolled in a class.
                                                                                As such, while the design principles are related, the methods by
time to reveal a diversity of reading behaviors. In addition to an              which materials are evaluated should vary.
aggregate overview, HopScroll shows individual user sessions in
an animated fashion akin to Hypothetical Outcome Plots [HRA15].                 2.1. Usage Logging and Analysis
Readuction uses dimensionality reduction to visually cluster re-
lated feature vectors automatically derived from event logs. Co-                There is a rich history of research on capturing and visualizing us-
ordinated plots show associated timing and event data for selected              age of applications in general [KTPG∗ 02, HMSA08, MGF13] and
points, enabling nuanced segment analysis of reader behavior. Both              specifically on web sites [HC02, PSF04]. Commercial and open
tools support micro / macro readings [Tuf90], enabling simultane-               source tools like Google Analytics [goo18], Chartbeat [cha18], and
ous consideration of aggregate patterns and individual behaviors.               Matomo [mat18] are commonly used to collect basic statistics of
                                                                                web page visitation. These services record visitor counts and time
   We apply our tools in three case studies of interactive articles.            spent on pages, in addition to profiling how users flow from page
We follow the articles through their entire life cycle: from incep-             to page. Google Analytics offers web administrators the ability to
tion through design, publication, and evaluation. Each was written              deploy surveys to website visitors as a means of assessing the qual-
to appeal to a specific audience, and instrumented to record reader             ity of page content. In this work we focus on capture and anal-
interaction logs. These articles were visited more than 50,000 times            ysis methods that do not require additional page content or input
by readers across the world. We report aggregate usage statistics,              from readers. Other services like Heap [hea18] focus on tracking
compare behavior across mobile and desktop devices, and demon-                  behavioral events such as button clicks. Visualization researchers
strate the use of our tools to characterize both article-specific inter-        have presented systems for analysis of event logs [DL17] and click-
action patterns and cross-article reading patterns. Additionally, we            streams [LWD∗ 17]. For example, CoreFlow [LKD∗ 17] is a tool for
show how the collected data can be operationalized and measured                 extracting and visualizing branching patterns in event sequences.
against content-specific metrics developed by the articles’ authors.
We conclude with a discussion of findings, implications, and av-                   Quantifying user engagement beyond simple measures like page
enues for future research in this area. By publicly sharing our tools           views and time spent on task is difficult. Attfield et al. [AKLP11]
and corpus of reader data, we hope to encourage the collection and              propose different facets of user engagement: focused attention, pos-
study of reader behavior at scale in real-world contexts.                       itive affect, aesthetics, endurability, novelty, richness & control,
                                                                                reputation, trust & expectation, and user context. The data that
                                                                                we have collected can be used to assess engagement through aes-
2. Background & Related Work
                                                                                thetics and richness & control. Rodden et al. [RHF10] contribute
Our work is motivated by calls from researchers in the data visu-               a generic framework (HEART) for measuring user experience of
alization, journalism, and educational communities for further in-              web applications. These models are not fully applicable to the
quiry into the effectiveness of dynamic content. In conducting our              study of interactive articles. For example, an article about gun vi-
analysis we build on a large body of work on the analysis of web-               olence [CCFB16] may induce negative affect in readers, but still
page usage, and the instrumentation of software applications more               effectively communicate a message. Metrics like retention may not
generally. We scope our work to consider content specifically that              apply to individual articles if there is no need for visitors to re-
is published online to an anonymous readership with whom the au-                turn after they have read and learned from the presented content.
thor has no direct communication. We use the phrase interactive                 Some applications opt to tailor metrics and visualizations to their
article to encompass several types of web content. In general these             specific domain rather than relying on a general framework. For
articles are characterized by interleaved text and interactive widgets          example, LectureScape [KGC∗ 14] visualizes how viewers interact
– often utilizing animations, data visualizations, or simulations –             with educational videos and Porta [MG18] profiles tutoring soft-
and guide a reader through a primarily linear narrative. This scop-             ware. These projects demonstrate that tailoring metrics to a spe-
ing is in contrast to the use of interactive fiction by media critics           cific domain can lead to more effective analytics platforms. In ad-

                                                                                                                                                    c 2019 The Author(s)
                                                                                   Computer Graphics Forum c 2019 The Eurographics Association and John Wiley & Sons Ltd.
M. Conlen, A. Kale, & J. Heer / Capture & Analysis of Active Reading Behaviors for Interactive Articles on the Web

dition to our domain-specific logging and analysis tools, we work
with domain experts to derive quantitative content-specific metrics
to assess particular aspects of article design.

2.2. Journalism and Narrative Visualization
Visualization researchers have studied the techniques used in inter-
active and data-driven stories published by news outlets. In 2010,
Segel & Heer [SH10] articulated a design space of narrative visu-
alization. This design space has been further refined [SLRS16] to
reflect modern practice. Researchers have noted several opportuni-
ties for further research in this space, including evaluating the ef-
fectiveness of data-driven storytelling techniques [LRIC15]. Along
these lines, McKenna et al. [MHRL∗ 17] report on the effects of                          Figure 3: The Beginner’s Guide to Dimensionality Reduction uses
design choices on reader engagement in a controlled study. How-                          artworks from the Metropolitan Museum of Art as examples for in-
ever, Kosara & Mackinlay [KM13] write that studies will need to                          troducing dimensionality reduction techniques.
be performed outside of a traditional laboratory setting in order to
“get stories in front of the types of people who are also the audi-
                                                                                         geted different readerships, but each used design techniques com-
ence for news media.” Amini et al. [RHDC18] explicate the cri-
                                                                                         mon to contemporary interactive articles. All articles were authored
teria, methods, and metrics that may be used when evaluating data
                                                                                         using Idyll [CH18a]. Idyll’s reactive runtime is powered by a single
driven stories. They, too, suggest that case studies may be necessary
                                                                                         global state, an architecture that lends itself to instrumentation for
in order to better understand how tools and stories perform in the
                                                                                         easy logging and replay, allowing us to generalize and automate the
wild. In this research, we conduct evaluation of interactive articles
                                                                                         data collection process. We collected reader data on each of the arti-
published in an uncontrolled setting. Boy et al. [BDF15] present a
                                                                                         cles for several weeks, however the vast majority of reader sessions
case study examining the effect of the presence of narrative text on
                                                                                         came within the first two days of the articles’ publication.
users’ engagement with visualizations in the wild. Boy et al. use
semantic operations to operationalize log data by mapping it onto a                         Here we give an overview of the article designs; in later sections,
generalized vocabulary of user actions. While this work is similar                       we apply our logging and analysis tools to each of the articles and
to ours in its collection of usage data from public web pages, we                        discuss our findings. Each case study concerns a text-driven, linear
focus on capture and analysis of reader behavior with the article as                     narrative accompanied by interleaved interactive graphics and con-
a whole, rather than a specific visualization.                                           trol widgets. The articles draw on a variety of design techniques
                                                                                         that are prevalent in online articles from news outlets, for example
   Other projects contribute models and tools for narrative visu-                        scroll-based navigation and interactivity, inclusion of buttons that
alization. Walny et al. [WHP∗ 18] analyze use of visualizations                          can be used to start and stop animations or audio clips, and cus-
through the lens of active reading. GraphScape [KWHH17] for-                             tom interactive graphics. The articles were chosen in part because
malizes and extends earlier work by Hullman et al. [HDR∗ 13] to                          of these representative features as well as our ability to instrument
suggest appropriate visualization sequences. Ellipsis [SH14] is a                        them. Importantly, each article was designed by the authors to ad-
domain-specific language (DSL) and graphical interface for aug-                          dress a topic of personal interest that they believed to be of value to
menting visualizations for use within narratives. Idyll [CH18a] is                       a broader audience, providing an authentic and realistic motivation.
a DSL for authoring interactive articles, providing a markup lan-
guage, component library, and reactive variable system to orches-
trate interactive content. Vuillemot et al. [VBT∗ 16] note a chal-                       3.1. Beat Basics
lenge for analyzing visualization usage is that it often necessary                       Beat Basics (Figure 2) was written by a computer science under-
for authors to build their own logging tools to support relevant                         graduate as a submission to the 2018 Explorables Jam [jam18],
event tracking. Here, we leverage Idyll’s architecture – in which                        a three week online hackathon that solicited submissions of ex-
reactive variables directly drive interactive updates to the presented                   plorable explanations covering any topic. The article teaches read-
document content – to collect detailed content-specific usage logs                       ers about the difference between two non-standard musical time
across articles, without writing additional instrumentation code.                        signatures ( 43 and 68 ), using interactive graphics based on John Var-
These variables typically fully specify the state of an article, and                     ney’s rhythm wheel [var14]. The article was written to be accessi-
so tracking their changes over time is sufficient to represent the in-                   ble to an audience without formal training in music theory, and uses
teractions occurring during a reader’s session.                                          audio-enabled interactive graphics to convey rhythms. There are 7
                                                                                         distinct sections of content. Most of the user interactions are tied
                                                                                         to hover events: readers can move their mouse cursor over differ-
3. Case Study Article Design
                                                                                         ent graphics on the page to trigger audio playback and animation.
To better understand how readers on the web engage with interac-                         There are also buttons that may be clicked in order to reveal ad-
tive narrative content, we instrumented three interactive articles be-                   ditional information. At the end of the article users can listen to a
fore they were published online. The articles covered varying top-                       section of a classical song and watch it synchronize with the inter-
ics (music theory, guitar tuning, dimensionality reduction) and tar-                     active rhythm wheel.

 c 2019 The Author(s)
Computer Graphics Forum c 2019 The Eurographics Association and John Wiley & Sons Ltd.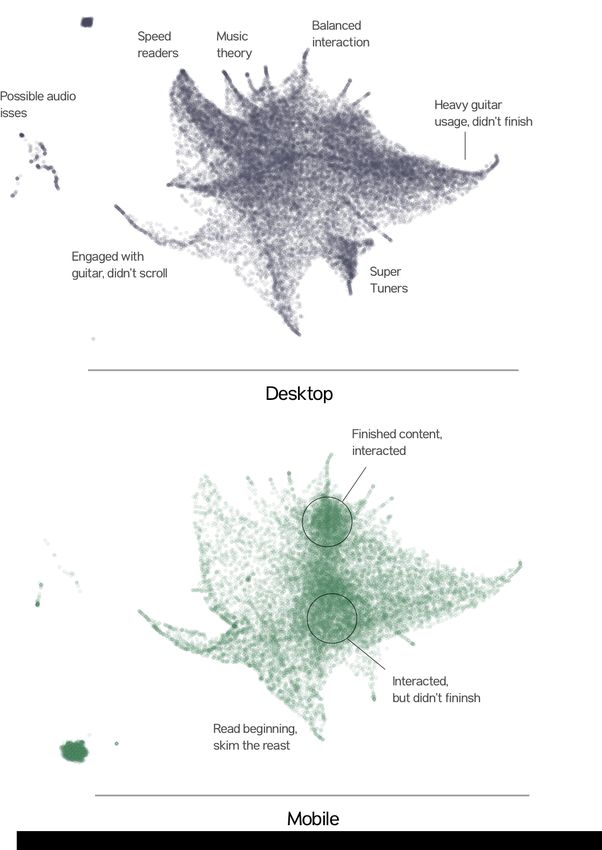
M. Conlen, A. Kale, & J. Heer / Capture & Analysis of Active Reading Behaviors for Interactive Articles on the Web
3.2. The Beginner’s Guide to Dimensionality Reduction
The Beginner’s Guide to Dimensionality Reduction [CH18b] (Fig-
ure 3), was created as a submission to the 2018 Workshop on Visu-
alization for AI Explainability [vis18]. It was written by two com-
puter science Ph.D. students. The article was crafted to make di-
mensionality reduction techniques accessible to those who did not
have a pre-existing intuition for why the techniques are useful or
how they work, and consists of 7 distinct sections. It starts by in-
troducing a dataset of artworks from the Metropolitan Museum of
Art [oA17], and uses this data in examples throughout the article.
Dimensionality reduction is introduced first in one dimension, sort-
ing the artworks by brightness, moves on to a simple but naïve 2-
dimensional projection, and ends with an overview of three algo-
rithms that are used in modern data science practice: PCA [AW10],
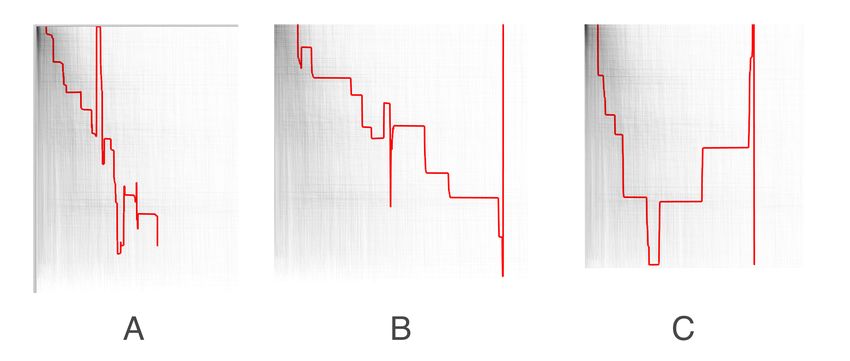
t-SNE [LvdM08], and UMAP [LM18]. Readers can hover over an Figure 4: Scroll positions over time for How To: Tune A Guitar.
artwork to call up more details. As they scroll through different sec- Plots highlight exemplary patterns: (A) Preview & Read, (B) Super
tions, the graphics update automatically in response. Other interac- Tuners, (C) Scroll & Bounce, and (D) Balanced Engagement.
tions are available,including a parameter to the naïve 2-dimensional
projection, a button that can be clicked to display more technical
The recorded variables come directly from Idyll’s reactive run-
details, and buttons to reveal details about the algorithms discussed.
time state and parameterize article components, tracking changes
in response to user input. This allows us to automate the construc-
3.3. How To: Tune a Guitar tion of user models that incorporate article specific features. For
How To: Tune a Guitar (Figure 1) uses interactive graphics and au- example, in How To: Tune a Guitar a variable update is emitted
dio to teach readers techniques for tuning guitars. The article was each time a user mouses over a string on the guitar or adjusts a tun-
written by two co-authors of this paper. The topic was chosen be- ing knob, allowing us to reconstruct in detail how users interacted
cause we expected that it would be interesting to a wide audience, with the widget. In Beat Basics and Dimensionality Reduction a
and the article was written to be accessible to beginners without variable is updated each time a reader scrolls through one of sev-
prior musical knowledge while still being of interest to experienced eral waypoints, triggering additional updates to the display. While
musicians. We developed an interactive guitar widget with audio it is possible for article authors to define private state in compo-
and dynamic visualizations to create a fun yet educational article. nents that would not be captured in our instrumentation code, this
The article asks readers to tune the interactive guitar, and use sev- is uncommon in practice and wasn’t the case in any of the articles
eral different methods to achieve the goal of tuning the guitar prop- examined here; Idyll’s variables typically fully specify the state of
erly. This article is the longest of the three discussed in this paper, an article’s interactive components. The correspondence between
consisting of 13 distinct sections. The interactive graphics update Idyll variables and user interaction is not a coincidence particular to
in response to readers scrolling through content. There are several these articles, but follows directly from the design of the language.
opportunities for direct user interaction with the widgets, includ- Our capture methods can be used directly by any Idyll article. We
ing strumming the guitar, modifying tuner knobs, clicking buttons have released our logging extension as open source software and
to trigger audio playback, and adjusting parameters that drive spe- hope that it will enable further study of interactive article usage.
cific features such as adding distortion or modifying beat frequency
playback. 5. Tools for Analyzing Reader Activity
To analyze captured reader activity logs, we start by computing ag-
4. Tools for Capturing Reader Activity
gregate statistics about usage of various article features, then use
To automate article instrumentation, we developed an extension to custom visual analysis tools (ScrollHop and Readuction) to per-
the Idyll runtime that records a number of attributes that are se- form exploratory analysis and identify patterns of user engagement.
mantically relevant to the reader experience (i.e., beyond low-level We also work with domain experts (the article authors) in order to
mouse, touch, or keyboard events). When a reader first loads an ar- create high level metrics concerning article usage, and use these to
ticle, metadata is collected about their browser, device, and screen analyze the usage of features specific to each of the articles. Our
size. A scroll event listener is added to produce a time-series of analysis tools are applicable to data from any interactive article
user scroll positions. A timer is used to track the duration of user with appropriate instrumentation. To gain a high-level overview, we
visits to each article. State changes to Idyll’s reactive variables are calculate aggregate usage statistics for each article. This includes
recorded, allowing for reconstruction of the usage patterns in in- distributions of the amount of interactions with each variable, the
dividual reader sessions. Google Firebase is used for data storage amount of time spent on the page, and the amount of progress made
and user identification, although a different backend could be con- through the content. We compute these distributions by aggregating
figured if desired. By default users are anonymous, but identifiers log data, and generate visualizations of usage of key variables and
are stable: if the same browser visits the page multiple times, each scroll progress (available as supplementary material). Since How
of these visits will be associated with the same identifier. To: Tune a Guitar did not implement explicit waypoints, we track
c 2019 The Author(s)
Computer Graphics Forum c 2019 The Eurographics Association and John Wiley & Sons Ltd.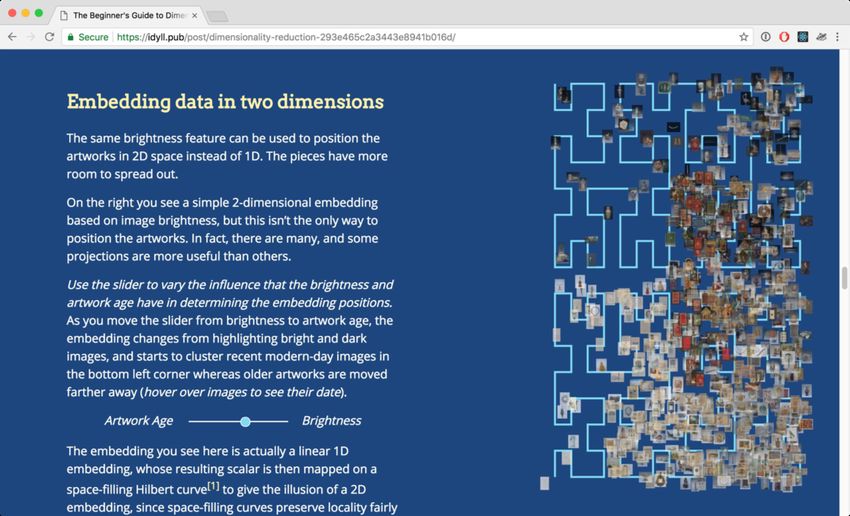
M. Conlen, A. Kale, & J. Heer / Capture & Analysis of Active Reading Behaviors for Interactive Articles on the Web

scroll position at the pixel level and later bin the positions to a par-                 count aggregations of state changes for each Idyll variable, (2) the
ticular section in a post-processing step. We also asked authors of                      amount of time spent in each section, and (3) associated data such
each article to formulate questions about how users might interact                       as the maximum scroll depth that a reader reached. Feature vectors
with their articles. We prompted authors to test their assumptions                       are automatically computed from Idyll usage logs, with each article
of usage as well as consider interactions that might exhibit critical                    using a different set of dimensions depending on the Idyll variables
engagement or content understanding. We operationalize each of                           employed. These variables fully specify the state of the article. The
these questions by writing a corresponding query over the log data                       counts of their changes correspond to the overall usage of the arti-
and present the results among the calculated statistics.                                 cle widgets. These features represent both the content that a reader
                                                                                         engages with and the amount of time that they spent doing so.
5.1. ScrollHop: Visualizing Scroll Positions over Time                                      We then use the feature vectors as input to the Uniform Man-
                                                                                         ifold Approximation and Projection (UMAP) dimensionality re-
It is difficult to use existing techniques to identify common patterns
                                                                                         duction algorithm [LM18], which uses feature similarity to form
in user scroll data. One possibility is to use dynamic time warp-
                                                                                         a topological mapping that is then projected into a Cartesian co-
ing [BC94] techniques to cluster the scroll timeseries, however the
                                                                                         ordinate space. We chose the UMAP algorithm over alternatives
size of our data set made this computationally infeasible. The time-
                                                                                         such as t-SNE [LvdM08] or PCA [AW10], as we found UMAP pro-
series could be transformed into a series of events (e.g., naviga-
                                                                                         duced useful projections that allowed us to identify different user
tions between article sections) and analyzed using event flow visu-
                                                                                         behaviors without over-clustering, revealing smooth gradations of
alization, however there are challenges in using these techniques at
                                                                                         behavior, aligning with our design goals above. We visualize the
scale [DSP∗ 17], and we wished to be able to inspect nuanced scroll
                                                                                         projected 2D coordinates in a scatter plot; adjacent points represent
behavior within sections. To gain insight into patterns of reader be-
                                                                                         visits which are similar in some subset of the selected features.
havior, we created ScrollHop (Figures 1, 4), a tool that visualizes
each visit to the page as a single line displaying scroll position over                     Readuction is an interactive tool for generating and exploring
time. Overlapping behaviors form dark bands, allowing us to assess                       these UMAP visualizations (Figure 1). It displays a data point
how readers cluster in their movement through the webpage. By se-                        for each reader session, projected into UMAP coordinates. On the
quentially highlighting individual scroll timelines in red, we can see                   right-hand side, two bar charts show the median value of reader
how individual scroll behaviors relate to the space of all scrolling                     time spent per article section and variable usage counts. The UMAP
behavior within the captured data. Prior work in uncertainty visu-                       projection and bar charts are linked so that the user can select sub-
alization [HRA15] suggests that animating through individual out-                        sets of sessions and examine the corresponding feature vectors. For
comes is an effective strategy for understanding the variance among                      each of the articles examined, we used Readuction to identify us-
possible outcomes in a set. ScrollHop uses a custom WebGL shader                         age patterns which were representative of large groups (hundreds
to interactively (re-)render tens of thousands of scroll traces in re-                   to thousands) of users. To do this, we selected different regions of
sponse to axis scale and opacity adjustments.                                            reader sessions, observing the varying distributions of time spent
   Through the use of this tool we discovered interesting user be-                       and variable usage. We utilized the expertise of article authors to
haviors such as preview & read, where users briefly scroll down                          understand how these distributions map onto real-world article us-
the page to examine the content before returning to the top of the                       age. The tool enabled us to discover cohorts of users defined by
page and going back through the page more slowly. Users who                              similar engagement with article content. For example, in the analy-
scroll & bounce were the most prominent group, moving quickly                            sis of How To: Tune a Guitar we call one such group super tuners.
through the webpage and exiting after a short time. The behaviors
that we highlight throughout this paper map onto behaviors that
                                                                                         6. Case Study Article Analysis
we observed to be common when viewing samples drawn from the
population of all user scroll patterns.                                                  In this section we analyze each article independently using the tools
                                                                                         and methods previously discussed. In the ensuing discussion we tie
                                                                                         together patterns observed across the articles, highlight our con-
5.2. Readuction: Supporting Nuanced Segment Analysis
                                                                                         clusions, and suggest areas of future research. Because the articles
To assess more nuanced behaviors, we analyze feature vectors                             were designed primarily for laptop and desktop users, we put the
that summarize reader interaction with an article. Some analysis                         primary focus of the analysis on these users; throughout the anal-
tools perform clustering to identify segments of the user population                     ysis that follows statistics refer to desktop users, except where we
(e.g. [CD18]), but depending on the parameters these approaches                          explicitly refer to mobile users. Many of the article features were
may suffer from over- or under-clustering of groups, and can re-                         disabled or shown in a static format for mobile readers, so this helps
quire careful evaluation [HC02]. As each interactive article con-                        us make uniform comparisons when discussing feature usage.
sists of customized content and interactions, we reasoned that tools
for this domain should privilege nuanced inspection and interpre-
tation over potentially misleading discrete categories. This led us                      6.1. Beat Basics
to consider dimensionality reduction methods that can provide a
                                                                                         After submission to the 2018 Explorables Jam, Beat Basics was
continuous representation of similarities among reader sessions.
                                                                                         posted online to Twitter, Hacker News, and a music education com-
   We define feature vectors to numerically encode reader behavior                       munity on Reddit. We collected data from 10,000 sessions by 8,368
in a multi-dimensional space. The vector dimensions consist of (1)                       users, 4,456 of which viewed the desktop version of the article.

 c 2019 The Author(s)
Computer Graphics Forum c 2019 The Eurographics Association and John Wiley & Sons Ltd.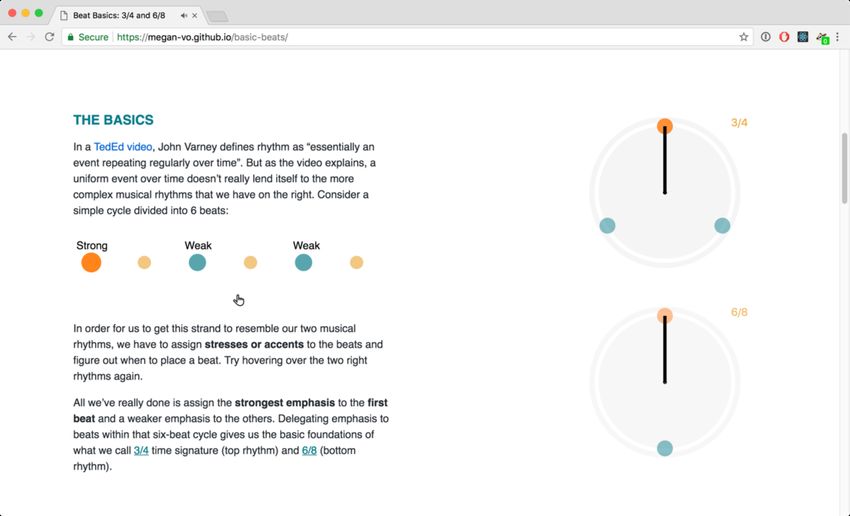
M. Conlen, A. Kale, & J. Heer / Capture & Analysis of Active Reading Behaviors for Interactive Articles on the Web

                                                                              Figure 6: Example scroll paths from Beat Basics. (A) shows a
                                                                              reader who backtracks in the content several times; (B) a reader
                                                                              progresses linearly before scrolling down quickly to preview a sec-
                                                                              tion and subsequently spend time reading it; (C) shows a reader
                                                                              who read through the content forward and then in reverse.

                                                                                 text, one near the top of the page and one near the bottom. Did
                                                                                 the differing placement of the rhythm wheels affect their usage?
                                                                                 Q2. Audio playback could be triggered by hovering over the
                                                                                 rhythm wheels, or links in text. How did interaction levels vary
                                                                                 between different input modalities?
                                                                                 Q3. Readers were prompted to interact with various widgets at
                                                                                 different points in the text. Were readers following along and
                                                                                 interacting in accordance with the narrative?
                                                                                 To answer Q1 and Q2 we can consult the aggregate usage statis-
                                                                              tics. The distribution of usage of the 43 circle (the one placed in
                                                                              the top half of the page) skews slightly higher (median 8 hovers,
                                                                              4-14 IQR) than the 86 circle (median 8 hovers, 2-12 IQR). The cir-
                                                                              cles are featured more prominently and were used more than the
Figure 5: An annotated UMAP projection of Beat Basics reader
                                                                              inline links in the text. 75% of readers interacted with one of the
sessions. We used the Readuction tool to identify cohorts of read-
                                                                              two rhythm circles, while 54% hovered over one of the two links in
ers exhibiting similar behavior by observing the distributions of
                                                                              the text, indicating that they seemed to be aware of the inline links,
feature vectors for subsets of reader sessions. The feature vectors
                                                                              but preferred interacting directly with the larger graphic. To answer
consist of counts of variable changes (a proxy for engagement with
                                                                              Q3, we measure the number of times that readers switched between
interactive widgets) and time spent on each section of content.
                                                                              engaging with the two different rhythms. The article used several
                                                                              different techniques to explain how the two rhythms compared.
6.1.1. Aggregate Statistics                                                   Readers that were following along closely with content should have
                                                                              switched between the two multiple times. The median number of
The median time spent on the page was 86 seconds (36-183 IQR),
                                                                              switches was 6 (2-9 IQR), indicating that most readers were fol-
and 85% of readers interacted with the interactive content to play-
                                                                              lowing along with the content and were completing the tasks set-
back the beats (median 16 interactions, 6-27 IQR). Of the two ex-
                                                                              up by the author in the manner that she expected. This calculation
ample songs featured at the end of the article, both the 34 and 68
                                                                              is straightforward to compute via a query over our collected in-
songs were played a median of two times, indicating that these
                                                                              teraction data, suggesting that the data collected is appropriate for
readers reached the end of the content and engaged with the au-
                                                                              answering these kinds of content-specific queries.
dio playback mechanism for each of the time signatures multiple
times. Mobile readers spent less time on the page (median 20 sec-
                                                                              6.1.2. Observations from ScrollHop
onds, 6-57 IQR). In both formats, there were outliers who drove up
the mean amount of time on the page (3,224 seconds desktop, 510               About three quarters (73%) of Beat Basics readers reached the end
seconds mobile), likely due to readers leaving the page open while            of the article. In observing the scroll data we noticed a few trends.
they performed other tasks. On mobile the median number of inter-             The first — common throughout all three articles, perhaps common
actions with an audio component was one, the top 25% interacted               to any content distributed to a broad online audience — is that many
3 or more times. Only 10% of mobile readers triggered one of the              readers simply scroll through to the end of the content very quickly
example audio clips at the article’s end.                                     and leave the page. Many of these readers interact with various in-
                                                                              teractive components, although the length of time that they spend
  We asked the article author to produce a set of questions about
                                                                              doing so suggests a very superficial level of engagement. We also
her audience that she would like answered, without discussing the
                                                                              noticed that some readers’ trajectories were erratic, moving back-
details of our data collection process. She wanted to know:
                                                                              wards and forwards in the article. These readers seemed to be en-
  Q1. The article featured rhythm wheels positioned alongside the             gaging with the content as a whole rather than one individual sec-

                                                                                                                                                  c 2019 The Author(s)
                                                                                 Computer Graphics Forum c 2019 The Eurographics Association and John Wiley & Sons Ltd.
M. Conlen, A. Kale, & J. Heer / Capture & Analysis of Active Reading Behaviors for Interactive Articles on the Web
tion at a time to support their understanding of the topic, drawing on
the multiple visualizations which presented the information in dif-
ferent ways. Figure 6 shows examples of these reading patterns in-
cluding two individuals whose path through the content was mostly
linear but included backtracking (A, B) and one who read forward
through the content and then viewed it in reverse (C).
Figure 7: The distribution of minimum values of a range slider
6.1.3. Observations from Readuction in The Beginner’s Guide to Dimensionality Reduction. The slider
Figure 5 shows both desktop and mobile readers plotted according started in the far right position. Many users did not engage with it;
to the UMAP dimensionality reduction algorithm; both groups are others moved it all the way to the left.
plotted using a shared projection. We used Readuction’s interac-
tive selection tool to view time and usage distributions and identify
responsive to some extent, did not offer a polished experience for
regions of interest, and then manually added annotations. Outliers
mobile readers. It may also be due to time or environmental factors
who bounced from the page without interacting can be seen clus-
affecting mobile readers, leading them to be less likely to dig deep
tered away from the central group. Different regions of the main
into features and more likely to read for the high-level takeaways.
group can be inspected to reveal the most engaged readers, the least
engaged, and the many that lie in between. We dragged the brush We interviewed an author of this article to understand what fea-
tool across regions of users to view aggregate feature vectors and tures he considered most valuable for tracking user engagement.
selection counts, revealing the density and behavioral patterns ex- He was interested in high level information such as completion rate
hibited in different areas of the visualization. Towards the edges of and time on page, as well as granular information about how read-
the main group are users who went furthest above or below aver- ers engaged with specific widgets. He commented that he wanted
age in utilization of different article features or time spent on the to see specific metrics for different parts of the interactive content.
page. Throughout the plot the usage patterns of neighboring clus-
Q4. The article featured a slider allowing readers to adjust a pa-
ters of readers tended to be quite similar, indicating a continuum of
rameter of a two-dimensional embedding. Were readers engag-
engagement behavior rather than clearly separable groups.
ing with this slider? If so, how were they using it?
Q5. At the end of the article readers could click on buttons to
6.2. The Beginner’s Guide to Dimensionality Reduction see details about three different dimensionality reduction algo-
rithms. Clicking a tab caused the visualization to be redrawn us-
The Beginner’s Guide to Dimensionality Reduction was submitted
ing the corresponding algorithm. Were readers examining these
to the IEEE VisxAI workshop, posted to Twitter, and subsequently
details? Were they engaging with the visualization in order to
appeared on the Data Science community on Reddit, and on data-
understand different algorithms’ output?
camp.com. The post received 7,055 visits from 4,549 readers; 3,170
sessions were on desktop devices. When discussing Q4, the author commented “If I had a distribu-
tion of slider values, I could see how people were using it. If it’s
6.2.1. Aggregate Statistics bimodal maybe we should have used a button.” The distribution of
values taken on by the slider represents all values with approxi-
The median time spent on the page was 116 seconds (33-386 IQR).
mately equal weight. However, if we look instead at the minimum
76% of readers reached the end of the article. Of the readers who
value that the slider took on, shown in Figure 7, there is clearly
reached the end, 59% clicked one of the buttons to select an addi-
a bimodal distribution. This indicates that very few readers left
tional algorithm. This means that 41% of the readers who “finished
the slider in the middle without first moving it to the lower end
the article” did not read all of the content. The details of the other
of the range. The readers tended to rarely interleave usage of the
algorithms weren’t necessary for the high-level takeaways of the
slider and hovering over artworks—only ~5% of readers did this—
articles, but they were needed for informed application of the tech-
indicating that readers weren’t spending time examining the conse-
nique in practice. The median number of times a reader hovered
quences of moving the slider, and that this presentation was not as
over an artwork was 4, the median number of interactions with the
effective as intended. Overall about 45% the readers engaged with
algorithm details button and with the slider was zero. Many read-
the algorithm details buttons. Only about 15% of readers used one
ers quickly bounced from the page. However, many readers also
of these buttons and subsequently engaged with the visualization.
engaged with the article, interacting with the various widgets and
some manipulating features a great many times. Graphs of the us-
6.2.2. Observations from ScrollHop
age distributions of key article variables are available as supple-
mentary material. The median time that mobile readers spent on the We noticed several trends when observing the scroll behavior for
page was 40 seconds (10-131 IQR). 48% of mobile readers reached this article. First, the data seem to display much heavier horizontal
the final content of the article, and of those 38% utilized the func- banding than either of the other two articles, indicating that readers
tionality to observe details of the other algorithms. Across the arti- were spending more time pausing to read content. Because this is
cles we consistently noticed that many mobile readers would con- both the most technical and the most didactic of the three articles
sume all of the textual content even though they did not engage with this pattern is not surprising. Readers tended to scroll through in a
interactive features. This is likely due in part to the fact that these linear manner, working their way forward through the article, sel-
articles were designed with desktop readers in mind, and though dom jumping between sections. This may imply that the content
c 2019 The Author(s)
Computer Graphics Forum c 2019 The Eurographics Association and John Wiley & Sons Ltd.M. Conlen, A. Kale, & J. Heer / Capture & Analysis of Active Reading Behaviors for Interactive Articles on the Web
Figure 8: Example scroll paths from the Beginner’s Guide to Di-
mensionality Reduction. (A) shows a reader who skimmed the be-
ginning of the article, but spent more time in the later sections; (B)
shows a reader who quickly reached the end of the article, spent
time there, and then went back to re-read earlier content.
was well motivated and well matched to the audience, or it may be
an artifact of our design choice to use scroll-based waypoints and
animations, perhaps making the process of switching sections more
burdensome than free-scrolling. As with all of the articles we no-
ticed a preview & read behavior, where users would quickly scroll
down the page before scrolling back up and either bouncing or con-
tinuing to read through at a slower pace. We also noticed that some
readers would progress quickly downwards into the story before
pausing at one of the sections and continuing to engage more heav-
ily (Figure 8.A). This may indicate that the content after a certain
point in the article was well matched to their background, or that
the article’s design piqued an interest [GB18]. Some readers went
back and re-read sections after finishing the content (Figure 8.B).
6.2.3. Observations from Readuction
Figure 9 shows the UMAP projection for desktop readers of this
article. Most readers cluster into one mass, with several smaller
“tendrils” detached from the main group. This view was helpful in
allowing us to identify subsets of users based on where they spent
their time and what they interacted with. Using the selection feature Figure 9: UMAP projection of feature vectors for Beginner’s Guide
we further identified groups of readers who exhibit similar behav- to Dimensionality Reduction readers. The projection reveals broad
ioral quirks, such as leaving the web page open for some time be- clusters of readers, such as those who consume all the content,
fore actually reading the article. Users with no or low engagement those who leave the page quickly, those who engage heavily with
are visible off the main cluster. Within the main cluster we can iden- article features, and those read the content multiple times.
tify users who engaged with interactive components to varying de-
grees, for example, those used the buttons to click through details of
all of the algorithms several times (algorithm explorers), those who interactive features was relatively low: just 14% of readers clicked
engaged heavily with the weight parameter (weight shifters), and the button to play an example of beat frequencies, 2% modified
those who scrolled through the article multiple times (re-readers). the beat frequency playback. For mobile readers, the median time
on page was 41 seconds (10-131 IQR). 82% of mobile readers
advanced through at least some of the content, even though they
6.3. How To: Tune a Guitar
needed to dismiss a warning about download size; however, only
How To: Tune a Guitar was published and posted to Twitter and 34% attempted to tune the guitar and just 6% tuned all six strings.
Hacker News, and was subsequently covered by GIGAZINE, a These observations suggest that mobile users are willing to engage
Japanese news blog, and Codedrops Collective, an online web de- with interactive content, and that the specific interactions should
sign publication. It also appeared in Google search results for the have been refined to better accommodate them. The author-posed
search term “how to tune a guitar.” We collected data from 55,193 questions revealed additional information about reader interactions:
sessions by 46,347 readers, including 27,603 desktop sessions.
Q6. The article featured an interactive guitar widget that would
play audio when a reader hovered over a string. Readers could
6.3.1. Aggregate Statistics
quickly move their mouse over multiple strings to “strum the
The median time spent on the page was 78 seconds (27-210 IQR), guitar”. How many times did readers strum the guitar?
and readers performed a median of 22 “plucks” of the guitar string Q7. The article asked readers to use tuners on the guitar widget
(6-56 IQR), and 42 tuning adjustments (6-119 IQR). 23% of read- to tune the guitar multiple times. How many unique times did
ers tuned all six strings of the guitar. Usage of the more detailed readers actually tune the guitar?
c 2019 The Author(s)
Computer Graphics Forum c 2019 The Eurographics Association and John Wiley & Sons Ltd.M. Conlen, A. Kale, & J. Heer / Capture & Analysis of Active Reading Behaviors for Interactive Articles on the Web
By querying the dataset for interactions with multiple strings
on the guitar in quick succession, we can answer Q6 and deter-
mine how many times readers were strumming the guitar (median
1 strum, 0-3 IQR). Readers triggered the audio playback of an in-
dividual string (median audio triggered 22 times, 6-56 IQR) more
than they strummed, indicating that they tended to use the guitar for
tuning (as the narrative suggested), rather than playing freely. We
answer Q7 by counting the number of times that readers interact
with a guitar tuner, separated by some other interaction on the page.
We found that readers had a median of 1 tuning session (0-4 IQR).
This suggests that most readers did interact with the tuners when
prompted initially, but only the most engaged readers continued to
follow along through the rest of the content, including attempting to
tune by beat frequency. This content may have been too advanced
for readers without musical experience, or users may have been less
inclined to continue interacting after the novelty wore off.
6.3.2. Observations from ScrollHop
Only 45% of readers reached the final section. This completion rate
is considerably lower than the other two articles; this article had
the most content, it also was shared with the largest and most gen-
eral audience. Figure 4 shows four exemplary scroll patterns. As in
other articles, some users would preview and read (A), and some
would scroll and bounce (C); (B) shows a reader playing with the
guitar near the beginning of the article but skimming through later
content; in (D) a reader exhibits balanced engagement.
6.3.3. Observations from Readuction
The UMAP projection (Figure 10) again reveals a central group of
users, separated from notable outliers. Near the edges of the cen- Figure 10: UMAP projection of feature vectors for readers of How
tral cluster we can identify interesting groups, such as super tuners To: Tune a Guitar. This article offered the most polished mobile
who spent most of their time on the page tuning the guitar, mu- experience of the three, and we see a less stark difference in the
sic theory readers who engaged heavily with more advanced topics distributions between the desktop and mobile readers. Through in-
but skimmed through earlier sections, and speed readers who spent teractive use of our Readuction tool we identify clusters of users
less than 10 seconds on average in each section, yet still engaged who exhibit interesting engagement patterns.
with many of the interactive components. Of the three articles, this
plot shows the least obvious separation between mobile and desk-
top readers, likely stemming from the fact that this article offered this work. Certain behaviors were consistent across the articles, in-
the most polished presentation on mobile devices and readers could cluding patterns of scrolling through content and the distributions
still engage with many of the interactive features. However, we also of some aggregate usage statistics. We conclude by sharing recur-
noticed a large group of mobile readers who engaged with interac- ring findings and implications of our techniques and analysis.
tive content but did not finish the article, possibly indicating that the
novelty of the guitar interaction had worn off or that these readers
7.1. Recurring Reader Behaviors
were responding to other time or environmental issues. We noticed
a group of desktop readers separated from the main cluster who at- We saw many readers quickly scroll through article content before
tempted to interact with the guitar but did not appear to do anything leaving the page [BDF15] or engaging in depth (preview & read).
else on the page; we believe that these users may have hit a bug re- This suggests that readers make an initial assessment for quality
lated to the Chrome WebAudio API that some users had reported. and content, and aligns with prior work which found that aesthet-
ics play a large role in the levels of user engagement [GB18]. We
found that readers who do interact display a continuum of behav-
7. Discussion
iors and do not necessarily fall into clearly separable groups. While
Through our case studies of article instrumentation and analysis, many readers interacted with the articles in a manner that suggests
we have demonstrated the feasibility of large-scale in situ deploy- they are following the narrative, some readers will engage dispro-
ment and logging to study interactive article readers, and validated portionately with various article components, likely matching on
the use of our proposed tools to gain insights into reader behavior. content that they find the most relevant. Both form and content
We observed many nuanced patterns of reader engagement, includ- seemed to impact behavior: in Beat Basiscs, which allowed for
ing some that corroborate prior research and some that are new to free scrolling between sections, readers would often backtrack to
c 2019 The Author(s)
Computer Graphics Forum c 2019 The Eurographics Association and John Wiley & Sons Ltd.M. Conlen, A. Kale, & J. Heer / Capture & Analysis of Active Reading Behaviors for Interactive Articles on the Web
compare the behavior of different interactive audio widgets; in the be synthesized to produce article dashboards for real-time tracking
Beginner’s Guide to Dimensionality Reduction, a highly technical by authors and editors. The system can operate by analyzing usage
article, readers would progress through the article linearly, pausing of all Idyll variables (or a user-defined subset), and support link-
in each section to consider the content. A list of all observed recur- ing between views, for example highlighting ScrollHop traces of
ring reader behaviors is available in the supplementary material. reader sessions selected in the Readuction tool.
There has been a debate in the data journalism community about Further work is needed to adapt HopScroll to articles which
the effectiveness of interaction [Tse16, Bau17, Ais18]. One sugges- don’t rely on the browser’s built-in scrolling functionality for con-
tion is that content central to a narrative should not be hidden be- tent navigation. For example, an article which utilizes a stepper or
hind a click [Tse16]. In this work we similarly saw that if details slideshow motif may not require the reader to scroll at all. In these
were only revealed after a click, readers may never see it. In Be- cases we expect that the same visualizations will be effective, so
ginner’s Guide to Dimensionality Reduction, roughly half of desk- long as reader progress can be modeled as a linear progression with
top readers and 38% of mobile readers who made it to the end of a corresponding progress fraction. In addition, we do not yet ren-
the article clicked to reveal more details about the projection al- der desktop and mobile reader data simultaneously in HopScroll
gorithms. This may indicate that some readers were not aware of because the different article layouts lead to differences in where
the functionality, or that they were content with more high-level the content is displayed on the page and makes comparison diffi-
information. On the other hand, we also found that readers were cult. A normalization step is needed to visualize and compare the
more likely to interact with widgets which played a central role in scroll behavior of these two groups directly.
the narrative. This can be seen in the high usage levels of the gui- The use of Idyll to author these articles greatly simplified article
tar widget in How To: Tune a Guitar, the artworks in Beginner’s instrumentation: in addition to scroll position, we could track all
Guide to Dimensionality Reduction, and the rhythm wheels in Beat changes to Idyll’s state to produce relevant reader feature vectors
Basics. This indicates that users are willing to engage with inter- and queries to answer author inquiries. These experiences point to
active content on the page, but most are focused on content that is the value of domain-specific languages or design tools to not only
crucial to the central narrative. author content, but help evaluate its use. To enable more system-
For each of the case study articles, we noticed that the time that atic study of the effects of different choices or article structure or
mobile users spent with the content was lower than that of desktop presentation, future work might augment Idyll to support authoring
users. The median time spent on page for mobile users was 23-52% alternative versions in parallel. Akin to A/B testing, Idyll’s runtime
of the median time of desktop users. As more articles are evaluated, and analytics system could then assign incoming readers to article
it should be possible to refine these statistics to better understand versions, enabling experimental control at the language level.
how a mobile article is performing relative to a desktop one, even
if we expect readers to spend less time with the content. The re- 7.3. Implications for Future Research
sults from How To: Tune a Guitar indicate that mobile users desire
A difficulty of conducting research on interactive articles “in the
to view this style of content, and the majority (86%) are willing
wild” is access to log data from a broad audience, especially when
to click through a warning note about application download size,
private media companies are reticent to share metrics publicly. One
indicating that developers should take care to consider these users,
possibility is to use Mechanical Turk, but it is not clear that crowd
noting that they are often equal to or greater in number than desk-
workers behave in the same manner as intrinsically-motivated on-
top readers. Mobile readers utilized fewer of the available interac-
line readers. A nice property of interactive articles is that there is
tive features than their desktop counterparts, but still largely fol-
an online community who is interested in consuming this type of
lowed the presented narratives. This result indicates that designers
content. During the course of this research we took care to design
should ensure that the narrative is intact and comprehensible even
articles in such a way that they would be appealing to specific au-
if a reader chooses not to engage with the interactive widgets.
diences as entertaining and educational, regardless of the fact that
they were also being used for research.
7.2. Tooling for Capture and Analysis
Our work demonstrates that publishing public content is a vi-
To understand diverse reader behaviors, we found it critical to pro- able complement to laboratory studies and paid crowdsourcing.
vide insight into both aggregate (macro) behavior and individual This approach introduces article design challenges beyond stan-
(micro) experiences [Tuf90]. For example, both our HopScroll and dard research design issues, but holds the promise of more com-
Readuction visualizations provide overviews of user behavior and prehensive and realistic study of narrative visualization. We ad-
reveal clusters, while also supporting inspection of the particulars vocate that research goals in this domain should be pursued by
of individual traces. We found the smooth alternation between these studying authentic stories of genuine interest to the authors and
levels of detail to be indispensable. Formulating metrics in con- intended readers. We hope the contributions of this paper provide
junction with domain experts, on the other hand, helped to check first steps down this path, and expect that controlled comparisons of
author assumptions and key interaction patterns that might not oth- article variants can be performed using these tools and methodol-
erwise be clear in the mass of log data. Going forward, our pre- ogy. To facilitate future research, our instrumentation and analysis
sented tools can be used to automatically generate interactive re- tools will be available as open-source software as part of the Idyll
ports. Given author-guided queries as input, the various compo- project, and the full interaction logs from our case studies are avail-
nents described above — log analysis, aggregate statistics, feature able online at https://s3-us-west-2.amazonaws.com/
vector calculation, and resulting interactive visualizations — could interactive-analytics-eurovis/data.zip.
c 2019 The Author(s)
Computer Graphics Forum c 2019 The Eurographics Association and John Wiley & Sons Ltd.You can also read