Arctic permafrost thawing - Impacts on high latitude emissions of carbon dioxide and methane - JRC Publications Repository
←
→
Page content transcription
If your browser does not render page correctly, please read the page content below
Arctic permafrost thawing

                       Impacts on high latitude
                       emissions of carbon dioxide
                       and methane

                       Dobricic, S.
                       Pozzoli, L.

                       2019

                                                     EUR 29940 EN
This publication is a Science for Policy report by the Joint Research Centre (JRC), the European Commission’s science and knowledge
service. It aims to provide evidence-based scientific support to the European policymaking process. The scientific output expressed does
not imply a policy position of the European Commission. Neither the European Commission nor any person acting on behalf of the
Commission is responsible for the use that might be made of this publication. For information on the methodology and quality underlying
the data used in this publication for which the source is neither Eurostat nor other Commission services, users should contact the
referenced source. The designations employed and the presentation of material on the maps do not imply the expression of any opinion
whatsoever on the part of the European Union concerning the legal status of any country, territory, city or area or of its authorities, or
concerning the delimitation of its frontiers or boundaries.

Contact information
Name: Srdan Dobricic
Address: European Commission, Joint Research Centre, Directorate C: Energy, Transport and Climate, Air and Climate Unit, via E. Fermi
2749, 21027 Ispra - Italy
Email: srdan.dobricic@ec.europa.eu
Tel.: +39 0332 786376

EU Science Hub
https://ec.europa.eu/jrc

JRC109379

EUR 29940 EN

   PDF          ISBN 978-92-76-10182-6                ISSN 1831-9424            doi:10.2760/007066

   Print        ISBN 978-92-76-10201-4                ISSN 1018-5593            doi:10.2760/83312

Luxembourg: Publications Office of the European Union, 2019

© European Union, 2019

The reuse policy of the European Commission is implemented by the Commission Decision 2011/833/EU of 12 December 2011 on the
reuse of Commission documents (OJ L 330, 14.12.2011, p. 39). Except otherwise noted, the reuse of this document is authorised under
the Creative Commons Attribution 4.0 International (CC BY 4.0) licence (https://creativecommons.org/licenses/by/4.0/). This means that
reuse is allowed provided appropriate credit is given and any changes are indicated. For any use or reproduction of photos or other
material that is not owned by the EU, permission must be sought directly from the copyright holders.

All content © European Union, 2019.

How to cite this report: Dobricic, S. and Pozzoli, L., Arctic permafrost thawing, EUR 29940 EN, Publications Office of the European Union,
Luxembourg, 2019, ISBN 978-92-76-10182-6, doi:10.2760/007066, JRC109379.
Contents

Acknowledgements .......................................................................................................................................................................................................................................... 1
Executive summary .......................................................................................................................................................................................................................................... 2
1 Introduction..................................................................................................................................................................................................................................................... 3
2 Current and future temperature increase in the Arctic ........................................................................................................................................ 8
        2.1 Current near-surface temperature trends ........................................................................................................................................................... 8
        2.2 Future near-surface temperature trends ..........................................................................................................................................................10
3 Potential for methane and carbon dioxide release from permafrost thawing ...........................................................................14
        3.1 Present and future carbon availability in unfrozen soils....................................................................................................................14
        3.2 Carbon dioxide emissions from microbial degradation .......................................................................................................................18
        3.3 Methane emissions from boreal wetlands ......................................................................................................................................................20
        3.4 Methane emissions from the Arctic Ocean......................................................................................................................................................23
4 Impact of permafrost degradation on infrastructures.......................................................................................................................................24
5 Conclusions ..................................................................................................................................................................................................................................................26
References .............................................................................................................................................................................................................................................................28
List of abbreviations and definitions ...........................................................................................................................................................................................31
List of boxes.........................................................................................................................................................................................................................................................32
List of figures .....................................................................................................................................................................................................................................................33
List of tables ........................................................................................................................................................................................................................................................35
Annexes ....................................................................................................................................................................................................................................................................36
        Annex 1. Supplementary figures .............................................................................................................................................................................................36

                                                                                                                                       i
Acknowledgements

We would like to thank the reviewers of this report Thomas Diehl, Peter Bergamaschi, Peeter Part, and
Frederic Bastide.

Authors
Srdan Dobricic and Luca Pozzoli (European Commission, Joint Research Centre, Directorate C: Energy, Transport
and Climate)

                                                      1
Executive summary
The strong amplification of global warming in the Arctic accelerates the rate of thawing of permafrost. This
process could produce a positive feedback on global warming by emitting carbon into the atmosphere in the
form of methane (CH4) and carbon dioxide (CO2). The EC and EEAS Joint communication to the European
Parliament and the Council "An integrated European Union policy for the Arctic", and also the EU Global Strategy,
call for the analysis and adaptation to large environmental changes in the Arctic permafrost. This report
therefore evaluates the ongoing and future warming over the Arctic permafrost. It estimates the permafrost
thawing rate and current and future emissions of CO2 and CH4 from the carbon deposit stored in the
permafrost.
By using atmospheric model simulations of the last decades constrained by observations, i.e. atmospheric
reanalysis, the report shows that Arctic amplification of global warming in the last decades is mainly due to
warming over ocean and sea-ice in winter and over land in summer. During the last decades there are no
significant positive trends of near-surface temperatures over land in winter. In the last decades summer trends
of near-surface temperature over land in the Arctic are positive and similar to trends over global land areas.
When permafrost thaws its carbon content becomes available for microbial degradation and it is released into
the atmosphere in the form of CO2 and CH4. It is found that total CO2 emissions in the 21st century will not
differ significantly between different RCP scenarios, because in all scenarios a large portion of carbon stored in
the permafrost will become available for degradation by microbes. Current anthropogenic CO2 emissions are
at least ten times higher than emissions from the thawing permafrost. On the other hand, the reduction of
global warming envisaged by the Paris agreement will require diminishing of anthropogenic emissions already
in the first half of the 21st century. In this case future CO2 emissions from the permafrost may become
comparable to anthropogenic emissions and Paris agreement targets to reduce the global warming may be
exceeded sooner than expected. The quota of CO2 that humankind can emit to keep below the agreed level of
global warming will likely diminish and additional efforts for achieving Paris Agreement goals will be required.
The literature review indicates that in the 21st century methane emissions from current permafrost areas over
the land and Arctic Ocean will likely double or be several times higher than ongoing emissions. Although the
warming potential of methane is much higher than the warming potential of CO2, most of current estimates of
future methane emissions indicate less significant impacts on global warming than those from CO2. Eventual
large emissions from methane hydrates stored at the Arctic Ocean bottom or sudden large CH4 releases from
permafrost in the 21st century are very difficult to predict, but they might more significantly impact the global
warming rate.
Furthermore, thawing of permafrost endangers ecosystems and infrastructures at the local and regional scale,
impacting local communities by limiting resource development and fragmenting ecosystems. Understanding of
local processes with a sufficient spatial and temporal coverage will require a combination of field studies,
remote sensing analysis and modelling approaches.
The results of this report may support the EU policy for the Arctic by providing additional evidence on the
changing Arctic permafrost and presenting the range of estimates for emissions of CO2 and CH4 in the 21st
century. The results may also provide a scientific contribution to the EU efforts in implementing the Paris
agreement goals. In particular, they may support the EU science policy in the Arctic by emphasizing the need
for the long term monitoring and predicting of permafrost thawing and its emissions of greenhouse gasses, in
order to reduce the currently large uncertainties in estimating future impacts of permafrost thawing on climate
change. In the future the methodology for estimating emissions of greenhouse gasses from the thawing
permafrost developed in the report may be used with new scientific estimates of the emission rates and
different climate scenarios including those that are more stringent than the Paris agreement.

                                                        2
1    Introduction
Permafrost is defined as the ground having layers with temperatures continuously below the freezing point for
two or more consecutive years. Permafrost is usually formed below the ground surface. It may exist in northern
latitudes, alpine regions, and polar coastal areas below ocean surface. Over land it typically forms when yearly
averaged atmospheric temperatures are lower than the freezing point. If yearly averaged temperatures are
close to the freezing point permafrost typically forms discontinuously into the sporadic permafrost. When yearly
averaged temperatures are significantly lower than the freezing point, the discontinuous permafrost covers a
larger fraction of the ground and at yearly averaged temperatures of -15°C permafrost typically becomes
continuous.
In the Northern Hemisphere permafrost covers about one quarter of land surface. It is mostly present at
northern latitudes, inland in areas distant from the influence from oceans and at high elevations following the
0°C isotherm of near-surface atmospheric temperatures. In Siberia and Canada permafrost surrounding the
Arctic may extend southward to 50°N (Fig. 1). The permafrost coverage also varies from sporadic at lower
latitudes to continuous in the Arctic (e.g. AMAP 2015).

         Figure 1. Land area covered by permafrost north of 45°N based on data from Hugelius et al (2014).

In summer, close to the surface, permafrost temperature may become higher than 0°C. The active layer is
defined as the depth at which temperatures above the freezing point extend into the ground. They further warm
frozen layers until reaching the depth at which temperatures become practically unchanged. Further in deep
layers the geothermal warming limits the expansion of the frozen layer (Fig. 2). The sketch shows the annual
minimum and maximum temperatures, which meets at the depth of zero annual amplitude, and continue
following a common profile in the ground, with a linear geothermal gradient. A change in slope of the
temperature profile occurs at the base of ice-bearing permafrost, which is caused by the difference in the
thermal conductivities between frozen and unfrozen ground, at the base of permafrost. The annual mean

                                                        3
permafrost surface temperature, TPS, is defined extrapolating the temperature profile with a linear geothermal
gradient upward.

Figure 2. Schematic representation of vertical temperature profiles of permafrost layers (the figure is an adaptation from
                                        Figure 1 of Osterkamp and Burn, 2003).

Permafrost extension and its thermal properties dynamically change with time. The main driver of permafrost
extension and depth is the atmospheric temperature. Locally permafrost evolution may be influenced by snow
cover, organic content in the soil, vegetation at the surface, soil moisture and drainage properties of the ground.
These local conditions may change heat propagation in the ground and modify effects of atmospheric
temperature on permafrost variability (e.g. AMAP 2015).

Box 1. Permafrost and estimated carbon content in frozen soil

In the past permafrost extension and thickness have experienced large changes. Permafrost was formed during
periods of cold climate. Conditions for its formation became possible with climate cooling starting 40 million
years ago (Schuur et al. 2015). About 20 thousand years ago, during the last glacial maximum, a thick layer of
permafrost formed over land areas of North America, Asia and Europe. In this period, when the sea level was
more than 100 m lower than today, permafrost also developed over continental shelf areas of the Arctic Ocean
(Schuur et al. 2015). Subsequently, during the late Pleistocene and Holocene epochs it became submerged
under the sea water. Since then permafrost extension was reduced to current levels. During the cold period
between 1600 and 1850 shallow permafrost occurred in some areas, but since 1850 permafrost warms and is
generally reduced in the northern Hemisphere (e.g. Schuur et al. 2015).
Past changes in climatic conditions over the permafrost area resulted in accumulation of deposited vegetation
creating large concentration of organic carbon in the soil. It is estimated that near the surface (i.e. the three
meters deep soil layer) the Arctic permafrost contains 1035 Pg (1 Pg = 109 tonnes) of carbon with the 95%
confidence interval of 150 Pg (Schuur et al 2015). Fig. 3 shows the distribution of carbon content above 3 m
depth over land obtained from the dataset by Hugelius et al. (2014).

                                                            4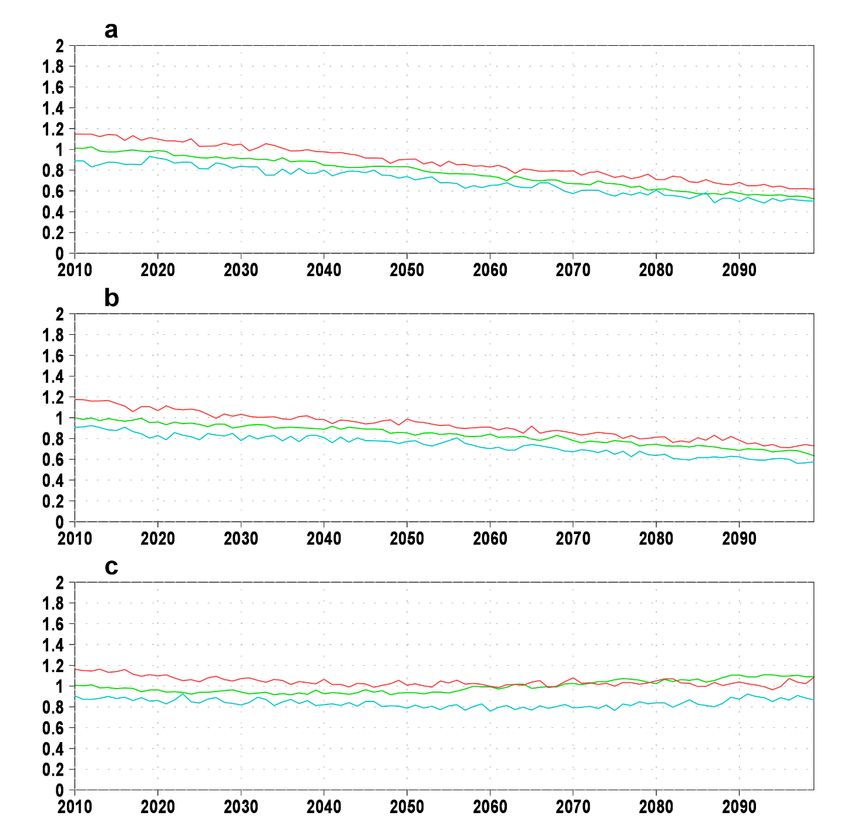
During the last Ice Age significant deposits of organic carbon in the soil, named yedoma, are also accumulated
below 3 m depth in Siberia and Alaska with mass estimated to vary between 210 and 450 Pg. It is further
estimated that in the Arctic additional 350-450 Pg of organic carbon may be stored between 3 and 10 m depths
outside of the yedoma region. Carbon content estimates over the costal shelf of the Arctic Ocean are very
uncertain and largely unquantified. Although during the last Ice age 2.5 times larger permafrost area had been
probably formed over the Arctic Ocean than over the yedoma region, sea water that subsequently covered the
continental shelf maintained temperatures at the soil surface above the freezing level. These conditions could
have significantly increased soil temperatures providing conditions for slow mineralization of organic carbon
deposits by microbes in low oxygen conditions, thus reducing the size of the organic carbon pool (Schuur et al.
2015). In total, the carbon pool over land is estimated to be between 1300-1600 Pg, of which about 400 Pg
are below the depth of 3 m, while there is an additional quantity over continental shelf of the Arctic Ocean
(Schuur et al. 2015). In the Arctic Ocean there are between 2 and 1400 Pg of permafrost carbon (James et al.
2016). In addition, the Arctic Ocean contains between 100 and 9000 Pg of carbon in the form of methane
hydrates (James et al. 2016).

 Figure 3. Carbon content (kg C/m2) in the near surface layer of permafrost within the depth of 3 meters based on data
                                              from Hugelius et al (2014).

When permafrost thaws, organic carbon becomes exposed to the microbial activity. As a consequence the
ground layer emits greenhouse gasses into the atmosphere. At the large spatial scale the decomposability of
carbon in permafrost layers mainly depends on the carbon to nitrogen ratio of the organic matter (Schuur et al.
2015). Microbes process organic carbon for energy and grow by using nitrogen released during the
decomposition process. According to this ratio soils can be roughly divided into organic with carbon to nitrogen
ratio above 20% and mineral with lower ratios (Schuur et al. 2015). It is experimentally found that at soil
temperatures of 5 °C the decomposition rate of carbon in organic soils is 17%-34%, while in mineral soils it is
6%-13% per decade (Schuur et al. 2015). Oxygen concentration in the soil saturated by carbon is another factor

                                                          5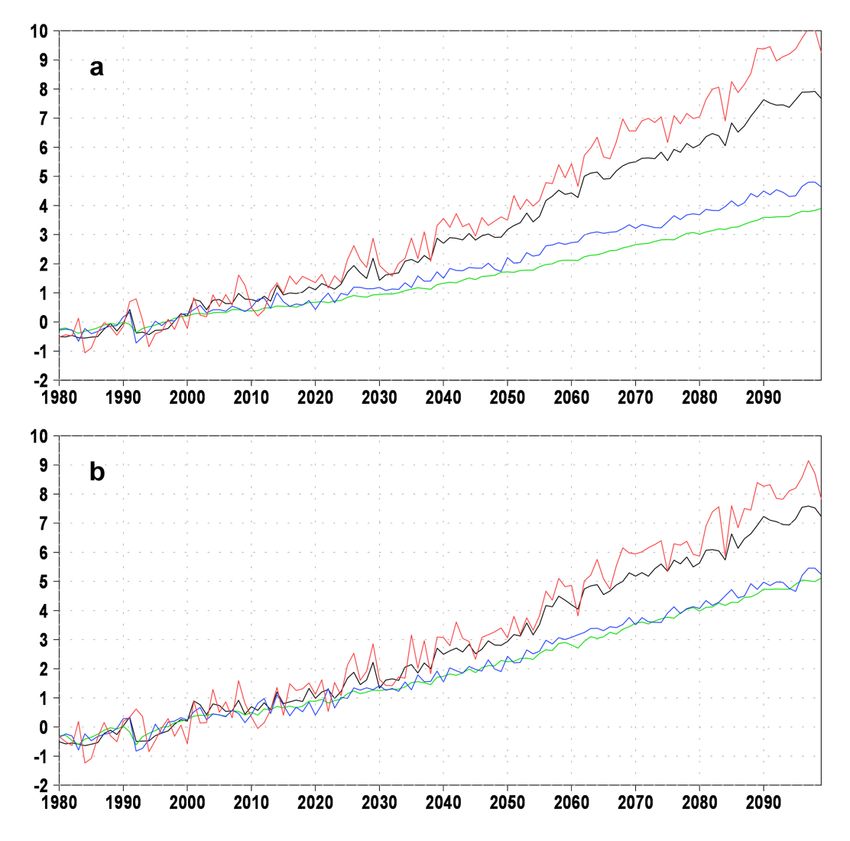
controlling the decomposition. Generally, emissions from thawed dryer soil with aerobic conditions contain less
methane and more carbon dioxide than emissions from wetter soil with anaerobic conditions (Schuur et al.
2015). Although methane is a much stronger greenhouse gas than carbon dioxide, its global warming impact is
distributed over the shorter time period. The atmospheric lifetime of carbon dioxide is also much more complex
and may depend on many factors (Archer et al. 2009). On the decadal scale emissions from wet anaerobic soils
would more strongly impact global warming by emitting more methane, but over hundred years long time span
emissions from dryer soils could become more important for global warming due to longer impact of carbon
dioxide (Schuur et al. 2015). These estimates on emission rates from different soil types are mainly based on
controlled laboratory experiments and are still not fully established from field campaigns. There are also other
impacts of the permafrost thawing on global warming, like heat production from microbial metabolism of
organic material (AMAP 2015) and increase of nitrous oxide emissions (Voigt et al. 2017). These additional
impacts will not be evaluated in the study.
Permafrost geographical area is characterized by a low density of population. Depending on the geographical
definition of the Arctic, it is estimated that between 4 and 10 million people live over Arctic permafrost areas
(Blunden and Arndt 2017). The majority of population is in the Russian Federation. Although the Arctic is
abundant with natural resources, harsh climate conditions strongly limit human activities. Oil and gas on land
is mainly located in Western Siberia. Strong dynamical evolution of permafrost due to thawing and freezing
may impact basement of constructions. Many constructions, including infrastructure, residential buildings,
pipelines, roads, railroads and runways, suffer damages due to the seasonal and inter-annual variability of soil
conditions (Blunden and Arndt 2017).
Global warming is particularly enhanced in the Arctic (e.g. Pithan and Mauritsen 2014). Future rise of
temperatures in the Arctic may strongly impact the permafrost by thawing ice at the bottom of the active layer
(Biskaborn et al. 2019, Nitze et al. 2018). This process may strongly impact human activities depending on the
permafrost, ecology over the permafrost area and expose large quantities of organic carbon to microbial activity
producing additional emissions of greenhouse gasses into the atmosphere.
European Union policy for the Arctic, represented in the Joint Communication by the European Commission and
High Representative of the Union for Foreign Affairs and Security Policy to the European Parliament and Council
“An integrated European Union policy for the Arctic” (1), addresses consequences of accelerated thawing of
permafrost by stating: “Greenhouse gases are escaping the permafrost and entering the atmosphere at an
increasing rate. The thawing permafrost has the potential to release carbon dioxide and methane - equivalent
to several times today’s annual greenhouse gas emissions from man-made sources such as fossil fuel use. This
could change the Arctic as well as the global climate.”
The European Union policy for the Arctic is implemented by the Northern Dimension policy2 promoting dialogue
and cooperation in the Arctic and strengthening the stability and sustainable economic development. The
European Union supports the scientific research in the Arctic by financing a number of research projects. In
particular, the ongoing Nunataryuk project 3 studies the processes involving permafrost thawing, the risks for
the local population and impacts on the global society. The European Commission participates in the Working
Groups of the Arctic Council, for example the DG-JRC contributes to the scientific activities of the Arctic
Monitoring and Assessment Programme (AMAP) to estimate the impacts of short-lived climate pollutants in the
Arctic and possible mitigation measures.
The Paris Agreement4 aiming at limiting the global atmospheric temperature increase at 2 °C at the end of the
century aims to: “reach global peaking of greenhouse gas emissions as soon as possible, …, and to undertake
rapid reductions thereafter in accordance with best available science, so as to achieve a balance between
anthropogenic emissions by sources and removals by sinks of greenhouse gases in the second half of this
century.”
The large possible release of CH4 and CO2 from the thawing permafrost may strongly impact the global
temperature change at the end of this and in the next century. It is, therefore, important to estimate already
now the future emissions from the permafrost in order to adjust anthropogenic emissions limiting global
warming at the end of the century.
By evaluating existing data sets and reviewing existing literature, this report will present estimates the carbon
release from the Arctic into the atmosphere due to thawing permafrost in the warmer future climate. In

1 http://eeas.europa.eu/archives/docs/arctic_region/docs/160427_joint-communication-an-integrated-european-union-policy-for-the-arctic_en.pdf
2 https://eeas.europa.eu/diplomatic-network/northern-dimension_en
3 https://www.nunataryuk.org
4 https://unfccc.int/sites/default/files/resource/docs/2015/cop21/eng/10a01.pdf

                                                                                                         6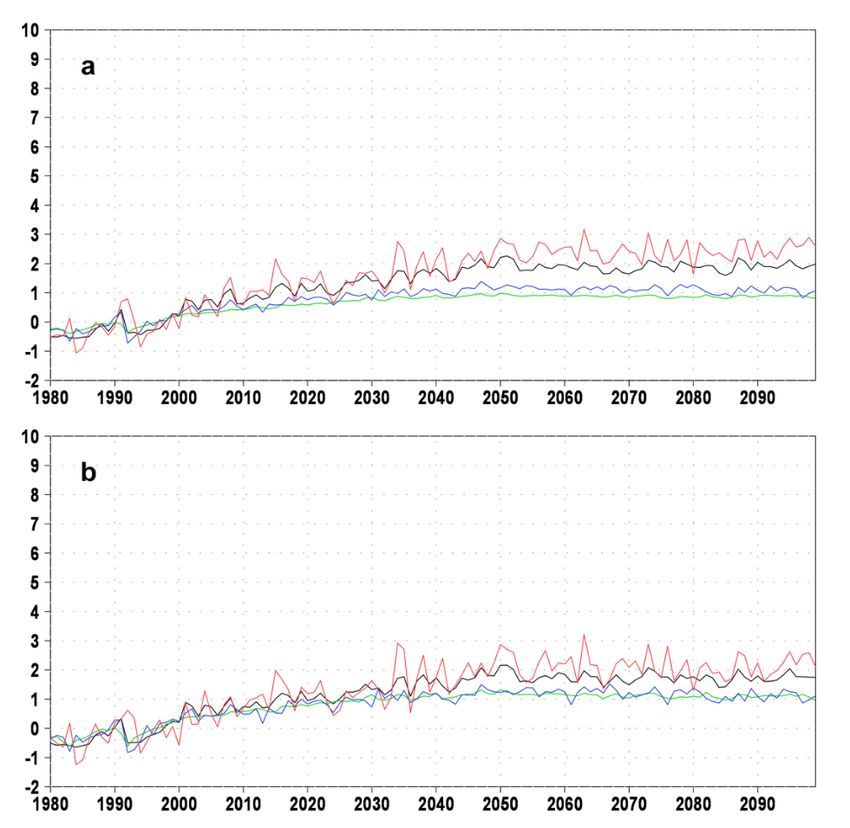
particular, it will make estimates for current and future natural emissions of CH 4 in the Arctic and compare
them with CO2 emissions in the Arctic and globally. It will also address the impact of thawing permafrost on
constructions in the Arctic, by evaluating the influence of thawing on energy exploration, production and
transport. Some emerging aspects of the permafrost thawing, like the risk of outbreaks of infective diseases
(e.g. Revich et al. 2011), release of long-term accumulated pollutants (e.g. Schuster et al. 2018) or global
economic aspects (e.g. Hope Schaefer 2016), will not be considered in the study and may be included in future
reports estimating impacts of permafrost thawing.

                                                     7
2 Current and future temperature increase in the Arctic
2.1 Current near-surface temperature trends
Global warming impacts temperatures in the Northern hemisphere in a non-uniform manner. During the last 35
years, since 1980, satellites provide continuous observations of the Earth surface. In this period, it is observed
that, although there is a general warming trend, some areas and regions experience strong increase of
temperatures, while in others changes appear to be negligible or there is even a cooling trend.
Box 2. Estimates of temperature trends
One way to estimate ongoing changes in the atmosphere, surface ocean and land is to use atmospheric
reanalysis produced during the period with satellite observations from 1980 till today. In this period satellites
mainly observe change of temperatures on the Earth surface, change of sea-ice and snow cover, intensity and
direction of winds over the ocean, and atmospheric irradiances that provide information on mean temperature
of the atmospheric column. Most of land and ocean areas in the Northern Hemisphere are also covered by in
situ observations at the surface of a large number of parameters, temperature and wind observations made by
commercial airplanes, while many vertical soundings observe temperature, humidity and winds. In situ
observations are, however mainly located in densely populated areas. Over the northern latitudes and especially
in the Arctic there are much less in situ observations than over the lower latitudes.
In Fig. 4 two independent reanalysis products, ERA-INTERIM and NCEP, show that in winter the strongest
warming is over the Arctic Ocean. Over the Middle East, South-East Asia, the western Pacific Ocean, Central
America and the tropical Atlantic Ocean warming is also strong and consistent in both analysis. In lower latitudes
there is cooling trend over the eastern Pacific Ocean. In both ERA-INTERIM and NCEP reanalysis the strongest
warming is in the Atlantic sector of the Arctic Ocean indicating reduction of sea-ice cover over the Barents Sea
and between Canada and Greenland. On the other hand, the warming in Alaska and land areas of Northern
Canada is generally weaker and inconsistent in the two reanalyses. Furthermore, both ERA-INTERIM and NCEP
indicate a strong cooling trend in Siberia. The only land area in the Arctic with a clear warming trend in winter
is North-Eastern Canada close to the strong sea-ice melting area between Canada and Greenland. Over other
land areas near-surface temperatures in winter do to not change systematically or even have a negative trend.
In both ERA-INTERIM and NCEP reanalyses in summer trends over lower latitudes are similar to those in winter
(Fig. 5). Warming trends are present over the Middle East, South-East Asia, Central America, the western Pacific
Ocean and tropical Atlantic. The cooling trend over the eastern Pacific Ocean is weaker than in winter. In higher
latitudes, there is approximately uniform warming over land and ocean. Warming is more intense in Eastern
and Central Siberia, Alaska and north-eastern Canada.
Mostly non-existing warming trends in winter and strong warming trends in summer over the land in the Arctic
indicate that the seasonal change of temperatures over the permafrost becomes larger. Furthermore, warmer
summer temperatures may thaw deeper layers of ground. As a consequence, we may expect a trend of larger
seasonal temperature evolution in the permafrost active layer. The minimum active layer temperatures should
not change significantly, while summer temperatures should become higher and the active layer should become
deeper.
8Box 3. Atmospheric reanalysis
Atmospheric reanalysis combine information from short term forecasts by the global atmospheric model with
all satellite and in situ observations in a dynamically and statistically optimal way that is as much as possible
consistent throughout the analysed time period. In an implicit way, this procedure combines the best theoretical
knowledge with historical information from different instruments, parameters and makes the best possible
estimates in areas lacking dense observational networks. The uncertainty of reanalysis strongly depends on the
availability of observations. This reduces their accuracy over the Arctic Ocean where temperature observations
are sparser than over populated regions of the Northern Hemisphere. On the other hand, over the land even in
the Arctic observational network is sufficiently dense to resolve large-scale spatial distribution of near-surface
temperatures. At the seasonal scale satellite observations of sea-ice coverage and sea surface temperature
should be sufficiently accurate for the evaluation of trends. In this report estimates of trends of physical
parameters over the land and ocean will be made by using ERA-INTERIM reanalysis made by the European
Centre for the Medium Range Weather Forecasting (ECMWF) (Dee et al. 2011) and National Centre for
Environmental prediction (NCEP) reanalysis (Kalnay et al. 1996). The differences between estimates by ERA-
INTERIM and NCEP will indicate uncertainties. Both reanalysis cover period after 1980 when satellite
observations provide additional observations over the Arctic.
Although their relative importance has not been established yet, several local processes may accelerate the
Arctic warming. In summer, due to global warming larger areas of the ocean and land become free of ice and
snow. The change of albedo from almost fully reflecting white surface to the almost fully absorbing water or
land surface accelerates the accumulation of heat in the ocean and ground (Serreze and Francis, 2006;
Kashiwase et al., 2017). In a feedback process heat accumulated in the ocean and ground accelerates warming
in the surrounding regions.
Figure 4. Linear trend of near-surface temperature in winter (December-January-February) (°C/decade) between 1980
and 2015. a) ERA-INTERIM reanalysis and b) NCEP reanalysis.
The Arctic may also warm more rapidly than the global average due to the deposition of black carbon on the
sea-ice (Clarke et al., 1985). Even small concentrations of deposited black carbon may modify the albedo and
accelerate the sea-ice melting. Another important process for the amplification of arctic warming is the global
temperature feedback (Pithan and Mauritsen, 2014). Consistently with the Plank law, the same additional flux
of heat produces larger temperature increase when the background atmospheric temperature is colder due to
the lower infrared radiation back to the space. This process alone is sufficient to significantly increase the
warming rate in the Arctic with respect to the tropics. Another process associated with the global temperature
feedback is that in the tropics additional heat at the surface is redistributed by convective clouds into the upper
troposphere, while in the higher latitudes, due to the stronger vertical stability, it remains confined to the
surface. Oscillations over the tropical Pacific Ocean (Ding et al., 2014) or variability of the middle latitude sea
surface temperatures (Peings and Magnusdottir, 2014; Perlwitz et al., 2015) may initiate long-standing
9planetary waves that increase the advection of northward transport from the middle latitudes into the Arctic
and regionally enhance the warming. Warming of the Atlantic Ocean can create positive anomalies in the
oceanographic heat transport into the Arctic (Årthun et al., 2012). As a consequence, sea-ice melting in the
Arctic Ocean may be accelerated starting the feedback process that may influence temperature trends over the
surrounding land.
Figure 5. Linear trend of near-surface temperature in summer (June-July-August) (°C/decade) between 1980 and 2015.
a) ERA-INTERIM reanalysis and b) NCEP reanalysis.
Trends shown in Figs. 4 and 5 are consistent with trends estimated by objective analysis of near surface
temperatures in which estimates in areas not covered by observations are obtained by interpolating in a
statistically optimal way from points with observations (e.g. AMAP 2015). The change between 1980 and 2015
of annually averaged temperatures over the region north of 60°N is 1.9°C in the ERA-INTERIM reanalysis (Fig.
12, in the Appendix) and 1.2°C in the NCEP reanalysis (Fig. 13, in the Appendix). The change between 1980 and
2012 of annually averaged temperatures over the same region is estimated by three objective analysis to be
1.6°C (AMAP 2015) that is similar to the change estimated by ERA-INTERIM and NCEP estimates.
2.2 Future near-surface temperature trends
The evaluation of future near-surface temperature trends in the Arctic in relation to the global warming may
be made from Coupled model intercomparison project version 5 (CMIP5, Taylor et al., 2012) numerical
simulations (Box 4). In particular, the evaluation of temperature will be made by using the CESM model with
the horizontal resolution of approximately 1° latitude x 1° longitude. The numerical model simulation has 6
ensemble members initiated with slightly different initial conditions. This particular model is selected instead
of the whole ensemble, because it has the largest number of layers in the soil and ensemble members. It also
has a high horizontal resolution when compared to other CMIP5 models. Two Representative Concentration
Pathways (RCP) scenarios will be used. The first is RCP 2.6 that, with respect to the reference period between
1986 and 2005, at the end of the 21st century predicts 1 °C higher global temperatures averaged over all CMIP5
model simulations. The second is RCP 8.5 that at the end of the 21 st century predicts 3.7 °C higher global
temperatures.
Fig. 6 shows that in RCP2.6 scenario at the end of the 21 st century yearly averaged temperatures rise to two
times higher values over the Artic than globally. In the Arctic, there is also a larger interannual variability and
variability between ensemble members as indicated by the larger spread of estimates. When only land points
are included in the calculation of temperature change there is a similar increase of yearly averaged
temperatures over the Arctic with respect to global temperature rise. The amplification of global warming in
the arctic is seasonally dependent. In winter there is a strong amplification and the large interannual variability.
On the other hand, in summer the amplification is almost inexistent. In particular, in summer land points become
warmer at the same rate as the globally averaged values over land.
10Figure 6. CESM ensemble mean of near-surface temperature change in the RCP2.6 scenario: yearly averaged global
temperature (green), yearly averaged temperature north of 60°N (black), winter (January-February-March) averaged
temperature north of 60°N (red) and summer (June-July-August) averaged temperature north of 60°N (blue). Panel a
shows averages over land and ocean, and panel b averages only over land.
In RCP 8.5 scenario the ensemble mean reaches globally averaged temperatures in 2100 that are 3.8 °C warmer
than the 1986-2005 mean values (Fig. 7). There is a strong warming amplification in the Arctic reaching
temperatures that are 7.5 °C warmer than the 1986-2005 mean. Like in the RCP 2.6 scenario the amplification
is strongly pronounced in winter with values that are 10 °C higher at the end of the 21st century. In winter, there
is also the largest interannual variability. In summer the Arctic amplification is much smaller and there is a
smaller interannual variability. Over land the amplification is slightly weaker in winter. Like in the RCP 2.6
scenario, in summer land areas in the Arctic have the same warming rate like global land areas.
CESM estimates in the period forced by historical drivers may be compared to reanalysis estimates presented
in the previous section. In the Appendix, Fig. 14 shows that, in agreement with reanalyses shown in Figs. 12 and
13, in the period 1980-2015 CESM simulations show globally increasing temperatures and Arctic amplification
of global warming.
Figure 7. Same as Fig. 6, but for RCP 8.5 scenario.
11Over land areas the Arctic warming in CESM simulation is enhanced in winter and practically equal to the global
land warming in summer. This differs from the reanalyses estimates. In the reanalyses the warming is
significant in summer, while in winter there is no tendency. Also, in the reanalyses only in summer there is the
enhancement of Arctic warming.
The disagreement in estimating the seasonal cycle of Arctic enhancement of global warming may be important
for estimating the warming of permafrost. In CESM the yearly averaged Arctic amplification of warming of soil
in deeper layer appears to be due to enhanced Arctic warming in winter, because higher winter temperatures
contribute to summer warming by producing spring temperatures closer to the freezing point and facilitating
the penetration of heat into the soil in summer. On the other hand reanalysis indicate that currently the warming
of deeper soils is mainly due to higher temperatures in summer that may produce deeper active layers.
The fact that CESM simulation in CMIP5 agrees with the reanalysis in estimating the Arctic warming about twice
as large as the global average should be carefully interpreted when estimating the impact on the soil
temperature. Higher summer trend of near-surface temperature in the reanalyses indicates that near-surface
soil temperatures are also higher than in the CESM simulation providing conditions for the more intense
microbial activity producing carbon fluxes into the atmosphere.
12Box 4. CMIP5 and RCPs
The fifth phase of the Coupled Model Intercomparison Project (CMIP5) provided a framework for coordinated
climate change experiments for the fifth Assessment Report (AR5) of the Intergovernmental Panel on Climate
Change (IPCC). The multi-model experiments provided the opportunity to assess the mechanisms responsible
for model differences in poorly understood feedbacks associated with the carbon cycle and with clouds, to
examine climate predictability and to explore the ability of models to predict climate on decadal time scales,
and, more generally, to determine why similarly forced models produce a range of responses. More than 20
climate models participated to the CMIP5 experiments and their results are freely available (e.g. http://www.ipcc-
data.org/sim/gcm_monthly/AR5/Reference-Archive.html). The CMIP5 experiment design was finalized with the
following suites of experiments: Hindcasts (historical) simulations; future "long-term" simulations; "atmosphere-
only" (prescribed SST) simulations for especially computationally-demanding models.
The simulations of the climate in the future follow the so-called Representative Concentration Pathways (RCPs),
which are not a complete package of socioeconomic, emissions, and climate projections, but consistent sets of
projections of only the components of radiative forcing that are meant to serve as input for climate modelling.
The RCPs were chosen to represent a span of the radiative forcing and facilitate the mapping of a broad climate
space. They therefore do not represent specific futures with respect to climate policy action (or no action) or
technological, economic, or political viability of specific future pathways or climates. Four RCPs were developed
by four independent modelling groups:
— RCP2.6: very low GHG concentration levels, with a peak radiative forcing (RF) of 3.1 W/m2 at mid-
century, dropping to 2.6 W/m2 by 2100, through a substantial GHG emission reductions over time (van
Vuuren et al., 2007).
— RCP4.5: the total RF is stabilized at 4.5 W/m2 before 2100 by employment of a range of technologies
and strategies for reducing greenhouse gas emissions (Clarke et al. 2007; Wise et al (2009).
— RCP6.0: the total RF is stabilized at 6.0 W/m2 after 2100 without overshoot by employment of a range
of technologies and strategies for reducing greenhouse gas emissions (Fujino et al. 2006, Hijioka et al.
2008).
— RCP8.5: increasing greenhouse gas emissions over time representative for scenarios in the literature
leading to high greenhouse gas concentration levels (Riahi et al. 2007).
133 Potential for methane and carbon dioxide release from permafrost
thawing
Methane emissions from permafrost thawing are especially important due to high warming effect in the
atmosphere. On the other hand, large emissions of carbon dioxide may also significantly impact global warming.
Although carbon dioxide has a smaller warming effect than methane, it remains for long time in the atmosphere.
It is, therefore, important to estimate how much carbon in the permafrost will be available in the future for the
microbial degradation and provide emission source for both atmospheric methane and carbon dioxide. The
largest microbial activity over the permafrost area is in summer when near-surface temperatures are the
highest. Due to global warming near-surface temperatures will rise and the active layer will warm. As a
consequence active layer may either become deeper, or its temperatures may rise while its depth may remain
invariant.
In the next sections we provide an estimate of the total carbon in soil which may be available in the future for
microbial degradation (Section 3.1) with consequent emission of carbon dioxide (Section 3.2). The carbon
content that is available for microbial degradation is estimated by combining estimates of soil temperatures
by reanalysis (Box 2) and CMIP5 simulations (Box 3) with estimates of total carbon content per square meter
over the permafrost area from Hugelius et al. (2014) (Box 1). ERA-INTERIM and NCEP reanalysis are used in the
period 1980-2015. CMIP5 ensemble simulations by three models (CESM, IPSL and MPI) are used to estimate
change of soil temperature in three RCP scenarios, RCP 2.6, 4.5 and 8.5 (Box 3). The discussion of current and
future methane emissions associated to permafrost thawing and boreal wetlands formation, as well as deposits
of methane-hydrates in the Arctic Ocean is based on the latest scientific studies (Sections 3.3 and 3.4).
3.1 Present and future carbon availability in unfrozen soils
For our estimates we have used monthly mean temperatures in soil layers of the atmospheric reanalysis and
CMIP5 climate models. The depth of the active layer is estimated from the freezing level calculated from the
linear interpolation of temperatures between the maximum level at which the temperature is above the freezing
level during the year and the level below. The carbon content is then calculated by integrating the mass of
carbon content estimated by Hugelius et al. (2014) from the lowest freezing level to the surface. The carbon
content below the depth of 3 m is not considered in this study.
Fig. 8 shows the estimated change between 1980 and 2015 of carbon content in the active layer with
temperatures above 0 °C in summer. ERA-INTERIM and NCEP analysis show that the mean active layer becomes
larger due to global warming (Fig. 8a), although the rise of carbon content is small with respect to the mean
value. It is also smaller than the average difference between ERA-INTERIM and NCEP reanalysis. The three
historical CMIP5 ensemble simulations show lower carbon content estimates in the active layer than reanalysis.
They also show the stronger increase of carbon content available for degradation in the last decades.
It is also interesting to evaluate the quantity of carbon in the active layer at higher temperatures than the
freezing point. At higher temperatures the microbial activity is stronger (e.g. Schuur et al. 2015). Fig. 8b shows
carbon content in the active layer in summer that is at temperatures higher or equal to 5 °C. By using
experimental data it is assumed that these temperatures provide environmental conditions for a larger microbial
decomposition than temperatures between 0 °C and 5 °C (e.g. Schuur et al. 2015). In ERA-INTERIM and NCEP
carbon content at temperatures above 5 °C is about two thirds of the carbon content above the freezing point.
Both reanalysis show very similar estimates. The trend in the reanalysis is especially pronounced in the last 20
years. It starts from 500 Pg in 1995 and reaches almost 600 Pg in 2015. Like in the case of temperatures
above the freezing point, the three CMIP5 ensemble simulations show lower estimates of carbon at
temperatures above 5 °C than the two reanalysis with values that are about two thirds of values estimated in
the active layer. On the other hand, trends of CMIP5 simulations are very similar to those estimated by the
reanalysis.
These findings may be compared with other studies involving estimates of the exposed carbon content from
CMIP5 simulations made by simplified models similar to the one used in this study (Koven et al. 2013, Burke
and Jones 2013). Those studies show a large divergence between different CMIP5 model estimates of carbon
content inside the active layer. On the other hand, this study selected CMIP5 models with the largest number
of vertical levels and ensemble members and the highest horizontal resolutions. It is assumed that these models
may provide the most accurate simulation of soil temperatures. With this selection, the differences between
CMIP5 model estimates of carbon content inside the active layer are approximately constant throughout the
evaluation period and all models show very similar trends. In the period 1980-2015 trends are further similar
to those estimated from the reanalysis.
14Figure 8. Estimated carbon content in the permafrost (Pg) in summer (June-July-August) between 1980 and 2015: a)
inside the active layer and b) in the soil with temperatures higher than 5 °C. Soil temperatures are estimated by ERA-
INTERIM reanalysis (full black), NCEP reanalysis (dashed black), mean of 6 CESM CMIP5 simulations (green), mean of 3
IPSL CMIP5 simulations (red) and mean of 3 MPI CMIP5 simulations (cyan). CMIP5 simulations used historical forcing
between 1980 and 2005, and RCP 2.6 forcing after 2005.
While in ERA-INTERIM and NCEP carbon content in the active layer differs by a constant value throughout the
period spanning the last decades, above 5 °C the two reanalysis show almost identical estimates. The reason
is that reanalysis use climatological temperatures at bottom layers of their land models. These estimates may
differ and impact estimates of active layer depths. The isotherm of 5 °C is closer to the surface. It is less
influenced by climatological values at the bottom of the land model and more by conditions at the surface. Due
to very similar surface forcing in the two reanalysis carbon content estimates above 5 °C are also very similar.
In CMIP5 simulations bottom layer temperatures are not constrained by climatology and their trends of carbon
content are stronger than in the reanalysis. Due to more similar forcing conditions in CMIP5 simulations and
reanalysis, CMIP5 estimates of trends of carbon content at temperatures above 5 °C become very similar to
trends in the reanalysis. Similar trends between the CMIP5 simulations and reanalysis indicate that during the
last decades CMIP5 simulations correctly depicted the change of carbon content in the active layer and at
temperatures above 5 °C. This may give confidence in interpreting future estimates of carbon content under
different global warming scenarios.
Figure 9. Estimated carbon content in permafrost (Pg) in summer (June-July-August) between 2006and 2100: a) inside
the active layer and b) in the soil with temperatures higher than 5 °C. Soil temperatures are estimated by ERA-INTERIM
reanalysis (full black), NCEP reanalysis (dashed black), mean of 6 CESM CMIP5 simulations (green), mean of 3 IPSL CMIP5
simulations (red) and mean of 3 MPI CMIP5 simulations (cyan). CMIP5 simulations were forced by RCP 2.6 scenario.
15In the 21st century the carbon content in the active layer estimated by CMIP5 simulations changes accordingly
to carbon dioxide concentration scenarios. In RCP 2.6, corresponding to global warming of 1 °C in 2100, the
total change between the beginning and end of the 21st century is modest and comparable to the total change
in last three decades (Fig. 9a). In RCP4.5, which corresponds to global warming of about 2 °C in 2100, the rate
of change is stronger and similar to CMIP5 estimates of the current rate the current rate (Fig. 15a, Appendix).
In RCP8.5, with global warming of about 4 °C in 2100, the rate increases to almost twice the current rate (Fig.
16a, Appendix).
In RCP 2.6 total carbon content above 5 °C isotherm does not change significantly between the beginning and
end of the 21st century (Fig. 9b). In RCP 4.5 it continues to rise by the similar rate as in the last decades (Fig.15b,
Appendix). At the end of the century it reaches values that are about 25% higher than current estimate. In RCP
8.5 the rise accelerates reaching values that are almost twice as large as the current estimates (Fig.16b,
Appendix).
The spatial structure of carbon content change in the 21 st century in the RCP 2.6 scenario shows that, while in
some areas it becomes larger, in other areas it remains unchanged or even diminishes (Fig. 17, Appendix).
Different models provide very different spatial distributions. This indicates that differences are mainly due to
internal climate variability that is differently simulated in each CMIP5 ensemble, while global warming has a
small impact. In the RCP4.5 scenario areas with increasing carbon content dominates in all CMIP5 ensembles,
but still the spatial distribution may differ (Fig. 18, Appendix). In this scenario global warming influences total
values, but the spatial distribution is still strongly influenced by the internal climate variability. In the RCP 8.5
scenario carbon content increases with a more similar spatial distribution among CMIP5 ensembles. Still there
are some significant differences in the distribution with areas that show reductions (Fig. 19, Appendix). Even in
16this scenario the internal climate variability may strongly influence the spatial distribution of areas in which
carbon content becomes available for the microbial activity in summer.
Figure 10. Linear trends of carbon content (Pg C/y) at temperatures above 0 °C (top) and above 5 °C (bottom) in the
historical period (1986-2005) and for the three RCP scenarios in the 21st century (2006-2100). All trends are statistically
significant at 0.05 value. Trends do not contain estimates of microbial activity.
Figs. 17-19 in the Appendix show that often the reduction of carbon content in the active layer is associated
with the increase of carbon content at temperatures above 5 °C. The reason for this relationship may be that,
due to soil and vegetation properties, the increase of near-surface temperatures by global warming may
increase energy in the soil in two distinct processes. In one process warming of the soil penetrates deeper. The
additional energy is used for thawing permafrost, while due to the diffusion of colder temperatures from lower
layers, the 5 °C isotherm may move upwards. On the other hand, if the additional energy due to warming does
not penetrate deep and does not thaw additional layers at the bottom, it increases temperatures in the active
layer and lowers the 5 °C isotherm. In the second process the unchanged or even shallower active layer depth
may result in larger microbial activity and carbon emissions from the ground due to higher temperatures close
to the surface.
Table 1. Difference between mean carbon content (Pg) estimated by CMIP5 simulations in periods 2006–2100 and
1986–2005. Differences are made for carbon content at temperatures above 0 °C and 5 °C. Values are given for each
CMIP5 ensemble and for the average among all three ensembles.
Carbon content above 0°C Carbon content above 5°C
CESM IPSL MPI Mean CESM IPSL MPI Mean
RCP 2.6 64 29 47 47 34 51 49 45
RCP 4.5 94 62 78 78 67 73 69 70
RCP 8.5 134 120 132 129 142 126 112 127
17Trends of carbon content available for degradation by microbes are summarized in Fig. 10. As discussed in
previous paragraphs, during the last decades the reanalyses show a smaller positive trend of carbon continent
in the active layer than simulations, probably due to fixed climatological temperatures at the bottom of the
land model. Trends of carbon content above the 5 °C isotherm are similar in reanalysis and the CMIP5
simulations indicating that CMIP5 simulations correctly simulate the warming speed at the surface. With respect
to the last three decades, in the 21st century RCP 2.6 and 4.5 scenarios reduce trends of carbon content available
for microbial activity, while the trends are increased in the RCP 8.5 scenario. The mean additional carbon content
available for degradation by microbes in the 21st century is listed for each CMIP5 ensemble in Table 1.
3.2 Carbon dioxide emissions from microbial degradation
By combining carbon content estimates at temperatures above 5 °C with estimates on microbial degradation
rate at these temperatures obtained in laboratory experiments (Schuur et al. 2015) it may be possible to
estimate carbon emissions into the atmosphere. It is assumed that all emissions are from the dry soil and
contribute to the increase of atmospheric carbon dioxide, while methane fluxes are mostly from wetlands
requiring only a small fraction of available carbon content. Assuming that the soil is mainly mineral and dry
about 1% of soil exposed to microbial degradation at temperatures above 5 °C could be emitted into the
atmosphere each year (Schuur et al. 2015). The amount of carbon emissions into the atmosphere each year
will, therefore, depend on soil temperature in that year and the rate of depletion of carbon stored in the soil in
previous years. A model based on these assumptions may estimate the total emission of carbon in the 21 st
century.
The model is integrated from 2000 with the initial carbon content estimate from Hugelius et al (2014). Each
year 1% of carbon content at temperatures above 5 °C is added to atmospheric emissions and carbon content
is reduced by the same amount. Model estimates of carbon emitted into the atmosphere in different RCP
scenarios are shown in Fig. 11.
In the RCP 2.6 scenario emissions start to diminish already before 2030.The temperature rise in this scenario
is slow and after 2020 every year less carbon is emitted into the atmosphere. In this scenario, global
temperatures become lower after 2040. This further reduces the rate of emissions reaching about one half of
initial values in 2100. In the 21st century emissions are reduced also in the RCP 4.5 scenario. In 2010 in the
RCP4.5 scenario emissions are higher than in the RCP 2.6 scenario. Although in the RCP 4.5 scenario global
temperatures do not diminish emissions are reduced due to the depletion of carbon content in the soil by the
microbial activity. By the end of the 21st century emissions are lowered by about 25%. Throughout the 21 st
century emissions in the RCP 8.5 scenario are similar, indicating that the increase of global temperatures
producing conditions for the larger microbial activity is mostly compensated by the microbial uptake and
reduction of carbon content in the previous years.
Figure 11. Emissions into atmosphere of carbon present in the permafrost (Pg C/y): a) RCP 2.6, b) RCP 4.5 and c) RCP 8.5.
Ensemble means are represented by green (CESM), red (IPSL) and cyan (MPI) lines.
18Emissions from the existing permafrost carbon in the 21st century are 80 Pg C in RCP2.6, 85 Pg C in RCP 4.5
and 97 Pg C in RCP 8.5. The estimate of 97 Pg C in RCP 8.5 is in a very good agreement with the mean estimate
from 8 studies of 92 Pg C (Schuur et al. 2015). It is interesting that, although emissions diminish in RCP 2.6 and
4.5 scenarios, cumulative values are only 20% and 15% lower than in the RCP 8.5 estimate. Estimated yearly
emissions averaged over the 21st century in all scenarios are approximately 10% of current global
anthropogenic emissions.
The microbial degradation rate may vary around the 1% average between 0.5 and 1.5% within the 0.95
confidence interval (Schuur et al. 2015). The sensitivity of emission estimates on 0.5 and 1.5% degradation
rates is shown in Figs. 20-21 (Appendix). In the case of 0.5% degradation rate carbon emissions are significantly
lower and in the case of 1.5% rate they are significantly higher than with the 1% rate. In all cases emissions in
different RCP scenarios are similar in the first half of the 21st century, while at the end of the century RCP 8.5
scenario is characterized by significantly higher emissions.
When calculating the total carbon over the permafrost area it is also necessary to estimate the increase of
carbon content in the soil due to the stronger growth of plants and carbon content in new plants over the
warmer soil (Koven et al. 2011, Schaphoff et al. 2013). This process may be more rapid than the depletion of
the old carbon in the soil. When taking into account the vegetation development, during most of the 21st century
the permafrost area may become a sink of atmospheric carbon. On the long term, towards the end of the 21 st
century, the sink due to the vegetation impact on carbon content stabilizes and the permafrost zone should
become an atmospheric source of carbon (Koven et al. 2011, Schaphoff et al. 2013). By including the vegetation
development, it may be estimated that in 2100 in RCP 2.6 there will be a small net increase of soil carbon
19You can also read