Implementation Plan for the Global Drought Information System Global Initiative - Group on Earth ...
←
→
Page content transcription
If your browser does not render page correctly, please read the page content below
Implementation Plan for the Global Drought Information System
                           Global Initiative

1    EXECUTIVE SUMMARY

The Global Drought Information System (GDIS) developed in part out of the Integrated Global
Observation Strategy—Partnership (IGOS-P) Water Cycle (IGWCO) and partly out of the World
Climate Research Program (WCRP) Grand Challenge on Extremes (for drought). It also developed
partly as a USA-National Oceanic and Atmospheric Administration (NOAA)’s formation of the North
American Drought Monitor, which encompassed a vision to develop continental drought monitors in
other continental locations, as well. The IGOS-P strategy part of GDIS’s origin reflected the World
Summit on Sustainable Development as it “is to address how well user requirements are being met by
the existing mix of observations and how they could be met in the future with a better integration and
optimization of remote sensing (space-based) and in situ systems.” In short, one impetus for GDIS
was to develop new observational systems or their better integration with existing systems, in order to
upgrade drought management, as found in areas lacking comprehensive meteorological and
hydrological grids.
This Implementation Plan covers the time span for the 2020-2022 Work Plan; some tasks will spill
over or roll over beyond (drought prediction and early warning, for example). Section III, the
“Stakeholder and Capacity Building” section summarizes the drought monitoring carried out within
some regional drought associations across the globe with which GDIS is partnered, as well as laying
out the strategy for how GDIS can offer contributions that may improve drought management within
these selected areas within Europe, across Africa, Southern and Eastern Asia, and North and South
America.
The IGOS-P strategy outlined above, as well as the WCRP Grand Challenge on Extremes objectives
have been further narrowed within the monitoring annex outlined within the COP21 Agreement of
Parties. In keeping with these objectives, GDIS assesses and proposes the improvements in global
infrastructure required to better monitor and predict droughts and heat waves for early warning and
disaster prevention, all the while providing capability to monitor changes in the extremes of drought
and heat waves as global warming and global climate change intensifies. This latter infrastructure
improvement in observations will help in developing “State of the Climate” reports.
GDIS provides global drought coverage within the USA National Integrated Drought Information
System (NIDIS). To provide an example of how GDIS will improve global infrastructure within the
2020-2022 Work Plan, GDIS will test whether global drought monitoring is improved by moving
beyond purely land-based DWD Global Precipitation Climatology Centre (GPCC) precipitation station
observations to a new space-based global precipitation satellite blended with GPCC’s land stations.
Many regions of the globe, such as Sub Saharan Africa, do not meet World Meteorological
Organization (WMO) recommendations for a minimal sampling density requirement for
meteorological station placing. As a result of the scarcity of precipitation measurement points, GPCC
must make extensive extrapolation of precipitation fields from only a sparse number of sampling
locations. The new system would include space-based observations to improve measurement of the
distribution of precipitation during the monsoon seasons. GDIS has already commenced initial testing
whether NOAA Climate Prediction Center (CPC) Morphed (CMORPH) global precipitation improves
drought monitoring over the land-based GPCC system, by testing differences between the
Standardized Precipitation Index (SPI) mappings produced from each system. Secondly, GDIS will
test improvements under the JAXA/NASA Global Precipitation Measurement mission’s enhanced

                                                  1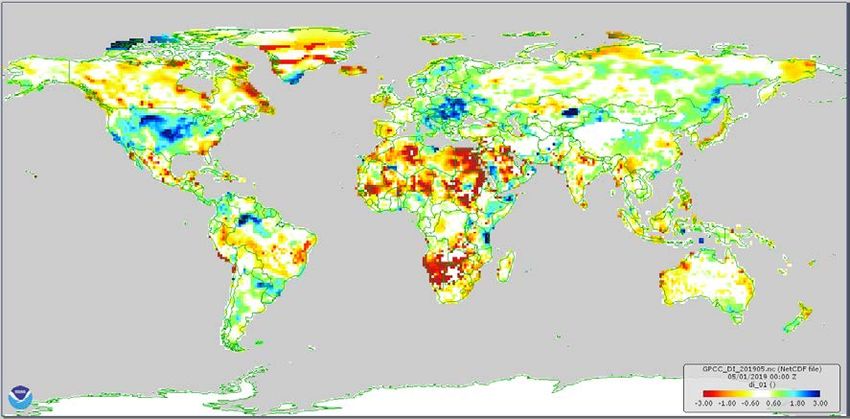
precipitation constellation, relative to the GPCC land-based grid. GDIS is also investigating whether
nanosatellites or cubesats, such as Raincube, could further improve precipitation measurement over
some critical locations, and whether expanded coverage should be added to the Precipitation
Constellation Group within Committee on Environmental Satellites (CEOS). The purpose of
documenting incremental improvements is to furnish enhanced drought mapping to the regional
drought centers.
Drought monitoring and prediction is transnational and even transregional, encompassing atmospheric
and ocean conditions, such as the El Nino Southern Oscillation or the Indian Ocean Dipole that extend
over vast distances over the globe, while retaining local factors, falling within national boundaries,
such as hydrological factors of low river water level, anomalously low soil moisture, or diminished
glacial meltwater. The purpose of GDIS under the WCRP Grand Challenge on Extremes was to
recommend a set of defensible, consistent drought-monitoring criteria and standards that could be
uniformly applied across the globe, across the different national drought management systems, and
were also grounded upon measurable physical processes. Two methodologies which are commonly
deployed within many, if not all, regional drought centers are Standardized Precipitation Index, the
WMO-recommended standard for measuring any deficiency in incoming precipitation over an area, as
well as, secondly, water stress mapping within crops and vegetation. Copernicus has assembled brief
explanations of the remote sensing wavebands and approaches used for vegetation
monitoring https://land.copernicus.eu/global/products/FAPAR
GDIS partner, Princeton University Land Surface Hydrology Working Group, monitors model-
estimated soil moisture through two regional drought monitors, one for Africa and one for South
America, that are accessible via the GDIS website. In addition, soil moisture anomaly maps are made
available for the European Community by the European Commission Joint Research Center (European
Drought Observatory), also accessible through the GDIS portal. The NIDIS portal reproduces EDO
coverage within its interactive map. The WMO-launched South Asia Regional Drought Center’s
(International Water Management Institute) SPI mapping over South Asia is also available.
Much of regional drought center drought vegetation coverage is based upon moderate scale MODIS
imagery which is too coarse to map the scatter of small subsistence plots in Sub Saharan Africa,
Southeast Asia, Central America, and elsewhere. Within the 2020-2022 Work Plan, GDIS will test
whether incremental improvement is made by deploying nanosatellite coverage (Planet) for vegetation
drought monitoring, relative to that provided by the commonly used vegetation mappings currently
employed.
GDIS will also test additional drought monitoring benefit from deploying evapotranspiration-based
drought monitoring. The mappings are derived from global radiation observations, many from
geostationary satellites. The combined precipitation and evapotranspiration global maps provide the
ancillary benefit of independently validating statistics collected by each country pursuant to the Water
Sustainable Development Goal (SDG) mapping of global water stress, helping meet GEO’s strategic
goals Step-by-step-methodology-6-4-2_Revision-2017-01-19_Final-1.pdf .
Another GDIS role is to make available a one-stop-shop of actionable drought and heat wave-related
information which complements WMO’s drought management website, promulgated following from
the          WMO          High-level         Meeting          on         National        Drought
Policy http://www.droughtmanagement.info/pillars/monitoring-early-warning/.
The ability to monitor and predict the formation and intensity of droughts in near-real-time is limited
at the global level (Pozzi et al 2013; Nijssen et al 2014). After about 10 days, whatever information is
provided by initial conditions is lost, and the atmosphere becomes chaotic and impossible to predict.
However, anomalous atmospheric circulations—combined with anomalous land or ocean conditions—
can persist, extending from two weeks to a year, and such persistence can lift predictions above
randomness in some cases, so that predicted droughts emerge in a sample among different model
ensembles launched with different initial conditions. Global Drought prediction works by adding an
upcoming predicted value of precipitation to a series of observed precipitation amounts in previous

                                                   2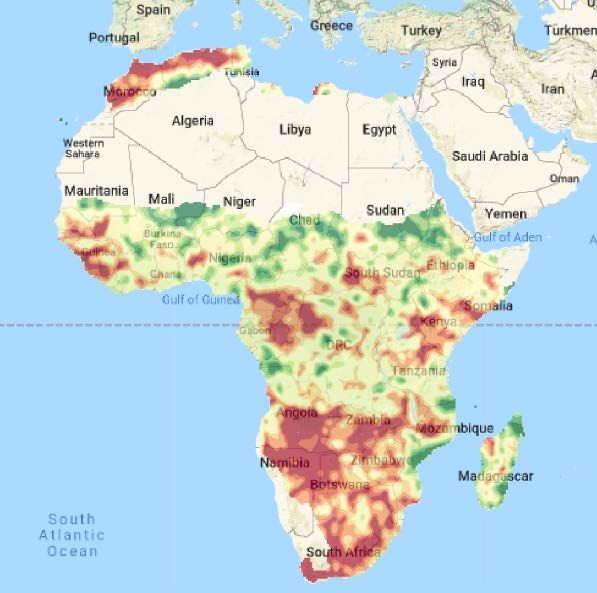
months. Converting the precipitation to Standardized Precipitation Index enables negative grid cell
values to be pinpointed and flagged for possible upcoming drought conditions.
GDIS partnered with the European Framework project, Drought Early Warning System for Africa
(DEWFORA) to test seasonal drought forecasting skill, both over Africa and globally (with ECMWF).
GDIS partner Princeton Land Surface Hydrology Group routinely maps drought predictions using the
North American Multimodel Ensemble (NMME) US and Canadian-based climate models. GDIS,
towards the end of the 2020-2022 Work Plan periods, will develop a data processing stream to
combine these two approaches. ECMWF seasonal forecasts will be included through the Copernicus
Climate Change Service (C3S). This will be the first step moving away from a US-centric system to a
more diversified global forecasting suite of products.
Points of Contact:
Will Pozzi, Will.Pozzi@gmail.com
Richard Heim richard.heim@noaa.gov (US Drought Monitor)
Steve Ansari steve.ansari@noaa.gov (NIDIS portal manager)

2      PURPOSE
As early as the very foundation of GEO itself, during the 1st Earth Observation Summit, the US
Secretary of State Colin Powell included drought prediction as a possible GEO activity:” Working
together, our nations will develop and link observation technologies for tracking weather and climate
changes in every corner of the world…Our cooperation will enable us to develop the capability to
predict droughts, prepare for weather emergencies, plan and protect crops…” A formal proposal was
first introduced during a South Africa 2007 GEO Plenary side meeting to include drought, but not
until GEO Architectural Implementation Pilot 3 (2010) did a pilot global drought monitoring website
produced by Princeton, the JRC European Drought Observatory, University of Technology Vienna),
the US Drought Monitor (NOAA NCEI), the NASA WaterNet project, and the US National Drought
Mitigation Center become a GEO Community Activity.
The WCRP Drought Interest Group and the GEO Community Activity combined forces, setting up the
Global Drought Information System with its objectives (Figure 1), becoming a Global Initiative during
the St. Petersburg Plenary.

    Figure 1 Functions of the Global Drought Information System, outlined in the 1st international GDIS
                                       workshop at Frascati, Italy.

                                                    3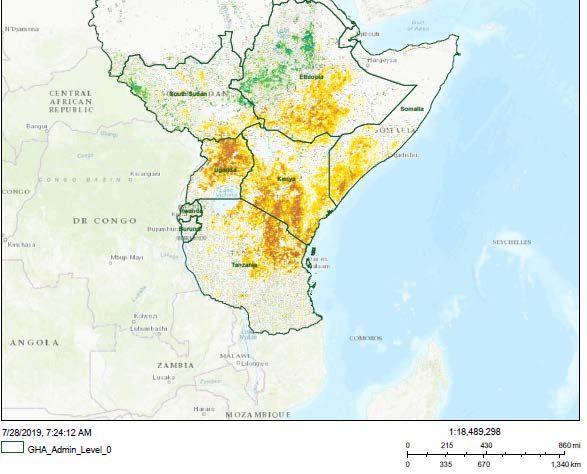
The GDIS international workshops selected the US National Integrated Drought Information System
(in combination with the GEO portal) as a node for displaying mapped drought early warning, mapped
current drought conditions worldwide, and a variety of other tools and educational packages to help
scientists and governments in lesser developed countries to develop drought management capabilities
(Figure 2).

Figure 2 Information Content Categories within the GDIS Portal (Heim, R, “GDIS-Regional Drought
    Monitoring-North American Drought Monitor, South American Drought Workshop 17 Aug)

This was to be carried out in conjunction with the World Meteorological Organization (WMO)
website on drought management, which was a consequence of the WMO High Level Meeting on
National Drought Policy http://www.droughtmanagement.info/pillars/monitoring-early-warning/.
These two web sites are complementary and not competing. GDIS meets the monitoring, as called for
within the Paris Climate Accord (COP21), one of GEO’s strategic goals.
The intended “impact” is to reduce mortality due to famine and to buttress agricultural crop protection
against monsoon failure. Mapped drought forecast, via meteorological drought forecasts,
evapotranspiration forecasts, and soil moisture forecasts will be made available to GEOGLAM (and
FAO/WFP). Drought prediction and monitoring are also linked to wildfire generation.

1   BACKGROUND AND PREVIOUS ACHIEVEMENTS

The US Drought Task Force was sponsored by the NOAA Climate Program Office and NOAA
Modelling, Analysis, Predictions, and Projections (MAPP) with the aim of improving drought
monitoring and forecasting within the USA. The participants were globally-oriented, utilizing the
NASA/GSFC Global Modelling and Assimilation Office (GMAO) (Siegfried Schubert), the Princeton
University Land Surface Hydrology Group (PU) (Justin Sheffield and Eric Wood) and the University
of Washington Civil and Environmental Engineering (Dennis Lettenmaier), and the NASA/GSFC
Hydrological Sciences Branch Global Land Data Assimilation System (GLDAS) (Christa Peters-
Lidard). NOAA Climate Prediction Center was also becoming more sensitized to global factors
within US-based forecasts and monitored conditions (Kingtse Mo). Most of the members of the US
Drought Task Force joined forces with university researchers in Manitoba, Canada, and Zurich,
Switzerland, to form the World Climate Research Program (WCRP) Drought Interest Group (DIG).
DIG joined forces with NOAA National Center for Environmental Information (then National Climate
Data Center) and the members of the Group on Earth Observations 3rd Architectural Implementation
Pilot (European Commission Joint Research Center), Princeton, University of Technology, Vienna,

                                                  4
Austria, University College London, Brazil CPTEC, Argentina governmental meteorological service
SMN, and Australia CSIRO and ABARES in which the AIP-3 group had begun producing a global
drought mapping. Both parties came together formally at the jointly-convened 1st GDIS international
workshop (which was heavily funded by WCRP). The combined forces included African drought
coverage                                       (from                                     Princeton
( https://www.researchgate.net/publication/309470376_Strengthening_drought_risk_management_and
_policy_UNESCO_International_Hydrological_Programme's_case_studies_from_Africa_and_Latin_
America_and_the_Caribbean ), from Europe (JRC’s European Drought Observatory), North America
(the North American Drought Monitor), Australia (Bureau of Meteorology, CSIRO, and ABARES),
South America (Brazil CPTEC), and some limited coverage for Pakistan, Republic of Philippines, and
Jordan.
The 2nd GDIS workshop in December 2014 https://gmao.gsfc.nasa.gov/pubs/docs/Schubert805.pdf
further developed some of the monitoring and forecasting numerical modelling machinery which was
intended for global implementation, as well as hosting a panel on commencing a regional drought
monitoring association for South America. During this workshop, regional partnerships were also
forged with the China Meteorology Administration (CMA), the Drought Management Centre for
Southeast Europe, the UK Met Office, and the Asian Pacific Climate Center. The 2nd GDIS workshop
was heavily sponsored by the World Meteorological Organization which concurrently held the WMO
High Level Meeting on National Drought Policy and, secondly, by NOAA (and NIDIS).
Two European Framework projects further provided centrepieces for the 2nd GDIS workshop, Drought
Early Warning System for Africa (DEWFORA) (Micha Werner) (2011-2013) and the Global Water
Scarcity Information Service (GLOWASIS) (Rogier Westerhoff) (2011-2013), in that these projects
were responsible for ECMWF and JRC drought monitoring and forecasting work over Africa, as well
as globally (GDIS was also a partner). DEWFORA’s global drought forecast results were published:
https://www.hydrol-earth-syst-sci.net/18/2669/2014/hess-18-2669-2014.pdf
Following the 2nd GDIS workshop, Mo (NOAA CPC) and Lyon (IRI) tested global drought
forecasting skill using the North American Multi-Model Ensemble (NMME) at NOAA
CPC: https://journals.ametsoc.org/doi/pdf/10.1175/JHM-D-14-0192.1.

2   RELATIONSHIP OF THE GDIS GLOBAL INITIATIVE ACTIVITIES TO GEO
    ENGAGEMENT PRIORITIES
GDIS, as has been noted above, was identified as an agency for drought documentation as part of the
WCRP Grand Challenge on Extremes. GDIS has a specific role of developing drought chronologies
for different regions (Figure 1) to provide validation in testing drought forecasting skill in
retrospective studies of the ability of different centre’s forecast models to accurately predict prior
drought conditions, in assessing their skill for actual drought forecasting for future conditions. GDIS
participants are directly involved in preparing the NOAA National Center for Environmental
Information’s State of the Climate, including the section on extremes. They are also among the major
players for drought mapping within the USA.

Figure 3 Drought as Impacted by Global Warming (P. Lynch, “The emergence of Numerical Weather
Prediction: Fulfilment of a dream and Realization of a fantasy,” “Mathematics of Planet Earth
Jamboree,” University of Reading, UK, 22-23 March 2016)

                                                  5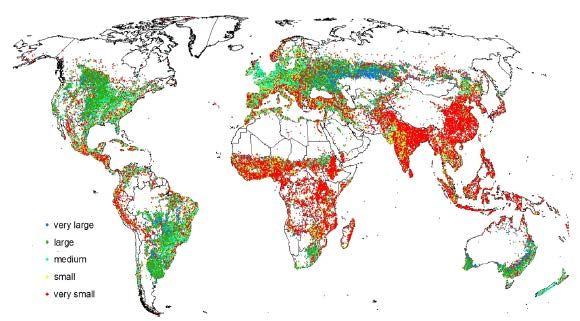
Figure 4 The Role of Earth Observations within the Pillars set up within the Paris Agreement (COP21)
(Articles in the Paris Agreement in which Earth Observation are foundational “Report of the Paris
Agreement,” 10th Programme Board Meeting, 5-6 September 2018 (PB-10.08).
GDIS is also pertinent in providing Earth Observations for the Loss and Damage category as part of
the Earth Observation requirements for the Paris Agreement (Figure 4).
As far as future engagement is concerned, GDIS is focusing all its efforts in that channel which is
likely to have a lasting impact and legacy: setting up reliable, accurate global drought monitoring and
prediction. This will provide the documentary evidence required by IPCC (and NOAA and our
European, Australian, Chinese, African, and South American partners). This will also improve the
State of the Climate reporting (by NOAA).
Secondly, the global precipitation and evapotranspiration Climate Data Records developed by GDIS
overlap with reporting requirements of the water accounting system in the Sustainable Development
Goal 6.4.2 (Step-by-step-methodology-6-4-2_Revision-2017-01-19_Final-1.pdf ). Both issues are
linked, but climate is our priority (and weather hazards).
The outputs of the Global Drought Information System of most relevance to other GEO Global
Initiatives and Flagships are the GEO Global Agricultural Monitoring (GEOGLAM) flagship and the
Global Agriculture Community activity: drought forecasts will advance forward the lead time that
countries have to prepare for crop failures. SPI mapping from global precipitation (GPM) is of
secondary importance, because it monitors “current” conditions within a 3 hour window (or slightly
daily).

3   STAKEHOLDER ENGAGEMENT AND CAPACITY BUILDING
GDIS’s strategy for capacity building is outlined in the original Integrated Global Observations
Partnership (IGOS-P) which emerged out of the World Sustainable Development Summit:
“The principle objective of the Integrated Global Observations Strategy are to address how well user
requirements are being met by the existing mix of observations, including those of the climate
observing system and how they could be met in the future by better integration and optimization of
remote sensing (especially space-based) and in-situ systems.”
The water cycle observations component of IGOS-P became IGWCO (Integrated Global Water
Observations Integration Global Observation Strategy theme). In keeping with his approach, GDIS
assesses how adequately user requirements for drought monitoring are being met at the global level
through the existing mix of observations. Both GDIS and the JRC tap the DWD Global Precipitation
Climatology Centre (GPCC), as a global precipitation source to screen for negative drought zones
after converting the precipitation to Standardized Precipitation Index (SPI). However, there are some
very reservations to using an entirely land-based, precipitation station product. Parts of the world,
including West and East Africa, as well as South East Asia, and Central America have very sparse
land-based grids. The precipitation fields in these regions within GPCC are simply extrapolations

                                                   6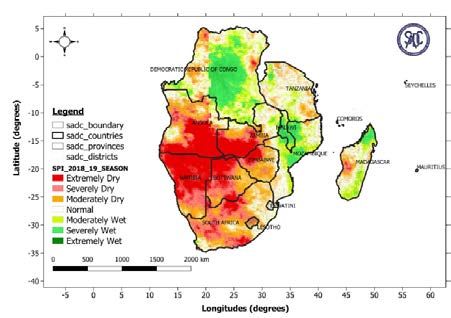
from sparse stations over large or huge domains. Secondly, delays are frequently encountered
transmitting the most recent precipitation measurements to GPCC, so the system is not really geared
for real-time monitoring. The “quick look” product, the only product operative in real-time, offers just
a tiny sample of stations scattered across the whole globe. In keeping with what is stated in the first
paragraph, GDIS carries out evaluations of user requirements for drought monitoring and forecasting
and evaluates their efficacy relative to other possible mixes of space-based or other observations.
Correspondingly, the first evaluation and proposed mix for modernization would be updating the
exclusively land-based global precipitation monitoring system (GPCC) and possibly blending it with a
space-based global precipitation constellation. The two candidates selected for pilot testing are
CMORPH, which has already been placed through some pilot tests, and the Global Precipitation
Measurement mission, particularly the combined TRMM-GPM archive which has a lengthier period
of record. If the resultant upgraded drought monitoring system is validated and improves the spatial
resolution and accuracy with which drought is monitored, GDIS will inform its partners, so that its
partners can include these upgraded monitoring capabilities within their respective centers.
GDIS has partnerships with regions of the globe that have the most advanced meteorological and
hydrological grids: the European Community, Australian Commonwealth, North America, Japan, and
China. GDIS also has partnerships over other regions over the terrestrial Earth that does not meet the
WMO recommendation for minimum meteorological grid sampling density. Within these latter
locations, such as parts of Africa, Southeast Asia, Central Asia, parts of South America, Central
America, and parts of the Philippines and Indonesia, GDIS makes recommendations how to
supplement limited ground-based monitoring sites with space-based monitoring capable of monitoring
over large spatial domains while maintaining high resolution and accuracy. The resultant regional
products, if implemented, can be added as a regional drought map to the GDIS website (GDIS will
also have concurrently the global map, including the portions falling within these regions).
The specialized role of GDIS is, based upon its expertise, to develop the space and time requirements
(the space and time scales) for observations that can modernize and upgrade and improve drought
monitoring and drought management (and drought prediction).            Modernization of space-based
infrastructure may expand the observational network, and while this may be spearheaded within the
USA (within NOAA, for example), the results of these innovations can be shared with other regional
drought associations outside North America and Europe and Australia to other parts of the globe. In
this way, the total global observational capability is being improved, meeting the objectives of the
WCRP Grand Challenge on Extremes and COP21 recommendations on monitoring (as well as
fulfilling improved Disaster and Agricultural monitoring capability).
This section details some of the products of the regional partnerships and how GDIS products would
mesh with these, in improving drought monitoring or forecasting. Forecasting, like monitoring, must
begin within an experimental environment and then be tested for deployment within a production
environment. Extension to drought prediction is much more complicated. While significant drought
prediction “hits” (successes) have been found at monthly time scales, the “false alarms” are also very
high (but smaller than the hit rate). Further methods need to be developed to filter out false alarms as
much as possible. Drought managers must have confidence with a disaster prediction system. The
drought predictive mapping is envisioned as an addition to the Hazard Mapping activities of its
partners.
In addition, GDIS can analyse the requirements for drought and heat wave mapping at the global level,
compare the requirements with existing observational systems, and make recommendations to CEOS
(and through GEO) to upgrade the network. An example is provided by the Precipitation Satellite
Constellation. Geostationary satellites are sited at high altitudes to provide uniform images across
time at half hourly or less time intervals. However, most of the geostationary satellites have relatively
cameras designed for retrieval of relatively coarse spatial imagery. Higher spatial resolutions are
obtained from low earth orbits (Leo). The geostationary satellites have up to now canned for radiation
out of which cloud top temperature is derived. In turn, mathematical relationships are derived

                                                   7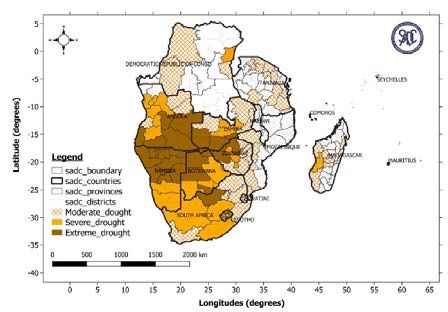
between the cloud top temperatures and the precipitation rates. So the estimation of precipitation is
indirect.
Satellites with microwave imagers measure wavebands closer to the wavebands at which radar detect
precipitation, but the microwaves use not active radar (excepting TRMM and the core GPM
observatory) but microwave radiometers, which produce a more “accurate” estimate but over coarse
resolution. In addition, most of the longer term used passive microwave radiometers are mounted on
polar-orbiting satellites for whom their orbital configuration limits them to only two snapshots per day
over a location. The first step was to integrate together the precipitation samples from the time-
continuous geostationary satellites and the time-intermittent passive microwave sensors. NOAA CPC
“morphed” the precipitation along the tracks of satellites across the data gaps where precipitation
observations were lacking.
The Global Precipitation Measurement mission standardized the process and increased the number of
satellites participating within the precipitation satellite constellation: that was the role of the CEOS
precipitation constellation group. The GPM’s Integrated Multi-satellite Retrievals for GPM (IMERG)
algorithm is used to synthesize a global precipitation picture from participating satellites within the
precipitation satellite constellation. The Global Precipitation Measurement (GPM) constellation
consists of a network of microwave radiometers that are similar but not identical, differing in central
frequency, spatial resolution, and viewing geometry (images become distorted close to the limbs).
The first step toward unified global precipitation in GPM is inter-calibration using GMI as the
reference standard, ensuring observed brightness temperatures are consistent among the sensors,
reducing residuals down to below less than one degree Kelvin (Berg et al 2016).
 However, towards the future, and improving precipitation monitoring, as is the case for monitoring
extremes on sub daily or even hourly time scales, additional launched satellites, such as nanosatellites
and cubesats (such as Raincube) can further expand the precipitation constellation, thereby
augmenting spatial coverage and time coverage with the land-based precipitation sampling stations.
NASA Jet Propulsion Lab (JPL) has launched a nanosatellite carrying a miniaturized version of the
GPM precipitation radar in a pilot study. The GDIS contacts in CEOS are George Huffman (within the
CEOS precipitation constellation group) and Chu Ishida (JAXA).
        Developing Globally Uniform, Consistent, Standardized Drought Onset Identification
Drought standards and employed drought indices vary from country to country. Part of the reason for
the WMO High Level Meeting on National Drought Policy was to attempt to standardize these
practices. For example, Australia Bureau of Meteorology deploys precipitation deciles, while most of
the remaining world (excepting the Russian Federation) utilizes Standardized Precipitation Index
(SPI). Different countries may have rocky, mountainous, rugged terrain, while other countries may be
partly rain-forested, while others still may be semi-arid, so that rates of snowfall and snowmelt runoff
or glacial runoff will matter more in mountain localities, while liquid monsoonal rains will matter
more in others. An important property in semi-arid areas is how much rain is retained as soil moisture
for growing crops. And, of course, global satellites provide different means to monitor vegetation
(and crop health). Many of the regional drought centers share a common methodology of monitoring
incoming precipitation, as during the monsoon season, by mapping Standardized Precipitation Index,
in order to compare current precipitation with long term average rainfall. Many regional drought
centers obviously also monitor vegetation (and crops), thus providing two “layers” or types of
measurement. The European Commission Joint Research Centre coined the expression “combined
drought indicator” for these two methodologies, combined with a third which monitors soil moisture.
Monitoring of soil moisture anomalies requires a validated program of numerical hydrological or land
surface model runs, validating low soil moisture levels with recorded drought episodes within the
country drought chronology. Comparing the level of soil moisture with the drought record allows one
to propose a possible threshold condition at which drought is likely to ensue. Correspondingly, a
threshold, likely for different severities of drought, can also be set up within the SPI rankings. After
establishing three separate thresholds for each of the measures—SPI, soil moisture anomalies, and a

                                                    8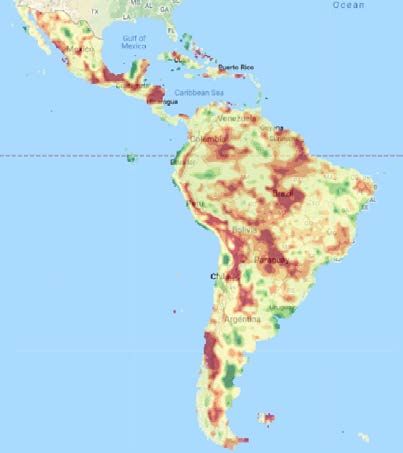
threshold for water stress in vegetation, a threshold for drought intensity as a whole can be set up,
based upon severity within each of the three measures. Of course, in some lowland countries, low
river water level may be as important as soil moisture and may serve to provide an ancillary
measurement scale with its associated threshold value. In other areas, snowmelt runoff may provide
the major source of water (Bolivia or Northern California or Scandinavia), so that diminished snowfall
can cause drought. EDO’s combined drought indicator is illustrated in Figure 4.
Global drought monitoring is possible, if a global satellite constellation has a high enough density to
monitor the onset and intensification, along with the final dissipation of drought, while, at the same
time, matching the time scales over which these drought stages occur. However, drought is not only a
“slowly forming” process, occurring over a month to many months, but also a process that can
intensify over weekly (and daily) time scales, as in the case of “flash drought” (Heat waves may also
occur over oceans and impact coral reefs).
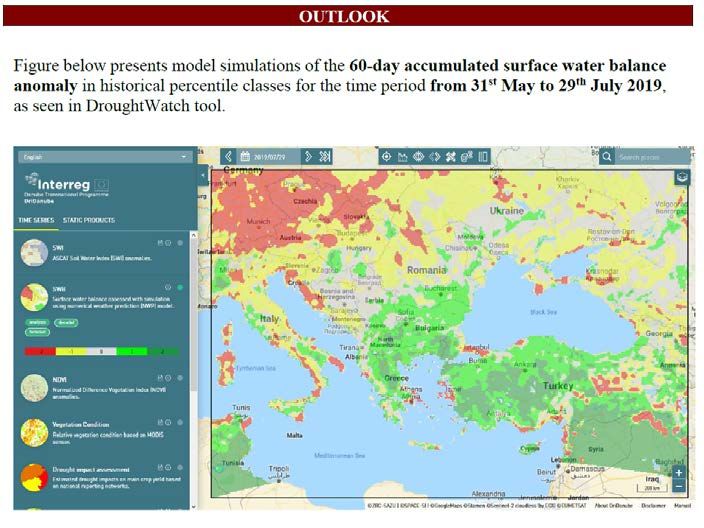
Figure 5 Global Drought Information System Current Conditions (derived from Global Precipitation
Climatology Centre (GPCC) Drought Index
(https://www.drought.gov/gdm/sites/drought.gov.gdm/files/di-201905.png)
GDIS will compare the mapped results for these different products and test relative to GPCC-based
drought mapping. The new systems can also be tested relative to the mapping maintained by the
regional drought management centers. To provide more details, we must point out of the existing
Regional Drought Center monitoring capabilities, in order to examine whether or not they could be
further improved to meet the needs of better drought monitoring.
AFRICA
Africa’s meteorological infrastructure within regions such as Sub Sahara Africa does not meet the
WMO requirement for minimal station density. Both the Princeton University Land Surface
Hydrology Group and the JRC as part of the European Framework project Drought Early Warning
System for Africa (DEWFORA) have launched drought monitors using models, the Variable
Infiltration Capacity (VIC) and LISFLOOD, respectively. The JRC African Drought Observatory now
is inactive (such projects may be tied to time-limited EU international initiatives or EU projects).
IGAD Regional Climate Center Drought Hazard Monitoring (Greater Horn of Africa)
Overseeing the East African Greater Horn of Africa is IGAD Climate Prediction and Applications
Center (ICPAC) (http://icpac.net/index.php/climate-monitoring/seasonal-forecasts.html . Turning to
ICPAC’s main website, the headings “Climate Monitoring” and “Applications” direct users, in the
“Applications” heading case to “Agriculture and Livestock Application.” In turn, “Agriculture and
9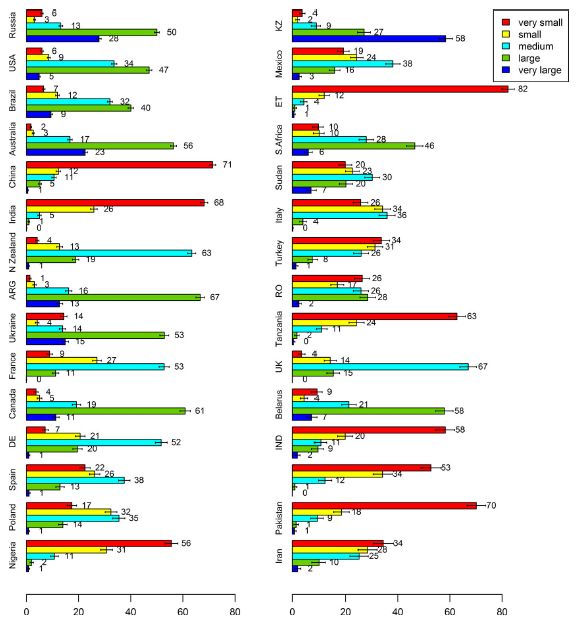
Food Security” directs users to a pop up ArcGIS mapping application. The SPI in this pop-up map is
limited to 2017. Returning to the main menu again, the next heading, to the right of “Applications” is
“Programmes,” under which is “Disaster Risk Management.” Navigation to the Disaster Risk
Management heading leads to the item of real interest, the “Drought Hazards and Risk” pop-up
ArcGIS mapping application, the “IGAD Drought Hazard Monitoring.”
What possible GDIS contribution could be made to the existing, current IGAD Drought Hazard
Mapping GIS application? Reading the legend there, SPI (precipitation deficiency) is calculated using
CHIRPS, “Climate Hazards Group Infrared Precipitation with Stations (ftp://chg-
ftpout.geog.ucsb.edu/pub/org/chg/products/CHIRPS-2.0 ). CHIRPS is a technique developed by
University of California Santa Barbara for US Agency for International Development (US-AID),
which estimates precipitation from geostationary satellites using a mathematical relationship between
cloud top temperature and precipitation. GDIS will test and compare SPI mapping of CMORPH and
GPM precipitation mappings vs that of CHIRPS.
AGRHYMET (now part of ACMAD) was originally invited to the 1st GDIS workshop, in order to
initiate a joint partnership. The GDIS partner, Princeton, has had more extended participation with
them during development of the African Drought Monitor, which was originally sponsored by a small
grant from UNESCO. Both West and East Africa centers were invited during the 2nd GDIS workshop,
but the Ebola quarantine prevented their transportation to the workshop.
Interestingly enough, despite Princeton’s extensive work with AGRHYMET, no “Drought Hazard
Monitoring” website or link to it is made on the ACMAD (West Africa) website. No active link is
made to the African Drought Monitor on IGAD’s Drought Monitoring website either.
Princeton was able to develop the African Drought Monitor due to the global observational dataset
assembled by Justin Sheffield, creating a driving forcing data set that the VIC model could use to
estimate soil moisture anomalies over Africa, south of the Sahara. The soil moisture anomalies map is
the second leg of the tripod of SPI, soil moisture anomaly, and water stress in crops, mentioned above.
Soil moisture mapping is also obtained from ASCAT, SMOS, and SMAP space-based satellites
(confined to the soil upper layer, with possible extrapolation through the root zone).

Figure 6 Princeton African Drought Monitor (left) and Central and South America Flood and Drought
Monitor (right).

                                                  10
Figure 7 IGAD Drought Hazard Monitoring mapping is a blended two layered product using SPI
calculated from regionally blended CHIRPS precipitation data and vegetation indicator composed of
NDVI anomaly from MODIS (NASA/GSFC GIMMS)
Southern Africa
Figure 8 Standardized Precipitation Index (top left), Drought Severity (top right), and Monthly
Standardized Difference Vegetation Index (bottom) as presented in the Southern African Development
Community (SADC) Climate Services Centre
As can be seen from the accompanying maps directly from their websites, both ICPAC and SADC use
parts of the “combined drought indicator” tripod, those of SPI, the WMO-recommended standard, and,
secondly, a remote sensing product for vegetation and crops.
The point of contact with AGRHYMET in ACMAD is Gideon Galu. The point of contact with
ICPAC is Gilbert Ouma. The point of contact with the Southern Africa Development Community is
Prithiviraj Booneeady in Botswana.
11SOUTH ASIA
WMO (Bob Stefanski) instigated the formation of the South Asia Drought Monitoring Center through
the International Water Management Institute (IWMI) in Columbo (http://dms.iwmi.org/ ) The actual
IWMI drought mapping is accessible online (http://dms.iwmi.org/app/ ) in which users can advance
from month-to-month; however, for some reason, the SPI and drought mapping ends in 2014 (its
period of record is 2001 to 2014). However, bulletins (downloadable pdf files) do cover the time
periods since 2014 http://www.iwmi.cgiar.org/resources/drought-monitoring-system/drought-bulletin/.
What can GDIS offer in a partnership with the South Asia Drought Monitoring Center? Again, as was
the case in Africa, testing and validating CMORPH and GPM-based SPI mapping as an innovation to
the precipitation sources currently used. Both continents could potentially benefit from drought
prediction mapping—if the mapping is reliable enough and dependable enough to be used. An
extensive trial period is required before the prediction maps can be rolled out.
The point of contact is Giriraj Amarnath (in Colombo) (Water-related Disaster Risk Management
Subtheme leader).
EUROPEAN COMMUNITY
Drought Management Centre for Southeast Europe (DMCSEE)
12Figure 9 DMCSEE Products
As was the case with the regional drought associations and drought monitoring centers above, GDIS
will test the CMORPH and GPM blended SPI maps against the SPI mapping developed by DMCSEE
using precipitation station data within its region. Of particular value to DMCSEE would be the
drought prediction mapping based upon ECMWF seasonal precipitation (at one to two month
predicted advanced dates); the partnership would test drought predictions over Eastern Europe.
The point of contact is Gregor Gregoric, Environment Agency Republic of Slovenia (EARS),
Lubljana.
CHINA
GDIS formed a partnership with the China Meteorological Administration Institute of Arid
Meteorology (which prepares China’s drought maps) at the 2nd GDIS international workshop.
Attempting to translate the Chinese language of the CMA maps for presentation on the regional maps
within GDIS is a problem, but not an insurmountable one. In turn, GDIS will share its CMORPH and
GPM SPI mappings, as well as exchange progress in testing drought predictions over China from the
combined ECMWF-NMME-UK Met Office climate models vs the CMA climate model.
The point of contact with CMA is Yaohui Li, Director of the Institute of Arid Meteorology, CMA
(other contacts exist with CMA in the Beijing Climate Centre).
SOUTH AMERICA
The 2nd GDIS international workshop brought the Western South America Regional Climate Center
and the Southern South America Regional Climate Centers together, face-to-face, for the first time. A
panel discussion of steps to form a regional South America drought association was the key
development of the 2nd GDIS workshop. CPTEC also participated in the meeting, as did Argentina
SMN. GDIS representative Richard Heim was also invited to the subsequent meeting and signed
accord between the two centers, held in Buenos Aires. As was the case for the North American
Drought Monitor, particular emphasis will be placed upon development of the South America Drought
Monitor, by the regional climate centers and meteorological and climate agencies located within that
region, one which will be added to the GDIS regional coverage, as was the case with the North
America Drought Monitor.
13The points of contact are Rodney Martinez (CIIFEN) and Julian Baez (CRC-SAS). Additional
participants include Natalia Herrera, Argentina SMN (South America SPI mapping), Gustavo
Goncalves (CPTEC) for South America SPI mapping using SALDAS (South America Land Data
Assimilation System) and Caio Coelho (CPTEC) for forecasting and prediction.
Vegetation and Crop Monitoring
The spatial and time scales of the sensor must match the space and time scales of the process being
monitored. Copernicus has assembled brief explanations of the remote sensing wavebands and
approaches used for vegetation monitoring https://land.copernicus.eu/global/products/FAPAR
In addition, measurement of two processes over vegetation, such as precipitation and
evapotranspiration should ideally share common space and time scales. GDIS will undertake a small
scale pilot project to test whether significant differences exist between drought-monitored vegetation
over high resolution and over Landsat scales, in order to test how drought identification might possibly
be exacerbated over small plot holdings, such as found within Sub Sahara Africa. Successful
completion of the pilot is contingent upon access to Planet high resolution imagery over Africa. The
repeat frequency of the Planet “dove” satellite constellation over Africa during monsoon season will
also be examined.
Whitcraft, et al (2015), in preparation for GEOGLAM, carried out an assessment of number of
satellites, i.e., the satellite constellation and its arrangement, required to carry out agricultural
monitoring, given a presented need to monitor agricultural productivity over a given period of
frequency during the growing season or harvest season ( remotesensing-07-01482.pdf ). However, this
only included national space agency satellites, not commercial ones. In other words, the satellites
were only large satellites with longer lifespans. In general, the highest resolution at the time of the
study was almost exclusively the “moderate” resolutions made available by MODIS. The MODIS
image may be adequate for large agricultural operations, as found in the USA, for example, but is
completely unsuitable for small subsistence crop holdings in poor areas, such as Sub Saharan Africa.
The same imagery is employed in drought monitoring by the regional drought centers, so that the same
spatial scale applies. A coarse resolution image of vegetation will “smear” what is seen, whereas a
high resolution image will be able to pinpoint actual subsistence crop holdings in locations, such as
Sub Saharan Africa.
One would expect the vegetation analysis—limited to visual wavebands, for the most part—to much
more accurately map water stress condition within the actual crop plot distribution with very much
higher resolution, using the higher imagery Planet nanosatellites. An experimental project will test
significant difference between the moderate scale imagery for drought monitoring versus high
resolution for drought monitoring-crop drought impact.
14Figure 10 Agricultural Field Size over different continents across the globe
(https://onlinelibrary.wiley.com/doi/epdf/10.1111/gcb.14492 ) (Lesiv, et al (2019) “Estimating the
global distribution of field size using crowdsourcing,” Global Change Biology 25
15Figure 11 Agricultural Relative Field Size found within selected countries (Lesiv, et al 2019, op. cit.)
A data processing pipeline to analyse high resolution cubesat imagery was set up by Rolf de By
(University of Twente) https://www.stars-project.org/en/news/news/fully-automated-system-extracts-
information-on-smallholder-farms-from-raw-satellite-data/ and https://www.mdpi.com/2072-
4292/9/10/1048
Addendum
As was noted above, the spatial scales and time scales of two processes being monitored should
overlap or match. For example, if MODIS or Landsat simultaneously measures vegetation
productivity and evapotranspiration, then the two processes can be mapped and compared. If, on the
other hand, agricultural productivity is mapped for small plots over very high or high resolution at
visual wavelengths, and evapotranspiration is mapped at coarser resolution, as, for instance, at the
resolution provided by higher altitude geostationary satellites, then the scales will not match.
16Evaporation drought indices will be tested in an experimental environment against drought
performance by the other indicators (Chris Hain, NASA Huntsville).
4 GOVERNANCE
Work Package and Task I
GDIS has “eyes” and “ears” across the globe through its partners, as in the case of the European
Commission Joint Research Centre (JRC) European Drought Observatory and Copernicus Emergency
Management Service-supported Global Drought Observatory, Drought Management Centre for
Southeast Europe (DMCSEE), the Regional Climate Centers of Western and Southern South America,
Australia Bureau of Meteorology (BoM), the Southern Asia Regional Drought Center (IWMI), the
China Meteorological Administration (CMA), and the West and East (Greater Horn of Africa)
Regional Climate Centers. These regional partners provide localized, on the ground, drought
monitoring feedback and their products are continually updated within the GDIS portal, making them
active participants involved in steering GDIS. At the same time, GDIS was set up under the WCRP
Grand Challenge on Extremes to provide technical expertise in ensuring drought monitoring and
forecasting tools were the most accurate and reliable possible, given the complexities of drought and
heat wave phenomena.
Steve Ansari is the portal manager for the NIDIS portal and is responsible for implementation of GDIS
content within the NIDIS portal. Juergen Vogt (JRC), the developer of the Global Drought
Observatory, is an active GDIS partner, with both JRC and GDIS actively investigating technologies
to modernize monitoring and prediction of drought and heat waves. Exchanges between JRC and
GDIS investigate respective work packages for merger of space-based and ground-based temperature
mapping for heat wave identification and upgraded merger of space-based and ground-based
technologies for drought mapping. At the same time, GDIS and JRC jointly assess merging
techniques used within North America and those within the European Community for widespread
global application, such as, for example, merging drought prediction by the North American
Multimodel Ensemble climate models with drought prediction within ECMWF. A second example is
possible merger of heat wave monitoring via European Union EUSTACE (and its successor ESA
Climate Change Initiative Surface Temperature Product) with the GISS Surface Temperature Analysis
(in North America).
Richard Heim provides expertise as a long time drought manager on the US Drought Monitor and is
involved in documentation of extremes for the National Center for Environmental Information
(NOAA).
Steering involves the GDIS partners, the most active being NIDIS, NOAA, JRC, and the GDIS
partners of Drought Management Centre for Southeast Europe (DMCSEE), the two Regional Drought
Centers for Western and Southern South America, CPTEC, the South Asia Regional Drought Center,
and the China Meteorological Administration. Other GDIS partners, such as the West, East, and
Southern Africa regional climate centers will be more actively engaged during the drought prediction
phase of GDIS implementation.
The donation of time and work cycles in undertaking GDIS work is supported principally by NOAA
(in the case of Heim and Ansari).
The steering committee oversees work progress in completing the Work Packages. The 2020-2022
Work Plan includes four work packages:
(I) Task 1: Overall Project Management
(II) Task 2: Upgrading the global precipitation monitoring data processing stream;
(III) Task 3: Expanding NIDIS portal capability in support of upgraded interactive (GIS) map
capability, including ability to accommodate new upgraded GDIS products;
(IV) Task 4: Major overhaul of the GDIS portal to significantly upgrade its usability
17(V) Task 5: writing, deploying, and testing the global drought forecasting data processing
software, initially within a test environment, but then within a production environment,
(VI) Task 6: Adding the Drought Training and Drought Education Compartments to GDIS
Portal
As is mentioned in the Technical Appendix, one cannot simply display on a portal the immediate
products of the prediction processing stream. The rate of false alarms is high (but not as high as
“hits”), so some kind of filtering system will have to be developed, combined with a consultation
process with partners within the regional drought centers, if a drought is predicted within their
jurisdiction.
Work Package and Task 2
NIDIS sponsored pilot development of the use of NOAA CPC CMORPHv2 global precipitation for
the construction of global SPI maps, in order to test improvement, relative to land-based GPCC maps.
The project was completed by a team composed of Olivier Prat (Cooperative Institute for Climate and
Satellite-North Carolina/North Carolina State University (CICS-NC/NCSU (opprat@ncsu.edu)), GIS
data processing manager (Alec Courtright (NOAA alec.courtright@noaa.gov ), Brian Nelson, who is
the NOAA NCEI Precipitation Lead (brian.nelson@noaa.gov ), and Ronald Leeper (Cooperative
Institute for Climate and Satellite-North Carolina/North Carolina State University (CICS-NC/NCSU
(rdleepe2@ncsu.edu). The pilot project has been completed, and some preliminary comparisons of
CMORPH-based global SPI maps have been compared and tested against GPCC-based global SPI
maps. It should be noted that GPCC station data are blended within CMORPH.
As was noted above, the CEOS Precipitation Satellite Group increased the number of satellites falling
within the precipitation constellation by including new satellites coming on line that possessed sensors
capable of providing measures for precipitation. Furthermore, both GPM and CMORPH share overlap
among parts of their processing data system; in addition, both global precipitation data processing
systems also jointly use blended GPCC precipitation station data for quality control. However, as has
been noted, GPM does not use the same morphing modelling as CMORPH: it instead deploys a cloud
development model embedded within the NASA/GSFC Global Modelling and Assimilation Office
(GMAO) global model in order to recreate probable precipitation within “missing” intervening areas
between observations.
The Tropical Meteorological Rainfall Mission (TRMM) 13 year operational data archive will be
reprocessed using the IMERG algorithm, producing as end product a unified TRMM-GPM archive.
Contact is George Huffman (NASA/GSFC (george.j.huffman@nasa.gov ). GPM and NOAA CPC
Cmorph share the same processing stream. Nevertheless, a data processing stream will be written,
tested in an experimental environment for the combined TRMM-GPM precipitation mappings, so that
this global archive can be tested against the CMORPH global precipitation mapping (another space-
based-blended ground-based) and against the land-based GPCC.
Greater resolution within space-time observations will improve global drought monitoring.
18Figure 12 Space-based, as opposed to ground-based, precipitation (CMORPH) from NOAA Climate
Prediction Center converted into SPI for drought monitoring (S. Ansari, et. al., (2018) “Overview of
drought GIS techniques on www.drought.gov,” NOAA CPC CDPW 10.23.2018)
Work Package and Task 3
The portal work package is carried out by Steve Ansari, the NIDIS portal manager, improving the
interactive mapping within the NIDIS portal, the GIS interface, and the ability to replot maps from
other regional centers onto the GDIS interactive map.
Work Package and Tasks 4
The GDIS portal in its current form has very limited information to fully flesh out the drought
situation room worldwide. The purpose of Work Package 4 is to carry out a major overhaul of the
current portal to improve its usability as a “one stop shop” for the status of droughts across the globe.
Besides SPI mapping, mapping is being prepared for other processes capable of identifying drought
onset, intensification, and dissipation. GDIS currently displays the NESDIS Vegetation Health
Index/Vegetation Condition Index approach of Felix Kogan, but multiple vegetation maps need to be
displayed that are more useful to people living within our parts of the world, such as FAPAR maps by
persons familiar with the European Drought Observatory system.
The limitation of the current portal contents to meteorological drought mapping and vegetation
mappings is an excessively severe restriction, defeating the purpose of its usability. Agricultural
drought maps need to be introduced, as well as other products, such as maps of low water and
declining groundwater. For example, JRC deploys numerically modelled soil moisture, as derived
from the LISFLOOD model (used for flood forecasting by JRC). A global version of LISFlood has
also been developed and has been used by ECMWF. GDIS already has some limited soil water
anomaly mapping capability within the regional mappings produced by Princeton. Our intention is to
extend this to the global terrestrial domain within the 2020-2022 Work Plan, utilizing Princeton’s VIC
soil moisture mapping, if possible, or GLDAS (Christa Peters-Lidard). One objective is to attempt to
extract the global terrestrial soil moisture from Princeton’s VIC model to use in the GDIS global
19interactive map—something that could be compared with ASCAT. SMOS and SMAP remotely sensed
soil moisture within the upper soil (The active radar in SMAP has failed). Wolfgang Wagner
(University of Technology, Wien ww@ipf.tuwien.ac.at ) will be providing soil moisture mapping (soil
moisture maps will also be provided via the NASA/JAXA Soil Moisture Active and Passive (SMAP).
These products will be tested by going back through recorded drought chronologies for locations
falling within our partners’ jurisdiction (and also guided by application papers in the literature).
Two sets of evapotranspiration mappings are being implemented experimentally. One product is
evaporative stress index in global radiation maps derived from the geostationary satellites, combined
with ancillary meteorological observations Chris Hain (NASA christopher.hain@nasa.gov ) and
Martha Anderson (US Department of Agriculture Agricultural Research Service (ARS
(martha.anderson@ars.usda.gov ). Evaporative maps are also being prepared at the Desert Research
Institute by Daniel McEvoy for Evaporative Demand Drought Index (EDDI) using Google Earth
Engine and MERRA-2 (NASA/GSFC GMAO).
JRC maps low river level locations within EDO, and a similar approach will be tested for the VIC and
GLDAS model domains (Eric Wood, Princeton).
Work Package 6
New portal sections will be set up for drought education and for the download of drought tools. Some
of the drought education section will mesh with what is available through the WMO drought
management website.
Work Package and Task 5
The basic methodology used for weather forecasting, including validation metrics and analysis
techniques is given within the World Weather Research Program Joint Working group on Forecast
Verification Research manual https://www.wmo.int/pages/prog/arep/wwrp/new/jwgfvr.html .
A processing chain will be set up for using the Copernicus ECMWF seasonal model forecasts, and this
will be linked to the data processing stream used for CMORPH and GPM global precipitation SPI
mapping. A counterpart stream will be prepared for the North American Multi-Model Ensemble.
Within the experimental environment the two systems will be mapped separately, and then co-mapped
to a common grid and common ensemble start times.
The drought forecast skill will be tested through the hindcast history for each system over domains
falling within the jurisdiction of the regional partners. If results are deemed plausible, then forecasts
can be examined under controlled conditions within some of the regional drought centers willing to
participate. A lengthy validation period—certainly longer than the two years of the GEO 2020-2022
Work Plan period—may be required before the system is routinely released within a production
environment as part of the Regional Drought Center’s forecast and Hazard evaluation process. Some
possible experimental pilot partners include the Drought Management Centre for Southeast Europe
(Gregor Gregoric), the South American regional climate centres (Julian Baez and Rodney Martinez,
respectively), the Asian Pacific (APCC Climate Center (Jinyoung Rhee), the African regional climate
centres (op cit).
Forecast skill will also be tested over the Russian Federation, as well as China (China Meteorological
Administration Institute of Arid Meteorology (Yaohui Li)).
These combined work packages will ensure that significant progress will be made upgrading GDIS,
fulfilling some of the needed requirements, required by GPCC, by WCRP, and by the COP21
monitoring requirements.
20You can also read