CLIMATE CHANGE IMPACTS ON HIMALAYAN GLACIERS AND IMPLICATIONS ON ENERGY SECURITY OF THE COUNTRY - DISCUSSION PAPER
←
→
Page content transcription
If your browser does not render page correctly, please read the page content below
DISCUSSION PAPER
                                        October 2019

   CLIMATE CHANGE IMPACTS
ON HIMALAYAN GLACIERS AND
   IMPLICATIONS ON ENERGY
  SECURITY OF THE COUNTRY
                                                 Author
                                    Dr Shresth Tayal

                                             Advisor
                                        Dr S K Sarkar

             GLACIER WATER AND ENERGY SECURITY      1
© COPYRIGHT
The material in this publication is copyrighted. Content from this discussion paper may be used for non-commercial purposes,
provided it is attributed to the source. Enquiries concerning reproduction should be sent to the address:

The Energy and Resources Institute, Darbari Seth Block, India Habitat Centre, Lodhi Road, New Delhi – 110 003, India

Author
Dr Shresth Tayal, Fellow, TERI

Advisor
Dr S K Sarkar, Sr Director and Distinguished Fellow, TERI

Internal Reviewer
Mr S Vijay Kumar, Distinguished Fellow, TERI

Reviewers
Mr. A.B. Pandya (ICID), Dr. Naveen Raj (ONGC), Mr. Ashish Kumar Das (NHPC), Ms. Sangita Das (NTPC), Dr. K.C. Tiwari (DTU), Dr.
Joydeep Gupta (The Third Pole), Mr. H.K. Varma (ICID), Dr. Girija K. Bharat (Mu Gamma Consultants Pvt. Ltd.) during the stakeholder
consultation workshop on July 10, 2019.

ABOUT THE AUTHOR
Dr Shresth Tayal, Fellow and Area Convenor, Water Resources Division, TERI is engaged in research on Himalayan glaciers for almost
2 decades and responsible for coordination of TERI’s Glacier Research Programme. He is also involved in research exploring the
linkages between water and energy security of the country. He can be contacted at stayal@teri.res.in

Team, TERI’s Glacier Research Programme
Mr. Dharmesh Kumar Singh, Ms. Sonia Grover, Mr. Pradeep Vashisht, Dr. Anubha Agrawal, Mr. Nikhil Kumar

SUGGESTED FORMAT FOR CITATION
Tayal, Shresth 2019. Climate Change Impacts on Himalayan Glaciers and Implications on Energy Security of India, TERI Discussion
Paper. New Delhi: The Energy and Resources Institute

Design
Sudeep Pawar, TERI Press

PUBLISHED BY
The Energy and Resources Institute (TERI)

FOR MORE INFORMATION
Water Resources Division, TERI, Darbari Seth Block, IHC Complex, Lodhi Road, New Delhi 110 003, India Tel.: +91 11 2468 2100 or
2468 2111 | Fax: +91 11 2468 2144 or 2468 2145 Email: pmc@teri.res.in | Web: www.teriin.org
TABLE OF CONTENTS
Water dependent energy scenarios                                                      5
Conventional Fuels and Water                                                          5
83% of total electricity production in the country is based on utilization of water   7
Climate Change, Himalayan Glaciers and Meltwater                                      9
Energy and Glaciers: Exploring the Linkages                                           12
Water Consumption for Energy production in IGB basin                                  16
Issues and Challenges                                                                 16
Recommendations                                                                       18
References                                                                            19
Appendix : TERI’s Glacier Research Programme                                          23
CLIMATE CHANGE IMPACTS ON HIMALAYAN GLACIERS AND
IMPLICATIONS ON ENERGY SECURITY OF THE COUNTRY
Abstract: Climate change has strong influence on the               Power sector, constituting 54.3% of total installed capacity
precipitation over Himalayas as well as melting response           of 360 Gigawatt (GW) electricity production, as on
of glaciers/ snow cover in Himalayas. This in turn affects         31th July 2019. Production of coal in the country has
the runoff pattern of rivers draining from the glaciated           increased by 7.5 times and production of electricity
catchments of Himalayas. Three major river catchments              has increased by 13 times since 1970-71. Furthermore,
along with their several tributaries originating from Indian       NITI Aayog projects that the total installed capacity for
as well as Nepal part of Himalayas, receive significant            electricity generation in the country will range from 300-
contribution from Himalayan cryosphere, especially during          700 GW by 2047 under different policy initiative scenarios.
the non-rainfall lean period of the year.                          Considering the practicality of implementation, even with
                                                                   best of efforts to diversify the fuel and technology mix in
These rivers support the life and livelihood of more than 500
                                                                   the power generation sector, India would continue to rely
million people living downstream in Indo-Gangetic plains,
                                                                   heavily on coal based electricity generation, accounting
but also support several industries located in these plains.
                                                                   for atleast 50-60% of the total capacity.
Simultaneously, Himalayan rivers are also responsible for
ensuring energy security of the country, due to their role in      Also, India’s energy security is dependent on production
supporting the production of both hydro as well as thermal         of crude oil as well as refining of imported crude oil.
electricity through dams/ power plants located in the Indo-        India produced 36 Million Tonnes (MT) of crude oil and
gangetic plains. It is estimated that almost 1/3rd of country’s    imported 214 MT of crude oil in 2016-17. As a result, India
electricity production capacity is located in these plains,        produced 242.7 MT of petroleum products from refineries
and any variability in flow pattern of Himalayan rivers can        and fractionators. Total installed refining capacity in the
have far-reaching consequences for energy security of the          country has almost doubled since 2000 from 112.04 MT to
country.                                                           234 MT in 2017. As such, the consumption of conventional
                                                                   energy resources has almost tripled since 1990-91.
This study tries to correlate the impacts of climate change
on the energy security of the country by studying the water
footprints of energy production in the country and available
                                                                   Conventional Fuels and Water
literature on the variability of meltwater in the Himalayan        Water is needed throughout the energy supply chain,
rivers. The study recommends that focus of policy making on        sometimes as a direct input as in the case of hydropower or
renewable energy should have equal impetus on reducing             geothermal energy, as a coolant in thermal power plants
the water footprints of electricity production, and river valley   or more often for the extraction and processing of energy
specific plans are required to generate adaptation plans for       fuels. Thus, conventional fuels used both for electricity
energy projects in the country.                                    production as well as for transport requirement, depend
                                                                   heavily on usage of water.
Water dependent energy scenarios                                   Water As coolant
Indian energy system is dependent on a mix of                      The two widely implemented types of cooling for power
conventional fuels such as coal, oil, gas, synthetic               production are once-through cooling and closed-loop
fuels and non-conventional sources such as biomass,                cooling; the minor type is termed dry cooling. For once-
hydropower, nuclear, solar, wind, and geothermal.                  through cooling, river or lake water is passed through
However, conventional fuels still dominate the electricity         a heat exchanger to condense the steam. The exiting
production as well as transportation sector, in both               condenser water is pumped back through the cycle and
present as well as near future perspectives. Coal based            the river water is returned to the stream. Although the
thermal power plants are the dominant player in Indian             consumptive water use is minimal, the amount of water

                                                                           GLACIER WATER AND ENERGY SECURITY               5
Growth in Consumption of Conventional Energy
                             30000

                             25000

                             20000

                             15000

                             10000

                               5000

                                   0
                                       1970-71 1980-81 1990-91 2000-01 2010-01
                                          Coal and Lignite     Crude Petroleum
                                          Natural Gas          Electricity
                                    Figure 1: Trends in Consumption of Conventional
                                    Sources of Energy in India (Data Source: Energy Statistics 2013)

withdrawn from the river is significant. A closed-loop                      Non-Renewable Thermal
cooling system consumes much more water than once-
                                                                                            1%
through types because the entire energy exchange is
through evaporation of water - a consumptive use. Dry
cooling typically requires a fan to aid in heat removal.                            12%                                 Northern
The advantage to dry cooling is the water withdrawals                                                  26%
                                                                                                                        Western
and consumptions are zero (Torcellini et.al., 2003), but
dry cooling systems result in reduced power output and                      24%                                         Southern
increased heat rate (lower efficiency) of the unit besides                                                              Eastern
higher capital cost.
                                                                                            37%                         North Eastern
It is estimated that water withdrawal for electricity
generation for ‘once through cooling’ technology range
from 100-180 L/kWh for coal, 80-140 L/kWh for gas/oil,
and 140-200 L/kWh for nuclear power plants. However, for              Figure 2: Regional distribution of non-renewable thermal electricity
‘closed loop cooling’ technology, water withdrawal range              production in India
from 2-4 L/kWh irrespective of fuel used (EPRI, 2008). Thus,
water withdrawal from the freshwater source has reduced               In India, the share of nuclear power is 1.95% of the total
considerably in recent years, but consumptive use has                 installed capacity. With exponential growth in energy
increased which is proportional to the number of hours,               demand coupled with a finite availability of coal, oil,
a plant operates. The consumptive water requirement                   and gas; there is a renewed emphasis on nuclear energy.
for coal based plants with cooling tower in India is about            Nuclear power plants consume more water as compared
3.5 – 5 L/ kWh (CEA, 2012). As such, thermal power plants             to coal based thermal power plants (NEI, 2012). While new
with total installed capacity of 190.3 GW in the country              plants are being constructed at coastal locations and are
are consuming atleast 705 million litres of water every               based on desalinated water, still almost 35% of nuclear
hour.                                                                 power is from inland locations.

  6        DISCUSSION PAPER
80000

                                              70000

                    Installed Capacity (MW)
                                              60000

                                              50000

                                              40000

                                              30000

                                              20000

                                              10000

                                                   0
                                                        Northern         Western          Southern           Eastern      North Eastern
                                                                          Coal         Nuclear       Hydro

                                        Figure 3: Regional distribution of electricity production (Coal, Nuclear and Hydro) in India

                                                                  2% 3% 0%                                      Coal
                                                                                                                Lignite
                                                                                                                gas
                                                            16%
                                                                                                                Diesel
                                              2%
                                              0%                                                                Nuclear

                                                       9%                                                       Hydro
                                                                                    66%                         Small Hydro
                                               2%                                                               Biomass Power
                                                                                                                Waste to Energy

                                                    Figure 4: Proportional distribution of electricity production mix in India
                                                                                          up about six barrels of produced water. Water is also used
 83% of total electricity production in the                                               during the petroleum refining process such as desalting
 country is based on utilization of water                                                 and alkylation. Refineries use about 1.5 - 1.7 m3 of water
                                                                                          for every metric tonne of product (Sustainability Report
Water for mining, extraction and refining of conventional                                 2015-16), which means that India refining nearly 0.64
fuel                                                                                      million metric tonnes of petroleum products per day,
Natural gas extraction is considered water efficient                                      consumes about 1 billion litres of water each day.
because the withdrawn groundwater (used for gas                                           Non-conventional energy and water
purification) is mostly re-injected back into the aquifer.
                                                                                          Hydroelectric power generation depends completely on
Significant quantities of water are being produced in the
                                                                                          water availability. Water flowing through the turbines and
course of coal seam gas water exploration and production                                  into the river is not considered consumptive because it
(Penton 2009). There have been reports across the world                                   is still immediately available for other uses. However, the
on aquifer depletion and pollution in areas where coal                                    increased surface area of the reservoir, when compared
seam gas wells have been established and also cases on                                    to the free flowing stream, results in additional water
its impact on crops and farm lands. Drilling process for oil                              evaporation from the surface and it is important to
extraction requires minimal amounts of water but a large                                  note it as a function of the amount of energy produced.
amount of water called produced water is withdrawn                                        Hydropower projects could alter flow regimes below
with the extracted oil. On average, a barrel of oil brings                                storage reservoirs or within diverted stream reaches

                                                                                                     GLACIER WATER AND ENERGY SECURITY           7
leading to water quality degradation and flooding             Solar energy
of terrestrial ecosystems by new impoundments and             India’s national solar mission sets an ambitious target of
may get affected by climate change impacts on the             100 GW of grid connected solar power projects by 2022 to
hydrological cycle (Curlee and Michael, 2003). Intense        address both the domestic challenge of energy shortages
flooding can also affect power generation by increasing       and the global challenge of climate change. For the
turbidity levels in intake water. These water events are      purpose, the government has set a target of setting atleast
episodic in nature and their frequency and severity are       50 solar parks every year, each with a capacity of 500 MW
projected to increase over time. Hydro plants generally       and above. Solar parks with the capacity of 26,500 MW
have a long life span (around 80 years). As a result, the     have already been approved, with major parks equivalent
impacts of climate change may dramatically change local       to 60% of approved capacity being in the states of Andhra
water flows from when they were first studied during          Pradesh, Gujarat and Rajasthan.
project development.
                                                              A Concentrated Solar Power system consumes about
Bioenergy is considered environmentally benign and            3.5 m3/ MWh water for production of electricity, which
climate friendly. But bioenergy crops are water intensive     is equivalent to the conventional coal based thermal
and the water foot prints are much higher than that of        power plants. Similarly, water consumption for cleaning
non- renewable fuels. In the case of biofuels, the crop       of solar panels in PV systems has been estimated as 20-30
irrigation water demand for production of biofuels like       m3/ MW per wash. We estimate that with the complete
ethanol from sorghum, sugar cane and cellulose depends        installation of targeted solar power capacity of 100 GW,
on its geographic location, climate, and type of feedstock.   water consumption for solar electricity could be more
Bio-diesel in India is mainly produced from the tree-based    than the water requirement for coal based electricity. As
oil crop Jatropha. Thus, Major water use for Bioenergy        such, electricity produced per unit of water is less for solar
production is for irrigation of crops (Gupta 2002).           power plants as compared to coal power plants.

 Table 1: Interconnections of Energy Sector with Water Availability and Quality
 Energy Element                         Connection to Water Quantity                 Connection to Water Quality
                                         Energy Extraction and Production
 Oil and Gas Exploration                Water for drilling, completion, and          Impact on shallow groundwater
                                        fracturing                                   quality
 Oil and Gas Production                 Large volume of produced, impaired           Produced water can impact
                                        water*                                       surface and groundwater
 Coal and Uranium Mining                Mining operations can generate large         Tailings and drainage can impact
                                        quantities of water                          surface water and ground-water
                                              Electric Power Generation
 Thermo-electric (fossil, biomass,      Surface water and ground water for           Thermal and air emissions impact
 nuclear)                               cooling** and scrubbing                      surface waters and ecology
 Hydro-electric                         Reservoirs lose large quantities to          Can impact water temperatures,
                                        evaporation                                  quality, ecology
 Solar PV and Wind                      None during operation : water use for
                                        panel and blade washing
                                               Refining and Processing
 Traditional Oil and Gas Refining       Water needed to refine oil and gas           End use can impact water quality
 Biofuels and Ethanol                   Water for growing and refining               Refinery waste-water treatment
 Synfuels and Hydrogen                  Water for synthesis or steam reforming       Wastewater treatment

  8        DISCUSSION PAPER
Table 1: Interconnections of Energy Sector with Water Availability and Quality
 Energy Element                                  Connection to Water Quantity                           Connection to Water Quality
                                                  Energy Transportation and Storage
 Energy Pipelines                                Water for hydrostatic testing                          Wastewater requires treatment
 Coal Slurry Pipelines                           Water for slurry transport; water not                  Final water is poor quality;
                                                 returned                                               requires treatment
 Barge Transport of Energy                       River flows and stages impact fuel                     Spills or accidents can impact
                                                 delivery                                               water quality
 Oil and Gas Storage Caverns                     Slurry mining of caverns requires large                Slurry disposal impact water
                                                 quantities of water                                    quality and ecology
 *Impaired water may be saline or contain contaminants ** Includes solar and geothermal steam-electric plants; Source: U.S Department of Energy
 (2006)

Climate Change, Himalayan Glaciers and                                      where it melts again (ablation areas). Accumulation and
                                                                            ablation areas are separated by equilibrium line, where
Meltwater                                                                   the balance between gain and loss of mass is exactly zero.
Increasing warmth and humidity in the daily weather,                        Glacier distribution is thus primarily a function of mean
erratic behaviour of rainfall patterns, extension of normal                 annual air temperature and annual precipitation sums
winter season, and increasing incidences of flood, drought                  modified by the terrain which influences, for example, the
and cyclones are some of the common observations,                           amount of incoming net radiation or the accumulation
reflective of changes in the normal atmospheric                             pattern.
circulation and climate change predictions (IPCC 2007).
                                                                            Variations in Himalayan Climate
Almost 7.7% of global glacierised area is present in South                  Temperature plays a dominant role in influencing a
Asia (Vaughn et al. 2013) supporting close to 10% of the                    glacier’s sensitivity. Glaciers in Himalayas are under the
global population by providing water during the lean                        influence of westerlies, decreasing from west to east, and
season through snow and ice melt from its cryosphere. On                    the influence of Indian and Asian monsoon, decreasing
a global scale, glacier mass change ranged between 0.38                     from eastern Himalayas to west (Burbank et al. 2003;
– 0.6 mm SLE yr-1 during the last decade as estimated by                    Bookhagen and Burbank 2006, 2010). This complex
different scientists using different methodologies (Jacob                   climate diversity results in a varying pattern of glacier
et al. 2012; Chen et al. 2013; Gardener et al. 2013; Schrama                response to climate variables across different river basins
et al. 2014; Yi et al. 2015; Dieng et al. 2015; Reager et al.               (Fujita and Nuimura 2011; Scherler et al. 2011; Bolch et al.
2016; Rietbroek et al. 2016; Marzeion et al. 2017). Glacier                 2012; Gardelle et al. 2013; Gardner et al. 2013).
mass loss for the Hindu Kush-Himalayan region during
                                                                            Indian Meteorological Department based on data from
the last decade ranged between -0.14 to -0.21 m.w.e. yr-1
                                                                            1951-2010, has reported a decrease in mean maximum,
(Kaab et al. 2012; Gardelle et al. 2013), which is considered
                                                                            mean minimum and mean annual temperature for
to be significantly less negative than the estimated global
                                                                            westernmost state of Jammu and Kashmir in Himalayas,
averages for glaciers (Cogley 2009; WGMS 2012).
                                                                            while the same parametres have been reported to
Glaciers form where snow is deposited during the cold/                      be showing positive trends for eastern most states
humid season and does not entirely melt during warm/                        of Sikkim and Arunachal Pradesh. Simultaneously, an
dry periods. This seasonal snow gradually densifies                         increase of 2.13 mm yr-1 in rainfall has been reported
and transform into perennial firn and finally, after the                    for western state and a decrease of about 3 mm yr-1 for
interconnecting air passages between the grains are                         the eastern states, over the same time period (IMD 2013).
closed off, into ice (Paterson, 1994). The ice from such                    This increase or decrease in rainfall has been attributed
accumulation areas then flows under the influence of its                    mainly to increase in winter rainfall over western state
own weight and the local slopes down to lower altitudes,                    and decrease in monsoon rainfall in eastern states.

                                                                                      GLACIER WATER AND ENERGY SECURITY                           9
However, the trend for decrease in temperature is not         (2014) estimates that while smaller glaciers with their
consistent throughout western Himalaya, with Himachal         Equilibrium Line Altitude (ELA) already above glacier’s
Pradesh showing much larger increase in mean maximum          highest point are bound to disappear, larger glaciers
temperature and decrease in rainfall than the opposite        will continue to shrink for next few decades even if the
trends observed for Jammu and Kashmir. Thus, the trends       temperature stabilizes in near future. The ELA in western
related to both temperature and rainfall variations based     Himalaya is reported to have shifted upward by 300 m in
on observational records are mixed and consequentially        the last 40 years (Kulkarni et al. 2011), while many glaciers
the impacts are also varied from basin to basin.              in eastern Himalaya, like Pokalde Glacier in Nepal have
Climate model based projections indicate a warming by         been reported to be showing a tendency with the ELA
4-5.5 0C relative to 1971-2000 time period under SRES         reaching above their highest points (for example in 2011–
emission scenarios, with rate of warming being greatest       2012) and are expected to disappear in the near future
during the winter months (Wiltshire 2014). The warming        (Wagnon et al. 2013).
rate over Himalayan region is reported to be higher than      Glacier Retreat
global average of 0.74°C±0.18/100 year (IPCC 2007).
                                                              Traditionally, retreat of glaciers has been considered as
Himalayas have warmed by 1.5°C from 1982-2006, at
                                                              an important indicator of impacts of climate change on
an average rate of 0.06°C yr-1 (Shrestha et al. 2012).The
                                                              glaciers of a region. Glaciers in the Himalayas (India) have
temperature is projected to increase in the range of 0.5°C
                                                              been exhibiting a continuous secular retreat since the
to 1°C by 2020s and 1°C to 3°C by mid-century (Kulkarni
                                                              earliest recording began around the middle of the 19th
et al. 2013; Wu et al. 2017). However, warming rate is not
                                                              century (Raina 2009). Recent studies based on satellite
uniform either spatially or temporally over the Himalayan
                                                              imageries also indicate a continuing retreat of glaciers in
region (Singh et al. 2015).
                                                              Himalayas - East Rathong glacier (15.1m yr-1 (1962-2011),
Variations in Himalayan Cryosphere                            (Agrawal and Tayal 2013); Gangotri glacier (19.9± 0.3m
According to Geological Survey of India, there are 9575       yr-1, 1965-2006), (Bhambri et al. 2012); Samudratapu
glaciers in Indian Himalaya distributed among the three       glacier (18.45 m yr-1, 1963-2004), (Shukla et al. 2009);
river basins – Indus, Ganga and Brahmaputra. However,         Dokriani glacier (16.6 m yr-1, 1962-1995), (Dobhal et al.
more than 90% of Indian glaciers are small to very small in   2004). A region wide study conducted on 7% of glaciers
size – being smaller than 5 km in length and smaller than     distributed across different basins shows retreating
5 sq km in area. Most of them are even smaller than 1 sq      pattern for almost 77% of the glaciers, while 7% glaciers
km in area. Only a few glaciers like Siachen, Gangotri and    show an advancing pattern. Both number of retreating
Zemu are bigger than 10 sq km in area.                        glaciers and the extent of retreat are reported to be
                                                              highest for western Himalayan glaciers, while the glaciers
Himalayan glaciers are considered to be naturally
                                                              in an eastern Himalayan basin have shown no or very less
vulnerable due to their geographical setting. These
                                                              retreat as compared to western Himalaya (SAC 2011).
glaciers are located very close to the tropics at low
latitudes, they are on the southern facing slopes of the      Areal Change
Himalayas and so there is a natural build-up of high heat     Change in areal extent of glaciers is also used to
content in this region and most of the feeding into these     understand the impacts of climate change. Several studies
glaciers occurs in the summer season. Snow has very little    have reported a net area loss for different Himalayan
time to get into the ice mass and to add to the ice volume    glaciers over the last 4-5 decades - East Rathong glacier
of the glacier. Furthermore, these glaciers are located in    in eastern Himalaya has lost 15% of the glacierised area
the very highly inhabited districts of the Himalayas, so      from 1962-2011 (Agrawal and Tayal 2013), Gangotri
local pollution has also an impact on the overall melt        glacier (5.67%, 1965-2006), (Haq et al. 2011); Samudratapu
response of these glaciers.
                                                              glacier (12.45%, 1963-2004), (Shukla et al. 2009); Dokriani
While smaller glaciers have been estimated to exhibit         glacier (10.25% loss in frontal area, 1962-1995), (Dobhal
larger manifestations of climate change impacts, larger       et al. 2004). Regional study based on satellite images of
glaciers are supposed to continue holding ice mass. IPCC      glaciers in different sub-basins of Himalayas indicate an

  10       DISCUSSION PAPER
area loss ranging between 1-14% varying across basins, glaciers (Immerzeel et al. 2010, Kaser et al. 2010). They
over a period of 15 years from 1990. While Alaknanda and provide water during the lean summer season when
Spitti sub-basin in central Himalaya lost almost 10% of demand is high and precipitation is less. Hydrology of
their glaciated area, glaciers in Bhagirathi sub-basin, also glacierised regions is thermally controlled (Young 1985)
in central Himalayas, show almost no change in their areal and the increasing temperature mostly affect the timing
extent (SAC 2011). of runoff. Gardelle et al. 2013 reported that glacier mass
Mass Balance and Volume Change loss during 1999-2010 contributed 103 m3s-1, 103 m3s-1
and 147 m3s-1 to the river discharge in Indus, Ganges and
Overall mass balance for the 915 km2 of glaciers surveyed
Brahmaputra, respectively.
in western Himalaya was found to be −0.7 to −0.85
m.w.e. yr−1, corresponding to a total mass loss of 3.9 km3 The three great rivers of India – the Indus, the Ganges
of water in 5 year duration from 1999 to 2004 (Berthier et and the Brahmaputra collectively provide close to 50%
al. 2007). Over the past 4 decades, Himalayan glaciers are (320 km3) of the total country’s utilizable surface water
suggested to have lost almost 10% of their glacial mass resources (690 km3). Contribution from snow and ice melt
(Kulkarni and Karyakarte 2014). to the total annual river discharge has been estimated
as 60%, 9% and 21% for Indus, Ganga and Brahmaputra
Field measurements of specific mass balance over
basins, respectively (Miller et. al., 2012). For Ganga and
different regions of the Indian Himalayan glaciers show
Brahmaputra river basins, the contribution from rainfall is
mostly negative mass balance years with a few positive
considered to be significant, but the rainfall being limited
ones during 1974–2012 (Pratap et al. 2016).
to 30-40 days during monsoon season, contribution from
Regional Mass Balance Change snow and glacier melt is likely to be much higher in these
On a regional scale, the rate of observed specific mass rivers also.
loss in Himalayas is reported to be significantly lower
Various studies in the Himalayan region have assessed
when compared with the global glacier loss and is three
the impact of projected climate change on the
to four times lower than that observed for glaciers in the
hydrological regime of the snow and glacier melt fed
European Alps (Huss, 2012, Gardelle et al. 2013, Wagnon
basins, using different approaches and scenarios. Some
et al. 2013). Across HKH region, maximum value of mass
studies have used combined cryospheric hydrological
balance change has been reported for Jammu and
model (Immerzeel et al. 2012); some forced projected
Kashmir state by Kaab et al. 2012 (-0.55 ± 0.08 m w.e. yr−1)
climate change scenarios on glacio-hydrological model
but Wiltshire, 2014 indicate a gradient from low to high
(Immerzeel et al. 2013), others used hypothetical
rates of mass loss from west to east.
scenarios of increasing temperature (T+1, T+2, T+3°C)
Thus, higher rates of warming reported by some studies (Jain et al. 2010). These studies indicate that the drier
for high altitude of Himalayas and the lower rates of western Himalayas exhibit different fate than wetter
glacier mass loss do not correspond with each other, eastern Himalayas in context of impact of climate change.
and add to the uncertainty about understanding of
For the western Himalayas, a hypothetical catchment was
Himalayan glaciers. But the observations suggest that the
studied which is fed by glaciers and results of impact of
glaciers in this region are losing mass in long term, and
climate change simulated using simple temperature-
the rate of melting has increased recently. Since most of
index-based hydro-glaciological model shows that
the glaciers in Himalayas are small to very small in size
around 2060 the flow from glacial sub-basin peaks at
(due to accelerated melting and projected increase in et al. (2010) also stated that the summer and late spring
precipitation in 2041-50 with respect to the reference discharges will reduce noticeably around the period of
period under RCP 4.5 and RCP 8.5, respectively. Miller et al. 2046-65.
(2012) also confirmed that because of changing climate,
glacier melt will provide increased contribution to the Energy and Glaciers: Exploring the
discharge of the basin but in future this will decrease due
Linkages
to reduction in melt water storage.
Meltwaters from glaciers in Himalaya support mighty
Some basins like Satluj in Himalayas are reported to show perennial river systems of Indus, Ganga and Brahmaputra,
not much change in total streamflow but there is change which have shaped the history of human civilization in
in distribution of streamflow with more snowmelt runoff the region, acting as lifeline for millions of people as well
happening earlier (Jain et al. 2010). Another study on the as other species thriving in the area.
same basin by Singh and Bengtsson (2003, 2005), using
SNOWMOD suggests that with temperature increases of Today, however, the rapid pace of globalization,
1–3°C, snow melt would reduce by 11–23% and glacier urbanization and mass tourism is threatening mountain
melt will increase by 16–50%. Further, Beas basin of ecosystems, communities and resources. These factors
Western Himalayas is expected to witness decline in leading to changes in climate and increase in level of
per capita water resources in the period of 2010-2050 pollution are posing a serious threat to the stability of
(Hong et al. 2015) under climate change scenarios of RCP glaciers. Glaciers act as buffers and regulate the runoff
2.6, 4.5 and 8.5 and also because of population growth. from high mountains to the plains, especially during the
This is interesting to note that the climate change and dry spells. Even during non-monsoon season irrigation is
development patterns together will cause a concern of assured from the waters of melting snow through long,
water security for the downstream community in the winding streams from the upper mountain reaches.
region. Glaciers in IGB basin
However, recent studies suggest that as most glaciers Indus, Ganga and Brahmaputra are the perennial river
in Himalayas are losing mass at rates similar to glaciers systems with sufficient water availability during the
elsewhere, dramatic changes in total runoff are not likely non-rainfall period, mainly due to the contribution of
to occur soon, though seasonality of runoff will increase in glaciers in Himalaya. However, the number of glaciers
Himalayan rivers affecting irrigation and hydropower, and contributing to these river systems is highly uneven.
altering hazards (Bolch et al. 2012). Study by Immerzeel According to the inventory by Geological Survey of India,
100
80
% of Total Glaciers
60
40
20
0
Indus Ganga Brahmaputra
>10 km2 5-10 km2number of glaciers in Indus, Ganga and Brahmaputra are a few in numbers, but mainly concentrated in Indus basin.
approximately 7500, 1000 and 600 respectively. Besides, Total ice content of the
these river systems also receive melt water from glaciers
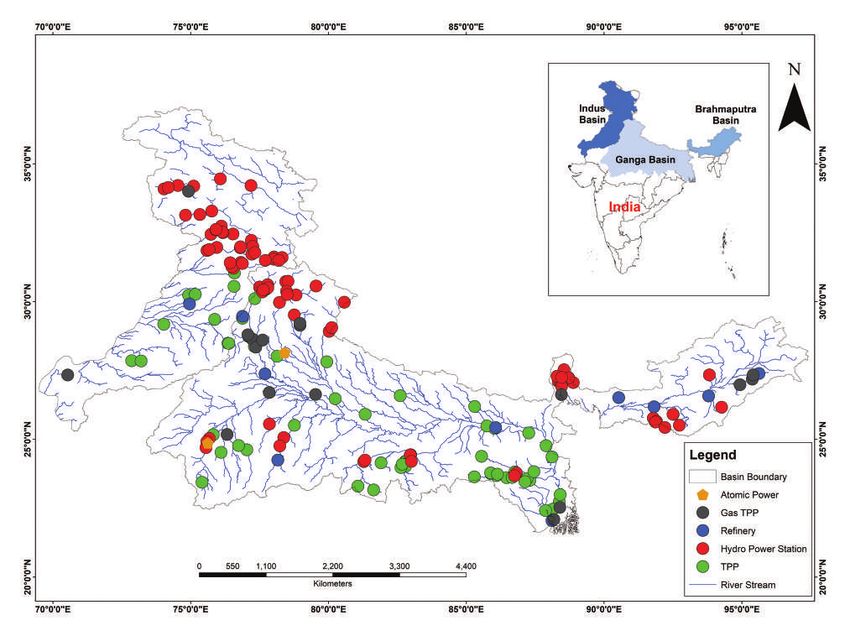
Energy production from the IGB basin
located in China, Nepal and Bhutan. Close to 3200 glaciers
in Nepal Himalaya contribute meltwater to Ganga river Indus-Ganga-Brahmaputra basin is also a hub for
system. energy production for the country. Besides hydropower
production from the dams located in Himalayan states
Furthermore, glaciers in different basins vary widely in
their length, area and hence, in ice volume. Close to 90% on different rivers originating from Himalaya, the basin
glaciers in all the river basins are smaller than 5km2 in area also supports production of thermal electricity from coal
and only about 260 glaciers are larger than 10 km2. Much as well as nuclear fuels, mining and exploration of non-
bigger glaciers like Siachen, Gangotri and Zemu are only renewable fuels and refining of petroleum products.
Figure 6: Energy Map of Indus-Ganga-Brahmaputra basin
Figure by Dharmesh Kumar Singh
GLACIER WATER AND ENERGY SECURITY 13Hydropower production from the IGB basins Among the three river basins, maximum potential has
81% of the total hydropower potential in the country has been assessed for Brahmaputra basin, but the level of
potential development is also very low. However, 56%
been assessed to be existing in the rivers flowing from
of the total potential in Indus basin has already been
Himalayan glaciers. However, considering the difficult
developed or is under construction, thus contributing
terrain as well as other issues, only 29% of this potential
close to 18000 MW of hydropower installed capacity. As
has either been developed or under construction. Once
Indus basin is fed by the maximum number of glaciers
developed to its full potential, additional 80000 MW
in Himalaya and the annual runoff contribution from
electricity will be available to the country. Currently, 52%
glaciers to the basin has been reported to be close to
of the total hydropower electricity production in the
50%, dependence of hydropower dams in Indus basin on
country is being produced from the dams located in the the Himalayan glaciers is more significant as compared to
IGB basins. other basins.
Identified Capacity Capacity Developed
19%
23% 35% Indus
Indus 42%
Ganga
Ganga Brahmaputra
Brahmaputra Rest of India
14% Rest of India
44% 13%
10%
Figure 7: Identified Hydropower potential in IGB basin Figure 8: Developed Hydropower potential in IGB basin
70000
60000
50000 Identified Capacity
40000
Capacity Developed
30000
20000 Capacity under
construction
10000
Capacity yet to be
0 developed
s
a
ra
ia
du
ng
nd
ut
In
Ga
ap
fI
o
m
st
ah
Re
Br
Figure 9: Installed capacity of Hydropower production in IGB basin
14 DISCUSSION PAPERAmong the states in IGB basin, Punjab, Uttar Pradesh, equivalent to almost 1/3rd of total coal based electricity
Himachal Pradesh and Jammu and Kashmir are the production in the country. Similarly, almost 24% of
leading producers of hydropower in the country. nuclear electricity production in the country is from the
Thermal electricity production from the IGB basins plants located in IGB basins.
Non-renewable thermal electricity production in the Among the three basins, Ganga basin has the highest
country includes the production of electricity from Coal, concentration of coal fired thermal power plants,
Lignite, Gas, Diesel as well as nuclear fuels. Electricity followed by Indus and Brahmaputra basins. Among the
production from all these fuels is highly dependent on states of IGB basin, Uttar Pradesh and West Bengal have
availability of water and IGB basin supports all these the highest installed capacity of coal based thermal
different modes of electricity production. Almost 65000 power plants. Punjab and Rajasthan are responsible for
MW of coal based electricity of the country is produced production of almost 90% of coal based electricity in the
from thermal power plants located in IGB basins. This is Indus basin.
4000
3500
Installed Capacity (MW)
3000
2500
2000
1500
1000
500
0
l
Ra ab
n
sh
a
im
m
sh
ir
nd
ha laya
ga
an
ha
m
sa
de
de
nj
kk
ha
en
sh
ry
st
a
As
Pu
ra
ra
Si
gh
rk
ja
tB
Ha
Ka
rP
lP
tra
e
es
&
M
ta
Ut
W
u
Ut
ac
m
m
m
Hi
Ja
Figure 10: Installed capacity of Hydropower production in major IGB basin states
20000
18000
Installed Capacity (MW)
16000
14000
12000
10000
8000
6000
4000
2000
0
a
l
b
n
h
r
i
ga
lh
ha
an
ha
s
ja
de
De
en
n
Bi
ry
st
Pu
ra
ja
tB
Ha
rP
Ra
es
ta
W
Figure 11: Installed capacity of thermal power production in major IGB basin states
Ut
GLACIER WATER AND ENERGY SECURITY 15Petroleum Refining Capacity of the IGB basins Issues and Challenges
IGB basin states have some of the mega petroleum Water and energy are essential requirements for
refineries of the country. As such, these basins hold almost an economy’s development. While they contribute
22.5% of refining capacity in the country. Maximum independently to development, the two are inextricably
refining capacity is located in Ganga basin with a total connected. Energy is vital for enabling the water value
refining capacity of 36.5 million Tonnes per Annum (TPA). chain and is needed whenever it is extracted, moved,
treated, heated, pressurized, reused, or discharged.
Water Consumption for Energy production Similarly, water is needed throughout the energy
in IGB basin supply chain, sometimes as a direct input as in the case
of hydropower or geothermal energy, as a coolant in
Water for Hydropower production from the IGB basins
thermal power plants or more often for the extraction and
Hydroelectric generation is considered as a non-
processing of energy fuels. Hence, issues and challenges
consumptive water user; however, some global studies
related to one sector have direct influence on the other.
have reported that hydropower is a large consumptive
user of water. The amount of water lost through 1. Increasing Water Stress:
evaporation annually from the reservoirs is equivalent With increase in population, urbanization and economic
to 10% of the global blue water footprint related to development, demand for water and energy will be
crop production. While estimates for the water loss increasing significantly. While per capita electricity
from hydropower plants in India are not available, production will be increasing, per capita water availability
global average estimates suggest that an average of 80 will be decreasing in future. The situation will be at its grim
m3/MWh water is lost as part of reservoir based peak by mid-centuary, when the per capita electricity
hydroelectric production, which could be as low as 10- consumption will be very high and country will reach
to the level of water scarcity from the category of being
20 m3 /MWhr in temperate countries like New Zealand.
water stressed.
Further, the global estimates suggest that average
reservoir area required per unit of installed capacity is By 2020, India will be formally categorized as a “water
generally 83 ha/MW. stressed” country, one where per capita availability of
water is less than 1,000 cubic metres or less. A June 2018
With these estimates, it can be assessed that hydroelectric
Niti Ayog report grimly forecasts that water demand will
production from the IGB basins is consuming 0.25-0.5
be twice the present supply and India could lose up to 6
million m3 of water per hour, which is equivalent to 86-
per cent of its GDP. For India although water is abundant,
172 million m3 of annual water consumption. While almost 2/3rd of the available water serves only 1/3rd of its
these are extremely conservative estimates, diurnal and population.
seasonal variations in rate of evaporation are also likely.
Furthermore, actual water required to be stored as part 2. Increasing Energy Demand:
of the reservoir to maintain minimum reservoir level and With increase in population, urbanization and economic
to run hydroelectric turbines on a continuous basis, will development, demand for energy will be increasing
be much higher as compared to the water consumed significantly. Projections of energy demand in future
through evaporation. indicate continued reliance of the country on conventional
fuels to meet its energy requirement. While dominance
Water for thermal electricity production in IGB Basins
of coal is projected to remain upto 50% for production
Considering an average plant load factor of 80%, coal
of electricity, fossil fuels will continue to remain the key
power plants in IGB basin are producing about 51,000 MW
player in transport sector.
electricity per hour. We estimate that these power plants
are consuming about 0.26 million m3 water every hour, To meet the increasing demand for energy, both
which is equivalent to 6000 million litre water every day. installation as well as expansion of power plants (both
This is almost 4 times the minimum water requirement of renewable as well as non-renewable) and refineries will
total population of a city like Delhi. be required, which will exert further stress on the water
16 DISCUSSION PAPERresources, while getting influenced with the limited from national to the state level. Moreover, there is no
availability of water, also. coordination between the plans, policies, programmes
and regulations related to water and energy sector. This
3. Trade-offs between water and energy security
leads to the generation of trade-offs between the policies
Interconnections between water and energy are so robust
wherein the promotion of one activity leads to negative
that policies and programmes related to advancement of
consequences on the other.
one sector leads to generation of trade-offs and exerts
negative influence on the other. For example, plans for 6. Ecological Degradation
increasing energy production have a direct bearing on As thermal power plants require large quantity of water
the water availability of the region. on a continuous basis, they are sited close to some natural
Analysis of projected future values, indicates the possible or artificial water body. But huge extraction of water from
stress that energy sector could face due to depleting the source, affects the ecological diversity of both the
water resources, competing demands from other sectors, water body and its surroundings. Natural growth patterns
changing climate, and isolated policies. It points towards of flora and fauna, relying on water body for nutrient
the need of conjunctive water-energy policies to ensure uptake, gets affected leading to ecological degradation
future power plant installation with due consideration of the region. Moreover, discharge of water back to the
to water availability in the region, and a mechanism of source at a temperature higher than the intake water,
distribution of energy at all levels. This may need devising leads to further degradation of local ecosystem.
of better trade-offs to reach positive equilibrium between
7. Lack of clear understanding about the melt response of
water and energy.
glaciers to climate change
4. Impacts on Financial Viability of energy projects Impacts of climate change on melt response of glaciers
Water scarcity has the potential to impact the financial has been proved by different scientists, however, quantum
viability of thermal power plants by affecting the project’s of impact leading to declining ice content of Himalayan
rate of return. This could be due to delays in project glaciers is not available. Moreover, different studies on
execution leading to cost escalation and revenue losses, different glaciers indicate a different melt response of
as well as due to affects during operating life of the glaciers due to local geographical factors. Also, actual
project. During operations, any drop in plant load factor temporal contributions of snow/ ice melt in individual
may reduce the revenues. It has been assessed that for Himalayan rivers has not been studied. Internationally,
each 5% drop in plant load factor results in drop of nearly Himalayan glaciers have categorized as the dark spot of
0.75% in the projects rate of return. Also, additional global climate map for which conclusive direct evidences
expenses may be required for digging ponds/ drawing are not available, and only indirect inferences could be
canals or pipelines, for extracting water from alternate/ drawn based on the limited research studies available
backup sources. for the region. This lack of clear understanding about the
Moreover, compliance with the environmental regulations melt response of glaciers makes it challenging to evolve
related to maintenance of discharge water quality or effective adaption plans for the downstream communities
quantity of water extracted from the source, have cost as well as infrastructure, and the events like Uttarakhand
burden on the plant operations. Quality of intake water floods take a heavy toll on life as well as property.
affects the operational expenses related to production
8. Limited support for glacier research on Himalaya
of DM water. For example, presence of colloidal silica
Glacier research in the country is supported by the
in intake water could increase the cost of DM water
Ministry of Earth Sciences and the Ministry of Science and
production, exorbitantly.
Technology through release of project grants to research
5. Multiple regulatory institutions: institutes and universities. Primary focus of these research
Water is under the control of multiple regulatory projects has been on understanding the cause of glacier
institutions. It is governed by both state as well as union melting and not on the effects of glacier melting on the
laws and regulations. Similarly, energy sector is regulated downstream communities. This is also imperative from
by a different set of administrative structure spreading the fact that Ministry of Water Resources has not been
GLACIER WATER AND ENERGY SECURITY 17having any stake on glacier research in the country. ‘oil reserve capacity’ in the country, a policy providing for
‘water reserve capacity’ should be enacted which may
Also, the quantum of resources required to make any
provision for storage of water equivalent to the country’s
significant improvement in the degree of understanding
minimal water requirement, for atleast 90 days of a year.
about Himalayan glacier has been limited. Ironically,
annual government expenditure on research at Arctic Developing a comprehensive understanding about
and Antarctica is significantly higher as compared to the the status of Himalayan glaciers: Considering the
expenditure on Himalayan glacier research. significance of Himalayan glaciers for the energy security
of the country, it is necessary to develop a river basin-
Recommendations wise comprehensive understanding about the status
There is a high interdependence between the glaciers of Himalayan glaciers. For the purpose, a committee of
located in the Himalayas and the energy security of the researchers shall be formed to integrate the available
country. Almost 33% of country’s thermal electricity and scientific information about the melt response of
52% of hydropower in the country is dependent on the Himalayan glaciers and to develop a holistic view on
water from rivers originating in Himalaya. These rivers status of Himalayan glaciers.
receiving significant part of their water due to melting of Promotion of research on Himalayan glaciers:
ice, glaciers make an indispensable part of India’s energy Considering the impacts of climate change on Himalayan
security. glaciers, and lack of confirmed scientific opinion on
Reducing water footprints of energy utilities: extent of impacts on Himalayan glaciers, it is necessary
Considering the future water demand from both upcoming to promote the research on Himalayan glaciers. While
thermal power plants and sectors like agriculture and Ministry of Earth Sciences and Department of Science
domestic, reducing specific water consumption will and Technology have been providing support for glacier
have only a short term effect in improving overall water research, a concrete strategy providing direction for
balance of the country. Adopting a more comprehensive the future outcome of scientific research in not visible.
approach, thermal power plants must be asked to reduce Whereas the amount of support for research on polar
the water footprints of their operations. The concept of glaciers is significant, an equivalent support for third pole
water neutrality must be made mandatory for power glaciers of Himalaya is not available.
plants, which require them to return back an equivalent Glacier/ Source vulnerability assessment for the
amount of water to the hydrological system as consumed Hydropower plants: Environmental Impact Assessment
by them. This will require them to take measures for water (EIA) is a pre-requisite for the clearance of hydro-power
conservation and demand management both within and projects from the government. But EIA conducted by the
outside their boundary. Measures for promotion and hydropower companies are mainly focussed on the likely
implementation of micro-irrigation systems in agriculture impacts due to installation of dam on the downstream
sector, installation of water efficient fixtures in domestic communities. However, these projects should also
sector, constructing structures for rain water harvesting, make a comprehensive assessment of the impacts due
etc. will help to reduce the stress on available water to climate and vulnerability to water source, on the
resources within the watershed and augment water hydropower project. This is extremely important for the
availability in the region. projects located in Himalaya considering the impacts of
climate change on its cryosphere – the water source to
Integrated Water Storage Policy: Reduction in free
the project.
flow of rainwater leading to increase in water storage is
considered as an important strategy for adaptation to Watershed management by Energy Utilities: Key
climate change. For the purpose, an integrated policy features of watershed management include holistic
needs to be formulated which may consider the water management of various aspects related to water like its
storage in its full continuum of physical water storage supply, quality, drainage, stormwater runoff, water rights,
from groundwater, through soil moisture, small tanks and as well as the overall planning and utilization of other
ponds to small and large reservoirs. Similar to the creation resources within the watershed. Integrated watershed
18 DISCUSSION PAPERmanagement has the potential to reduce water footprints linked decision making with respect to energy-water, a
of energy utilities by promoting efficient utilization of framework must be put in place that every decision that
water by all the different users within the region. This could has an impact on energy and water linkages are taken
further enhance the water available for consumption based on rational basis and not at the cost of other.
to the utility. Thus, along with the efforts to reduce Enhancing policy coherence also implies the removal of
direct water consumption by the utility, interventions misleading incentives that are directly leading to over-
improving the water use efficiency in agricultural farms exploitation and excess usage of water and energy than
and domestic sector can lead to reduction in overall necessary. The process of removal of these incentives
water demand within the watershed. Hence, Integrated should be gradual so as to avoid sudden shocks in pricing
Watershed Management should be taken up as an activity and supplies. Indeed political will is necessary for the
integral to the utility operation itself. removal of these incentives that are driving excessive
behavior.
Integrated River Basin Management to rejuvenate
water potential: Energy potential of a river, specifically
for hydropower, is directly dependent on the overall water References
availability in the river and gets inversely affected with
Agrawal A, Tayal S (2013) Assessment of volume change
the amount of sediment being transported in the river.
in East Rathong glacier, Eastern Himalaya. International
Furthermore, the primary hazards influencing a power Journal of Geoinformatics 9.1: 73-82.
project like floods and landslides in the upstream regions
are directly dependent on the overall characteristics and Berthier, E., Arnaud, Y., Kumar, R., Ahmad, S., Wagnon,
status of the river catchment. With increasing urbanization, P., & Chevallier, P. (2007). Remote sensing estimates of
deforestation and climate change influences, both the glacier mass balances in the Himachal Pradesh (Western
water as well as energy potential of Himalayan river Himalaya, India). Remote Sensing of Environment, 108,
basins is declining. Events like flash floods in Parichu river 327−338
and rivers in Uttarakhand provide conclusive evidence of Bhambri R, Bolch T, Chaujar RK (2012) Frontal recession of
increasing vulnerability of dam projects in Himalayas. Gangotri Glacier, Garhwal Himalayas, from 1965 to 2006,
National Water Policy 2012 also recognises that Integrated measured through highresolution remote sensing data.
Water Resources Management (IWRM) taking river Current Science 102.3: 489-494. doi: 10.5167/uzh-59630
basin / sub-basin as a unit should be the main principle
Bolch T, Kulkarni A, Kääb A, Huggel C, Paul F, Cogley
for planning, development and management of water JG, Frey H, Kargel JS, Fujita K, Scheel M, Bajracharya S,
resources. Hence, government should focus on Integrated Stoffel M (2012) The state and fate of Himalayan glaciers.
River Basin Management leading to rejuvenation of water Science 336.6079: 310-314. doi: https://doi.org/10.1126/
potential of Himalayan rivers as well as stability of the science.1215828
terrain within the basin.
Bookhagen B, Burbank DW (2006) Topography, relief, and
Assessment of GLOF potential: Lakes associated with
TRMM derived rainfall variations along the Himalaya.
the melting and retreat of glaciers has been considered
Geophysical Research Letters 33 L08405
to be possessing significant hazard potential, owing to
sudden breach of natural embankments of these lakes. Bookhagen B, Burbank DW (2010) Toward a complete
Occurrence of these lakes and their flood potential could Himalayan hydrological budget: Spatiotemporal
have significant impact on the infrastructure downstream. distribution of snowmelt and rainfall and their impact
Hence, it is necessary to have a comprehensive assessment on river discharge. J. Geophys. Res. 115, F03019, doi:
of the glacier lakes occurring upstream of a hydropower 10.1029/2009JF001426.
project and take mitigatory measures to reduce their
Burbank DW, Blythe AE, Putkonen J, Sitaula BP, Gabet E,
GLOF potential.
Oskin M, Barros A, Ojha TP (2003) Decoupling of erosion
Joint coordination committee for Water and Energy: and precipitation in the Himalayas. Nature 426: 652-655.
To facilitate an understanding of the importance of inter- doi: 10.1038/nature02187.
GLACIER WATER AND ENERGY SECURITY 19CEA (2012) Report on minimization of water requirement Gupta, S.P. (2002) Report of the committee on “India
in coal based thermal power stations. Central Electricity Vision 2020”, Planning Commission, Government of India.
Authority, 2012
Haq, M Anul & Jain, K. and Menon, K.P.R. (2011). M Anul
Chen JL, Wilson CR, Tapley BD (2013) Contribution of ice Haq and Dr Kamal Jain, “Change Monitoring of Gangotri
sheet and mountain glacier melt to sea level rise. Nat Glacier Using Satellite Imagery”, 12th ESRI India User
Geosci 6:549–552. doi:10.1038/NGEO1829 Conference, 6-8 Dec.
Cogley, J. G.: Geodetic and direct mass balance Hong L, Stein B, Xu C-Y, Huss M, Melovold K, Jain SK (2015)
measurements: Comparison and joint analysis, Ann. Integrating a glacier retreat model into a hydrological
Glaciol., 50, 96–100, 2009 model–Case studies of three glacierised catchments in
Norway and Himalayan region. Journal of Hydrology 527:
Curlee, T. Randall, Michael J. Sale (2003) “Water and 656-667. doi: 10.1016/j.jhydrol.2015.05.017
Energy Security”, as presented in the conference ‘Water
Security in the 21st Century’, July 30-August 1, 2003 Huss, M. (2012), Extrapolating glacier mass balance to the
mountain-range scale: The European Alps 1900–2010,
Dieng HN, Champollion N, Cazenave A, Wada Y, Schrama Cryosphere, 6, 713–727, doi:10.5194/tc-6-713-2012.
E, Meyssignac B (2015) Total land water storage
change over 2003-2013 estimated from a global mass IMD (2013) State Level Climate Change trends in
budget approach. Environ Res Lett 10.12:124010. India. Meteorological Monograph No. ESSO/IMD/
doi:10.1088/1748-9326/10/12/124010 EMRC/02/2013. India Meteorological Department (IMD),
Ministry of Earth Sciences, Government of India.
Dobhal DP, Gergan JT, Thayyen RJ (2004) Recession and
morphogeometrical changes of Dokriani glacier (1962- Immerzeel WW, Pellicciotti F, Bierkens MFP (2013) Rising
1995) Garhwal Himalaya, India. Current Science 86.5: river flows throughout the twenty-first century in two
692-696. Himalayan glacierized watersheds. Nature Geoscience 6:
742-745. doi:10.1038/ngeo1896
Energy Statistics (2013) Central Statistical Organization,
Ministry of Statistics and Programme Implementation, Immerzeel WW, Van Beek LPH, Konz M, Shrestha AB,
Government of India Bierkens MFP (2012) Hydrological response to climate
change in a glacierized catchment in the Himalayas.
EPRI (2008) Water Use in Electric Power Generation, Climatic Change 110.3-4: 721-736. doi: 10.1007/s10584-
Electric Power Research Institute (EPRI) Report 1014026 011-0143-4
Fujita K, Takayuki N (2011) Spatially heterogeneous Immerzeel WW, Ludovicus PHVB, Bierkens MFP
wastage of Himalayan glaciers.” Proceedings of the (2010) Climate change will affect the Asian water
National Academy of Sciences 108.34: 14011-14014. towers. Science 328.5984: 1382-1385. doi: 10.1126/
doi:10.1073/pnas.1106242108 science.1183188
Gardelle J, Berthier E, Arnaud Y, Kääb A (2013) Region- IPCC (2007) Climate Change 2007: The Physical Science
wide glacier mass balances over the Pamir-Karakoram- Basis. Contribution of Working Group I to the Fourth
Himalaya during 1999-2011, The Cryosphere 7: 1263- Assessment Report of the Intergovernmental Panel on
1286. doi: https://doi.org/10.5194/tc-7-1263-2013 Climate Change [Solomon, S., D. Qin, M. Manning, Z. Chen,
M. Marquis, K.B. Averyt, M. Tignor and H.L. Miller (eds.)].
Gardner AS, Moholdt G, Cogley JG, Wouters B, Arendt AA,
Cambridge University Press, Cambridge, United Kingdom
Wahr J, Berthier E, Hock R, Pfeffer WT, Kaser G, Ligtenberg
and New York, NY, USA, 996 pp.
SRM, Bolch T, Sharp MJ, Hagen JO, van den Broeke MR,
Ligtenberg SR (2013) A reconciled estimate of glacier IPCC (2014) Climate Change 2014: Synthesis Report.
contributions to sea level rise: 2003 to 2009. Science Contribution of Working Groups I, II and III to the Fifth
340.6134: 852–857. doi: 10.1126/science.1234532 Assessment Report of the Intergovernmental Panel on
20 DISCUSSION PAPERYou can also read