GIS-AHP Multi-Decision-Criteria-Analysis for the Optimal Location of Solar Energy Plants at Indonesia
←
→
Page content transcription
If your browser does not render page correctly, please read the page content below
GIS-AHP Multi-Decision-Criteria-Analysis for the Optimal Location of Solar
                                                                 Energy Plants at Indonesia

                                                                  H. S. Ruiza , A. Sunarsob , K. Ibrahim-Bathisa,b , S. A. Murtia,b , I. Budiartoa,b
                                           a Aerospace and Computational Engineering Group & Space Park Leicester, School of Engineering, University of Leicester, University Road,
                                                                                            Leicester, LE1 7RH, United Kingdom
                                                    b Department of Mechanical Engineering, Politeknik Negeri Pontianak, Jalan Ahmad Yani, Pontianak, ZIP 8124, Indonesia

                                         Abstract
arXiv:2007.15351v1 [cs.CY] 30 Jul 2020

                                             A reliable tool for site-suitability assessment of solar power plants capable to account for the sustainable de-
                                         velopment and protection of cultural and biodiversity conservation areas is proposed. We present a novel Analytic
                                         Hierarchy Process (AHP) based approach for the Multi-Decision Criteria Analysis (MDCA) of SSI satellite retrieved
                                         data and local information sources, it within a GIS platform tailored to fit the needs of energy stakeholders at Indone-
                                         sia, simultaneously ensuring the conservation of legally protected areas. This imposes significant challenges due to
                                         the wide diversification of cultural, natural, and ecological protected areas that need to be considered, in landmarks
                                         that demand for high resolution imaging of surface solar irradiance (SSI) within ±4◦ of the equator. To overcome
                                         these challenges, a GIS spatial weighted overlay analysis for criteria layers such as climatology, topography, electrical
                                         grid, and road infrastructure has been performed, it based on the technical and economic feasibility for solar plants
                                         deployment within three approximation schemes focused on their proximity to the existing (i) power network, (ii) road
                                         infrastructure, and (iii) community settlements. Here, we focused on the West Kalimantan Province of Borneo Island
                                         (WKP), it mainly due to its possibility of onshore inter-connectivity and energy share with Malaysia and Brunei, and
                                         the high national and international importance that brings forward the protection of the biodiversity of Borneo. It has
                                         been found that the optimal location of PV plants can be reduced to just 0.03% (46.60 km2 ) and 0.07% (108.58 km2 )
                                         of WKP, in what we report as the best-suitable conditions out of the 33.05% exploitable area found after the exclusion
                                         of conservation areas. This corresponds to an estimated annual generation of 8.91 − 20.96 T Wh/year for conven-
                                         tional PV farms, resulting in a daily generation capacity of approximately 43.65 MW/km2 , where about 8.4 km2 of
                                         PV deployment will be sufficient to meet the national energy targets.
                                         Keywords: Solar Farms, Solar Energy, Protected Areas, Conservation Areas, Optimal Location, GIS, AHP, GHI,
                                         MCDA

                                         1. Introduction

                                             Being the third largest island in the world and with a privileged location over the equator, the island of Borneo is
                                         considered as one of the richest landmasses for renewable power generation, currently attracting substantial attention
                                         from governments and investors onto the search of adequate routes for planning and exploitation of their solar-energy
                                         resources. Politically divided among three countries, Brunei, Malaysia, and Indonesia, with the latter occupying up
                                         to 73% of Borneo’s territory, Borneo’s existing map for the expansion of their power generation and transmission
                                         sectors faces a considerably large number of societal, political and technical challenges, some of these caused by (i)
                                         their highly-decentralized power networks, (ii) their already overburden urban grids by the rapid growth in population
                                         and industrialization sectors, (iii) their large dependence on oil and coal based energy generators for off-grid rural sub-
                                         stations, and (iv) the large but vital constraints on the use of land and right-of-way imposed by the protection of their
                                         natural resources and conservation legal frameworks. However, it is the expectation of the Association of Southeast

                                            Email addresses: dr.harold.ruiz@leicester.ac.uk (H. S. Ruiz), sunarso@dosen.polnep.ac.id (A. Sunarso),
                                         ib132@leicester.ac.uk (K. Ibrahim-Bathis), sm1015@leicester.ac.uk (S. A. Murti), ib131@leicester.ac.uk (I. Budiarto)

                                         Preprint submitted to arXiv                                                                                                    July 31, 2020
Asian Nations (ASEAN), that by 2030 the Indonesian territory of Kalimantan together with the two Malaysian states
of Sarawak and Sabah, will have become a major energy resource center within an interconnected power network [1],
benefiting of a strong intake of renewable energy resources [2] for meeting the UN Sustainable Development goals.
However, whilst the state-owned energy provider Sarawak Energy is taking the lead on this milestone, according to
the figures disclosed by the Ministry of Utilities of Sarawak last December 2019 in the Borneo’s Sustainability &
Renewable Energy Forum [3, 4], the case of Indonesian’s Borneo results more complex to analyze, it due to the more
diverse set of legal constraints implied, and its high dependence on fossil-derived energy sources. In fact, the Indone-
sian situation is much critical than the Malaysian one, as just during the last five years Indonesia has imported about
200 million barrels of oil for the energy sector, with an approximate cost of 150 trillion IDR ( $11.5 billion) yearly [5],
resulting in a severe burden on the national budget whilst threatening the national energy security with compulsory
power outages for under-developed communities [6].
    This situation, added to the lack of reliable data for the deployment of other renewables, has led to the national
electricity company owned by the Indonesian government, PLN [7], which controls nearly 100% of the power dis-
tribution and generation sectors across the country, to issue of a new procurement plan in 2018 which overall shaves
further additions of energy stakes as a result of weaker-than-expected electricity demand growth, but sticking with
coal- fired generation as the main technology choice where existing geothermal plants cannot be considered as the
primary option. Still, in the most recent Indonesia’s 2019-2028 Electricity Procurement Plan (RUPTL) issued on
February 20, 2019 by the Ministry of Energy and Mineral Resources in conjunction with PLN and the Department of
Population and Civil Registration [8], RUPTL prioritizes the use of renewable energy sources as the basis for PLN
development business plans. For that purpose, also hydro-power and photovoltaic energy are being prioritized, with
the latter being subject to the identification of optimal locations for the deployment of solar farms, meeting a minimum
target of 1 GW solar power plant development per year until 2028. This is certainly a conservative figure given the
average insolation measure of 4.80 kWh/m2 /day [9], which can render to a bare estimation of about 500 GW of solar
power potential [6], but simultaneously denotes the main challenge that Indonesia is currently facing on the invest-
ment procurement for solar energy, which is no other than the identification of optimal locations where protected and
conservation areas are not a impediment for the expansion of PLN grid [10, 11].
    In fact, if Indonesia wants to meet its energy mix target by 2030, the power sector has already targeted the devel-
opment of solar PV plants with capacity of 6.5 GW in 2025 and 14.2 GW in 2030 [12]. To achieve this ambitious goal,
solar PV plants are expected to be developed across 34 provinces in Indonesia, from which the Kalimantan region is
expected to have a share of 1.081 GW in 2025, with 366.4 MW assigned to the West Kalimantan Province (WKP),
232.1 MW for East Kalimantan, 221.0 MW for Central Kalimantan, 160.0 MW for South Kalimantan, and 101.7 MW
for North Kalimantan. However, the country already struggles with a limited grid-connection and poor transportation
network, causing higher equipment delivery costs for the deployment of solar power farms, particularly in rural and
remote areas where the energy demand is still high and the electrification ratio is low [5, 10, 11, 13]. Additionally,
the lack of an appropriate regulatory support system for the energy tariffs between different regencies, the unstable
political and administrative coordination between local governments and stakeholders, and virtually non-existing tools
for site-planing and land constraints identification, discourage investors on pursuing developing and planning permits
as well as land acquisition bills for solar energy projects. Nevertheless, given the proximity of the existing power
network at the West Kalimantan Province (WKP) of Indonesia (see Fig. 1), and the largest of the Malaysian states
(Sarawak), the energy prospects of the WKP for renewable sources as solar energy present a singular interest in the
Borneo Region, although the planning of these facilities demand of a careful revision of the climatology and topog-
raphy conditions of the province, as well as the influence of legal and natural constraints imposed by the Indonesian
government and business stakeholders. Moreover, it is worth mentioning that between the different renewable sources
available at Indonesia [14], geothermal exploration in Borneo is not an option, as this is legally classified as a mining
activity that can endanger the sustainability of protected and conservation areas [15], but whose privileged location
over the equator gives it certain privilege for the consideration of solar farms.
    WKP is the second largest and most populated province at Borneo, which according to the latest report facilitated
to us by PLN [16], it currently has less than 0.01% of solar installed capacity (0.18 MW), within a total WKP genera-
tion capacity of 200.99 MW, from which more than 60% of it (123.03 MW) comes from Diesel powered generators.
Therefore, designing an adequate planning tool for the identification of optimal locations of solar power plants at WKP
has been identified as a priority for the Indonesian government, and in general of Borneo Island, being this the central
subject of this paper which reports on the main results of the 2019-2020 British Council Newton Fund Institutional
                                                            2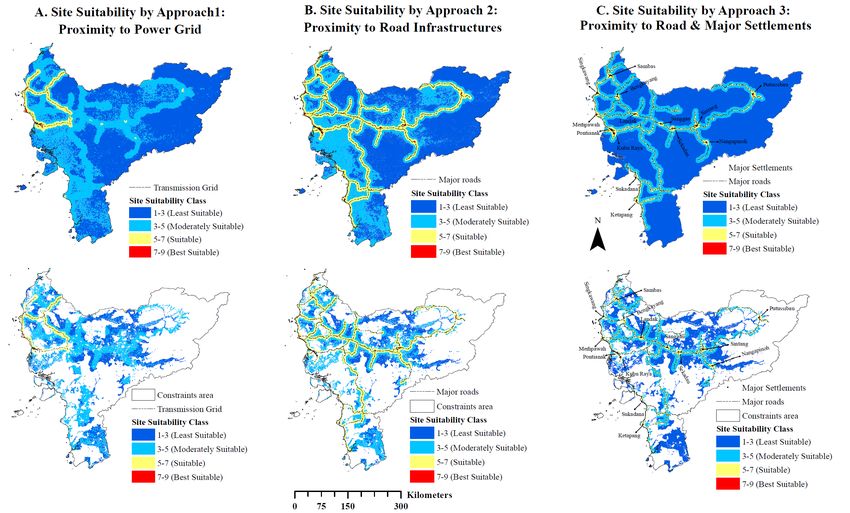
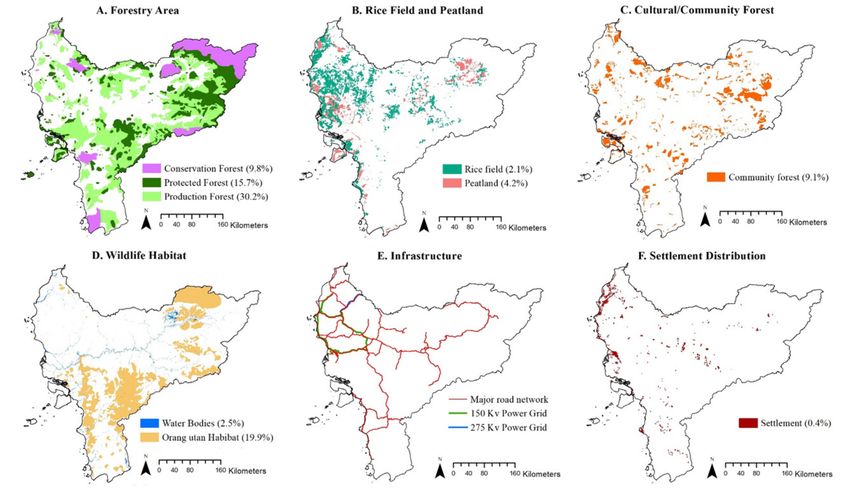
Figure 1: Location map of the West Kalimantan Province (WKP) at Indonesia’s Borneo.

Links project “Solarboost” [17]. For this purpose, we have counted with the active participation of major Indonesian
stakeholders such as PLN [7], the Ministry of Energy and Mineral Resources (ESDM [18]), the Regional Develop-
ment Planning Agency (BAPPEDA [19]), the Ministry of Environment and Forestry (MENLHK [20]), the Ministry of
Agriculture (PERTANIAN [21]), the Ministry of Public Works and Public Housing (PUPR [22]), and Indonesian Me-
teorology Climatology and Geophysics Council (BMKG [23]), which all have helped us into the conceptual design
of our Geographic Information System (GIS), aided by a Multi-Decision Criteria Analysis model (MDCA) and an
integrated Analytical Hierarchy Process (AHP) for policy making decisions, which ultimately helps to eliminate the
communication and administrative barriers that are currently impeding the successful deployment of the solar sector
across the region. Our system allows to identify optimal locations for solar power plants aimed to potential energy
investors, based on a weighted overlay analysis of satellite retrieved high-resolution surface solar irradiation data,
aided by relevant topographical, land use, and infrastructure data layers provided by our stakeholders at WKP.
    Consequently, in this paper we present a comprehensive study about the main barriers that, within a data-oriented
approach, must be incorporated into a GIS-AHP algorithm for the deployment of solar energy plants in landscapes
with robust challenges as the ones encountered in the WKP at the Borneo Island. In processing all these spatial
data, including vulnerability zones, protected and conservation land areas for analysing the solar energy feasibility
in WKP, in Section 2 we introduce a Multi-Decision Criteria Analysis (MDCA) model integrated within an AHP
algorithm which renders the analytical techniques for achieving higher effectiveness of GIS decision systems with
multiple layers of information (see Fig. 2), in similar way to the recent works of H. Z. Al-Garni et. al. on Saudi
Arabia [24] and H. E. Colak on the province of Malatya in Turkey [25]. Then, in Section 3 the results obtained
from three different MDCA schemes are described, and the comparisons between their performances and subsequent
implications are demonstrated, such that an optimal scheme and consequently an optimal area for the installations of
solar power plants at WKP is disclosed. Finally, the main conclusions of this paper are presented in Section 4.

                                                               3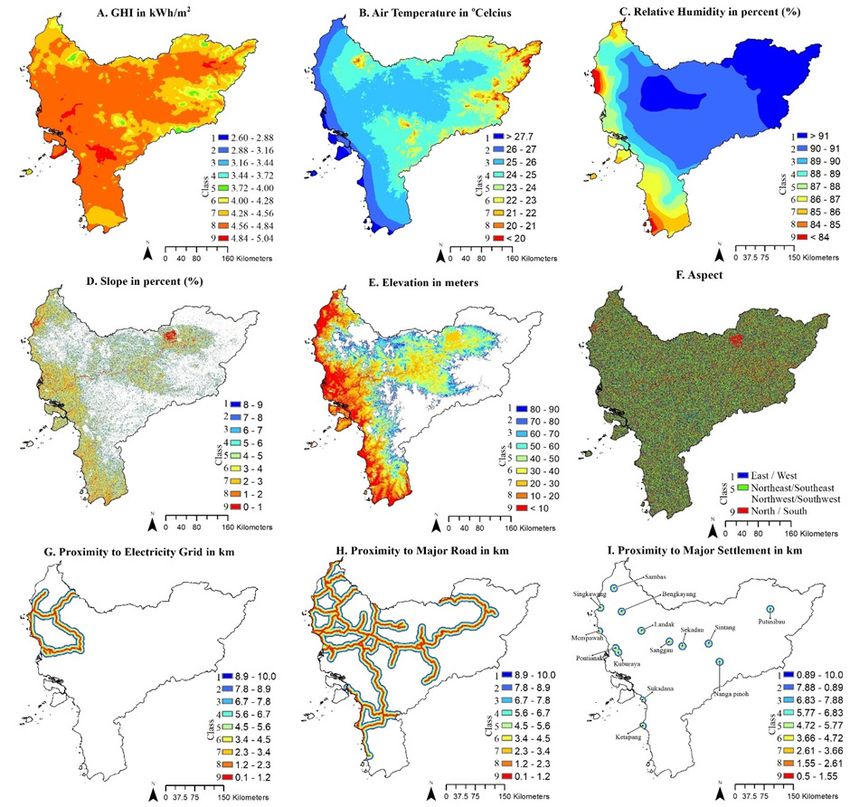
SolarBoost
                                                                  GIS-MDCA-AHP
                                                                  (Data Collection
                                                                and Pre-processing)
                                                                                                 MDC-AHP Data
                                 Constraint Layers
                                                                                                 Layers (criteria)
                                                             Analysis Scheme (1, 2, 3)
                                                            Priority Re-Classification of
                                                                                                      GHI
                                                            criteria as response to local
                                                                constraints/demands
                                                                       (MDCA)                    Temperature
                                    Protected
                                  Areas by land                                                     @ 2m
                                   use/policies                                                    altitude
                                                           Reclassification Criteria and
                                                           Priority Weighting (AHP-OS)             Relative
                                                                                                   Humidity

                                                            GIS Spatial Integration and
                                                                                                    Digital
                                   Protected                Weighted Overlay Analysis
                                                                                                   Elevation
                                   Areas by                       (ArcMap-GIS)
                                                                                                    Model
                                  Recognized
                                 cultural Value
                                                                   GIS Making                        Slope
                                                             Apply Spatial Constraints

                                                                                                     Aspect
                                  Conservation             Generate Site Suitability               (Azimuth)
                                     Areas by                      Maps
                                   recognized               Estimate Solar Energy
                                   natural and                                                        Road
                                                                  Potential
                                    ecological                                                   Infrastructure
                                      value
                                                                                                      Grid
                                                                Is the Analysis                  Infrastructure
                                                                    Scheme
                                Report Outcomes
                                                                 Sufficient for
                                                     YES        Stakeholders?               NO   Settlements

Figure 2: Working flowchart of the GIS-AHP-MDCA platform developed for this study, which has been called SolarBoost to make reference to the
funder’s project identifier.

2. GIS-AHP-MDCA Model Framework

    GIS-based Multi Criteria Decision Analysis (GIS-MDCA) techniques aided by AHP models for generating maps
of potential areas for solar power plants development, in varying climate and topographic conditions, have been the
subject of intense research during the last few years [24–37]. However, a common factor between all this literature is
that the availability of feasible sites for large scale solar farms deployment, results highly determined by the different
criteria that could have been selected in the study factors, and their corresponding weighting which are assigned within
the AHP algorithm. Therefore, although there is no strict protocol in assigning weighting factors between the assessed
criteria when these are not clearly linked by a known physical variable, like it is the case, for instance, for the Global
Horizontal Irradiation factor (GHI) and its relation with the proximity of a solar farm with relevant local infrastructures
(power network, roads, settlements, etc), then the assigning of relative weighting factors mostly depends on the
decision of the researchers after their consultancy with relevant stakeholders and policymakers. To illustrate this, in
Table 1 we present a brief comparison of some of the most relevant literature where different AHP weightings have
been assigned to the same criteria, but based on the understanding of the authors of the local conditions and further
constraints of the scrutinized area, as well as the state-of-the-art literature at the time of the publications (see [24–
34, 36, 37] and references therein). Within this, we can see that regarding to the development of solar farms, the GHI
is generally considered as the evaluation criteria with the greatest weighting factor, in particular when the area of a full
country is being analyzed. However, when a better insight of the local climate, topology, energy-related policies, and
the stakeholders interests is known, a larger weighting can be given to other particular criteria such as, for instance, the
dust storms in Isfahan-Iran [32], or the proximity to the existing power grid in Cartagena-Spain [36]. Therefore, if we

                                                                         4
Table 1: AHP weighting factors for different evaluation criteria extracted from the literature.
Evaluation Saudi Mauritius Serbia Isfahan Iran Cartagena
Criteria Arabia [24] [29] [31] Iran [32] [34] Spain [36]
Solar radiation (GHI) 0.322 0.401 0.305 0.25 0.275 0.238
† † †
Sunshine radiation (daylight hours) 0.131 0.184 0.19
Air temperature 0.243 0.033 0.111 † 0.071 0.048
Relative Humidity † 0.016 0.048 0.043 0.041 †
Elevation † 0.021 † 0.059 0.081 †
Slope 0.163 0.194 0.153 0.042 0.08 0.112
Land Aspects/Use 0.108 0.046 0.077 0.066 0.07 0.116
Vegetation † † 0.122 † † †
Clouds/Snow/Rain/Dust conditions † † † 0.254 0.101 †
Proximity to Power Grid 0.085 0.093 † 0.05 0.112 0.415
Proximity to Road Infrastructure 0.046 0.065 † 0.032 0.088 0.043
Proximity to Settlements 0.032 † † 0.014 0.081 0.028
†
This criteria has either, not been considered within the cited study or it is not of relevance for the study location.
want to provide a reasonable estimation of the criteria of interest and their corresponding weighting factors in a GIS-
AHP algorithm for Borneo island, bearing in mind that ultimately this must be conceived as a platform aimed for the
promptly use of solar energy investors and local policy-makers, we argue that the best and most sensible strategy is to
focus the study first at a province level (e.g., at WKP), where decisions could be made promptly without encountering
inter-regional administrative and political barriers.
In consequence, the present section of this study focuses on the formulated methodology for finding the optimal
location or best suitable area for large scale solar power plants (> 5 MW), with special emphasis on the retrieved data
from local information sources at WKP in Indonesia’s Borneo. This enables the further consideration of vulnerability
zones such as Borneo’s conservation and land protected areas, as well as other information layers with relevant cli-
mate, topology, settlement, and proximity to infrastructure (roads and power grid) data, which are all together analyzed
with respect to their spatial interrelationship with the local GHI map and its derived solar energy potential. In brief,
a GIS-AHP MDCA method is employed to assign the rank and priority factors for the information layers aforemen-
tioned, where for the sake of simplicity and accessibility to any stakeholder, we have taken advantage of the recently
introduced AHP Online Software (AHP-OS) by K. Goepel [38], and then, a comprehensive spatial weighted overlay
integration analysis is performed in ArcMap-GIS software (v10.6.1) following the overall methodology depicted in
Figure 2.
Firstly, concerning to the collection of data for the GIS-AHP MDCA platform, we are specifically interested in
the West Kalimantan Province which extents between 2◦ 080 N and 3◦ 020 S, and between 108◦ 330 E and 104◦ 100 E,
covering a total area of 146, 807 km2 , with 14 major cities/settlements distributed across the province as show in Fig. 1.
With the equator line crossing across this region the climate conditions of WKP are fairly uniform and ideal for the
deployment of solar farms as reported by BMKG [23], with a daily average of sunlight of 12 hr and 7 min (sunrise
∼ 05 : 50, sunset ∼ 17 : 57), an annual average relative humidity of more than 90%, and a daily mean temperature at
2 meter height which varies between 25.9◦ C and 28.4◦ C across the entire year. Therefore, daylight is not a criteria to
be considered in this study as it will be irrelevant into a MDCA, but temperature and humidity are weighting criteria
that still need to be considered, this mainly due to the fact that the efficiency of photo-voltaic (PV) cells and solar
mirrors, both strongly depend on the variance of these two factors. However, as the annual mean temperature and
relative humidity variance across WKP is almost negligible (< 2%), they can be defined as a low priority criteria.
Additionally, the WKP is benefited by a low slope topology which is ideal for minimizing aggregated costs of land
leveling and flattering, both commonly required for the deployment of solar farms [39, 40], what makes also of this
factor a low weighting criteria. Here, it is worth emphasizing that this study is not limited to PV farms but instead
5Table 2: GIS layers defining local constraints.
Data Layer Source Constraint
Settlement Location [41] Settlement Proximity (Sp)
Power Grid [7, 42] Grid Proximity (Gp)
Road Network† [43] Road Proximity (Rp)
Forestry Area [20, 44] Protected area by law enforcement No. 733/2014 and no. 45/2004
Wildlife or Endangered habitat [45] Protected area by law enforcement No. 308/MENLHK/2019
Peatland [44] Protected area by law enforcement No. 8599/MENLHK/2018
Cultural/Community Forest [44] Protected area by law enforcement No.21/MENLHK/2019
Water bodies [46] Protected area by law enforcement No. 38/2011
Rice field [47] Protected area by law enforcement No.1/Perda Kalbar/2018
†
Data retrieved in paper format.
considers the whole solar energy prognostics, where other means of solar energy capture can be conceived such as
solar thermal collectors. This explains why our study is focused on relatively large solar power plants (> 5 MW)
which are aimed to be connected to the main electrical grid, instead of off-grid approaches for small communities
where roof PV-cells might be sufficient.
Likewise, in what concerns to the intensity of Global Horizontal Solar Irradiation, having chosen WKP as case of
study is not an arbitrary decision as by analysing the data recorded by Solargis and The World Bank Group [48, 49],
the highest potential of total global horizontal irradiation (GHI) per year is recorded in the city of Ketapang at the SE
part of WKP (see fig. 1) with 1742 kWh/m2/year. Nevertheless, this figure is subject to a maximum uncertainty of
±8% due to the high humidity level of the region, which adds another reason for which the humidity criteria needs to
be accounted even if it has a low priority factor. Actually, the GHI, topology, and climatology data layers which can
be collected from online public domains, all together serve as the base framework for any GIS-AHP MDCA model
regardless of the location (see Table 1), but it is the local data provided by relevant stakeholders what can give an
actual meaning and impact for choosing one or another MDCA-AHP scheme. In this sense, the different data layers
collected from local stakeholders at WKP are summarized within Tables 2 & 3, where the full set of GIS criteria
layers, sources of information, and mapping constraints are disclosed.
2.1. GIS Constrained Data Layers
In a hierarchy process, all data layers mentioned in Table 2 are initially classified as secondary maps as these have
to be preprocessed or digitalized for adequate rendering into the GIS platform. Thus, any non-spatial data collected
from the different sources are converted into the spatial data and assigned UTM projection system, where north and
south UTM grid zones must be considered for area calculations given that the WKP lies partially in both sides of
the equator. Some of these data layers are considered as constraint layers as these involve protected land factors
dictated by national and regional laws, where energy investments and related works might be undermined or simply
prohibited by the sole existence of these factors. In particular, we have found that about 66% of the total land area of
WKP (See Fig. 3) is subjected to legal constraints where any kind of developmental activities or inversion on these
lands, different to the one originally intended, is heavily penalized by law enforcement due to their potential threat
to the environmental and ecological equilibrium at local, national, or even global scale, as defined by the Indonesian
government.
The constraint layers which are particularly defined by the enforcement of national or regional laws, and therefore
demand liaison with relevant stakeholders [7, 18–23], or at least a comprehensive knowledge of relevant governmental
laws and the local language, can be classified between different subgroups for easy GIS visualization (see Table 2).
Between these, we can find: (i) Forestry Areas (Fig. 4A), which include factors such as production forestry (30.2%
of WKP), protected forests (15.7%) and conservation forests (9.8%), (ii) Production and conservation weatlands
(Fig. 4B), including rice fields (2.1%) and peatlands (4.2%), (iii) Protected cultural and community (Fig. 4C) forests
6Figure 3: Map showing the total calculated constraint region at WKP (in black), defining prohibited areas for solar farms deployment as reported
in Table 2. Source Maps can be consulted at our created Web-Gis within the SolarBoost project [17] or by request to the author of correspondence.
(9.1%), (iv) Wildlife habitats (Fig. 4D) which account for water bodies (2.5%) and protected Orang-Utans habitats
(19.9%), (v) Relevant infrastructure (Fig. 4E) such as, the major road network, and power transmission grid and,
finally, (vi) the settlements which comprehend 0.4% of the WKP area (Fig. 4F). Thus, by overlapping all these data-
layers, we have found that at least 66% of the total area must be extracted or constrained from the general GIS within
MDCA-AHP (Fig. 3), in order to determine the optimal location for the installation or foreseeable deployment of
solar power plants at WKP. However, it is important to mention that although other constraint layers belonging to
relevant productivity areas at Indonesia could be included, such as oil palm and mining areas, these areas are not
being included in this study as the current energy plans of the country aim for the reduction of its dependence on these
sources [8, 12, 52], and furthermore, these are not considered as protection or conservation areas as per the law.
2.2. GIS Methodology for assessing AHP Weighted Data Layers in the MDCA
To complement Table 3, it is worth mentioning that concerning the GHI and air temperature data, the World Bank
Group (WBG) has already released average monthly datasets for 11 years [49], where the monthly average deviation
at WKP does not exceed the 7%, reason why singular (averaged) maps can be used for any of these factors, within this
range of tolerance. Likewise, in order to interpolate the yearly average relative humidity data obtained as point data
from NASA [50], we have used the Kriging interpolation technique to generate spatial maps via the spatial analyst
tools in ArcGIS 10.6.1 [53, 54]. Also, we have used the Shuttle Radar Topography Mission Digital Elevation Model
(STRM-DEM) retrieved from the CGIAR Consortium for Spatial Information [51], in order to prepare the ArcGIS
topographical factor layers such as Elevation, Slope and Aspect maps. Thus, in Fig. 5 the spatial maps for all selected
nine factors in Table 3, with their reclassified MDCA layers are shown, such that a further weighting system can be
now invoked for enabling the AHP algorithm render towards a unique solution. However, as it has been mentioned
at the introduction of this paper, assigning criteria factor layers and corresponding weights within an AHP algorithm
7Table 3: GIS-AHP-MDCA classification criteria layers subdivided into three major factors: (i) Climatology: GHI, Temperature, and Relative
Humidity, (ii) Topography: Elevation, Slope, and Aspect, and (iii) Proximity factor: Power Grid, Road infrastructure, and Major Settlements.
AHP Factor Source Range Class Range ∆ AHP Grading 1-9 Class Limits
GHI [49] 2.6 − 5.04 0.28 Grade n = 1 to 9 class limits @
[kWh/m2 ] GHI= 2.6 + n ∗ ∆
Grade 1 class @ T > 27.8,
Temperature (T ) [◦ C] [49] 17.1 − 27.8 1 Grade n = 2 to 8 class @ 27 − (n − 1) ∗ ∆
Grade 9 class @ 27 − (n − 1) ∗ ∆
Relative Grade 1 class @ H > 91,
Humidity (H) [50] 81.99 − 91.58 1 Grade n = 2 to 8 class @ 91 − (n − 1) ∗ ∆
[%] Grade 9 class @ H < 84
Elevation [51] < 90 10 Grade n = 1 to 9 class limits @
(DEM) [m] DEM = 90 − n ∗ ∆
Slope [51]Figure 4: Thematic maps used as constraint layers for site exclusions within the MDCA-AHP suitability analysis for the deployment of large scale
solar PV plants in WKP. Source Maps can be consulted at our created Web-Gis within the SolarBoost project [17] or by request to the author of
correspondence.
on the temperature and relative humidity conditions where they are installed.
According to the literature, on the one hand, the efficiency of state-of-the-art PV systems increases for tem-
peratures lower than 25 ◦ C, but at higher temperatures, every 1 ◦ C rise leads to a decrease in the power output of
0.4 %-0.5 % [29]. Hence, areas with lower average temperatures are more favorable in the context of enhancing PV
system performance, and consequently must be assigned the highest grading classification, where in the specific case
of WKP (Table 3), the analysis of the data provided by the WBG have revealed that, in average, the daily temperature
at sunlight hours ranges from 17 ◦ C to 28 ◦ C, with substantial areas which might influence negatively onto the making
decision process for the deployment of PV farms (see Fig. 5B). On the other hand, the higher is the amount of relative
humidity in an area the greater is the absorption of short wave solar radiation by surfaces moisture, which drops the
total amount of incident solar irradiance usable by the solar panel [59, 60]. Therefore, areas with high humidity are
less prone to the exploitation of solar energy, corresponding thence to the lowest grade classes in our AHP model,
with the opposite behavior for the highest classes (Table 3). This data was obtained at 130 locations across the WKP
as point data from NASA [50], which is then utilized for interpolating the yearly average relative humidity by using
the spatial analysis Kriging interpolation technique in ArcGIS 10.6.1 [53] as mentioned above. This technique is a
powerful interpolation method based on geostatistical techniques, which allows to predict the autocorrelation rela-
tionships among the measured points whilst affording a measure of spatial accuracy on the derived map [54], from
which we have obtained that the relative humidity in the WKP varies from 82% to 91.5% (see Fig. 5C). Additionally,
as mentioned above, the topographical factors have been derived from the 30-meter Shuttle Radar Topography Mis-
sion Digital Elevation Model (SRTM DEM) [51], whose processed dataset is further utilized to prepare the elevation,
slope, and topographical aspect maps included in Fig. 5 D-F. Therein, to reduce or even avoid the high expenditure
derived from construction costs in high elevated and steep slope areas, the most favorable grade classes are given for
land areas below 90 m in elevation, with flat or mild slopes (< 9%), and with north/south facing slope (see Table 3).
Also, the proximity to infrastructure and settlement locations is considered as one of the major factors to be in-
cluded into the GIS-AHP-MDCA algorithm, as these can have a strong impact on any technical economical feasibility
9Figure 5: Reclassified layers of input criteria as shown in Table 3, with grades ranging from class 1 with low suitable value (blue color) up to the
class 9 (red color) referring to maximum suitability conditions for the deployment of solar power plants. Source Maps can be consulted at our
created Web-Gis within the SolarBoost project [17] or by request to the author of correspondence.
study of solar plants. For instance, the greater is the distance between the prospective solar plant and the existing cur-
rent transmission lines, the larger will be the investment value on related infrastructure as the costs associated to
transportation of specialist goods and right of way could significantly increase [28, 29]. Therefore, the highest-grade
scale into the power-grid factor has been assigned for the areas closest to the 150 kV and 250 kV transmission lines
at the WKP (Fig. 5G), with the latter being the one connected to Malaysian power grid, and where besides invoking
the grading scheme shown in Table 3 with class variations within a range of 1.1 km, a buffer zone of 100 m has been
assumed in order to ensure electrical safety when working near overhead power lines [61]. Likewise, as the areas
nearest to the major roads will avoid additional costs of transporting equipment during the construction and main-
tenance processes of a solar plant, a maximum radius of 10 km from road points has been considered by using the
Euclidean Proximity method [29], where we have added a buffer of 100 m from either side of major roads to reduce
the levels of no-natural dust sources on which the solar panels could be exposed and, even the possibility of expansion
of the road by increment of the carriageways of road lanes (see Fig. 5H). Then, the final factor to be considered is
the proximity to settlements, where also a buffer of 500 m must be excluded from the calculations in order to reduce
adverse environmental impacts on urban growth and population as suggested in [32].
10Table 4: AHP pairwise likert grading criteria scale used for the GIS-MDCA algorithm
Grading Grade Definition by Description
criteria Relative Importance (Ranges)
1 Equally important Both criteria contribute equally to the objective
(within the CR)
2 Mildly low Both criteria nearly contribute equally to the objective or,
slightly favor one criterion over another (within CR and 12.5%)
3 Moderately low The contribution moderately favor one criterion over another
(within 12.5% and 25%)
4 Low The contribution has a low tendency to favor one criterion over another
(within 25% and 37.5%)
5 Medium The contribution has a medium tendency to favor one criterion over another
(within 37.5% and 50%)
6 Mildly high The contribution has slightly higher than the medium tendency to
favor one criterion over another (within 50% and 62.5%)
7 Moderately high The contribution of one criterion over another is moderately high
(within 62.5% and 75%)
8 High The contribution of one criterion over another is high
(within 75% and 87.5%)
9 Extremely high The contribution of one criterion over another is at the highest in the grade
(greater than 87.5%)
2.3. Implementation of the AHP
The Analytic Hierarchy Process (AHP) is a powerful tool for MDCA which uses ratio scale factors for pairwise
comparison enabling the making of a judgment or decision from the weighting of several criteria [36, 62–64]. The
pairwise comparison of different criteria makes AHP algorithms easy to adopt in complex GIS problems where spatial
aspects can be considered by comparison of two different attributes at a time [64–66], using standard grading clas-
sification ranges as the ones shown in Table 3. Consequently, our algorithm involves a pairwise comparison matrix
for nine factors with pair relative importance ranks given by the 9-point likert scale shown in Table 4, from which the
relative criteria weights have been obtained by the standard AHP priority-matrix normalization method [63], and the
AHP priority calculator introduced in [38]. For this purpose, the priority-matrix normalization method cannot be con-
fused with the common definition of matrix normalization in linear algebra, as in the AHP method the priority-matrix
has to be normalized by dividing each assigned numerical value with the sum of values in the belonging column of the
AHP priority calculator and then, the average for each row in the matrix is calculated following the strategy adopted
in [31], which specifically applies for the MDCA of solar plants development based upon GIS-AHP algorithms.
Then, in order to check the consistency of the decision maker’s pairwise scores, we have calculated the consistency
ratio, CR = CI/RI, where the consistency index (CI) is defined by:
λmax − n
CI = , (1)
n−1
with λmax the eigenvalue of the pairwise comparison matrix and n the criteria number, where the random consistency
index values, RI, for the n values have been considered from [64].
Thus, to obtain meaningful results with the AHP technique within our GIS-MDCA calculations, we have ensured
that for all the analyzed cases the CR is less or equal to 5%, otherwise the pairwise comparison values are recalculated
for improving the factors weighting consistency. This can be seen in Table 5 where different prioritization schemes or
MDCA approaches have been taken for all the nine factors within the three major considered criteria, i.e, climatology,
topography, and proximity to location, being the latter the one which has a greater influence in the search for an
11Table 5: Criteria and Factor weightings for the three discussed AHP approaches, each with the highest weight given either to the distance to (1)
the power network, (2) the road infrastructure, or (3) the community settlements
Factor weighting Aggregated criteria weight
Criteria AHP Factor by approach by approach
1 2 3 1 2 3
GHI 0.250 0.222 0.158
Climatology T 0.086 0.093 0.086 0.355 0.344 0.265
H 0.019 0.029 0.021
DEM 0.026 0.030 0.027
Topography S 0.052 0.071 0.058 0.114 0.150 0.128
Az 0.036 0.049 0.043
Gp 0.272 0.0 0.0
Proximity to Location Rp 0.148 0.351 0.339 0.531 0.506 0.607
Sp 0.111 0.155 0.268
optimal location of solar power plants, it due to the fact that the time and spatial variance of the climatology and
topography factors have shown a negligible impact on their pairwise comparison with the GHI factor, as it will be
shown by the sensitivity analysis shown in the following section. Consequently, the results presented in this paper are
reduced to three fundamental approaches, these based upon the proximity of the solar plant to (1) the power network,
(2) the road infrastructure, and (3) the community settlements, where the factor weights reported in Table 5, resulted
in consistency ratios of, CR = 4.2%, 4.1%, and 4.5%, respectively.
3. Results and Discussion
In a simple analysis of the GIS layers that correspond to the climatology criteria (top row in Fig. 5), it is easy
to visualize how more than 98% of the WKP could be classified as a “suitable” area for the installation of solar
power plants, if only the GHI is considered as the governing factor onto the making decisions process. Furthermore,
although this decision could be refined by considering the lowest temperatures at the eastern areas of WKP, where
the efficiency of solar power panels would be expected to be higher, still those areas are the ones with the highest
relative humidity playing the opposite role on the overall performance of the panels. By these reasons, regardless of
the AHP grading classification scheme assumed (with CR < 5%), if only the climatology factor is used within the
GIS-AHP-MDCA algorithm, no less than 96% of the WKP area could be classified as technically suitable for the
deployment of solar power plants. Evidently, an area of such magnitude cannot be categorized as optimal, even when
the GIS layer mapping the lands with conservation or protected status (Fig. 3 are excluded, what renders to a maximal
30% of exploitable area for the deployment of solar power plants.
The resulting 30% of WKP, although already considers a strong reduction of the searchable area for the installation
of solar power plants, simultaneously reducing the likelihood of finding legal barriers that could stop the investment
on this technology, this simplified approach still presents significant challenges in terms of the grid-connectivity and
technical deployment of solar farms. Therefore, as general rule, the topographical criteria must be considered as the
secondary AHP factors, which in the case of WKP (middle row in Fig. 5), and in general of Borneo island, these
produce a nearly negligible impact onto the assessment of optimal locations of solar power plants. This is due to the
fact that nearly all locations at Borneo show relatively the same Aspect conditions (relative to sun light), and the slope
and elevation factors in non constrained areas (at least in WKP) show little variance on the suitability grading, i.e.,
with the vast majority of non or less suitable areas (classes 1-5) appearing into or in close proximity to protected or
conservation areas. Therefore, the inclusion of the topography criteria lead only to a maximum optimization of the
area searched from the 30% of the WKP found before, towards just a 25% − 28% area regardless of the AHP grading
classification scheme assumed for the topography criteria.
12Figure 6: Spatial map showing suitability sites for large-scale deployment of solar farms at WKP before (top pane) and after (bottom pane) excluding
the constraints’ layer shown in Fig. 3, under the approaches (1) proximity to the power grid (left pane), (2) proximity to road infrastructure (middle
pane), and (3) proximity to roads and settlements (right pane). Class legends must be read with the highest numerical level being non-inclusive,
otherwise included.
Thus, in order to provide a sensible map of optimal locations for the installations of solar power plants at WKP,
which goes beyond the already comprehensive task of compiling the large set of local information for defining ex-
clusion areas, here we focused on the relevance of the proximity factor under the three approaches discussed above
(Table 5), i.e., when the highest weighted factors are given to the shortest distances between the aimed location for the
deployment of a solar plant and (1) the power transmission network, (2) the major roads, and (3) the settlements (see
bottom row at Fig. 5). Then, as the GHI across WKP has been proven to be quasi-steady and generally high along
the whole year, the GHI factor is always assigned the second priority rank after the proximity factor, assuring thence
a feasible amount of solar irradiation for a profitable energy production at a prospective location. Therefore, in order
to simplify the analysis of the derived spatial maps from these approaches (Fig. 6), the weighted overlay analysis of
GIS layers have been grouped into four suitability categories with the “less suitable class” including the grades 1 to 3
from Table 3 and then, the “moderately suitable”, “suitable” , and “best suitable” classes, each grouping the grades 3
to 5, 5 to 7, and 7 to 9, respectively. Likewise, a detailed summary of the estimated areas for the optimal location of
solar power plants with and without the exclusion of constrained areas is included in Table 6.
Also, it is worth noticing that depending on the technology for the conversion of solar energy and the GHI value
at the region chosen, the required area for the production of a MW of power can vary[67]. In this sense, the yearly
electric power generation potential (GP) at the WKP has been estimated from:
GP = S R × CA × S F × η × 365 , (2)
where S R is the annual averaged daily GHI in kWh/m2 /day, CA defines the available or suitable land area for the
deployment of solar farms in m2 , S F is the so-called shading factor which is an indicative measure of what fraction
of the calculated areas is exploitable for PV panels (or any other solar conversion system), and η is the solar power
conversion efficiency of the system called. In this sense, we have assumed a shading factor of 0.7 based on the
13maximum fraction of land that can be covered with PV solar panels with minimum shading effect [67], and a PV
panel conversion efficiency of η = 16% as a representative figure of the average efficiency of commercial silicon PV
modules [29].
Thus, when the approach 1 is considered, the best suitable area for the optimal deployment of solar power plants
where the highest MDCA-AHP priority factor has been given to its proximity to the power grid, followed then by the
intensity of GHI, is reduced to only 230.59 km2 , i.e, about 0.16% of the WKP, which corresponds to an estimated
solar energy potential for the generation of up to 43.98 T Wh/year. However, we have found that nearly 80% of
this area is actually constrained by conservation and protection laws, which limits the exploitation of solar energy
to only 46.60 km2 of the WKP, i.e., about 8.91 T Wh/year, which corresponds to a daily generation capacity of
approximately 43.65 MW/km2 . This means that by utilizing approximately 18% (∼ 8.39 km2 ) of the determined area
for the development of PV projects, the national target of 366.4 MW for the WKP established by the Presidential
Regulation No. 22 of 2017 (RUEN [12]) could be achieved, although it would demand of a considerable investment
by PLN and possibly by other energy stakeholders. In fact, being the national owned company PLN the major
energy stakeholder in Indonesia, we have found that their current electricity supply business plan, locally called as
RUPTL [52], lacks of sufficiently documented plans for solar energy capable to meet the RUEN targets, reason why
the disclosing of suitable PV deployment areas within well documented approaches, as the ones implemented in this
study, are expected to impact onto the development of local policies aimed to help the country to achieve its national
targets. Moreover, given the relatively homogeneous GHI and topographical profiles across non-constrained areas at
WKP (see Figs. 2 & 3), and actually of what is expected of any non-constrained area at national level, the estimated PV
daily generation capacity of approximately 43 MW/km2 is not expected to change, what could allow other provinces
to set up analogous policies.
In fact, even if the less suitable areas at WKP are considered, i.e., those within the suitability classes 1-3 (21537 km2 ),
the calculated PV daily generation capacity does not vary substantially (43.37 MW/km2 ), leading therefore to nearly
the same area needed for meeting the RUEN target (∼ 8.44 km2 ), but under the expense of possibly increasing the
infrastructure costs controlled by the proximity between the solar farm and the current settlements and roads infras-
tructure. Thus, a much larger room for the deployment of solar power plants is foreseeable if the suitability scale
considers as well the classes 5 − 7, rendering to an exploitable area of about 2615.42 km2 (1.78% of WKP), that (in
average) corresponds to areas within 3.3 km and 4.5 km of distance between the solar plant and the existing power
network (see Table 3). However, the drawback of this approach is that it implies that the “suitable” and “best suit-
able” classifications will restrict the development of solar power plants only around the northwest of WKP, where
the main power transmission network and major cities are located, deprecating the development of further routes of
commerce and communities at the central, east, and south regions of the WKP. Still, within the approach 1 these areas
are somehow covered by the classes 3-5, which are considered as regions “moderately suitable”, showing the impact
of considering the proximity to the roads as a major factor within our GIS-AHP-MDCA algorithm. Nevertheless,
if beyond the upgrading of the existing power grid the government decision is to extend or to increase the current
capacity of the transmission network, covering then the communities above mentioned, the power grid itself which
already collides with some major roads becomes irrelevant, and consequently the derived map under the approach
1 (Fig. 6 A) could deliver an incorrect message to policy-makers. Therefore, for the development of a new power
network sustained by solar power plants, a more refined approach is still required.
Based in the observations above, and by noticing that the electricity grid is also at the proximity to major roads
connecting the cities of Sambas, Singkawang, Menpawah, Pontianak, Kuburaya, Landak, and Bengkayang (see bot-
tom row of Fig. 5), it is possible to center the proximity to location criteria to only the factors of Road Proximity, R p ,
and Settlement Proximity, S p as shown in the approaches 2 and 3 of Table 5. Within these strategies, is then important
to re-assess the weighting criteria for each one of these factors, such that comparison between the different schemes is
viable, by ensuring that the same or nearly the same consistency ratio is obtained as mentioned in section 2.3. Thus,
in the approach 2, the R p is given the highest priority followed by the GHI, as this will be the most natural approach to
take, keeping similar ratios for the other factors as established in the approach 1. In this way, we have found that the
“best suitable” unconstrained sites for the deployment of solar power plants can be in an area as large as 437.18 km2
(0.3% of the WKP), which is a bit less than twice the unconstrained area obtained within the approach 1. However, by
excluding the constrained regions we have found that the total exploitable area (108.58 km2 ) is actually of about 2.33
times greater than the one obtained with the approach 1, which is an excellent result as this now covers the eastern
and southern areas of the WKP that were not deemed as “best suitable” in the approach 1.
14Table 6: Full and exploitable areas for the deployment of solar power plants according to the obtained maps in Fig. 6. Results are given in km2
(top rows) and WKP-relative percentage (bottom rows). All numerical values under the referenced approaches are given in the mentioned units,
respectively.
Approach 1 [km2 ] Approach 2 [km2 ] Approach 3 [km2 ]
Suitability Full Exploitable Full Exploitable Full Exploitable
Class 146807 48523 146807 48523 146807 48523
1-3 92260.59 21537 74101.12 14568.91 107338.7 27780.22
3-5 48985.62 24323.86 51877.56 22339.82 29815.7 15787.68
5-7 5330.2 2615.42 20391.15 11506.28 9278.1 4874.5
7-9 230.59 46.60 437.18 108.58 374.5 80.79
Approach 1 [%] Approach 2 [%] Approach 3 [%]
Full Exploitable Full Exploitable Full Exploitable
100 33.05 100 33.05 100 33.05
1-3 62.84 14.67 50.47 9.92 73.11 18.92
3-5 33.37 16.57 35.34 15.22 20.31 10.75
5-7 3.63 1.78 13.89 7.84 6.32 3.32
7-9 0.16 0.03 0.30 0.07 0.26 0.06
Nevertheless, a couple of issues arise with the interpretation of the GIS map derived by the approach 2, as although
the settlement locations in Fig. 5I could be easily identified to be at the center of the denser “best suitable” areas (large
red dots), with these and the classified “suitable” areas within approximately 20 km from the main road network,
there are also “moderately suitable” regions which are much more than 20 km far away of the settlements, the current
roads and, the power grid infrastructures, a fact which will considerably rise the cost of development of a solar power
plant. Thus, despite these areas could be considered as good locations for new settlements and further expansion of
the WKP communities, if a better classification of suitable and best suitable sites for the deployment of solar farms is
to be given to policy makers, investors, and other stakeholders, an additional approach where greater weight is to be
given to the proximity to existing settlements needs to be pursued.
Consequently, in the approach 3 we have increased the relative weighting of the S p factor, at the expense of
reducing the importance of the GHI due to the established isomorphism of this condition. This resulted in a most
refined suitability map, where not only the “best suitable” exploitable area which in average covers the grade classes
7 − 9 in Table 3, and the corresponding “suitable” ones for the classes 5-7, both approximately double the solar
exploitation areas obtained within the approach 1, thereby including the largely dependent communities on diesel-
powered electricity such as Sintang, Sanggau, Nanga Pinoh, Sukadana, and Ketapang, but also present a clearer and
most systematic distinction on what accordingly with Tables 3 & 6 can be considered as the regions of WKP which
are moderately or least suitable for the deployment of solar power plants.
The total annual electric power generation capacity at the WKP has been also calculated before and after ex-
cluding the constraint conditions for each one of the three approaches above considered (see Table 7). This shows
the large effect that the consideration of protected and conservation areas imply on measuring the energy potential
at the diverse regions of Borneo Island, and how the classification of priority criteria can render to largely different
predictions. Still, we have demonstrated the enormous potential of Borneo island in what concerns to solar energy
production, as a proper planning of solar power plants just at the WKP could be sufficient to meet the 2030 clean en-
ergy plans of Indonesia [8, 52]. Moreover, regardless on the plans of the Indonesian government, either by expanding
the current power transmission network to supply and connect the cities or settlements largely dependent on fossil
energy production, or to upgrade the existing power transmission network for achieving a better and more compet-
itive interconnection with the Malaysian power grid at the North-west of the WKP, we have found that a common
factor within the three adopted approaches is that the optimal site for the deployment of solar power plats resulted in
locations proximate with the city of Mempawah, therefore, also close to the cities of Pontianak and Singkawang, with
an average exploitable area of 3019 hectares and annual solar energy production capacity of 6.63 T Wh. Likewise,
15Table 7: Projected annual PV energy generation potential at the full and exploitable areas of WKP accordingly with Eq. 2 and the results obtained
in Table 6 for the three approaches adopted in this study (see Fig. 6). All numerical values under the referenced approaches are given in T Wh/year.
Approach 1 [T Wh/year] Approach 2 [T Wh/year] Approach 3 [T Wh/year]
Suitability Full Exploitable Full Exploitable Full Exploitable
Class 27530.18 9261.67 27534.56 9247.31 27541.30 9253.48
[1-3] 17106.25 4090.97 13648.14 2758.76 20022.66 5287.95
[3-5] 9365.94 4663.51 9909.41 4271.06 5671.83 3015.33
[5-7] 1014.01 498.28 3892.90 2196.54 1774.81 934.59
[7-9] 43.98 8.91 84.11 20.96 72.00 15.62
the nearby of the city of Putussibau at the eastern side of WKP is also highlighted, as the approaches 2 and 3 have
allowed us to identify about 1689 Ha (average) as the best suitable locations for solar power plants, which could
be better positioned than the ”best suitable” areas closer to the cities of Sintang, Sanggau, Sekadau, Nanga Pinoh,
Sukadana, and Ketapang, given its good road connection and proximity with the major AH150 road at Malaysia.
Finally, for concluding the MDCA process, it is important to conduit a sensitivity analysis of the GIS-AHP out-
comes, such that a policy or decision maker can give suitable references onto the influence of each input criteria and
associated priority factors in the attained suitability maps. Generally, AHP results are highly sensitive to the weighting
criteria and prioritization factors which depend directly on the specific objectives of the research involved or the aims
of particular stakeholders [24, 29], which therefore implies that there is not a unique method for defining a sensitivity
analysis which could not be seen, somehow, biased towards one or another factor. However, a systematic sensitivity
analysis can be performed by excluding individual input criteria in the AHP analysis, such that the influence of this
particular criteria can be quantified from the GIS-AHP suitability maps obtained, as long as the chief criteria is main-
tained across the entire study, i.e., the GHI data layer in our case. Thus, as by excluding a specific input criteria into
the AHP algorithm, the sensitivity analysis demands to keep the relative weightings of the other criteria unchanged,
then, due to possible changes in the pairwise comparison system, a small fluctuation ∆S in the AHP weightings
appears [15, 29], which can be accounted by
S i, j − S j
∆S i, j = × 100% , (3)
Sj
where ∆S ij is the percentage change in the j-th site suitability class due to the exclusion of the assessed i-th input
criteria in Table 3, with i , j, and S i, j and S j the corresponding suitability class areas (see Fig. 6) with and without
the exclusion of the i-th input criteria.
Thus, as all criteria with exemption of the GHI can be omitted, the remaining 8 AHP factors are individually
assessed, with the resulting sensitivity values being shown in Table 8. The results indicate both positive and negative
changes in the percentage areas for the specific suitability classes, i.e., increments or decrements of the calculated
areas due to the exclusion of individual input criteria, respectively. In particular, it is to be noticed that starting
from the approach 1, and by excluding the proximity to the power grid factor, G p , the area originally classified
as “best suitable” increases in only a 14.66%. This is due to the now larger influence of the other two proximity
factors, road infrastructure and settlements’ location, which as a matter of fact have a much lower impact in the GIS
area calculations. Consequently, a large increment in the other classification areas, i.e., those called as “moderately
suitable” and “suitable” would be seen as a result of the larger areas covered by the topography and climatology
factors, which in average tend to benefit the western side of the WKP (See Table 5 & Figure 5). This explains then,
why by excluding the proximity to the road factor, R p , both extremes of the GIS-AHP map classification, i.e., the
least and best suitable areas, both result reduced in about 50% the originally calculated areas (see Table 6), as the
moderately suitable area will be now predominately defined by the G p and S p factors. This makes the areas closer
to the settlements and the current power transmission network to be more favorable for the deployment of solar
farms, but at the expense of possible considerations in the expansion of the power network to the large number of
settlements currently dependent of power-diesel generators, as previously discussed. Moreover, if the S p factor is
16You can also read