How the Premature Retirement of Coal-Fired Power Plants Affects Energy Reliability, Affordability
←
→
Page content transcription
If your browser does not render page correctly, please read the page content below
No. 145 – November 6, 2017

     How the Premature Retirement of Coal-Fired Power
       Plants Affects Energy Reliability, Affordability
                                  Isaac Orr and Fred Palmer*
                                        First in a series

Introduction
More than 250 coal-fired power plants in       The premature retirement of coal-fired
the United States have been retired since
2010, taking more than 34,000 megawatts        power plants poses a threat to the
(34 gigawatts) of power generation             reliability and affordability of the
                  1
capacity offline. These retirements were       country’s electricity supply.
the result of increasing competition from
natural gas power plants and the
imposition of federal regulations, including rules limiting carbon dioxide (CO2) emissions, that
made operating coal-fired power plants more expensive than it otherwise would have been.2
These regulatory changes are key to understanding why coal’s share of the electricity generation
market fell from 50 percent in 2008 to 31 percent in 2017.3

Some 88 percent of the coal plants retired between 2010 and 2015 were older, smaller units with
a generation capacity of less than 250 megawatts; the largest coal plants have nearly ten times
that capacity.4 However, many coal plants recently slated for retirement are newer, more efficient
facilities with larger generating capacities. The premature retirement of these coal-fired units
poses a threat to the reliability and affordability of the country’s electricity supply.

* Isaac Orr is a research fellow and Fred Palmer is a senior fellow with The Heartland Institute. For more
complete bios, see page 29. Many people reviewed early drafts of this manuscript; see page 29.

1
    Trevor House, et al., Can Coal Make a Comeback?” Center on Global Energy Policy, April 2017.
2
 Benjamin Storrow, “Coal: Big, Younger Plants are Closing. Is it a New Trend?” E&E News (website),
April 27, 2017.
3
    U.S. Energy Information Administration, “Short Term Energy Outlook” (website), September 12, 2017.
4
    Benjamin Storrow, supra note 2.

                                                   ‐1‐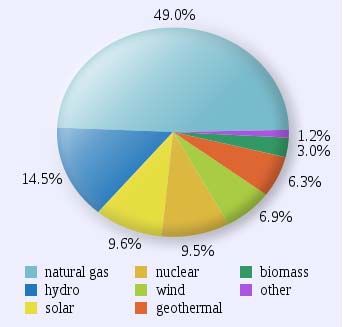
Australia presents us with a cautionary tale. It has experienced severe reliability problems,
rolling blackouts, and rising electricity prices because of government policies that forced coal-
fired generation units into early retirement in favor of renewable energy. Australia’s overreliance
on renewables, especially intermittent wind power, has had significant negative impacts on the
lives of Australians. The harm is exacerbated by Australian exports of liquefied natural gas,
which fetch higher prices in Asian markets, leaving the domestic market undersupplied.5

    Australia has experienced severe                    The United States will likely face similar
                                                        economic harm in the future as state and
    reliability problems, rolling blackouts,            federal policies force the premature
    and rising electricity prices because of            retirement of coal-fired plants and
    government policies that forced coal-fired          mandate the use of renewable resources.
    generation units into early retirement.             Especially as the liquefied natural gas
                                                        export industry in the United States grows
in response to foreign demand, government policies that cripple the coal industry will damage
the country’s electricity generating capacity and drive up electricity costs.

Public utilities should hedge their bets against possible price volatility in the natural gas sector.
Prudence dictates that utilities diversify their portfolios of energy-generation sources. Natural gas
and coal complement one another, ensuring families and industry benefit from the lowest energy
prices possible. Policymakers should remove special incentives that promote overreliance on any
single energy-generation source, including natural gas and renewable energy. Subsidies for
renewables threaten to make energy both unreliable and high-priced.

Part 1 of this Policy Study is an in-depth analysis of Australia’s experience with policies that
forced coal-fired power plants into premature retirement and made large parts of the country
dependent on unreliable and high-priced renewable energy, particularly wind power.

Part 2 examines the parallels between the United States and Australia and provides insights into
the problems now faced by states that have already eliminated coal-fired electricity from their
generation portfolios and aggressively promoted renewable energy.

Part 3 examines the concept of “prudence” and diversified energy portfolios for public utilities,
along with their policy implications.

Part 4 provides a critique of a U.S. Department of Energy study that correctly identifies natural
gas-fired power generators as a reason for coal plant retirements but fails to describe accurately
the role played by renewable energy subsidies in those retirement decisions. Subsidies intended
to promote renewable energy sources have undermined the wholesale electricity market and,
therefore, threaten the long-term reliability and affordability of the electricity supply.6

Part 5 offers concluding insights.

5
 Rachel Pannett, “How Energy Rich Australia Exported its Way Into an Energy Crisis,” The Wall Street
Journal, July 10, 2017.
6
 U.S Department of Energy, Staff Report to the Secretary on Electricity Markets and Reliability, August
2017.

                                                  ‐2‐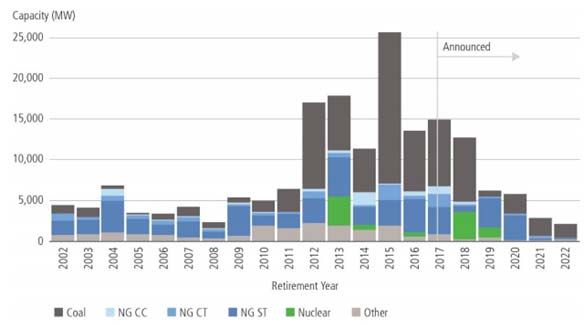
Part 1
                           Australia: A Cautionary Tale
Australia has the fourth-largest coal reserves in the world and is the fifth largest producer of coal.
However, 90 percent of the coal mined in Australia is exported, making it the world’s second-
largest coal exporter, behind Indonesia.7 Despite having centuries of coal reserves, Australia has
enacted climate and energy policies that have greatly reduced the use of coal in electricity
generation and has aggressively promoted wind energy.8

Coal-fired power generation constituted         Despite having centuries of coal reserves,
more than 80 percent of Australia’s
electricity generation in 2000 (see Figure      Australia has enacted climate and energy
1). Since then, coal’s share of the             policies that have greatly reduced the use
electricity market has fallen by nearly 20      of coal in electricity generation and has
percent points, largely due to government       aggressively promoted wind energy.
regulations that made them more
expensive to operate. (Coal’s share of
total electricity generation inched up by 3 percent points in the 2014-2015 period, the first time
since 2010. This growth was attributed in part to the removal of an onerous carbon tax.)9

Most of the energy market share lost by coal generation since 2000 has been picked up by
natural gas power plants, which provided about 21 percent of total electricity generation in the
country in 2014. Renewable energy provided approximately 14 percent of electricity generation
in 2014. Hydroelectric constitutes the single-largest segment of renewable electricity, providing
39 percent of all renewable electricity, and wind constitutes 33 percent of renewable electricity
generation.10

Both the national and state governments in Australia set energy policy. Recent anti-coal, pro-
renewables policies, especially at the state level, combined with liquefied natural gas exports,
have had severe adverse consequences.

7
 Mining Technology, “Countries with the Biggest Coal Reserves,” Miningtechnology.com, November 21,
2013.
8
 Ben Harvey and Tom Shepherd, “Rolling Blackouts Ordered as Adelaide Swelters in Heatwave,”
news.com.au, February 9, 2017.
9
 Department of Industry, Innovation and Science, Australian Energy Update, Australian Government,
October 2016.
10
     Ibid.

                                                 ‐3‐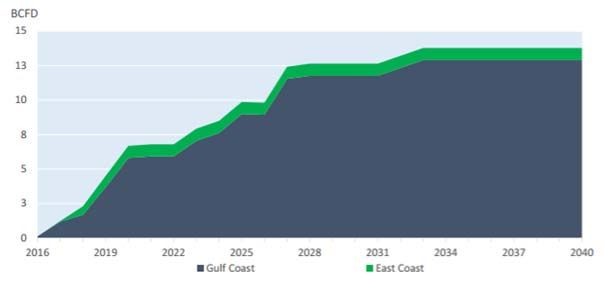
Figure
                                            F      1
                           Australian Electricity Generration Fuell Mix

Coal use in Australia has fallen approximately 20  0 percent sincce the year 20
                                                                              000. Coal stilll constitutes the
largest sh
         hare of the eleectricity generration market, but growing reliance on n
                                                                              natural gas annd renewable  es has
caused reeliability issues. Source: Deepartment of Industry, Innoovation and SScience, Austr
                                                                                           tralian Energyy
Update, Australian
         A            Govvernment, Oc ctober 2016.

A. Rollling Blackouts and Repeatted Outag
                                        ges
In 2016, South Austrralia’s electriicity-generatting facilitiees relied on rrenewables ssources for
        nt of their po
53 percen            ower output.. South Austtralia also im mported into its grid coall-generated
power fro
        om Victoria,, a neighboriing state.

On Septeember 28, 20  016, South Australia
                                  A         wass plunged intto darkness after high-vooltage power
lines deliivering that coal-generat
                       c           ted power fro
                                               om Victoria were severeed by a seriees of tornadooes,
leaving 1.7
         1 million people, appro   oximately 7 percent
                                               p       of A
                                                          Australia’s poopulation, wwithout poweer.11
Power was not fully restored
                       r        for 12 days. Weere such a sttorm to leavee 7 percent oof the U.S.
populatioon without power, 23 miillion peoplee would be afffected, morre than the poopulations oof
                                  d Texas.12
every staate except Caalifornia and

The Septtember 28, 2016 blackouut and blackoouts in the m
                                                        months that ffollowed werre not isolateed
events caaused merely
                    y by inclemeent weather. For examplee, an overrelliance on rennewable enerrgy
11
  Charis Chang,
         C      “Why
                   y South Austra
                                alia’s Blackou
                                             uts are a Prob
                                                          blem for Us A
                                                                      All,” news.com
                                                                                   m.au, Februaryy 10,
2017.
12
  Annual Estimates off the Residentt Population for
                                                fo the United d States, Regiions, States, a
                                                                                          and Puerto R
                                                                                                     Rico:
April 1, 20
          010 to July 1, 2016 (Excel spreadsheet)), United State
                                                               es Census Bu  ureau, accesssed October 25,
2017.

                                                     ‐4‐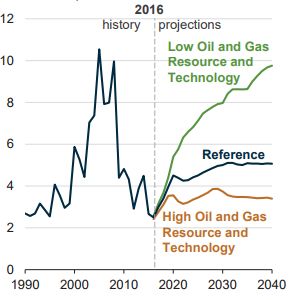
sources, primarily wind, combined with the retirement of the last coal-fired power plant in South
Australia in May 2016, resulted in another blackout in February 2017 as 90,000 households lost
electricity due to “load shedding” at the end of a 107.7 degree F day.13,14 Load shedding is a
utility-imposed blackout where electricity is shut off due to high demand and inadequate supply.
If too many customers are trying to access electricity when not enough is being provided to the
grid by power companies, the entire system could shut down. To prevent a system-wide
blackout, utility companies themselves stop providing electricity to many customers.

Several more blackouts due to load shedding have occurred in South Australia. An investigation
by the Australian Energy Market Operator (AEMO), the nation’s electric regulator, concluded
South Australia’s reliance on renewables, a failure of backup systems to kick in, and the closure
of wind farms for safety reasons all played a significant part in producing the outage.15

AEMO estimates the likelihood of
blackouts due to an energy shortfall in       Blackouts in Australia are projected to
Southern Australia for the summer of          continue as electricity markets struggle to
2017–2018 is between 26 percent and 33        provide a reliable supply as coal-fired
percent. In neighboring Victoria, the         power plants are shut down and the grid
likelihood of blackouts is estimated
between 39 percent and 43 percent.            becomes more reliant on intermittent
AEMO says those estimates would be            resources and on natural gas.
lower if nine dual diesel- and gas-fired
generators in Victoria, along with battery storage technology—at a cost of $95 million for a 129
megawatt hour facility—are incorporated into the grid in South Australia.16,17

AEMO also concludes the proposed closure in 2022 of the Lidell coal-fired power station—a
2,000 megawatt (MW) facility—will materially increase the risk of blackouts in the Australian
state of New South Wales.18 Blackouts in Australia are projected to continue as electricity
markets struggle to provide a reliable supply as coal-fired power plants are shut down and the
grid becomes more reliant on intermittent resources and on natural gas.19

13
  Giles Parkinson, “Last Coal-Fired Power Generator in South Australia Switched Off,” Renew Economy
(website), May 9, 2016.
14
     Ben Harvey and Tom Shepherd, supra note 8.
15
 Nick Harmsen, “AEMO Releases Final Report into SA Blackout, Blames Wind Farm Settings For State-
Wide Power Failure,” Australian Broadcasting Company, March 28, 2017.
16
  Nick Harmsen, “Energy Market Operator Issues Mixed Blackout Forecast for SA, Victoria During
Summer,” Australian Broadcasting Company, September 5, 2017.
17
  Sonali Paul, “Tesla’s Big Battery Races to Keep South Australia’s Lights On,” Reuters, September 28,
2017.
18
     Nick Harmsen, supra note 15.
19
  Stephen Dziedzic, “Electricity Markets Struggling as Coal-Fired Power Stations Shut Down, Regulator
Says,” Australian Broadcasting Company, September 5, 2017.

                                                  ‐5‐
B. South Australia’s Renewable Energy Mandates to Blame
The blackout problem in South Australia is clearly the result of policies implemented by that
state’s government. It mandated a goal of generating 50 percent of its electricity from renewables
by 2025. Yet South Australia is dependent upon electricity imports from Victoria, which
provides backup power generated from brown coal in quantities equivalent to 25 percent of
South Australia’s peak demand.20
The intermittent nature of wind and solar The intermittent nature of wind and solar
power have resulted in a situation where
power have resulted in a situation where utility companies in South Australia must
utility companies in South Australia must procure electricity from non-renewable
procure electricity from non-renewable sources on the spot market, which is often
sources on the spot market, which is often an expensive practice. Electricity prices in
an expensive practice. the spot market are sometimes very high
when wind generation is low, driving up
prices for consumers. For example,
average spot power prices across Australia were between 98 percent and 360 percent higher in
February 2017 than in February 2016.21
This problem is exacerbated in South Australia because wind and solar are given priority on the
grid. The electricity generated by renewable facilities is purchased first by South Australian
utilities, while coal and natural gas plants act as backup generators for the renewables. This
system makes coal and natural gas uneconomic, for several reasons.
To begin with, coal and natural gas power plants receive payment only when they sell electricity
to the grid, whereas wind and solar receive government subsidies in addition to revenue from the
electricity they sell to the public utility.
When wind is abundant, that power is incorporated into the grid, meaning coal and natural gas
plants sell less electricity and collect less revenue. However, coal and natural gas plants have
large fixed costs—staff salaries, capital financing—that do not decrease based on how much
electricity they sell. Further, when subsidized wind is abundant, wholesale power prices are
depressed, meaning even less revenue for coal and natural gas plants. Those facilities in South
Australia cannot operate profitably, which explains why the last coal-fired power plant in that
state closed in May 2016, worsening power shortages when no wind-generated electricity is
available, making more blackouts likely.
In reaction to blackouts and skyrocketing electricity prices, the Liberal Party in three Australian
states—Queensland, South Australia, and Victoria—have called for the abolition of state-based
renewable energy targets.22
20
World Nuclear Association, “Australia’s Electricity,” September 2016.
21
Angela Macdonald-Smith, “Manufacturers Slugged by Power Price Hikes,” Financial Review, March 6,
2017.
22
Katharine Murphy, “Energy Policy: No Room for Partisan Politics, 18 Groups Tell Government,” The
Guardian, February 12, 2017.
‐6‐C. Risiing Costs
s
Basic eco onomics tell us that as ellectricity beccomes scarceer, the limiteed remainingg supplies
become more
m expenssive. Australlia once had some of the least-expennsive electriccity in the woorld.
But residdential powerr prices nearrly doubled in i Australia from 2008 tto 2014 becaause of pro-
renewablle, anti-fossiil-fuel govern nment policiies. (See Figgure 2.) As ccoal plants haave been forrced
into retireement, utilitties have had
d to spend more
m on addittional network infrastruccture, which was
needed to o connect staates to one another
a in ord
der maintainn the supply of electricityy as renewabbles
were incrreasingly inttroduced into o the energyy mix.23,24
Prices haave risen most dramaticaally in South Australia w where residenntial electriciity prices aree
now the most
m expenssive in the world
w (see Fig
gure 3). The costs of electricity in Soouth Australlia
are triplee those in thee United Stattes and Victo
oria’s are doouble Americcan prices.
Figure
F 2
Indexed Real
R Consumer Electricity Pric
ces: 1955–2
2018 (1990
0=100)
The Natioonal Electricity
y Markets (NEEM) were esta ablished to in
ntroduce comp petitive eleme
ents to electricity
markets inn Australia annd drive downn prices. Howe ever, electriciity prices in A
Australia havee increased
dramaticaally since 2005 5, when intermittent sourcees of electriciity (wind and solar) were b beginning to bbe
incorporatted into the national electricity supply. There
T is a stroong correlatioon between in ncreasing
s of wind and solar and higher prices. So
quantities ource: Dr. Micchael Crawfo ord, “An Open n Letter to Dr. Alan
Finkel REE Review of Future Security y of the Natio
onal Electricityy Market,” Jun ne 23, 2017.
23
Departm
ment of Indus
stry, Innovatio
on and Scienc
ce, supra note
e 9.
24
Charis Chang,
C supra
a note 11.
‐7‐Figure
F 3
Reta
ail Electriciity Prices of
o NEM Staates, Includ ding Taxes
s,
Compare ed to Seleccted Counttries (¢ perr kWh)
South Aus stralia now ha
as the most expensive
e in th
he world afterr utilities raise
ed their pricess in July 2017
7.
Electricity
y prices for Au
ustralian hous
seholds rose 161 to 20 perccent, dependin ng on the com mpany supplyying
the energy. Prices are in Australian dollars. Sourrce: Ben Potte er and Andrew w Tillett, “Ausstralian
Households Pay Highe est Power Pricces in the Woorld,” Financia
al Review, Au ugust 5, 2017.
To addreess rising electricity costss, Australia has
h implemeented a systeem of concesssions and
rebates fo
or low-incomme househollds. In a repo ort publishedd by The Unniversity of S
Sydney in 20013,
Dr. Lynnne Chester writes:
w
The
T dominant policy meaasure to assisst low-incom me householdds with enerrgy bills
arre rebates, co
oncessions and
a temporarry financial assistance pprovided by S State and
Territory
T govvernments, geenerally as an
a absolute aamount (lum mp sum) ratheer than a
prroportion off a household
d energy billl as is the casse only in V
Victoria. …
‐8‐At least 2.3 million low-income households are regularly receiving some form of
State government concession or rebate on their electricity bill. Yet all States
record a higher proportion of residential consumers being disconnected for non-
payment of bills in 2011–12 compared to 2007–08 which strongly signals the
increasing ineffectiveness of these measures.25
Soaring electricity prices also have caused energy-intensive businesses, such as manufacturing,
to reduce employment in Australia and refocus investment in the United States, where electricity
is half as expensive. 26
D. Australian Liquefied Natural Gas Exports
Australia’s electricity problems have been exacerbated by a lack of domestic natural gas supplies
for generating electricity. This situation might seem counter-intuitive because Australia has
significant natural gas resources and is the world’s second-largest exporter of liquefied natural
gas (LNG), behind only Qatar. Some 62 percent of gas production in Australia in 2016 was for
export, especially to Asian countries where that resource fetches a higher price than in the
Australian domestic market.27
Exports in such circumstances are not an Australia’s problem is not with exports.
economic problem. Australians earn more
revenue than they would if the LNG Rather, it is with government restrictions
supplies were sold domestically, and the on energy generation from low-cost coal.
higher prices overseas are incentives for
domestic producers of energy in Australia to increase their output. Australia’s problem is not
with exports. Rather, it is with government restrictions on energy generation from low-cost coal,
which have resulted in closures of coal-fired power plants, and aggressive promotion of high-
cost renewable energy.28
As 90,000 homes in the South Australian city of Adelaide suffered through the February 2017
blackout, five ships left the port city of Gladstone carrying out 314,000 tons of LNG, enough to
provide electricity for roughly 750,000 Australian homes for a year.29
Politicians, including Australian Prime Minister Malcolm Turnbull, predictably blamed natural
gas shortages and the blackout on previous decisions to issue too many gas export licenses,30
ignoring the fact that but for government decisions to persecute coal and promote renewables,
there likely would have been enough electricity generated to meet all Australians’ needs.
25
Dr. Lynne Chester, The Impacts and Consequences for Low-Income Australian Households of Rising
Energy Prices, The University of Sydney, October 2013, p. vii.
26
Angela Macdonald-Smith, supra note 21.
27
Rachel Pannett, supra note 5.
28
Ibid.
29
Ibid.
30
Ibid.
‐9‐Much of the LNG that is exported is extracted from coal seams. This gas is expensive to
produce, and natural gas producers developed these resources not for domestic use, but with the
intent of selling for higher prices in Asian markets. As gas production increased, coal-fueled
plants were shut down without comprehensive plans for replacing them with other power
sources.31
Increasing reliance on natural gas has Increasing reliance on natural gas has
caused Australian natural gas prices to
caused Australian natural gas prices to fluctuate wildly. On the spot market, gas
fluctuate wildly. prices have gone from below $1 per
million British thermal units (MMBtu) in
2014 to roughly $7 per MMBtu in 2017—well above the roughly $3 that prevails in the United
States. The domestic natural gas shortages have caused prices for some smaller manufacturers to
reach $17 per MMBtu.32
The shortage of natural gas resulted in the Australian government threatening to curb exports if
producers did not make more natural gas available to the domestic market. Australian energy
companies agreed to divert gas from exports to meet the needs of domestic markets.33 This move
will have serious negative consequences: Revenues from foreign customers will fall, harming
Australian natural gas producers and endangering Australian jobs, and Australian consumers will
face higher energy bills as they rely more on a resource much more costly than coal.
E. Conclusions from Down Under
Australia’s energy policies—persecuting reliable, low-cost, abundant coal in the name of
reducing CO2 emissions while promoting unreliable high-cost renewables—have proved
disastrous for Australians.
Once benefiting from some of the most affordable electricity in the world, Australians are now
left with an expensive energy system that in the future will require even more investments in
backup technology for renewable resources that will only add to the utility bills of Australian
households.
Thankfully, it appears Australia may be coming to its senses on energy policy. Former Australian
prime minister and opposition-party leader Tony Abbott has come up with a new slogan on
energy policy, calling for a “100 per cent reliable energy target.” Abbott said he welcomed signs
from Turnbull that the government is moving away from a clean energy target to a reliable
energy target. “Frankly nothing less than a 100 per cent reliable energy target will do because
we’ve got to keep the lights on all the time,” Abbott said in September 2017.34
31
Ibid.
32
Ibid.
33
Tom Westbrook and Sonali Paul, “Australia’s East-Cost LNG Exporters Avert Export Curbs,” Reuters,
September 26, 2017.
34
Katherine Murphy, “Tony Abbott Calls for End to All Energy Subsidies, Including Coal,” The Guardian,
September 14, 2017.
‐ 10 ‐Australian Senator Malcolm Roberts told ABC radio: “If we just went back to normal coal-fired
operations we would have the reliability, the security, the stabilisation, and the lower cost that we
used to have.”35 Australian Senator Ron Boswell noted, “You can’t refine aluminum with
windmill power.”36
The United States would be wise to heed this advice and learn from this cautionary tale.
Part 2
Parallels Between America and Australia
Like Australia, the United States is a coal-rich country; it has the world’s largest easily
accessible reserves, by one estimate enough to last for about 283 years.37 However, like
Australia, the share of electricity generated in the United States from coal has fallen
significantly, from approximately 50 percent in 2000 to approximately 32 percent in 2016 (see
Figure 4).
Key factors driving the retirements of coal-fired units in the United States are a series of
Environmental Protection Agency (EPA) regulations and low natural gas prices that have
resulted from hydraulic fracturing, making many coal-fired facilities unprofitable and
encouraging many public utilities to switch from coal to natural gas as a principal source for
electricity.38
A. EPA Regulations
President Barack Obama pledged during his 2008 campaign to “bankrupt” any effort to build a
coal-fired power plant.39 His administration promulgated new rules and tightened older ones in
an effort to strangle the coal industry. Those efforts included:
Clean Power Plan;
Cross-State Air Pollution Rule;
Mercury and Air Toxics Standards;
More stringent National Ambient Air Quality Standards (NAAQS) for particulate matter;
35
Rachel Baxendale and Simone Fox Koob, “Clean Energy Targets ‘Not a Tax on Coal,’” The Australian,
June 12, 2017.
36
Hon. Ron Boswell, “No Future for Manufacturing with Carbon Tax and Renewable Energy Costs,”
address to the Institute of Public Affairs, Melbourne, Australia, September 28, 2011, p. 8.
37
U.S. Energy Information Administration, “How Much Coal is Left?” Energy Explained, April 18, 2017.
38
Energy Ventures Analysis Inc., Outlook for Natural Gas Supply and Demand for 2016–2017 Winter,
Natural Gas Supply Association, October 2016.
39
Erica Martinson, “Uttered in 2008, Still Haunting Obama,” Politico, April 5, 2012.
‐ 11 ‐Figure 4
Annual Share of Total U.S. Electricity Generation by Source
(1950–2016)
Coal was the largest provider of electricity in the United States from 1950 until 2016, when it was
supplanted by natural gas as the chief fuel used to generate electricity. However, rising natural gas prices
have caused coal to regain its role as the largest fuel source used for electricity generation in 2017.
Source: U.S. Energy Information Administration, “Natural Gas Expected to Surpass Coal in Mix of Fuel
Used for U.S. Power Generation in 2016,” Today in Energy (website), March 16, 2016.
Cooling Water Intake Rule;
Coal Combustion Residuals Rule;
Carbon Pollution Standards for New Plants;
Effluent Limitations Guidelines;
NAAQS for Ozone, one of the most costly regulations in U.S. history;
Stream Protection Rule; and
A Department of the Interior ban on mountaintop mining.40
These regulations plus government subsidies to the wind and solar power industries are major
reasons more than 34,000 megawatts (MW) of coal-fired electricity generating capacity in the
United States have been retired prematurely in recent years. Energy Information Agency data
indicate another 18,400 MW are scheduled to retire by 2028, for a total retired capacity of
52,400 MW.41 This is enough electricity generating capacity to power approximately
40
Trevor House et al., supra note 1.
41
U.S. Energy Information Administration, “Planned U.S. Electric Generating Unit Retirements,” Electric
Power Monthly, September 26, 2017.
‐ 12 ‐42.5 million homes, which is equivalent to every household in California, Florida, New York,
Pennsylvania, and Texas combined.42 These regulations will be discussed in greater detail in the
second Policy Study in this series, while the impact of federal subsidies for wind and solar will
be further discussed in the third Policy Study in the series.43
B. The Consequences of Overregulation
The premature retirement of coal-fired power plants threatens to drive up electricity prices and
cripple the reliability of the electricity grid in the United States.
Existing coal-fired power plants generate reliable electricity at a cost of $39.9 per megawatt-hour
(MWh ) on average, while the cost of
electricity generated by existing natural
gas facilities is $34.4 per MWh. Existing
The premature retirement of coal-fired
nuclear power plants produce electricity power plants threatens to drive up
for $29.1 per MWh, and hydroelectric electricity prices and cripple the
resources, $35.4 per MWh. reliability of the electricity grid in the
United States.
New natural gas facilities would generate
electricity for $55.3 per MWh, much
higher than the $34.4 per MWh for existing facilities.44 This means that at a cost of $39.9 per
MWh, existing coal plants are able to generate electricity for approximately 39 percent less than
new natural gas plants. Further, new wind facilities generate electricity at a cost of $107.4 per
MWh, meaning coal produces electricity at one-third of the cost. (See Figure 5.)
Thus, prematurely closing coal-fired power plants will make the United States more like
Australia, with higher electricity prices.45
42
Statista, “Number of Households in the United States in 2016, By State (In Millions)” (website),
accessed October 16, 2017.
43
Isaac Orr and Fred Palmer, “How Obama-Era Regulations are Shutting Down Perfectly Good Power
Plants,” Heartland Policy Study No. 146, and “Public Policy and Coal-Fired Power Plants,” Heartland
Policy Study No. 147, The Heartland Institute, forthcoming November 2017.
44
Tom Stacy and George Taylor, The Levelized Cost of Electricity From Existing Generation Resources,
Institute for Energy Research, July 2016.
45
Ibid.
‐ 13 ‐Figure 5
Levelized Cost of Electricity
Electricity generation from existing natural gas, coal, nuclear, and hydro power is significantly less
expensive than new generating resources. In many cases, existing electricity resources can generate
electricity for one-third of the cost of new wind power and one quarter of the cost of new solar. Source:
Tom Stacy and George Taylor, The Levelized Cost of Electricity From Existing Generation Resources,
Institute for Energy Research, July 2016.
C. The California Model
While many states resisted Obama’s federal regulations to cut CO2 emissions by shuttering coal-
fired power plants, others fully embraced them. California has gone beyond federal regulations,
attempting to replace coal entirely in favor of natural gas and renewables.
California utilities are under a mandate to produce 50 percent of their electricity from “clean
energy”—by which state policymakers mean greenhouse-gas-free energy46—by 2030, and some
46
Lauren Sommer, “California Lawmakers Debate 100 Percent Clean Energy Mandate,” NPR (website),
September 14, 2017.
‐ 14 ‐lawmakers want the mandate raised to 100 percent by 2045.47 The state also places severe
restrictions on CO2 emissions and forces companies to buy permits to emit greenhouse gases into
the air.
From 2006 through July 2016, 34,600 MW of
Figure 6 capacity from imported and in-state coal-fired
Sources of Electricity Generation power plants were removed from California’s
in California (2016) resource portfolio.48
As shown in Figure 6, in 2016 the state
produced nearly half of its electricity,
49 percent of its electricity from natural gas.
California will shutter its last nuclear power
plant, the Diablo Canyon facility, in 2025, and
nuclear power’s share will fall from its current
9.5 percent as a result.
The 1.2 percent “other” category includes the
0.16 percent of generation derived from coal.49
Electricity from in-state coal-fired facilities has
been virtually eliminated. California still
imports coal-fired electricity from neighboring
states, much like South Australia imports
power from Victoria. In 2016, imported coal-
fired electricity accounted for 4.13 percent of
Electricity generated in California is primarily total electricity consumption in California, less
derived from natural gas due to its low cost, than the 6.9 percent share generated by in-state
availability, and ability to quickly start generating wind and 6.3 percent share generated by in-
electricity when intermittent sources such as wind state geothermal.50
and solar are not generating power. Data from
California Energy Commission. Source: Tom
Stacy and George Taylor, The Levelized Cost of The harm caused by California’s anti-coal, pro-
Electricity From Existing Generation Resources, wind, and pro-solar policies already is
Institute for Energy Research, July 2016. apparent. Electricity prices in the state have
risen dramatically since 2010 and far exceed
the national average.51 (See Figure 7.)52 This is
due in part to poor planning, causing the state
47
Makeda Easter and Ivan Penn, “Elon Musk Said Tesla Could Build Australia a Power Storage System
in 100 Days. Now We’ll See,” The Los Angeles Times, July 7, 2017.
48
California Energy Commission, Actual and Expected Energy From Coal in California, November 3,
2016.
49
Ibid.
50
Ibid.
51
Lawrence Hamlin, “California’s Globally Irrelevant, Costly, Elitist Driven And Purely Political Climate
Change Campaign,” WattsUpWithThat (blog), August 18, 2016.
52
U.S. Energy Information Administration, “Average Price of Electricity to Ultimate Customers by End-Use
Sector,” August 24, 2017.
‐ 15 ‐to build too
t many power plants— —500 power plants from 2001 to 20116—and in ppart to feed-iin
tariffs, su
ubsidies thatt guarantee reenewable en
nergy resourcces are comppensated at aabove-markeet
rates. The higher costs associated d with these feed-in tarifffs are passedd along to coonsumers.53
Figure
F 7
California
C Electricity Cost Prem
miums Sinc
ce 2010
Source: U.S.
U Energy In nformation Addministration data,
d graphic created by C
California Man
nufacturers &
Technologgy Associatio
on, June 1, 20
017.
Californiia is projecteed to have 21
1 percent moore electricitty generatingg capacity thhan it needs tto
satisfy prrojected consumer demaands by the year
y 2020. C Continued invvestment in rrenewable
generatioon continues to oversupp ply the Califo
fornia marketts with electtricity pricedd much higheer
than the rest
r of the co ountry.54
As Figurre 7 shows, inndustry espeecially sufferrs from California’s poliicies, with ellectricity rattes
rocketingg from 48 peercent above the nationall average in 2010 to 79 ppercent abovve in 2015. T These
high pricces will only exacerbate business
b ght from the state.55
flig
53
U.S. En
nergy Informa ation Administtration, “Feed-In Tarff: A P olicy Tool En couraging De
eployment of
Renewable Electricity Technology,”
T Today in Ene ergy (websitee), May 30, 20013.
54
Ivan Pe
enn and Ryan
n Menezes, “C Californians Are
A Paying Bil lions For Pow
wer They Don
n’t Need,” The
e Los
Angeles Times,
T Februa
ary 5, 2017.
55
Hans Bader, “Nestlé, Other Businesses Flee California,”
C Co
ompetitive Entterprise Institute, Februaryy 2,
2017.
‐ 16 ‐California has thus far not experienced blackouts, but those could be in the future as well.
Electricity prices will continue to increase as the state becomes more reliant on intermittent
renewable resources, which will leave the state oversupplied on windy or sunny days and
undersupplied when the sun is not shining or the wind is not blowing.
California, like South Australia, provides policymakers with an example of “what not to do,”
adopting policies that encourage the premature retirement of existing coal-fired power plants in
favor of more expensive, less reliable renewable energy sources.
D. U.S. Liquefied Natural Gas Exports
Hydraulic fracturing has made the United States the largest producer of natural gas in the world.
The country is expected to become a net natural gas exporter in late 2017, primarily due to
surging volumes of natural gas exports via pipeline shipments to Mexico and liquefied natural
gas (LNG) exports to countries around the world, particularly to nations in Asia, Europe, Latin
America, and the Middle East.56
Growing exports have the potential to put If increasing LNG exports are not
upward pressure on domestic natural gas
prices. The United States is expected to matched by corresponding increases in
have enough LNG capacity to export 8.6 natural gas production, the increase in
billion cubic feet per day (Bcf/d) by 2020, exports could put upward pressure on
roughly 10 percent to 15 percent of electricity prices in the future.
current natural gas production. This export
capacity is expected to grow to 15.5 Bcf/d
by 2030, roughly 17 percent to 18.5 percent of estimated production. At those volumes, the
United States would become the world’s largest LNG exporter (see Figure 8).57
If increasing LNG exports are not matched by corresponding increases in natural gas production,
the increase in exports could put upward pressure on electricity prices in the future.58
56
U.S. Energy Information Administration, “United States Expected to Become a Net Exporter of Natural
Gas this Year,” Today in Energy (website), August 9, 2017.
57
Energy Ventures Analysis Inc., supra note 38.
58
Ibid.
‐ 17 ‐Figure 8
Projected Growth in U.S. LNG Exports
2016–2040
U.S. LNG exports are estimate to reach between 13 Bcf/d by 2020 and 15.5 Bcf/d by 2030. These
volumes will represent approximately 11 and 17 percent of estimated natural gas production, respectively.
Source: Energy Ventures Analysis Inc., Outlook for Natural Gas Supply and Demand for 2016–2017
Winter, Natural Gas Supply Association, October 2016.
In its 2017 Annual Energy Outlook, the Energy Information Administration calculates a
“reference case” gas price increase of about $5 per million British thermal units (MMBtu) by
2020. It also projects a price increase range of between $4 per MMBtu to nearly $10 MMBtu by
2030 (in constant 2016 dollars), depending on what happens with oil and natural gas resources
and technology. (See Figure 9.)
‐ 18 ‐Even as the world’s largest LNG
exporter, the United States will
experience less dramatic effects Figure 9
on its domestic market than what Natural Gas Spot Price at Henry Hub
Australia experienced. This is 2016 dollars per million British thermal units
primarily because the United
States has a large natural gas
pipeline infrastructure that allows
it move its gas more effectively
than Australia could.59 LNG
exports will likely cause U.S.
consumers to experience higher
natural gas prices, but not actual
supply shortages.
However, significant natural gas
price increases due to LNG
exports could encourage utilities
to switch from natural gas to coal.
Some such shifting occurred in
March 2017, when the price for
natural gas reached $3.36 per The EIA forecast a range of possible natural gas
MMBtu compared with a price of prices ranging from slightly under $4 per MMBtu to
$2.08 per MMBtu for coal.60 The slightly under $10 per MMBtu in 2030. Source:
Energy Information Administration U.S. Energy Information Administration, Annual
Energy Outlook 2017, January 5, 2017.
forecasts that through 2050,
natural gas costs to the utility sector
(in real 2016 dollars) will rise at an
annual average rate of 2.1 percent while coal costs will increase annually by only 0.3 percent. In
2017, natural gas prices averaged around $3.00 per MMBtu compared to costs ranging from
$0.66 to $2.22 per MMBtu for coal; natural gas is, on average, 60 percent more expensive than
coal, and by 2050, it is projected to be 260 percent as expensive as coal.61,62,63
Permitting power generators to switch at their discretion to whichever fuel can generate
electricity most cost effectively would benefit consumers and businesses alike. But such
effective, efficient fuel switching will be possible only if regulators and public utility
commissioners exercise prudence to ensure the United States continues to use all of its
energy resources to benefit from electricity prices that among the lowest in the world.
59
Rachel Pannett, supra note 5.
60
John Kemp, “Column: U.S. Natural Gas Prices Tumble as Power Producers Switch Back to Coal,”
Reuters, June 5, 2017.
61
U.S. Energy Information Administration, “Natural Gas” (website), October 18, 2017.
62
U.S. Energy Information Administration, “Coal Markets” (website), October 23, 2017.
63
Management Information Services Incorporated, Analyzing and Estimating the Economic and Job
Benefits of U.S. Coal, prepared for the U.S. Department of Energy, September 2017.
‐ 19 ‐Part Three
Prudence in Utility Regulation
In the public utility sector, with all the volatility and policy uncertainties, a concept referred to as
“prudence” has emerged as a principle central to the theory and practice of utility regulation.64 At
its core, prudence means utilities should maintain a diversified portfolio of energy resources, just
as prudent individuals maintain diversified investments in their retirement portfolios. Don’t put
all your eggs in one basket!
Prudence means utilities should maintain Regulators at the state and local level are
charged with ensuring the efficient and
a diversified portfolio of energy economic management of electric utilities.
resources, just as prudent individuals Prudence guides them in achieving those
maintain diversified investments in their goals.65 Prudence means balancing risks
retirement portfolios. and costs. It directs public utilities in their
resource planning and energy generation
choices to ensure they can deliver reliable
66
and low-cost electricity to consumers. Prudence requires maintaining the diversity of
dependable electricity generation sources such as coal and nuclear power. The anti-coal policies
of California and South Australia are textbook examples of what happens when prudence is
ignored.
It is important not to confuse “prudence” with the so-called “precautionary principle.” The latter
is the notion that if products or technologies pose any imaginable risks—often highly speculative
or vague ones unsupported by any sound science—then such products or technologies should be
severely restricted, regulated, or banned. “Precaution” is “never try anything for the first time.”
The burden is placed on innovators to prove no harm to humans will result from their
innovations.
“Prudence” is progressive and responsible. “Precaution” is regressive and highly irresponsible in
not accounting for the damage done by restraint, for example, by eliminating coal from the
energy mix.
A. Dealing with Volatility
The widespread use of coal-fired power plants was the result of prudent planning in the 1970s.
During that decade, the United States was using an increasing amount of oil, including oil
64
Janice A. Beecher, “The Prudent Regulator: Politics, Independence, Ethics, and The Public Interest,”
Energy Law Journal, November 2, 2008; Frank C. Graves, James A. Read, and Joseph B. Wharton,
Resource Planning and Procurement In Evolving Electricity Markets, Edison Electric Institute, January 31,
2004.
65
Karl McDermott, Cost of Service Regulation in the Investor-Owned Electric Utility Industry, Edison
Electric Institute, June 2012.
66
Scott Hempling, “Prudence: Who’s Minding the Store?” Effective Regulation of Public Utilities, January
2011.
‐ 20 ‐imported from foreign countries, to generate electricity to meet rapidly growing demand. The
share of electricity generated from oil peaked in the late 1970s at more than 20 percent of the
share of electricity generated using fossil fuels. 67 (See Figure 10.) The Arab oil embargos and
international political volatility during that decade led to shortages at gas pumps and price spikes
and swings for all uses of oil, including for electricity generation.
Figure 10
Annual Share of Fossil-Fuel-Fired Electric Power Generation
1950–2012
Figure 10 shows the percentage of fossil fuels used to generate electricity since 1950, but does not show
all sources such as nuclear. The use of coal, oil, and natural gas for electricity generation has fluctuated
over time in response to price signals and pollution concerns. Oil constituted a significant portion of the
electricity generation market until the Arab Oil Embargo incentivized the construction of more coal-fired
power plants. Source: U.S. Energy Information Administration, “Competition Among Fuels for Power
Generation Driven by Changes in Fuel Prices,” Today in Energy, July 13, 2012.
The turmoil and economic damage caused by a growing dependence on foreign oil led U.S.
policymakers to conclude the domestic electricity supply should not be subject to the whims of
foreign oil ministers. In response, they implemented policies that made possible increased
utilization of the country’s abundant coal resources.
67
U.S. Energy Information Administration, “Competition Among Fuels for Power Generation Driven by
Changes in Fuel Prices,” Today in Energy (website), July 13, 2012.
‐ 21 ‐As Figure 10 shows, the share of electricity generated by coal peaked at 56 percent in the late
1980s. With coal playing the major role in the U.S. power generation mix, industry and
consumers had access to low-cost electricity not subject to international political threats.
B. The Role of Natural Gas
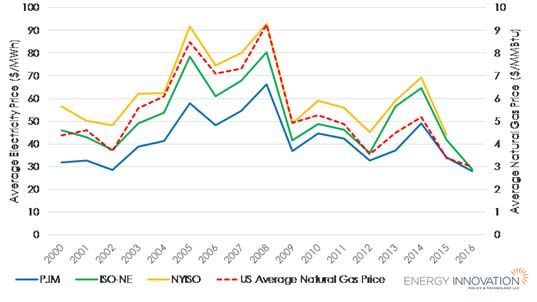
The U.S. electricity market has changed over the past two decades. Natural gas prices have been
a primary driver of the country’s average annual electricity prices since 2000. Figure 11 shows
various electricity price indices, all demonstrating electricity prices closely mirror natural gas
prices. Notice the Independent Systems Operator (ISO-NE) index, which represents wholesale
electricity markets in New England states, and NYISO, which represents wholesale electricity
markets in New York, have higher electricity prices than PJM, a 13-state wholesale electricity
market.68 This is because New York and New England have virtually eliminated coal from their
generation mixes, whereas PJM has a diverse fuel supply.
Figure 11
Natural Gas Prices Are Primary Driver of Average Annual Electricity Price
Electricity prices are heavily influenced by the price of natural gas. However, states with a higher
dependency on natural gas have experienced higher electricity prices than those with a generation
portfolio that also contains coal. The yellow line indicates electricity prices in NYISO, the red, dotted line
indicates natural gas prices, the green line shows electricity prices in New England, and the blue line
shows electricity prices in PJM. Source: Robbie Orvis, “The State of the US Wholesale Power Markets: Is
Reliability at Risk From Low Prices?” Utility Dive (website), May 22, 2017.
68
Robbie Orvis, “The State of the US Wholesale Power Markets: Is Reliability at Risk From Low Prices?”
Utility Dive (website), May 22, 2017.
‐ 22 ‐Natural gas-dependent states have seen electricity prices fall as natural gas supplies have become
less expensive and more plentiful as a result of hydraulic fracturing. That is likely to change as
demand catches up with supply. Allan S. Armstrong, CEO of Williams, a major natural gas
pipeline company, forecasts U.S. natural gas demand will grow by 20 bcf/day between 2016 and
2021, an increase of approximately 26.5 percent.69
With that increase in demand, natural gas prices may not stay below $3 per thousand cubic feet
(mcf) in the coming years. In addition, as demand increases supplies may taper off: On average,
natural gas production from new wells falls by as much as 70 percent within 18 months. That
means more wells will need to be drilled to maintain output, requiring more capital and putting
upward pressure on future prices.
Armstrong predicts the break-even cost With rising prices for natural gas, prudent
for extracting gas from shale will
approach $4 per mcf. Full costs, including public utilities will look to less costly
capital and return on investment, will sources of electricity for their energy mix.
approach $5 per mcf. At current pricing Inexpensive coal would be a first choice
levels of $3 per mcf, new natural gas if governments allow utilities to choose
electric generating units look attractive. At coal.
$5 per mcf , they are not, and electric
prices can be expected to rise. With rising
prices for natural gas, prudent public utilities will look to less costly sources of electricity for
their energy mix. Inexpensive coal would be a first choice if governments allow utilities to
choose coal.
Prudent utilities and policymakers will also consider the effects of LNG exports on domestic
natural gas markets. Armstrong projects natural gas exports will increase to 2.3 tcf/year from
2016 to 2021, an amount representing approximately 8.3 percent of current gas domestic
consumption.70
Such exports are a manifestation of the health of the U.S. natural gas sector, which employs
American workers and makes America a driving force in international energy markets. But many
large domestic natural gas users in the chemical and refining industries fear exports could mean
natural gas price hikes from $1/mcf to $10/mcf within the next decade.71 The prospect of such
price hikes clearly should inform utility electricity-sourcing decisions and highlights the need for
access to coal-generated electricity.
69
Alan Armstrong, Strategy and Principles Foundation for Natural Gas Infrastructure Leadership,
Barclays CEO Energy-Power Conference, September 6, 2017.
70
Ibid.
71
Robert Walton, “U.S. Poised to Become Leader in Gas Exports, But Some Fear Price Impacts,” Utility
Dive (website), August 11, 2017.
‐ 23 ‐C. China and Carbon Dioxide
When tempted to shut down the domestic coal sector in the name of reducing carbon dioxide,
U.S. policymakers should pay attention to China’s energy policies. Chinese companies are
building or planning to build more than 700 new coal-fired power plants over the next decade. 72
Most of the plants will be built in China, but about one-fifth will be built in other countries. All
told, some 1,600 coal plants are planned or under construction in 62 countries worldwide. 73
Driving coal-generated electricity out of The CO2 emitted by these new facilities
will dwarf any reductions in emissions
the market, and thus relying too heavily resulting from closing coal-fired power
on natural gas and intermittent renewable plants in the United States. Chinese CO2
sources, will make the electricity supply emissions are expected to peak sometime
less reliable and increase energy costs for around 2030.74 Even if CO2 emissions are
consumers. a concern,75 it is imprudent for the United
States to shutter its coal-fired power plants
when China and India are rapidly
expanding coal-fired generation. Doing so would threaten the reliability and affordability of the
U.S. electricity supply while providing no environmental benefit.
Driving coal-generated electricity out of the market, and thus relying too heavily on natural gas
and intermittent renewable sources, will make the electricity supply less reliable and increase
energy costs for consumers. Increasing electricity costs disproportionately harm low-income
households76 and increase the costs for schools, hospitals, and businesses.
Part Four
Analysis of the Department of Energy Study
The U.S. Department of Energy (DOE) released a study in August 2017 examining electricity
markets and the reliability of the nation’s power grid.77 The study sought to determine factors
affecting the closure of baseload coal-fired and nuclear power plants, specifically how federal
policy interventions and changing fuel mixes have affected wholesale power markets.
72
Hiroko Tabuchi, “As Beijing Joins Climate Fight, Chinese Coal Companies Build Coal Plants,” The New
York Times, July 1, 2017.
73
Ibid.
74
“China CO2 Emissions to Rise by One Third Before 2030 Peak – Study,” Reuters, November 14, 2014.
75
There are plenty of reasons to believe carbon dioxide emissions into the atmosphere are not something
policymakers should be concerned about. See, for example, Pat Michaels and Chip Knappenberger,
“Climate Models Versus Climate Reality,” Climate Etc. (blog), December 17, 2015; and John C. Fyfe et
al., “Making Sense of the Early-2000s Warming Slowdown,” Nature Climate Change, February 24, 2016,.
76
Adam Chandler, “Where the Poor Spend More Than 10 Percent of Their Income on Energy,” The
Atlantic, June 8, 2016.
77
U.S Department of Energy, supra note 6.
‐ 24 ‐The DOE study found low natural gas prices and flat power demand were the primary drivers of
nuclear and coal-fired power plant retirements. Those factors resulted largely from changing
market forces and are not primarily due to government policy. However, the study also
concluded Obama-era regulations on coal-fired power plants and subsidies provided to
intermittent sources of energy such as wind and solar have played a large role in the retirement
of baseload power plants.
A. Role of Regulations
According to the study, the largest number of coal plant retirements occurred in 2015—the
deadline year for coal- and oil-fired power plants to add pollution control equipment for
compliance with the Mercury and Air Toxics Standard (MATS) (see Figure 12). MATS was
struck down by the U.S. Supreme Court as too costly78 but later reissued by EPA.
Figure 12
Retirements of Coal, Natural Gas, Nuclear, and Other Generating Units
2002–2022
The rate of retirement for coal unit closures has dramatically increased since 2012. These closures
reached their highest level in 2015 in response to the implementation of Mercury Air Toxics Rule (which
was ultimately struck down by the courts as too costly but was reissued by EPA) and the Clean Power
Plan. Source: U.S Department of Energy, Staff Report to the Secretary on Electricity Markets and
Reliability, August 2017.
78
Aaron Larson, “Supreme Court Strikes Down EPA’s MATS Rule,” Power Magazine (website), June 29,
2015.
‐ 25 ‐Also in 2015, EPA finalized its Clean Power Plan, which, if fully implemented, would place
additional pressure on coal-fired generation.79
The DOE study recommended changes and encouraged EPA to allow coal-fired power plants to
improve efficiency and reliability without triggering new regulatory approvals and associated
costs.
B. Federal Subsidies for Wind and Solar Depress Wholesale
Electricity Markets
In a cover letter accompanying the DOE report, Secretary of Energy Rick Perry wrote, “It is
apparent that in today’s competitive markets certain regulations and subsidies are having a large
impact on the functioning of markets, and thereby challenging our power generation mix.”80 The
report pulls up short of issuing policy recommendations based on those findings, essentially
“punting” on this important issue.
A competitive wholesale electricity market essentially is an auction in which utilities select
electricity generators to receive payments for generating electricity at a future date.81 Different
generators, which often have different
Heavily subsidized power generators, generation methods, submit bids to win
such as wind and solar, are able to submit these contracts. In this way, wholesale
bids that are artificially low, ensuring power markets are designed to facilitate
competition among electricity generators
they will gain market share at the expense and shift the risk of overpaying for
of low-cost nuclear and coal-fired power capacity or over-procuring capacity from
plants. electricity customers to independent
power producers.82
Generators bid based on the amount of revenue they expect to need to make their operations
economic. Heavily subsidized power generators, such as wind and solar, are able to submit bids
that are artificially low: They count subsidies as revenue, so they need less revenue from the sale
of the electricity. Those artificially low bids ensure the providers of intermittent energy will gain
market share, at the expense of low-cost nuclear and coal-fired power plants.
Subsidies for wind and solar power mean nuclear and coal-fired power plants run fewer hours,
which significantly reduces their revenue over time, prompting the early retirement of those
plants. In other cases, low wholesale power prices have caused many power companies to leave
79
Abby Harvey, “DOE Grid Study Points Finger at Natural Gas,” Power Magazine (website), August 24,
2017.
80
Rick Perry, letter accompanying Department of Energy report, August 23, 2017.
81
Robbie Orvis and Eric Gimon, “The State of Wholesale Power Markets: What’s Wrong with Proposed
Changes in Eastern RTO’s,” Utility Dive (website), June 20, 2017. See also Isaac Orr and Fred Palmer,
“Public Policy and Coal-Fired Power Plants,” Heartland Policy Study No. 147, The Heartland Institute,
forthcoming November 2017.
82
Ibid.
‐ 26 ‐You can also read