Lombok Energy Outlook 2030
←
→
Page content transcription
If your browser does not render page correctly, please read the page content below

Lombok
 Energy
Outlook

                   2030

    January 2019
Copyright
Unless otherwise indicated, material in this publication may be used freely, shared or reprinted, but
acknowledgement is requested. This publication should be cited as Lombok Energy Outlook (2018).

Disclaimer
The present report was developed with the support of National Energy Council (NEC), PLN Nusa Tenggara Barat
(NTB) and Dinas ESDM NTB. However, the results, simulations setup and views expressed in the report do not
represent any official statement or position of the aforementioned institutions and it is to be ascribed solely to the
main authors, i.e. Ea Energy Analyses and the Danish Energy Agency.

Acknowledgements
‘Lombok Energy Outlook’ is a publication prepared by the Danish Energy Agency (DEA) and Ea Energy Analyses in
collaboration with the Embassy of Denmark in Indonesia, National Energy Council, PLN NTB and Dinas ESDM.

Contacts:
Alberto Dalla Riva, Ea Energy Analyses, Email: adr@eaea.dk
Loui Algren, Danish Energy Agency, Email: loa@ens.dk
Maria-Eftychia Vestarchi, Danish Energy Agency, Email: mev@ens.dk

Credits
Cover photo by Colourbox
Foreword
The Danish Energy Agency is having a valuable cooperation with the
Indonesian partners in long-term energy planning, integration of
renewable energy and energy efficiency. Previous activities have focused          Martin Hansen
on national energy planning, but in this study we continue the
                                                                                  Deputy Director General
cooperation at province level in order to address more specific challenges
and opportunities for low carbon transition in Lombok. The Lombok                 Danish Energy Agency
Energy Outlook 2030 shows a promising potential for renewable energy,
reduction of local pollution and reduction of energy costs for the
population of Lombok. We are looking forward to continue the successful
cooperation with our Indonesian partners in the future.

These studies have been developed in a fruitful cooperation between
Indonesian partners and the Danish Energy Agency, and we have shared a
                                                                                 Pak Saleh Abdurrahman
lot of information, knowledge and experiences about low carbon energy
planning. The studies and added capacities are of great value for the            Secretary General
current and future energy planning in Lombok. I am very pleased to see
                                                                                 National Energy Council
that Lombok shows a great potential for large scale renewable energy.
                                                                               General Manager
Now we need to move into the implementation phase and I hope that
Lombok Energy Outlook will inspire investors to come to Lombok.

I am pleased to see how the modelling and energy planning can
                                                                                  Rasmus Abildgaard
contribute to spark an interesting and needed low carbon transition. It
                                                                                  Kristensen
lays the foundation for sound policy making and hopefully can inspire
policy makers to turn targets into action. I remain confident that Lombok         Ambassador
could be an excellent showcase for Indonesia to kick off a green transition.
                                                                                  Danish Embassy in
Once Lombok takes the bold decisions to move forward on a green path
                                                                                  Indonesia
my wish is that other provinces will follow in their footstep and replicate
those endeavours.

Lombok Energy Outlook 2030 clearly documents the potential for an
accelerated green transition for the benefit of people, business and the         Troels Ranis
environment. The Danish Energy Industry sees Indonesia as a great
partner country with a large potential for further collaboration in many         Director
fields. We are ready to engage further, sharing Danish experience in             Confederation of Danish
energy planning and to provide partnership, technologies and investment          Industries - Energy
to the green transition in Lombok and beyond

                                                         i
Executive summary
As part of the engagement between Denmark and Indonesia under the Strategic Sector Cooperation, the Danish
Energy Agency and the National Energy Council chose Lombok as a pilot area to study how the expected increase
in electricity demand can be met in a cost-efficient and sustainable way. The study in particular focuses on the
potential benefits and challenges related to large-scale deployment of variable renewable energy technologies.

Lombok is an island in the West Nusa Tenggara province, located between Bali and Sumbawa. The power system
on the island is not interconnected to the main Java-Bali system and today most of the power supply is based on
diesel generation, resulting in an average generation cost among the highest in Indonesia (13.9 c$/kWh). The
demand has been growing at a fast pace and the expectation is that this growth will continue, driven by
electrification and economic development, resulting in more than doubling of annual power consumption by 2030.
The island is blessed with a rich and diverse potential for renewable energy, including geothermal, cheap biomass
residues, a good irradiation suited for solar PV, fairly windy sites on the south coast, as well as opportunities for
hydro power plants, pumped-hydro, biogas and a consistent amount of municipal solid waste.

The Lombok Energy Outlook 2030 explores the potential evolution of Lombok power system from a planning and
techno-economical perspective using least cost optimization, across a number of different scenarios. The objective
of the study is to assess what is the most cost-efficient development of the power system in Lombok, considering
local resources available, the cost of technologies and fuel availability/price. Furthermore, the objective is to assess
what would be the cost of increasing renewable energy deployment in Lombok.

To answer these questions, the economic optimization model Balmorel is applied for optimizing capacity expansion
and merit order dispatch on a least cost basis. The representation of the Lombok power system in the model,
including details about current generation fleet, resource potentials and technology costs and characteristics, has
been developed in close collaboration with PLN NTB and Dinas ESDM.

Four main scenarios are analysed and compared throughout the report, all of them assuming the power demand
will increase in accordance with the official projections. The Business-as-Usual scenario, which is based on the
capacity expansion plans of the RUPTL, almost exclusively relies on new coal and gas power capacity to satisfy the
growing power need while in the three other scenarios, the model determines future deployment of capacity on a
least cost basis under different framework conditions regarding fuel prices and cost of pollutants:

    1. Business-as-Usual (BaU): developed based on the latest assumptions in RUPTL 2018-2027 from PLN. No
       investments in additional capacity and no costs for externalities are considered in the dispatch mechanisms.

    2. Least cost development under current conditions (Current Condition): capacity from RUPTL is considered
       only until 2019 (projects already committed or under construction), while the rest of the development of
       power capacity is optimized by the model.

    3. Least cost development with no fossil fuel subsidies (No Fossil Subsidies): considers the market-based fuel
       price for coal and gas, simulating a discontinuation of the domestic market obligation and price caps set by
       the government for coal and gas.

                                                           ii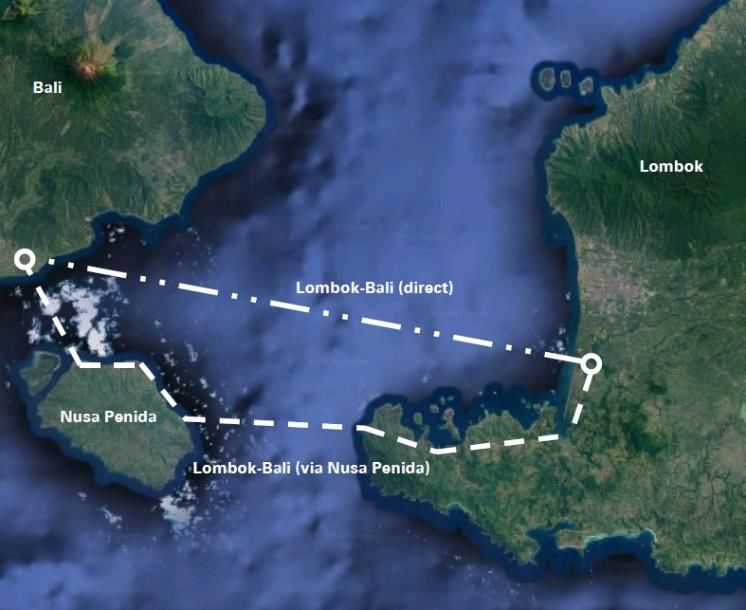
4. Socioeconomic least cost development (Socioeconomic): in addition to removing the subsidies to coal and
       gas, the health costs related to the emission of pollutants from power plants, such as NOx, SO2 and PM2.5
       are considered in the investment and dispatch optimization.

The model analyses show that there is a large potential for developing economically feasible renewable energy
projects; a potential that increases over time as the cost of renewable energy technologies are expected to continue
declining.

Biomass power, based on rice husk and corn residues, appears to be the most cost-efficient option for new capacity,
coming into play already in 2020-2022 across all three least cost scenarios. Geothermal power also appears very
competitive and provides a significant share of generation in all three least cost scenarios by 2030. Solar PV is not
cost-efficient under the current conditions where fuel prices are capped, but in the No Fossil Subsidies scenario
where subsidies to coal and gas are removed there is considerable deployment of solar PV. In the Socioeconomic
scenario, where the cost of pollution is also considered in the optimization, the deployment of solar is further
increased, along with wind power deployment.

All the least cost scenarios simulated have a substantially higher renewable energy share than the BaU with the
Socioeconomic scenario reaching 58% renewable energy of the total generation by 2030 (Figure 1).

                                     4,000

                                     3,500
     Annual Power Generation [GWh]

                                     3,000
                                                                                                                                                               Wind
                                     2,500
                                                                                                                                                               Solar
                                     2,000                                                                                                                     Run-of-river
                                     1,500                                                                                                                     Biomass
                                                                                                                                                               Geothermal
                                     1,000
                                                                                                                                                               Natural Gas
                                      500                                                                                                                      CNG
                                        0                                                                                                                      Coal
                                                Today

                                                                    BaU

                                                                                       Current Conditions

                                                                                                                         No Fossil Subsidies

                                                                                                                                               Socioeconomic

                                                                                                                                                               HSD
                                                                                                                                                               MFO

                                               2017                                                               2030

                                             Figure 1: Generation in the Lombok power system in 2017 and 2030, across the scenarios simulated.

When the total economy of each of the scenarios is compared using the capped fossil fuel prices, and disregarding
the costs of local pollution, the difference in total cost between all four scenarios is less than 10%. When considering

                                                                                                            iii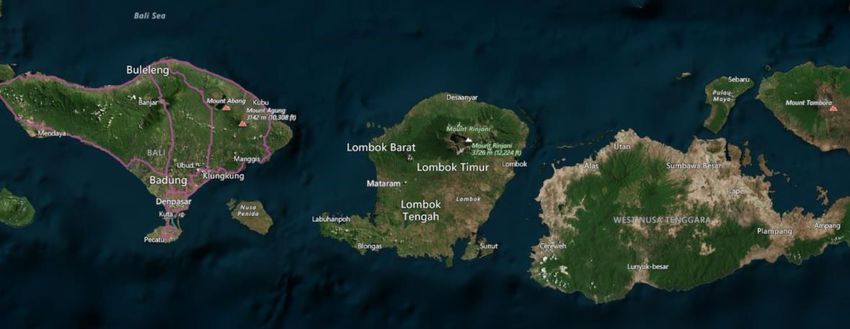
market based fossil fuels price, i.e. adding the fuel price subsidies to cost, the BaU scenario stands out as the most
costly option for Lombok, demonstrating total costs that by 2030 are approx. $50 million higher per annum than
the three least cost scenarios that are almost on par. Adding pollution related health costs to the equation make
the Socioeconomic and No Fossil Subsidies scenarios appear even more attractive relative to the Current Condition
scenario and in particular the BaU scenario.

In other words, the study shows that reaching a share of almost 60% renewable energy is cost-efficient from a
socioeconomic perspective. Even if pollution costs are ignored, it is still significantly cheaper than the BaU path
relying on fossil fuels.

Since renewable energy technologies are generally quite investment heavy, but low on operating expenses, capital
cost dominating in the scenarios with higher share of renewable energy. The model optimization is based on a real
discount of 10% per annum, representing a commercial investor’s perspective. If cheaper financing would be
available, for example through an international carbon financing mechanism, this would significantly benefit the
scenarios with high renewable energy shares. As an example, decreasing the real discount rate to 5%, reduces the
capital cost of the Socioeconomic scenario by $54 million whereas the cost of the BaU only decreases $25 million.

                               450

                               400

                               350

                               300
    System costs [million $]

                                                                                                                                           Pollution cost
                                                                                                                                           Fuel cost subsidy
                               250
                                                                                                                                           Fuel Cost
                               200                                                                                                         Start-up cost
                                                                                                                                           Variable O&M
                               150
                                                                                                                                           Fixed O&M
                                                                                                                                           Capital Cost
                               100

                                50

                                 0
                                             BaU            Current Conditions No Fossil Subsidies             Socioeconomic
                                                                                 2030

                                 Figure 2: Total system costs in 2030 by cost component, with the addition of the cost of fuel subsidy and pollution cost.

The choice of one of the two paradigms for the development for the power system in Lombok – fossil fuel or
renewable energy based – poses both challenges and opportunities.

                                                                                          iv
A fossil fuel dominated system is more exposed to the risk of fuel price fluctuation, has higher emissions of harmful
pollutants and faces the risk of technology lock-in. On the other hand, it is less complex and easier to operate, as
well as having a slightly lower generation cost.

Conversely, a future with large share of variable renewable generation will face a higher inherent complexity and a
stronger focus on integration measures, such as improved flexibility of power plants, forecasting system and
advanced operational practices. On the other hand, the system would be more resilient to fuel price fluctuation,
emit less pollutants and could potentially create local jobs and increase of touristic value of the island. CO2
emissions are currently not regulated in Indonesia, however, this may change in the future, as a means for Indonesia
to fulfil its obligations under the Paris agreement. Adding for example a moderate cost of $25 per tonne CO2,
increases the cost of the BaU scenario by $82 million whereas the cost of the Socioeconomic scenario only goes up
by $36 million.

In the coming years, local as well as national stakeholders, will face important decisions to ensure affordable,
reliable and accessible electricity for the people of Lombok. We hope that this report and other related activities
can help support these decisive planning choices for the future Lombok power system.

                                                         v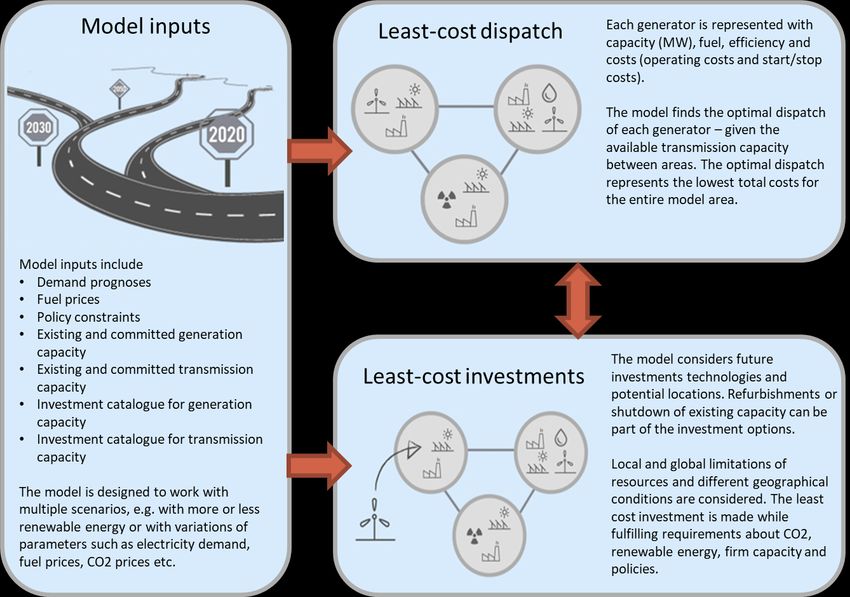
Table of content

EXECUTIVE SUMMARY ............................................................................................... II

TABLE OF CONTENT................................................................................................... VI

TABLE OF FIGURES .................................................................................................. VIII

NOMENCLATURE........................................................................................................ X

        INTRODUCTION ................................................................................................. 1
1.1     BACKGROUND, CONTEXT AND OBJECTIVE ......................................................................................... 2
1.2     GENERAL INFORMATION ON LOMBOK .............................................................................................. 2
1.3     LOMBOK POWER SYSTEM ................................................................................................................. 3

        METHODOLOGY .............................................................................................. 11
2.1     RESEARCH QUESTION AND SCENARIOS ANALYSED .......................................................................... 11
2.2     THE BALMOREL MODEL .................................................................................................................. 13
2.3     MAIN DATA AND ASSUMPTIONS..................................................................................................... 14

        RESULTS .......................................................................................................... 25
3.1     MAIN SCENARIO RESULTS ............................................................................................................... 25
3.2     POWER DEMAND SENSITIVITY SCENARIO ........................................................................................ 38
3.3     INTERCONNECTION SENSITIVITY SCENARIO..................................................................................... 39

        CONCLUSIONS AND RECOMMENDATIONS ...................................................... 43
4.1     POTENTIAL NEXT STEPS AND FUTURE WORK ................................................................................... 47

REFERENCES ............................................................................................................. 49

APPENDIX A – BALMOREL MODEL ............................................................................ 51

                                                                    vi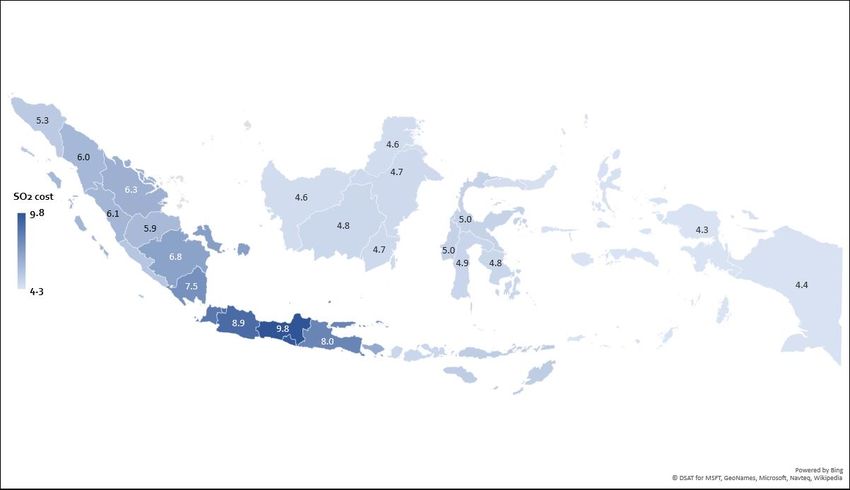
vii
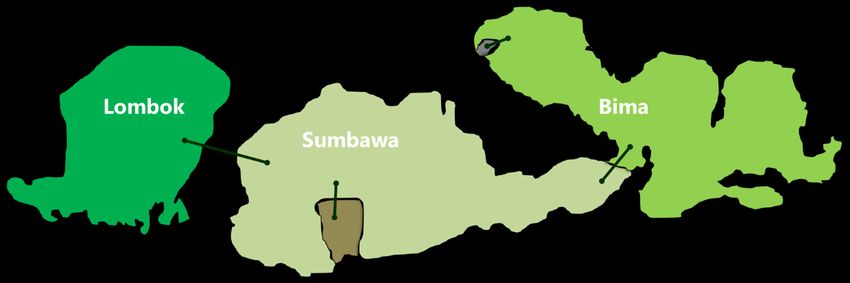
Table of figures
Figure 1: Generation in the Lombok power system in 2017 and 2030, across the scenarios simulated. .............. iii
Figure 2: Total system costs in 2030 by cost component, with the addition of the cost of fuel subsidy and pollution
cost. ........................................................................................................................................................................ iv
Figure 3: Lombok is situated between Bali and Sumbawa. Source: Bing Maps. .....................................................2
Figure 4: Evolution of peak demand and generation in the period 2015-2018 (2018 provisional). Source: PLN
NTB. .........................................................................................................................................................................3
Figure 5: Lombok power system. Representation of transmission system, current generators and planned
capacity expansion as for RUPTL. Source: PLN NTB ................................................................................................4
Figure 6: Power sales 2018 by consumer segment. Source: RUPTL. .......................................................................5
Figure 7: Development of peak demand and capacity expansion in MW in Lombok based on RUPTL 2018.
Percentage for each year indicates the reserve margin in the system [3]. .............................................................5
Figure 8: Demand projection in the Low Demand sensitivity compared to RUPTL 2018. ....................................13
Figure 9: Existing capacity in Lombok power system. ...........................................................................................14
Figure 10: Average hourly load in Lombok system (left) and assumptions for demand projection (right). .........15
Figure 11: Development of fossil fuel prices overtime, following the trend from WEO17. No subsidy scenarios
assume a 50% increase in price of coal and gas. ...................................................................................................17
Figure 12: Correlation between the cost of pollution from SO2, NOx and PM2.5 from each of the 27 EU members
and the population within a 500 km radius from the country’s geographical center. .........................................18
Figure 13: Health damage cost of SO2 emissions in Indonesia, resulting from the assessment. Source: [12] .....18
Figure 14: Potentials for RE in the island of Lombok. Biomass, biogas and waste are expressed in maximum fuel
consumption (GJ), but here transformed in MW by using power plant efficiency and FLH (5,000-7,000 for
biomass, 8,000 for biogas and waste). Wind has 150 MW of potential in high wind (3000 FLH) and the rest in
lower wind (2,400 FLH)..........................................................................................................................................19
Figure 15: Distribution of PV output in kWh/kW (FLH) on the left and locations chosen to calculate distribution
on the right. ...........................................................................................................................................................20
Figure 16: Hourly solar profile considered in the model. ......................................................................................20
Figure 17: Hourly profile of wind generation used in the model. .........................................................................21
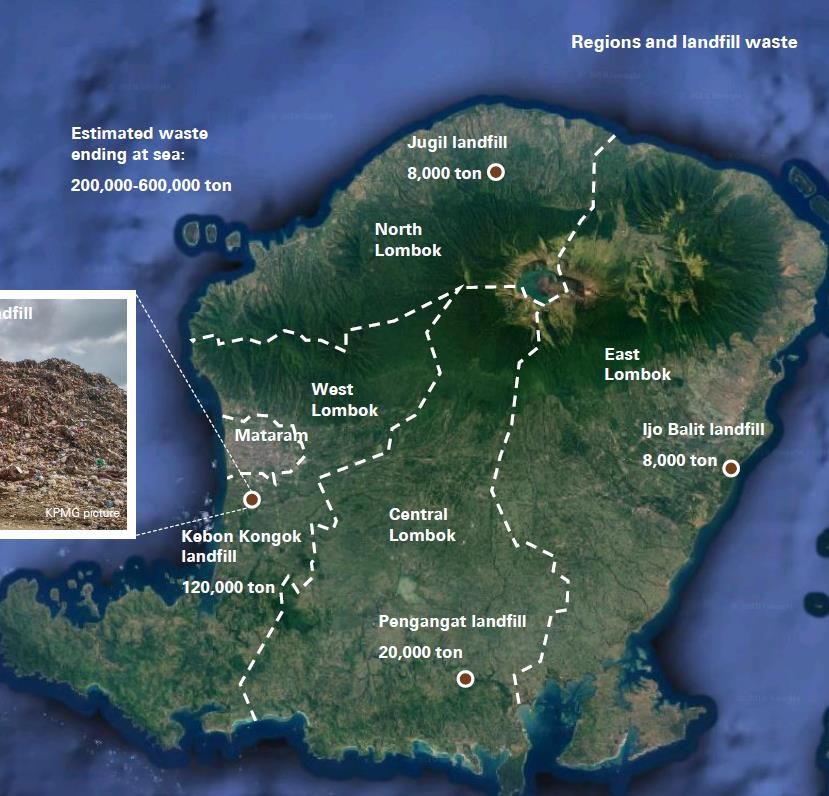
Figure 18: Waste potential in Lombok. Source: Prefeasibility Studies [1] ............................................................22
Figure 19: LCoE development from 2020 to 2030 for the main generation options in Lombok. Shaded area for
Coal and Gas represents the extra cost in case fossil fuel price is not capped. ....................................................23
Figure 20: Capacity evolution in the main scenarios. ............................................................................................25
Figure 21: Generation evolution in the main scenarios. .......................................................................................27
Figure 22: Generation share in 2030 in the main scenarios.RES (hydro, biomass, geothermal) and VRES (wind,
solar) share highlighted. ........................................................................................................................................27
Figure 23: Average daily dispatch in the four main scenarios in 2030. .................................................................28
Figure 24: Power supply by fuel during a week of December in the BaU scenario (above) and the Socioeconomic
scenario (below). ...................................................................................................................................................29
Figure 25 Power supply by fuel during a week of July in the BaU scenario (above) and the Socioeconomic scenario
(below)...................................................................................................................................................................30
Figure 26: Residual load duration curve (left) and daily curve (right). ..................................................................31
viiiFigure 27: Duration curve of hourly ramps in the system across the four scenarios in 2030. ..............................32
Figure 28: Duration curve of hourly ramps for coal power plants across scenarios in 2030. ...............................32
Figure 29: Available (light) vs dispatched (dark) capacity for natural gas and coal in the Socioeconomic scenario
in 2030. ..................................................................................................................................................................33
Figure 30: Emissions of pollutants related to power generation in the 4 scenarios. ............................................34
Figure 31: CO2 emissions for the four main scenarios. .........................................................................................35
Figure 32: Specific emission of carbon dioxide in the scenarios. ..........................................................................35
Figure 33: Total system cost across scenarios in 2022 and 2030. .........................................................................37
Figure 34: Development of annual generation in the Low Demand sensitivity compared to BaU. ......................38
Figure 35: Full load hours of power plants in 2030 in the two scenarios. ............................................................38
Figure 36: Interconnection options. Source: Pre-feasibility studies [1]. ...............................................................39
Figure 37: Development for Java-Bali system. ......................................................................................................39
Figure 38: Generation difference in Lombok (left) and Java-Bali (right) in the scenario with cable, compared to
the scenario without cable. ...................................................................................................................................40
Figure 39: Average daily dispatch in Lombok in 2030, when the interconnector is available. .............................41
Figure 40: Hourly difference in the marginal generation cost of Bali and Lombok. A positive value indicates an
advantage for Lombok to import power from Bali. ..............................................................................................42
Figure 41: Geographical representation of West Nusa Tenggara in the preliminary Balmorel setup. Lombok,
Sumbawa, Bima and the two isolated systems of Pekat and Lunyuk. ..................................................................47
Figure 42: Balmorel model, Indonesian setup.......................................................................................................51
Figure 43: Balmorel model inputs and optimization logic. ...................................................................................52
ixNomenclature
Abbreviations
BPP Biaya Pokok Penyediaan (average generation cost)
CF Capacity Factor
CNG Compressed Natural Gas
COD Commissioning Date
DEA Danish Energy Agency
Dinas ESDM Dinas Energi Sumber Daya dan Mineral
DMO Domestic Market Obligation
EVA Economic Evaluation of Air pollution
FLH Full Load Hours
GDP Gross Domestic Product
GHI Global Horizontal Irradiation
HSD High Speed Diesel
IPP Independent Power Producer
KEN Kebijakan Energi Nasional
LcoE Levelized Cost of Electricity
LNG Liquified Natural Gas
MEMR Ministry of Energy and Mineral Resources, Indonesia
MIP Mixed-Integer Problem
MFO Marine Fuel Oil
MPP Mobile Power Plant
mmscf Million standard cubic feet
mmscfd Million standard cubic feet per day
NEC National Energy Council, Indonesia
NTB Nusa Tenggara Barat (West Nusa Tenggara)
OPEX Operational cost
PLN NTB Lombok Regional Power Company
PPP Purchasing Power Parity
PV Photovoltaics
RE Renewable Energy
xRES Renewable Energy Sources
RUED Rencana Umum Energi Daerah
RUPTL Rencana Usaha Penyediaan Tenaga Listrik (electricity supply business plan)
SSC Strategic Sector Cooperation
SWOT Strengths-Weaknesses-Opportunities-Threats
TSO Transmission System Operator
VRES Variable Renewable Energy Sources (wind and solar)
Power plant and fuel definition
PLTU Coal
PLTG Gas
PLTGU Combined cycle gas plant
PLTS Solar
PLTA Hydro
PLTM Mini/Micro Hydro
PLTP Geothermal
PLTB Wind
PLTSa Waste
PLTBM Biomass
PLTD Diesel
xiIntroduction
Indonesia and Denmark are cooperating through a Strategic Sector Cooperation, which facilitates government-to-
government collaboration in areas where Denmark has decades of experience, which is valuable to rapidly
emerging economies. The Strategic Sector Cooperation program is embedded in the Ministry of Foreign Affairs with
technical support from different ministries and agencies in Denmark. The Danish partner of the Strategic Sector
Cooperation (SSC) program is the Danish Energy Agency (DEA) and the main partners in Indonesia are the Ministry
of Energy and Mineral Resources (MEMR) and the National Energy Council (NEC), who are both represented in the
steering committee. At the same time, the Danish Energy Agency also cooperates with the state-owned Indonesian
electricity company (PLN).
During the period from 2016 to 2018, the DEA has cooperated with the Indonesian counterparts in order to share
Danish lessons learned from the transition into a renewable energy (RE) system and identify where and how these
lessons learned could be useful in an Indonesian context.
The Lombok Energy Outlook report is a regional case study of the power system in the island of Lombok, part of
the West Nusa Tenggara province. The objective of the study is to assess cost-efficient developments of the power
system in Lombok, taking into account available local resources, cost of technologies and fuel availability/price,
thus providing support to the local stakeholders in the development of the future regional energy planning.
The study is part of a larger engagement in supporting the island of Lombok in the field of energy planning and
integration of RE. Another activity related this engagement is the preparation of Prefeasibility studies of potential
RE projects in the island [1], including a biomass power plant, a solar PV power plant, a wind power plant, and a
waste incineration power plant. In addition, an analysis of three technologies that can support integration of
fluctuating energy sources (Interconnector to Bali from Lombok, Hydro pumped storage, and Large-scale battery)
has been carried out, as well as an assessment of an off-grid PV/battery hybrid solution on the island of Medang.
The partners behind the project are:
• Dewan Energi Nasional (DEN), also referred to as National Energy Council (NEC), is a national, independent
and permanent institution that is responsible for national energy policy. National Energy Council is in charge
of designing and formulating national energy policies to be determined by the government, establishing
national energy general plans and supervise the implementation of cross-sectoral policies.
• Perusahaan Listrik Negara (PLN) NTB, the local branch of the national vertically-integrated power utility,
which is responsible for the planning and operation of the power system of Lombok, Sumbawa and Bima.
• Dinas Energi Sumber Daya dan Mineral (ESDM) NTB, the local office of the Ministry of Energy and Mineral
Resources (MEMR), responsible among other thing for regional energy planning in the province of West
Nusa Tenggara.
• The Danish Energy Agency (DEA), which is partnering with 12 countries around the world to create a clean,
prosperous and low-carbon energy future by sharing experience, expertise and innovation from the green
transition in Denmark. In Indonesia the Danish Energy Agency works closely with NEC and PLN.
• Ea Energy Analyses is a Danish company that provides consulting services and undertakes research in the
fields of energy and climate mitigation and adaption. Ea Energy Analyses has been working with NEC and
PLN in a number of projects related to energy modelling and RE integration in Indonesia.
11.1 BACKGROUND, CONTEXT AND OBJECTIVE
The NEC has proposed that the SSC program should study a pilot area in Indonesia in more detail in order to show
how a long-term energy strategy with a high variable renewable energy (VRE) penetration technically could be
possible and what the cost would be.
Given the current RE regulation and market conditions, the offered price for RE supplied to the grid is high in
Lombok compared to Java/Bali, which makes Lombok more attractive for developing financially viable RE projects.
As a result, it has been proposed to carry out an assessment for the Lombok system as a more detailed and realistic
case of a regional study. Findings from this analysis could be applied in other regions as well. The current average
production cost for electricity in Lombok is 13.68 cent$/kWh. In the light of international and national experience,
several RE solutions could therefore be financially viable. The size of Lombok is 4,725 km 2 with approximately 3.4
million inhabitants. According to the National Energy Plan (RUEN), there is a large potential for especially photo-
voltaic (PV) power production in the NTB province.
The objective of the study is to carry out a comprehensive and detailed power system analysis using case-specific
data for a relatively small isolated energy system, namely the NTB province. The analysis will function as a separate
regional case study which findings and recommendations will complement other DEA energy planning activities on
a national level. Focus of this study is on the power system of Lombok and not the entire West Nusa Tenggara.
Model setup for the Sumbawa-Bima system has been nonetheless initiated, in order to provide solid model
representation for future exploration, in connection with RUED.
1.2 GENERAL INFORMATION ON LOMBOK
The island of Lombok is part of the Lesser Sunda Islands chain, with the Lombok Strait separating Bali to the west
and Sumbawa to the east. It has a total area of 4,725 km2 and belongs to the West Nusa Tenggara province (Nusa
Tenggara Barat) of Indonesia. The provincial capital and largest city is Mataram, in the western part of the island.
Situated just south of the Equator, Lombok enjoys consistent hours of sunlight and warm temperatures throughout
the year, ranging from a low of 24°C to a high of 34°C during the hot months and 20°C to 31°C during cooler months.
There are two seasons: the dry season, from April to September, and the rainy season from October to March [2].
Figure 3: Lombok is situated between Bali and Sumbawa. Source: Bing Maps.
2According to the 2014 census, the population of Lombok Island was 3.35 million. Between 2010 and 2014 the
population average annual growth rate has been 1.1%, which is lower than the national population growth rate of
1.38% per annum between 2010 and 2015 [2].
1.3 LOMBOK POWER SYSTEM
The power system in Lombok today is almost entirely based on fossil fuels, with diesel being the main fuel in the
mix, followed by coal. A small amount of generation from hydropower and solar power completes the current
power supply (Figure 2).
The fuels used for the power supply are medium grade coal, High Speed Diesel (HSD) and Marine Fuel Oil (MFO).
The coal used in the PLTU power plants on the island is medium grade with a calorific value of around 4,500 kcal/kg.
While HSD is a distillate product with cetane number 45, used in a large range of application including
transportation, MFO is an oil fuel which is not a distillate, but includes a type of residue that is thicker at room
temperature and solid black. The use of this type of fuel is generally confined to direct combustion in large industries
and it is economically cheaper than HSD.
The power demand on the island has been growing steadily in the last few years (Figure 4), with the peak
consumption expected to total 260 MW by the end of 2018 [3]. The demand curve is relatively flat with a sharp
increase in the load around 18:00 in the afternoon, with the peak lasting until roughly 21:00.
Energi 2015 2016 2017 2018
No
Primer
(GWh) (GWh) (GWh) (GWh)
1 HSD 588.66 486.77 344.38 113.77
2 MFO 272.75 464.76 450.74 204.23
3 BIODIESEL - 38.76 29.63 -
4 AIR 49.04 63.70 58.96 30.27
5 BATUBARA 267.02 284.63 488.65 251.80
6 SURYA 0.64 0.99 1.07 0.41
Figure 4: Evolution of peak demand and generation in the period 2015-2018 (2018 provisional). Source: PLN NTB.
The electrification rate in the entire province of West Nusa Tenggara is 77%, with the lowest level of electrification
to be found in Sumbawa-Bima. Lombok, however, has a total electrification rate of 87.7% as of October 2018 and
only 3 villages are yet to be electrified.
3The existing fleet, totalling 306 MW, consists of 3 coal power plants, 7 diesel power plants, a number of small hydro
power plants scattered around Mount Rinjani and three solar power plants totalling 800 kW located in the Gili
islands. Most of the power supply and demand occurs in the western part of the island, where the capital Mataram
is located. The lower consumption centre is to be found on the East coast and is primarily supplied by local diesel
power plants.
The transmission system is well developed and enables a single dispatch system without major congestions. The
main system is a 150 kV network stretching from Mataram to East Lombok, which serves the city of Mataram, West
Lombok district, Central Lombok district, East Lombok district and North Lombok district. Two medium 20 kV
systems, as well as several small isolated systems (small islands) completes the power network of Lombok [3].
The power systems on three islands, Gili Trawangan, Gili Meno and Gili Air have been connected through a 20 kV
sea cable to the mainland Lombok system since 2012. Recently, also the island of Gili Gede in the south west has
been connected through a sea cable, enabling the reduction of local diesel generation and the provision of power
24 hours per day.
Figure 5: Lombok power system. Representation of transmission system, current generators and planned capacity expansion as for RUPTL.
Source: PLN NTB
Due to the large share of power supplied by diesel plants and engines, the average generation cost (BPP) of the
island is among the highest in all of Indonesia. In 2017, the generation cost was 1,861 IDR/kWh corresponding to
13.9 c$/kWh, while the cost in Java-Bali system, which is largely dominated by coal power, was 6.81 c$/kWh and
the national average 7.66 c$/kWh [4].
4The distribution of power sales for 2018, shown in RUPTL, clearly
Households Business
indicates that the largest consumer segments are households and 65% 20%
private businesses (including touristic hotels and resorts). The
industrial consumption is very low and is not expected to increase
drastically in the near future. Public
10%
Industry
5%
Figure 6: Power sales 2018 by consumer segment. Source: RUPTL.
Expectations for the next 10 years
Every year PLN, the national vertically integrated utility, publishes the national electricity supply business plan
named RUPTL (Rencana Usaha Penyediaan Tenaga Listrik). The most recent version, published during 2018 [3],
covers the period 2018-2027 and includes demand projections based on GDP evolution in each province, and
planned expansion of the transmission network and of the generation fleet.
The chapter related to the island of Lombok projects a steady increase of the demand, followed by an expansion of
the generation fleet. Figure 7 shows the development of both peak demand and installed capacity in MW and the
expected reserve margin for each year.
Figure 7: Development of peak demand and capacity expansion in MW in Lombok based on RUPTL 2018. Percentage for each year
indicates the reserve margin in the system [3].
The main strategic power plant projects in the Lombok system include four new coal units in the Eastern part of the
island (4x50 MW, PLTU Lombok FTP2 and PLTU Lombok 2) to meet the increasing demand and a 150 MW CNG gas
peaker (Lombok PLTGU/MGU) to meet peak load.
5An additional 15 MW of distributed RE projects (spread between Lombok and Sumbawa) are included in the list of
unallocated projects. The capacity stated is solar (PLTS) with the possible alternative listed being hydro power (18
MW, Sumbawa), geothermal (20 MW, Lombok and Sumbawa) and wind power (15 MW).
The main observations from Figure 7are the following:
• Large gas capacity (blue) is planned to substitute the expensive bulk diesel generation on the island;
• The level of reserve margin in the system is projected to remain high with more than 30% in 2027 and
more than 50% in some of the years.
• Despite the good RE potential on the island, the amount of RE projects considered by PLN in RUPTL
remains low for the coming 10 years.
The following table, adapted from RUPTL, provides an overview of all projects in Lombok including the expected
commissioning date (COD) and status.
Table 1: Planned generation units for the island of Lombok included in RUPTL 2018 [3].
Project Capacity
System Type Fuel Location/Name COD Status Ownership
number (MW)
Under
2 Lombok PLTU Coal Lombok (FTP 1) 25 2018 PLN
Construction
Under
6 Lombok PLTM Hydro Sedau Kumbi 1,3 2018 IPP
construction
7 Lombok PLTS Solar Pringgabaya 5 2019 Procurement IPP
8 Lombok PLTS Solar Selong 5 2019 Procurement IPP
9 Lombok PLTS Solar Sengkol 5 2019 Procurement IPP
10 Lombok PLTS Solar Kuta 5 2019 Procurement IPP
11 Lombok PLTGU Gas Lombok Peaker 150 2019 Procurement PLN
Under
13 Lombok PLTM Hydro Karang Bayan 1,3 2019 IPP
construction
Under
14 Lombok PLTM Hydro Batu Bedil 0,6 2019 IPP
construction
15 Lombok PLTM Hydro Koko Babak 2,3 2020 Procurement IPP
16 Lombok PLTMG Gas MPP Sambelia 30 2020 Planned PLN
19 Lombok PLTU Coal Lombok (FTP 2) 100 2021 Procurement PLN
21 Lombok PLTU Coal Lombok 2 50 2022 Planned PLN
22 Lombok PLTU Coal Lombok 2 50 2023 Planned PLN
PLTGU/
24 Lombok Gas Lombok 1 100 2025 Planned Unallocated
MG
20 Distributed PLTS Solar (or Distributed 15 2021 Planned Unallocated
other RE)
6Challenges going forward
The isolated power system of Lombok faces several challenges today and in its next future development. These
challenges have been identified in a dialogue with both PLN NTB and Dinas ESDM NTB, as well as based on a broader
stakeholder discussion.
1. Affordable power supply to the island
In order to provide cheap electricity to the inhabitants of the island, actions need to be taken to reduce the high
average generation cost (BPP). Among the potential measures to achieve a lower cost of electricity, the two most
frequently mentioned solutions are:
• Reduction of fuel oil in the mix: the plan is to reduce the supply from diesel, mainly in order to reduce the
supply cost, but also to limit pollutants in the mix and to reduce national import dependency. The planned
150 MW gas peaker is a step in this direction and it is expected to almost entirely offset the generation
from diesel in the main grid system.
• Interconnection to Java: the interconnection of Lombok system to Java-Bali through a marine cable to Bali
has been a topic of discussion. This would allow lowering the retail price and might support further
integration of RE as well as improve grid stability. The project comes however with challenges which include
high investment costs and deploying the cable in the deep strait which also has strong currents and
occasional earthquakes [1].
2. Uncertain supply of gas and coal
Based on the projections from RUPTL, the power system of Lombok will rely largely on natural gas and coal.
Unlike other locations in Indonesia, Lombok does not have access to natural gas directly from the fields through a
gas pipeline. For the new Lombok Peaker power plant, the gas is to be supplied in the form of CNG obtained from
the gas supplier in Gresik (East Java). The gas is first compressed in Gresik’s facilities, then transported to Lombok
using a CNG vessel and finally decompressed in a local facility close to the power plant, located in the Tanjung
Karang area, close to Mataram city.
The CNG vessel, transporting the gas to Lombok, is the first-of-its-kind in the world, and will have the capacity to
transport as many as 23 mmscf per trip (21.6 BBTU per trip). The total supply available from compression facility of
Gresik should be around 40 mmscfd (41 BBTU/day) and only part of this will be supplied to Lombok. The vessel
takes 4 days to load, reach Lombok and unload. The daily supply to Lombok is therefore limited to around 5.4
BBTU/d and it is not clear whether it would be possible to expand this in the next future. The maximum daily supply
of CNG using the vessel, corresponds to roughly 6 hours of operation at full load for the 150 MW power plant.
Two additional power plants are also supposed to be fueled with natural gas, in this case in the form of LNG: the
existing MPP Power plant (50 MW) close to Mataram which is currently fueled with HSD and the planned Sambelia
30 MW power plant in the eastern part of the island. The original project is expecting mini LNG regassification
facilities to be built on site, but no action has been taken so far and the government seems to be evaluating the
actual increase in the power demand before investing in new LNG facilities [5].
As for the coal supply to the island, it is affected by two sources of uncertainty: price and supply.
7Through the domestic market obligation (DMO) the Indonesian government forces local coal miners to supply part
of their coal production to the domestic market, specifically to coal-fired power plants as there is a real need for an
increase in the nation’s power supply. The price of coal for PLN, through the DMO quotas, is capped at 70 $/ton for
high grade coal and 43 $/ton for lower grade coal. This price is locked until late 2019 and the confirmation of this
subsidy is highly uncertain [6]. As a reference, the market price of high graded coal averaged around 103 $/ton
between August and November 2018 (HBA index) [7], which is 50% higher than the price cap for PLN.
Moreover, the amount of coal output from mines is capped nationally to maintain the internal supply stable in the
future and Lombok is assigned a certain quota of this total national output. It is uncertain how this cap will evolve
in the future and whether Lombok can increase the coal use indefinitely in the future years.
3. Long commissioning process and difficulties with land acquisition
PLN and Dinas ESDM have stated that long commissioning process for power plant development and buildout is
one of the key factors limiting the local capacity expansion. It has for example taken 7 years to receive the final
approval of for 50 MW coal power plant on the island.
Several elements contribute to the slowing down of project development, with the land acquisition process being
one of the major barriers. Contributing to the difficulties of the land acquisition is the importance of agriculture
which is the major GDP contributor to the island economy, the heritage value of land for farmers, as well as the
lack of clarity regarding the ownerships of some lands, due to the lack of clear documentation.
4. Technical challenges for integration of more RE in the system
As mentioned earlier, the Lombok power system is a non-interconnected system, with a relatively weak electrical
grid, posing challenges to the development of VRE projects. Concerns regarding voltage and frequency stability
problems at the distribution grid level as a result of increased solar and wind penetration were the main reasons
for limiting the installed capacity of the new solar power plants under construction in Lombok to 5 MW each.
Another barrier to a larger RE penetration in the grid is the current dispatch mechanism. The power dispatch is
organized with a day-ahead scheduling followed by a manual power plant dispatch via radio. In case the power
from a certain plant has to increase, the control center contacts the power plant via radio to request an increase in
the power output. This communication channel is very fast to e.g. cover the fluctuation of solar power in the grid.
Moreover, the dispatch is conducted without deploying any forecasting system. Currently, the solar power plants
in the system are scheduled the day-ahead using the full rated capacity and the difference between the scheduled
rated capacity (5 MW) and the actual generation (e.g. 3 MW) is to be covered by diesel power plant running as
spinning reserve. With this mechanism and the lack of forecasting, the backup needed for RE is 1:1, i.e. for each 1
MW of VRES installed there is a need of 1 MW of reserve.
Another aspect that constitutes a reason for concern and which could be exacerbated by a higher solar generation
is the ramping of the load at night.
Due to these and other reasons, for example the preference for not ramping down baseload generation, the limit
to VRES penetration is indicatively set in Lombok to 20% of the hourly power demand, for every hour of the year.
This is a major barrier for additional fluctuating RE in the system of Lombok, as well as other regional systems in
Indonesia.
85. Reconstruction after the earthquakes of summer 2018
During July-August 2018, a number of earthquakes shook the island of Lombok. The strongest quakes (6.4 and 6.9
Richter) hit the North Lombok, a more rural area with lower income compared to the capital Mataram, and caused
more than 460 casualties [8].
While the cost in terms of human lives and damage is high, especially for an area of low income like North Lombok,
it seems that the power system has not been strongly affected by the event. PLN mentioned that rebuilding and
electrical connection of all villages is well in progress and the expectation is that the event will not negatively affect
the next step of the planned evolution of the system, nor the economic development of the island.
Potential concern regarding the future risk of infrastructure damage, might affect the willingness to invest in new
power plants, in particular for IPPs. The effect is, however, difficult to estimate at this point in time.
910
Methodology

2.1 RESEARCH QUESTION AND SCENARIOS ANALYSED
Starting from the current power sector conditions and taking into consideration all the challenges faced in the
development of the power sector in Lombok, a number of questions arise:

       •   What is the most cost-efficient development of the power system in Lombok, taking into account
           available local resources, cost of technologies and fuel availability/price?
       •   How do subsidies to fossil fuels and externality cost of pollutants affect the least cost development?
       •   What is the cost of increasing RE deployment in Lombok?

In order to answer these questions and explore the potential future development of the power system in Lombok,
a set of scenarios is designed and analysed. All scenarios, apart from BaU, look at least cost development of the
system, each assuming different boundary conditions.

    1. Business-as-Usual (BaU)
       The BaU scenario is based on the most recent assumptions in RUPTL 2018-2027 from PLN. No investments
       in additional capacity and no costs for externalities are considered in the dispatch mechanisms. The model
       optimizes only the dispatch on an hourly level based on the marginal generation cost of the power plants,
       taking into account the current fuel price structure. The level of ambition in terms of RE of this scenario is
       limited to 20 MW of solar power coming online in 2019 and additional 8 MW small hydro.

    2. Least cost development under current conditions (Current Conditions)
       In this scenario, only capacity specified in RUPTL as projects already committed or under construction
       projects already committed or under construction1 is considered until 2019, while the rest of the
       investment in power capacity development is optimized by the model. The model optimizes the capacity
       development with no consideration of external costs of pollution and using the current capped price for
       coal and gas.

    3. Least cost development with no fossil fuel subsidies (No Fossil Subsidies)
       This scenario builds on the Current Conditions scenario but considers the market based fuel price for coal
       and gas, simulating a discontinuation of the DMO and the price cap set by the government for coal and gas.
       To represent this, the prices of coal and gas are increased 50% compared to the other scenarios. As a
       reference, the PLN capped price for high grade coal (>6,000 kcal/ton) is set to 70 $/ton, while the current
       market price for high grade coal is around 105 $/ton, exactly 50% higher.

1
 Specifically, the power plants included in the scenarios are those with COD until 2019: 25 MW PLTU, 20 MW PLTS, 150 MW
PLTGU Lombok Peaker, 3.3 MW PLTA.

                                                          11
4. Socioeconomic least cost development (Socioeconomic)
In the Socioeconomic scenario, not only the subsidy to coal and gas is removed, but the external costs of
pollution from NOx, SO2 and PM2.5 are considered in the investment and dispatch optimization. No
externalities related to the emissions of CO2 are considered in the scenario.
The timeframe chosen for all scenarios is 2020-2030 with simulations for every two years, while the year 2017 will
serve as a base year for comparison. An investment simulation is carried out, considering full time resolution
(hourly) and an annual horizon for the optimization. The investments in most power plants are optimized on a
discrete basis, considering a standard size of the power plants. The optimization is therefore a Mixed-Integer
Problem (MIP). For more modular technologies like wind, solar and storage, the capacity is instead optimized on a
continuous basis. Based on the investment simulation results, a more detailed dispatch optimization run is carried
out, with a time horizon of one week and unit commitment constraints related to the technical capability of power
plants, i.e. including online/offline status, ramping limits of units, minimum load and start-up cost.
The following table summarizes the scenario setup based on the three main elements and assumptions that
differentiate them: initial capacity assumed, specific fuel targets, external cost of pollution.
Table 2: Applied scenario assumptions.
Fossil fuel
Externality cost of
Scenario Initial capacity cost
pollution
All RUPTL18 capacity
BaU None Capped price
No additional investments
RUPTL18 only until 2019
Current Conditions None Capped price
Then optimal investments
RUPTL18 only until 2019 Coal and gas price follow
No Fossil Subsidies None
Then optimal investments market
RUPTL18 only until 2019 Externality cost on NOx, Coal and gas price follow
Socioeconomic
Then optimal investments SO2 and PM2.5 market
Sensitivity analyses
In addition to the main scenarios just described, in which the power demand is equal to the development expected
in RUPTL, an additional sensitivity analysis is performed to assess the potential effect of a lower power demand, as
a result of lower energy intensity. The sensitivity is carried out on the basis of the BaU scenario.
12The assumptions behind the alternative power demand scenario are as follow: it is assumed that the same
economic growth in West Nusa Tenggara can be achieved with a lower power consumption. Specifically, the
average power demand growth in the period 2018-2027 is reduced from an average of 7.6% to an average of 6%.
This corresponds to a reduction in the power intensity (ratio between the increase of power demand and the
increase of GDP) from 1.6 to 1.22. The value of 1.22 also corresponds to the average power intensity in Indonesia
between 2009 and 2016, based on figures provided in the RUPTL.
This resultant power demand projection in the Low Demand sensitivity is 6% lower in 2020 and 13% in 2030
compared to the RUPTL assumptions used in the rest of the scenarios.
4000
3500
Power demand [GWh]
3000
2500
2000
1500
1000
500
0
2018 2019 2020 2021 2022 2023 2024 2025 2026 2027 2028 2029 2030
RUPTL 2018 Low Demand
Figure 8: Demand projection in the Low Demand sensitivity compared to RUPTL 2018.
An additional sensitivity scenario is carried out to analyse the effect of a potential interconnection to Java-Bali
system with a sea cable through the Lombok strait.
The Interconnection sensitivity scenario looks at how would the dispatch and the integration of RE changes in case
Lombok would be connected to Java-Bali system, in the case of Socioeconomic scenario. The analysis looks at the
change in the dispatch schedule with and without interconnection, to draw conclusions on the potential benefits
of the interconnection in comparison to its cost.
2.2 THE BALMOREL MODEL
Balmorel is a model developed to support technical and policy analyses of power systems. It is a bottom-up partial
equilibrium model which essentially finds economical dispatch and capacity expansion solution for the represented
energy system, based on a least cost approach.
To find the optimal least cost outcome in both dispatch and capacity expansion, Balmorel considers developments
in electricity demand overtime, grid constraints, technical and economic characteristics for each kind of production
unit, fuel prices, and spatial and temporal availability of RE. Moreover, policy targets in terms of fuel use
requirements, environmental taxes, CO2 limitations and more, can be imposed on the model.
More information on the model can be found in Appendix 1.
132.3 MAIN DATA AND ASSUMPTIONS
The modelling of the Lombok power system, as well as the assumptions behind, have been prepared and reviewed
in collaboration with the teams of PLN NTB and Dinas ESDM during the training session in Lombok and training in
PLN Kantor Pusat DIV SIS.
Additional data for specific RE projects on the island has been included from the Prefeasibility studies project [1],
which studied the business case of 7 RE projects in Lombok and West Nusa Tenggara.
Current generation fleet
To represent the current power system, each existing power plant has been modelled individually, with information
about the efficiency (heat rate), variable and fixed operational cost, as well as emission data.
The total installed capacity as of November 2018 is 306 MW, most of which is HSD and MFO fuel oil plants, followed
by coal power plants and a small amount of run-of-river hydro and solar, like depicted in Figure 5 [3].
350 60
50
300
40
250
Installed capacity [MW]
MW
Solar PV 30
200 Run-of-river
20
Mfo
150 Hsd
10
Coal
100 0
PLTD TMN
PLTD PMT
MPP JRG HSD
PLTD CGD
PLTM
PLTD AMP
PLTU JRG 3
PLTU JRG 1
PLTU LED
PLTD SWTM
PLTD SWJ
PLTS Gili
50
Coal Hsd Mfo Hydro Solar
0 PV
Figure 9: Existing capacity in Lombok power system.
Currently, PLN is stipulating contracts to lease diesel power plants. This has been modelled with agreed capacity
factors (CF) throughout the year and dispatch cost per kWh. The average minimum CF agreement with leased power
plants is 60% (5,300 FLH). The minimum CF as for the contract are enforced in the model only until 2019, after
which PLN is planning to install Lombok Peaker unit (150 MW, PLTGU).
14Power demand
The peak power of the island of Lombok has been increasing throughout the past few years, from around 211 MW
in 2015 to the current 235 MW, with expectations for the peak power to reach 260 MW by the end of 2018 (based
on RUPTL).
The demand profile, represented in Figure 10 as average daily load, is relatively flat during the day with a sharp
peak surge in the late afternoon, around 18, when the sun sets and customers switch on lighting and other power
equipment. This sudden load ramp is one of the challenges in the system, due to the need of fast ramping units to
pick up load increases. Following the effect that has been famously described as the “duck curve” in California, the
integration of more and more PV in the system, exacerbates this challenge, since the effect on the residual demand
curve is relatively higher. One other characteristic worth noting is the morning peak related to people waking up
and early morning prayer time.
Figure 10 (right) shows also the historical development of power demand until 2017 and the projection assumed in
the study toward 2030. The power demand projection assumed is from RUPTL 2018-2027, with trendline
assumption between 2027 and 2030.
250 4,000
3,500
200
3,000
Average demand [MW]
Power Demand [GWh]
150 2,500
2,000
100
1,500
1,000
50
500
0 -
0 2 4 6 8 10 12 14 16 18 20 22
Hour of the day
Figure 10: Average hourly load in Lombok system (left) and assumptions for demand projection (right).
Technical and financial data
In order to be able to optimize future capacity expansion, it is of paramount importance to estimate the
development of the cost and performance of generation technologies. For this reason, a Technology Catalogue for
Power Generation technologies of has been developed in 2017 in collaboration with Danish Energy Agency (DEA),
National Energy Council (NEC) and a number of power sector stakeholders [9].
15You can also read