Can the UK afford (not) to produce chemicals in 2050?
←
→
Page content transcription
If your browser does not render page correctly, please read the page content below
Can the UK afford (not) to produce chemicals in 2050?
June 2013
Dr Paul Gilbert, Dr Mirjam Roeder & Dr Patricia Thornley
Tyndall Manchester
University of Manchester
Manchester M13 9PL
P.J.Gilbert@manchester.ac.uk

A research briefing funded by:

This report is non-peer-reviewed and all views contained within are attributable to the authors and do not
necessarily reflect those of researchers within the wider Tyndall Centre.
Contents (use the hyperlinks to navigate directly to the start of specific sections)

Acknowledgements …………………………………………………………………………………………………..………………….                                     4
Abbreviations …………………………………………………………………………………………………..…………………………..                                    4
Foreword ……………………………………………………………………………………………………………………………………….                                        5
Executive summary ……………………………………………………………………………………………………….………………                                     6
1. Introduction …………………………………………………………………………………….……………………………………...                                   9
2. Performance of the UK chemical industry ………………………………………………………………...…………….                         10
    2.1 Segments of the chemical industry …………………………………………………………………..………..……..                       10
    2.2 Performance of the chemical industry …………………………………………………………….………………..                        12
    2.3 Impact of the economic downturn ……………………………………………………………………..……………..                          14
    2.4 Exports of UK trade ……………………………………………………………………………………………………..…….                              15
    2.5 Labour force ………………………………………………………………………………………………………………..…….                                 17
    2.6 Outlook ………………………………………………………………………………………………………………………..……                                    18
3. Energy use and emissions from the chemical industry ………………………………….………………..……….                    18
    3.1 Energy use ………………………………………………………………………………………………………………..……….                                  18
    3.2 Breakdown of feedstock and raw material use ………………………………………….…………..………….                     19
    3.3 Emissions trends for the EU’s chemical industry …………………………………………………..……………                   20
    3.4 Emissions trends for the UK’s chemical industry ………………………………………………..………………                   21
         3.4.1 Direct energy use emissions …………………………………………………………………………..………..                       22
         3.4.2 Process emissions ..……………………………………………………………………………………….…………                            23
         3.4.3 Total greenhouse gas emissions ……………………………………………………………………….……..                       24
         3.4.4 Greenhouse gas emissions by type and source …………………………………………..……………                   25
         3.4.5 Relating global production to emissions ………………………………………………………………....                  25
    3.5 Future projections of CO2 emissions from chemical production – outlining the challenge ...   27
4. Emission targets and policy framework …………………………………………………………..……………………….                          30
    4.1 European targets ……………………………………………………………………………………………………………….                                 30
    4.2 UK policy landscape …………………………………………………………………………………………………………..                               31
5. Global competition, relocation and impact on the climate ……………………………………………………..                   32
    5.1 Global competition and relocation …………………………………………………………………………………….                          32
         5.1.1 Classical reasons for relocation ………………………………………………………………………………..                     32

                                                                                                 2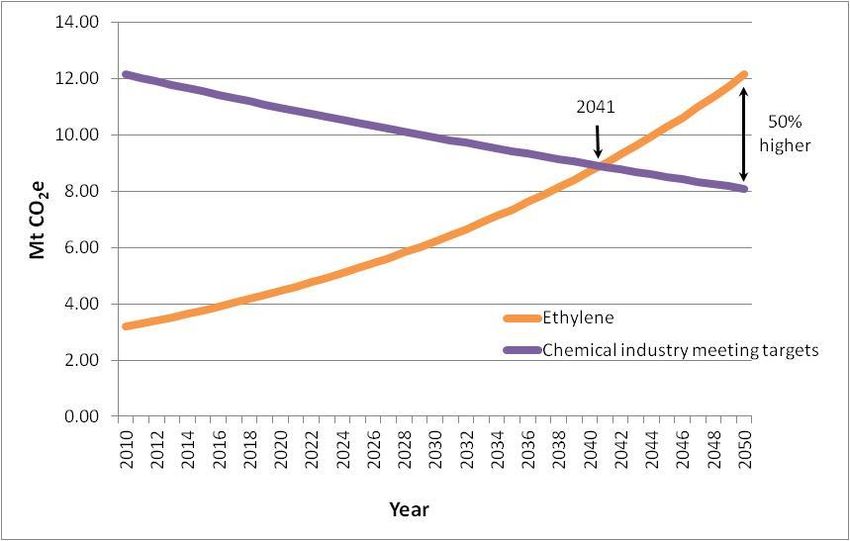
5.1.2 Shifting patterns of supply and demand …………………………………………………………………..            32
   5.2 The impact of relocation on the climate …………………………………………………………………………….              33
6. Mitigation …………………………………………………………………………………………………………..…………………….                          35
   6.1 Increased energy efficiency ……………………………………………………………………………………………….                   36
   6.2 Biomass as an energy source and feedstock ………………………………………………………………………               36
   6.3 Carbon capture and storage technology (CCS) ………………………………………………………………….              37
   6.4 Demand-side measures and the circular economy …………………………………………………………….              37
7. Barriers and opportunities for the UK’s chemical industry ………………………………………………………         38
   7.1 Mitigation ………………………………………………………………………………………………………………………….                          38
       7.1.1 Fuel and feedstock substitution with biomass and MSW ………………………………………...       38
       7.1.2 Industrial symbiosis …………………………………………………………………………………………………                    39
       7.1.3 Carbon capture and storage technology ………………………………………………………………….              40
       7.1.4 Electrification of industrial heat ……………………………………………………………………………….            41
   7.2 Climate policy and relocation …………………………………………………………………………………………….                  41
       7.2.1 Uncertainty in the UK chemical industry ………………………………………………………………….            41
       7.2.2 UK climate policy ……………………………………………………………………………………………………..                    41
8. References ………………………………………………………………………………………………………………………………..                           43

                                                                                       3
Acknowledgements
This research has been funded by the additional Engineering and Physical Sciences Research
Council (EPSRC) sponsorship funds. It has been carried out in collaboration with the Northeast of
England Process Industry Cluster (NEPIC). This included a small stakeholder workshop with NEPIC
members. The authors would like to thank those members of NEPIC who took part. They would
also like to express their gratitude to everyone else who assisted with their research.
Abbreviations and other terminology used in this report
BIS: the Department for Business Innovation and Skills
CA: Copenhagen Accord (2009)
CCA: Climate Change Act (2008)
CCAs: Climate Change Agreements
CCL: Climate Change Levy
CCS: Carbon capture and storage
CHP: Combined heat and power
COGA: Combined Off Gas Abatement
ETSAP: Energy Technology System Analysis Programme
EU ETS: EU Emissions Trading System
EU RED: EU Renewable Energy Directive
GDP: Gross Domestic Product
ICCA: International Council of Chemical Associations
IRENA: International Renewable Energy Agency
NEPIC: Northeast of England Process Industry Cluster
OECD: the Organisation for Economic Co-operation and Development
Ofgem: Office of the Gas and Electricity Markets
RHI: Renewable Heat Incentive
ROCs: Renewable Obligations
SIC: Standard Industrial Classification
UNFCCC: United Nations Framework Convention on Climate Change
4Foreword
The Chemical and Process industry in the UK is the leading manufacturing export sector and
underpins the advanced manufacturing sector across the economy. It is an essential part of any
attempt to move to a low-carbon advanced economy. But in playing this role in the UK and within
the EU it is exposed to a number of challenges, which government and companies need to meet if
its contribution to society is to be maintained.
Despite having made substantial improvements to its energy efficiency – some 35% between 1990
and 2006 – and its products contributing to reducing emissions elsewhere in the economy, the UK
industry cannot tackle climate change alone. Neither can the EU. A global agreement is needed
alongside other policy measures and approaches by industry and government here in the UK. Only
by working in partnership can investment and innovations be secured which will retain a
competitive industrial base in the UK in the face of a rapidly changing energy cost and supply
situation.
This report highlights the role of the industry, the issue of carbon leakage and what are some of
the responses to the goal of reducing carbon emissions. It sets out the challenges. What we need
now is a long-term strategy to respond if we are to see both a rebalanced economy and a low-
carbon one which has not just exported its emissions.
Mark Lewis CEng FIET
Technical Manager
North East Process Industry Cluster
5Executive summary
The UK chemical industry contributes significantly to the economy, but faces increasing pressure
from overseas competitiveness
The UK chemical industry is a substantial part of the economy in terms of turnover, employment
and trade. Nonetheless, the industry is struggling competitively with the Middle East and the US
due to the lower costs of energy and chemical feedstocks, and with the Far East due to rising
demand and cheap labour. Shale gas is increasing the US’s competitiveness. See section 2
There is insufficient evidence to confirm that UK climate policy and regulation is responsible for
the loss of competitiveness
Parts of the chemical industry are shutting down in the UK and relocating to other regions due to
demand, locality of raw materials and production costs. This is resulting in ‘weak carbon leakage’
and global greenhouse gas emissions may increase accordingly. Although these regions typically
have less stringent rules, or an absence of regulation and policies to address greenhouse gas
emissions, evidence suggests that the industry is not relocating due to climate policy. However,
the UK’s climate change targets are challenging for the industry and the wider economy. Such
targets could impose further pressure on competitiveness in the UK in future and lead to ‘strong
carbon leakage’ (where an industry relocates to a region where there is specifically less, or an
absence of, regulation and policies to address greenhouse gas emissions). See section 5.2
The UK’s carbon footprint associated with chemicals is increasing (consumption basis)
The UK chemical industry’s greenhouse gas emissions (from direct energy use and processes) have
reduced by 70% since 1990. However, this has not been solely the result of energy efficiency
improvements. The reduction in the UK’s chemical industry emissions has largely been a result of
the closure of production sites and/or relocation to other nations with lower production costs and
energy and feedstock costs. When examining the UK’s carbon footprint from a consumption-based
approach, where the UK would take account of emissions produced in other nations during the
manufacturing of the goods it consumes, overall emissions associated with the consumption of
chemical-derived goods and commodities are likely to be increasing. See section 3.5
Industry requires substantive reductions in emission intensities to satisfy UK climate targets
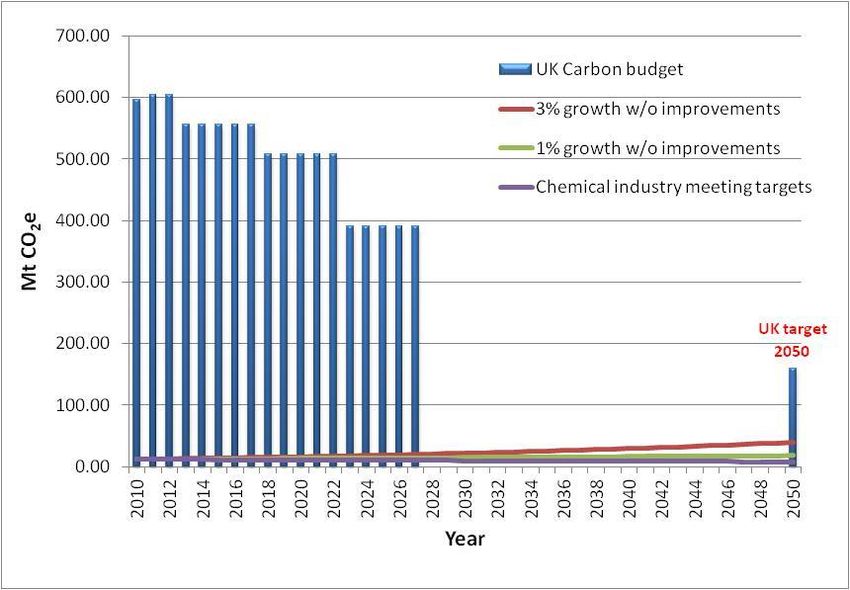
The UK chemical industry is anticipated to grow in the period to 2020. Growth rates of 1-3% could
mean that, with no change to emission intensity or UK chemical production mix, the chemical
industry could account for 11-25% of the total UK carbon budget in 2050. To ensure that the
industry reduces its emissions by 80%, the absolute growth rates would require the emission
intensity to reduce by ~2-4% p.a. Historically, technically mature industries reduce emission
intensity levels by 1-1.2% p.a. It is extremely unlikely that the cumulative impact of incremental or
efficiency improvements would deliver the radical reductions required by the UK’s carbon budgets
and target. See section 3.4
6Industry requires an urgent, radical rethink of how it produces chemicals
If the industry is to step up to the challenge of meeting the UK’s climate targets and maintain
competitiveness it will need to move beyond incremental energy efficiency improvements
towards more radical, step changes. This will require significant changes to the current processes
operated, with commensurately high levels of capital investment. Promising options specific to the
UK industry include biomass and waste CHP or gasification for direct energy production and/or
feedstock substitution; carbon capture and storage technologies; and industrial symbiosis through
for example, the reuse and recycling of heat, steam and gases. However, the major barrier to such
changes is that there are few incentives to invest in new, low-carbon, chemical production
facilities in the UK. See section 6
Reducing the carbon intensity of high grade heat requirements is challenging
The chemical industry requires large quantities of high grade heat and steam; the low-carbon
provision of which is a major challenge. There are substantial quantities of low-grade heat
available in many processes, and technical options (such as condensing biomass boilers) could
increase this. However, these require reconfiguration of existing infrastructure, the capital cost of
which is difficult to justify in the current market. For example, the recovery of low-grade heat is
not presently as financially viable as maximising more valuable electrical output from a biomass
boiler. Often it is assumed that the heat demand can be substantially electrified, without
considering the infrastructure required for this or the difficulty in generating high pressure
process-grade heat from an electrical source. See section 7
Waste must be seen as a commodity for the industry
The gasification of waste is a viable option for low-carbon energy production and/or chemical
feedstock substitution. However, this is unlikely to be developed while it is more economically
feasible to generate electricity from waste rather than hydrogen or syngas. See section 7.1.1
Carbon capture and storage technology – attractive, but not timely
Cost, an ageing asset life and a multitude of small-scale organisations which collectively emit a
large amount of CO2 have arguably halted the development of CCS technology for the UK industry.
If the industry were to pursue CCS it would have to combine it with new infrastructure and plants
and the timeframes for this would not be commensurate with meeting 2020 carbon targets and
would be unlikely to contribute substantially prior to 2030. See section 7.1.3
Demand-side emission reduction potential must be acknowledged
The sector’s contribution must be seen within the context of its overall contribution (via the use of
its products within supply chains) to reducing emissions. It is important, therefore, to examine
how society uses and values the goods and commodities produced by the industry. In some cases
carbon-intensive chemical production may be instrumental in achieving reductions in energy
demand and it is important that the contribution of the UK chemical industry to achieving wider
7spread reductions is recognised. There is also increased interest in industrial symbiosis and
decentralised use of energy, heat and fuel as a practical way forward to increase energy efficiency
and minimise waste. However, industry is unwilling to be dependent on one another, due to
instabilities in the UK market. The industries and potential synergies exist to reuse, for example,
surplus heat and steam, but there are limited incentives and no supporting infrastructure (e.g.
heat networks). See section 7.1.2
Industry perceives that UK investment is stalling and the low-carbon agenda is not helping
Industry argues that there is lot of uncertainty in the UK chemical industry surrounding the low-
carbon agenda. Industrial stakeholders are concerned how a future carbon price could affect
investment in the UK and how energy prices are going to be further impacted by the low-carbon
agenda at an EU level. When comparing UK policy to the EU, industrial stakeholders are concerned
at the UK’s rate of progress and feel that the more stringent carbon-related policy is handicapping
the industry. Industrialists want a level playing field for the UK (in Europe). See section 7.2
Fossil fuels are too valuable to burn
Fossil fuel hydrocarbons are the primary feedstock for the chemical industry and it could be
argued that their value as a fixed source of carbon is much greater than their energetic value,
particularly when renewable wind, wave and solar energy could help decarbonise the energy
sector. However, options for decarbonised chemical feedstocks are much more limited and costly.
Decisions about whether our limited use of fossil fuel emissions associated with a carbon budget
should be used for the chemical industry, the transport sector (particularly aviation) or other
applications are determined by the complex interplay of legislative, policy and market conditions.
To date there have been few policy initiatives which have recognised the unique challenges and
potential contributions from this sector – some prioritisation seems likely to be required if the UK
is to achieve its carbon reduction targets and retain its valuable and strategic chemical industry.
Whilst industry can make compelling arguments why it should continue to use fossil fuel as a
feedstock, if the UK were to pursue this strategy it would have to be viewed in the wider context
of the UK’s climate agenda and the ability of the UK to decarbonise by at least 80% by 2050.
See section 7.2.2
81. Introduction
Within the UK, the chemical industry plays an important role in the economy, as a major exporter
and as a major employer. However, it also faces challenges associated with rising raw material and
fossil fuel costs which, when combined with the changing demographics of global demand for
chemicals, puts increasing pressure on the UK to remain competitive. Implementing climate
change targets is likely to put further constraints on the industry’s ability to respond to change.
The UK Government plans to reduce the UK’s global greenhouse gas emissions by 80% by 2050
from 1990 levels through the legally binding 2008 Climate Change Act. There is also an interim
target of a 34% reduction by 2020. Therefore, the chemical industry is being asked to significantly
mitigate its emissions, focusing on the more sustainable production of key and high-emitting
commodities and continuing its drive for efficiency and emissions reduction. The industry has a
unique role to play in that it can contribute to the emission reductions in other sectors through
the properties of its products. The challenge, therefore, is how can the sector reduce its own
emissions, yet still remain competitive in the global market and sustain its contribution to the UK
economy?
Reducing greenhouse gas emissions from the chemical industry is challenging for a combination of
reasons: its fundamental role in society, as a producer of intermediate and end-use consumer
goods and commodities; its globalised nature and relationship with the global economy; the use of
fossil fuels for feedstocks (i.e. as a source of carbon or hydrogen) in addition to energy generation;
the emissions of considerable amounts of N2O, as well as CO2; and the need to control other
environmental impacts. However, if governments are to take forward the scientific evidence
underlining the global 2°C temperature target, as laid out in the 2009 Copenhagen Accord [1],
then all greenhouse gas-emitting sectors will need to significantly reduce their emissions in the
coming decades. Furthermore, the long-lived nature of CO2 in the atmosphere (~100 years),
means that it is the cumulative emissions released over time which are important. Therefore, if
global emissions fail to peak in the short-term, then considerably higher emission reductions per
annum will be required in the long-term [2].
This report presents a market assessment of the UK’s chemical industry to establish an improved
understanding of the carbon intensity of chemical production processes, and to provide a climate
change framing for the challenges which the sector faces. Practical measures to reduce overall
greenhouse gas emissions are identified (including barriers and opportunities) and the report
explores the global climate impacts of the relocation of the chemical industry from the UK to the
US, Middle East and Far East, as a result of current and future climate policy. Finally, using input
from a stakeholder workshop, the likely challenges and opportunities for the industry’s
competitiveness and subsequent ability to reduce its emissions are discussed.
92. Performance of the UK chemical industry
2.1 Segments of the chemical industry
The chemical industry is a very diverse sector, with a wide range of processes and products which
are highly interlinked (see Figure 1). The products include basic organic (e.g. olefins, aromatics,
plastic materials) and basic inorganic chemicals (e.g. hydrogen, chlorine, inorganic acids, gases)
which are produced from raw materials (e.g. oil, gas, metals, minerals). These basic chemicals are
then used as the building blocks for more refined or upgraded chemical products, such as
commodity and speciality chemicals (e.g. plastics, rubbers, fibres, paints, solvents and fertilisers);
or consumer products (e.g. pharmaceuticals, cosmetics and food ingredients) [3]. Moreover, the
industry supplies basic chemicals to other industries for their processes and products. Given this
role in society, the chemical industry becomes a complex and multi-tiered system, supplying many
downstream processes and products and having a large variety of users and end-consumers.
Figure 1. Segments of the chemical industry [4]
10Data availability and consistency
The chemical industry is a very diverse sector, which includes many different supply chains
and the production of a large variety of products. Even though, in many cases, the chemical
industry is grouped according to Standard Industrial Classification (SIC) systems, there exist
many different statistics in the literature. Therefore, data is not always consistent.
Different organisations segregate the chemical industry differently, for example including and
excluding segments and subgroups. As a result, there is inconsistent data and numerical
variations between organisations.
Therefore, this report focuses on the analysis and evaluation of trends and not on single
numbers.
In terms of the value of sales, basic organic chemicals (based on petroleum processes and coal or
gas synthesis) account for the major share of chemicals produced. In 2010, UK producers had a
market share of 39% in the UK. However, this has reduced significantly from about 50% [5, 6]
before 2008, most likely due to the economic crisis and global competition. This reduction can be
seen as one characteristic of the challenges for the chemical industry and will be discussed in the
course of this report.
Another important segment is pharmaceuticals, which contribute significantly to the revenues of
the chemical industry, in addition to playing an important role in UK trade [6]. The size of the
different segments, and the segments deriving from basic chemicals, are illustrated in Figure 2
(below) and Table 1 (overleaf).
Figure 2. Chemical industry segments as share of production value in 2010, derived from [6]
Man-made
fibres
Agrochemicals
Others
Primary
Soap, detergents, etc.
plastics
Perfumes and toilet Inorganic
preparations basic chemicals
Basic
chemicals
Paints, coating
Organic Fertilisers,
basic chemicals nitrogen comp.,
primary rubber
Pharmaceuticals Dyes, Industry
pigments gases
11Table 1. Chemical sales by segments, derived from [6]
Sales chemical industry in 2010 £m
Sales basic chemicals 2010 by different
Basic chemicals 21,464 product group
£m
Pharmaceuticals 18,873 Organic basic chemicals 10,082
Paints, coating 3,537 Primary plastics 4,802
Perfumes and toilet preparations 2,065 Inorganic basic chemicals 2,030
Soap, detergents, cleaning products 1,451 Fertilisers and nitrogen compounds n/a
Agrochemicals 739 Industry gases 1,185
Man-made fibres 504 Dyes and pigments 1,161
Others 6281 Primary rubber n/a
Chemical industry total 54,914
2.2 Performance of the chemical industry
In 2010, chemical products had a global revenue of about £2,610 billion 1 [7, 8]. By region, Asia
generates about 49% of global sales, followed by the EU with 25% (£407 billion) and North
America with 20%. China and USA are by far the major producing countries with about 22.1% and
18.6% of global sales respectively, followed by Japan and Germany with approximately 6% each [5,
8, 9]. The share of the UK’s chemical industry in 2010 was in the region of £55 billion. This is about
2% of global revenue (13% of EU), which makes the UK the fourth largest producer of chemicals
within the EU after Germany, France and Italy [5-7, 9].
Within the UK, the chemical industry is one of the largest manufacturing industries2 with
approximately a 16% share of UK manufacturer sales [10, 11]. The contribution to the UK’s GDP is
about 1.4% [12]. National GDP and chemical industry revenues display significant correlation, but
the amplitude of chemical sales is larger, as shown in Figure 3. This is partially explained by the
tight integration of the chemical industry with other sectors of the economy and the dependence
on their performance.
1
Exchange rate on 16 June 2010: Euro to British Pound 0.8304.
2
Other major manufacturing industries are: food production, motor vehicles, trailers and semi-trailers, machinery and
equipment and fabricated metal products.
12Figure 3. Change in GDP and chemical sales as percentages [6]
15.0
10.0
% change year-on-year
5.0
0.0
2006 2007 2008 2009 2010
-5.0
-10.0
-15.0
GDP Sales chemicals
The chemical industry’s downstream impact
Nearly every other industrial sector is somehow linked to the chemical industry, using its
products at different scales and processing levels. More than 95% of all manufactured
products in the UK contain inputs from the chemical industry [5, 6, 13].
From the industry’s perspective, approximately 36% of its output is used as inputs in other
manufacturing industries and 10% in non-manufacturing sectors [14]. According to a study by
Oxford Economics [13], the upstream chemical industry and downstream chemistry-using
sectors together contribute 21% of GDP and employ over six million people along the different
supply chains.
13Figure 4. Direct contribution of chemistry to downstream industries, derived from [12]
Aerospace
Water Automotive
Construction
Textiles & materials
Electronics
Printing
Chemical industry's
downstream impact
Printing GDP £222 billion Energy
18% of GDP
5.2 million jobs
Packaging Extraction
Home & Farming
personal care
Health Food & drink
Forestry &
paper
2.3 Impact of the economic downturn
The interdependencies of the chemical industry with the other sectors resulted in it being strongly
affected by the economic crisis. A downturn in demand led to a reduction in sales for the industry
[6, 8, 13]. Up until 2008, the chemical sector was booming, but with the economic crisis in 2008
and 2009 the industry saw a significant reduction in sales of 9.1 and 12.4% respectively [6] (see
Figure 3). In the course of 2010 and 2011 the sector saw growth to slightly above 2008 levels with
a turnover of £58 billion [6]. However, this decreased again in 2012 by about 6% [10].
While the basic chemicals segment is still struggling to regain similar growth levels to those of
2006, the pharmaceuticals, perfume and toilet products, and agrochemicals have continued to
grow (Figure 5). The pharmaceutical segment is the only segment which has shown almost
continuous growth since 2006, and is the segment contributing most to UK trade surplus [6, 12,
13, 15].
14Figure 5. UK chemical industry market – total sales trend and sales of basic chemicals and
pharmaceutics in £m from 2006-2011 [6]
70,000
60,000
Sales of basic chemicals and pharmaceutics and total
50,000
40,000
chemicals in £m
30,000
20,000
10,000
0
2006 2007 2008 2009 2010 2011
Total chemical sales Basic chemicals Pharmaceuticals
2.4 Exports of UK trade
The chemical industry is one of the largest exporting sectors in the UK and the largest
manufacturing one, accounting for 18.7% of all UK exports [13, 16]. The chemical industry trade
surplus was about £6,740 million in 2010 [5] larger than any other manufacture, with automotive
having only moved into a small surplus in 2012. With an export value of £29,269 million for
chemicals and £23,474 million for pharmaceuticals, the UK contributes 5.1% of global chemical
exports and 7.4% to the global pharmaceutical exports [17].
The main share of exports comes from pharmaceutical products, which account for 47.3% of the
UK’s exports from the chemical industry. While the surplus of the total chemical industry did not
change significantly between 2006 and 2010 (apart from 2009), the pharmaceutical segment
showed a rapidly growing surplus over this period (see Table 2 and Figure 6). In terms of trade
surplus, the pharmaceutical segment is ranked in third place in the UK industry behind finance and
business services [12, 13].
15Table 2. UK trade chemical industry 2006-2010 [5, 6, 18, 19]
2006 2007 2008 2009 2010 2011
(£m) (£m) (£m) (£m) (£m) (£m)
Export chemicals (excl. 21,400 23,200 25,515 25,511 27,299 29,269
pharmaceuticals)
Imports chemicals (excl. 19,932 21,364 24,510 23,082 26,484 29,283
pharmaceuticals)
Export pharmaceuticals 15,488 14,973 17,895 21,139 23,199 23,474
Import pharmaceuticals 10,374 11,266 11,742 13,917 16,231 17,442
Total UK exports 245,254 220,761 247,999 226,031 263,369 294,257
Total UK imports 326,296 314,306 343,656 310,428 363,929 395,430
The UK trade patterns for the chemical industry are outlined in Figure 6 and the overall trade
balance of total UK trade is shown in Figure 7. Even though the export value of the chemical
industry (excluding pharmaceuticals) is continuously growing (dark blue columns in Figure 6), the
surplus from chemicals is fluctuating year by year (Figure 7). The value of pharmaceuticals is
continuously growing (dark red columns in Figure 6) as well as the surplus (Figure 7). The trade
surplus, mainly generated from pharmaceuticals, makes the chemical industry one of the few
sectors with a positive trade balance in the UK.
Figure 6. UK trade (import and export) chemical industry
35,000 450,000
400,000
30,000
350,000
25,000
300,000
Total UK exports in £m
Export & import in £m
20,000 250,000
15,000 200,000
150,000
10,000
100,000
5,000
50,000
0 0
2006 2007 2008 2009 2010 2011
Export chemicals (excl. pharmac.) Imports chemicals (excl. pharmac.)
Export pharmaceuticals Import pharmaceuticals
Total UK exports Total UK imports
16Figure 7. Trade balance of UK chemical industry and total trade
10,000
5,000
0
-5,000 2006 2007 2008 2009 2010 2011
-10,000
-15,000
-20,000
-25,000
-30,000
UK trade balance in £m
-35,000
-40,000
-45,000
-50,000
-55,000
-60,000
-65,000
-70,000
-75,000
-80,000
-85,000
-90,000
-95,000
-100,000
Chemicals (excl. pharmac.) Pharmaceuticals UK total
2.5 Labour force
In 2010, about 282,000 people were employed in the chemical industry (including rubber and
plastic production and pharmaceuticals) [20]. This means that 4.8% of the 5.8 million UK’s
industrial sector employees3 work in the chemical sector [19]. More than one-third of the
employees are working in the basic chemical segment, which, as already shown, is also generating
a major share of the revenues. Nonetheless, the biggest labour force is found in the plastic and
rubber division with about 140,000 employees [20].
Indirectly, the chemical industry leads to further employment in the downstream sectors and
supply chains which are supported by the sector in a ratio of 1:2 (1 employee in the chemical
industry leads to 2 employees downstream) [13]. Other work suggests much higher factors up to
1:10 and the UK government accepts a ratio of 1:4 as being closest to the truth [21, 22].
Additionally, the average income in the chemical sector is about 30% above the national average
[13] and GVA/head in the sector at £92kpa (source CIA) is amongst the highest in the UK [22].
3
Total UK employment 31.72 million (2011 est.), UK industry: 18.2% = 5.8 million (19).
172.6 Outlook
The chemical industry is a steadily growing sector. Even though there have been reductions in
output the global chemical industry is projected to keep growing until 2030. It has been estimated
that the global turnover of the sector will double by 2030 compared to 2010 [8]. The global
average growth rate is projected to be approximately 5% p.a. [8, 15, 23]; while the average growth
in Europe and North America is expected to be lower at 2-3% p.a., in Asia it is 5-7% p.a. [8, 24].
Nonetheless, plastics and health products are projected to grow above the global average [8, 15,
23].
The production of basic chemicals in the Middle East is anticipated to grow at 6-9% p.a. until 2020
[24-26], due to the availability of low-cost feedstock. In China, a growth rate of 9-10% p.a. [24] is
anticipated, linked with strong economic growth which would result in a high demand for basic
chemicals, and primary rubber and plastics for downstream industries [27].
It is projected that by 2020 more than 50% of the global chemical production will take place
outside developed countries [24]. This could mean a decrease in exports of basic chemicals from
Europe. Nonetheless, the production of basic chemicals such as ethylene, propylene, butadiene,
toluene and methanol is likely to increase up to 3% p.a. in Europe (compared to a global average
of about 5% p.a.) over the coming years [26, 28, 29].
In the UK, population growth, an ageing population, GDP improvements, a growing export market,
and demand increase from downstream industries [6] is projected to increase sales from the UK
chemical industry by 3.5 to 4% p.a. until 2016 [6].
The significance of the chemical industry for the UK
The chemical industry is a significant contributor to the UK’s economy, in particular the
production of basic chemicals and pharmaceuticals. It supplies commodities and goods to
many downstream sectors and industries and is a major employer; furthermore, it is one of
the few industries which are a net exporter. However, the sector is very much dependent on
the overall economic outlook and has therefore fluctuated with the global drop in demand.
Despite positive growth forecasts, UK chemical production is having to compete with
expanding production in the Middle East, Far East and the USA with its recent energy cost
reductions, which is discussed in section 5.
3. Energy use and emissions from the chemical industry
3.1 Energy use
The chemical industry is one of the most energy-intensive sectors in the UK. It consumes about
22% of total UK industrial energy and accounts for 1-4% of total UK energy use [4, 30]. In addition
18to grid electricity, it directly uses fossil fuels for heating, cooling, pumping and other processes.
Furthermore, fossil fuels are required as a chemical feedstock. Currently, it is highly dependent on
natural gas and petroleum as the main energy sources [4]. With about £4 billion p.a. directly spent
on energy it is, for many producers, the major cost factor and makes up approximately 30% of
their total costs [4, 30, 31]. Nonetheless, about 8% of the energy is generated onsite by industry
itself through combined heat and power (CHP) [4].
It has been estimated by the Chemical Industries Association that the UK chemical industry could
improve its energy efficiency of processes by about 35% compared to 1990 levels [4, 9, 30, 31].
The main drivers to increase energy efficiency are fuel costs and international competition, but
climate change targets also play a role. The latter are outlined in section 4. Nonetheless, the
competitiveness of the chemical sector is very sensitive to volatile energy prices; consequently,
the increasing dependence on gas imports is a major concern for the chemical industry in the UK
[30].
Exploring global regions, the main feedstock used is strongly related to availability and location.
While OECD nations mainly use petroleum and gas, China and other non-OECD regions use large
shares of coal for energy use, whilst the Middle East relies on petroleum [32, 33]. One major
change in energy and feedstock use in recent years is that shale gas is now playing an increasingly
major role in the chemical industry, leading to a decoupling of gas and oil prices [33-35]. This is
resulting in the provision of low-cost gas as an energy and feedstock source, especially in the USA
[34, 36-38], which in turn is exporting unused coal to Asia and the EU [39]. China, which is
estimated to have the world’s largest shale gas resources, could in the near future exploit this fuel
source and increase its cost competitiveness significantly [34, 36-39]. Nonetheless, the chemical
industry in China is still heavily based on coal [40].
Looking ahead, while high oil prices are likely to continue, this will be a major challenge for the
chemical industry in Europe. Furthermore, the global energy market is entering a transition phase
with the exploitation of relatively cheap shale gas. As a result, the USA, an early adopter of shale
gas, could have a market advantage in producing basic chemicals derived from natural gas [29].
This is discussed more section 5.
3.2 Breakdown of feedstock and raw material use
Basic chemicals, which make up about 40-50% of the volume of produced chemicals, account for
the largest use of raw materials such as oil, gases, metals, minerals and water; this is in addition to
energy demand for the intensive steam cracking processes. For basic organic chemicals,
condensates from crude oil and natural gas (e.g. naphtha) are used as feedstocks, while for
inorganic basic chemicals metals, minerals and gases are the major raw materials. In terms of
feedstocks globally, naphtha is the dominant raw material for basic chemicals and is projected to
stay so. Currently, 51% of the global feedstock are naphtha, 14% methane, 11% coal [33].
19However, despite their high demand for raw materials and energy, basic chemicals are an integral
part of the supply chains for most other chemicals and downstream sectors (see Figure 1). For
example, ethylene is the basis for the production of many other chemicals and products and is the
most significant chemical in terms of volume and value; yet, it is also one of the most energy-
intensive products.
3.3 Emissions trends for the EU’s chemical industry
Being a major user of raw materials and non-renewable resources for energy consumption and
feedstock, the chemical industry releases significant amounts of greenhouse gases. The emissions
can be split into three categories: direct emissions from energy use on-site, i.e. fossil fuel
combustion and heat generation; indirect emissions from energy use, i.e. purchased electricity;
and process emissions [4, 21, 31, 32].
Despite intensive energy use, between 1990 and 2010 the EU’s chemical industry (including
pharmaceuticals) emissions reduced from 330.4 Mt CO2e to 165.8 Mt CO2e [9], as shown in Figure
8. This is approximately a 50% reduction. At the same time, production increased by 70% [9]. This
has been achieved mainly through efficiency improvements and recycling processes [9]. But it is
perhaps also partially due to increasing production of less emission-intense and high-value
products (e.g. pharmaceuticals), and reduced production (largely by a reduction in demand) of
emission-intense chemicals (e.g. basic chemicals).
Figure 8. Greenhouse gas emissions released by the EU’s chemical industry, derived from [9]
350
300
250
Mt CO2e
200
150
100
50
0
1990 1994 1998 2002 2006 2010
Year
203.4 Emissions trends for the UK’s chemical industry
In 2009, the UK emitted 560 Mt CO2e in total for all sectors, of which 84% was in the form of CO2,
7% as CH4, 6% as N2O and 2.6% as F-gases [41]. The industrial sector, including the chemical
industry, contributed 131.6 MtCO2e (~23%) of these total greenhouse gas emissions, as shown in
Figure 9; of which over 80% occurred from generating heat [41]. Between 1990 and 2009, the UK’s
total emissions decreased by 24%. From a climate change perspective, note that this reduction is
an important step towards meeting its legally binding interim target of a 34% reduction by 2020.
Targets are discussed further in section 4.
Figure 9. Proportion of UK emissions from different sectors in 2009 by source, derived from [41]
Agriculture Waste 3%
and land
use 9%
Electricity
generation
Transport 26%
22%
Industry
Buildings 23%
17%
The importance of indirect energy use
Emissions from the chemical industry occur from three different sources: direct and indirect
energy use, and processes. While the direct energy use and process emissions are well
documented, indirect emissions are more uncertain in databases and the wider literature.
Nonetheless, in 2005, the UK’s indirect energy use in the chemical industry was 12.04 MtCO2e
from the use of 23.16 MWh electricity [36]. Emissions from direct energy use were 9.60
MtCO2e, and from processes 6.15 MtCO2e, in 2005 [3]. Under the United Nations Framework
Convention on Climate Change (UNFCCC) producer-based reporting, indirect emissions are
included under electricity production, and are reported as occurring outside the chemical
sector.
Research by the International Council of Chemical Associations (ICCA) [36] showed that about
one-third of the total production emissions of chemicals produced in the EU occur from
indirect energy use. This should be taken into account when evaluating the chemical
21industry’s emissions. However, this share is likely to vary between EU nations and segments.
Such emissions will also depend on the carbon intensity of the electricity source and the type
of feedstock and energy source the production site is based on. Even though there may be
more leverage for the chemical industry to decarbonise direct and process emissions, indirect
emissions should not be overlooked.
There are systems level implications surrounding current accounting frameworks and where
responsibility lies to reduce emissions, which could result in unintended consequences. There
is a range of future scenarios in the literature which assumes that energy-intensive industries
could be powered to some degree by low-carbon electricity sources [39, 40], and in turn this
would place a larger demand on the grid and its associated infrastructure.
3.4.1 Direct energy use emissions
The main form of direct combustion of fuels for energy use in the UK chemical industry is gaseous
fuels, with much smaller amounts of solid and liquid fuels (see Table 3). The major share of
emissions is CO2. The total greenhouse gas emissions from direct energy use in the UK chemical
industry between 1990 and 2010 are shown in 0. It shows that the emissions have reduced by 38%
- from 12.6 Mt CO2e to 7.8 Mt CO2e [42].
Table 3. Greenhouse gas emissions from direct energy use for the UK chemical industry, derived
from [42]
Total
Implied Emission Factor Emission by GHG emissions
emissions
Fuels for
Consumption CO2 CH4 N2O
direct CO2 (Gg) CH4 (Gg) N2O (Gg) CO2e (Gg)
(TJ) (t/TJ) (kg/TJ) (kg/TJ)
energy use
Liquid fuels 2,632.28 78.08 2.11 0.63 205.53 0.01 0.00 206.16
Solid fuels 9,582.39 91.58 0.42 8.14 877.52 0.00 0.08 900.87
Gaseous
117,603.50 56.84 5.56 0.11 6,684.62 0.65 0.01 6,704.84
fuels
Total fuel
129,818.18 7,767.67 0.66 0.09 7,811.88
use
22Figure 10. Trends for total greenhouse gas emissions from direct energy use (Mt CO2e), derived
from [42]
16
Others
14
CO2
12
10
Mt CO2e
8
6
4
2
0
1991
1992
1993
1994
1996
1997
1998
1999
2000
2001
2002
2003
2004
2005
2006
2007
2008
2009
2010
1990
1995
Year
3.4.2 Process emissions
The process emissions, as shown in Figure 11, are much more diverse than emissions from direct
energy use, as different production streams, supply chains and chemicals have different
characteristics, emission factors and emit different greenhouse gases. CO2 emissions from
producing ethylene and ammonia [42] make up the vast majority. N2O emissions are mainly a
result of producing ammonia, nitric acid and adipic acid [42]. In 2010, in total, 4.3 Mt CO2e were
emitted, which is about 16.2% of the total process emissions of the UK manufacturing industry
[42].
Figure 11 illustrates the trend of process emissions between 1990 and 2010. The figure illustrates
several sharp emission reductions, notably a dip between 1998 and 1999 when the UK production
of adipic acid was dramatically reduced through plant closure.
In total, the process emissions have reduced by 84% between 1990 and 2010 and are the main
contributor to the overall emission reduction of the UK chemical industry [42]. To summarise,
whilst CO2 emissions have reduced by 1.5% during this time (from 2.99 Mt CO2e to 2,95 Mt CO2e),
CH4 has reduced by 56% (from 0.17 Mt CO2e to 0.07 Mt CO2e) and N2O by 95% (from 24.64 Mt
CO2e to 1.32 Mt CO2e) [42].
23Figure 11. Total greenhouse gas emissions from processes (Mt CO2e), derived from [42]
30
Other
25 Nitric acid production
20 Ammonia production
Adipic acid production
Mt CO2e
15
10
5
0
1991
1992
1993
1994
1995
1996
1997
1998
1999
2000
2002
2003
2004
2005
2006
2007
2008
2009
2010
1990
2001
Year
3.4.3 Total greenhouse gas emissions
Figure 12 collates the Figure 11’s numbers to show the emission trends from direct energy use and
processes of the UK’s chemical industry from 1990 to 2010. In 2010, the UK chemical industry
emitted 12.15 MtCO2e, down from 40.48 MtCO2e in 1990. 7.8 MtCO2e was from direct energy use
and 4.34 MtCO2e from processes [42]. During this period, the sector’s emissions have reduced by
70% [42]. Even though there are significant reductions, they are not based solely on efficiency
improvements and the reduction of emission intensity, but are also due to significant production
cuts or even shutdowns within the UK.
Figure 12. Total greenhouse gas emissions from the UK chemical industry (direct energy use and
processes) (Mt CO2e), derived from [42]
45
40
35
30
25
Mt CO2e
20
15 12.15
10
5
0
1991
1992
1993
1994
1996
1997
1998
1999
2001
2002
2003
2004
2006
2007
2008
2009
1990
1995
2000
2005
2010
Year
243.4.4 Greenhouse gas emissions by type and source
In terms of targeting mitigation potential within the sector, Figures 10-12 have so far outlined the
split between, and trends for, the different types of emissions (energy use and processes)
occurring in UK chemical plants. Figure 13 summarises the type and source (direct energy use or
processes) of greenhouse gas. It underlines that the majority of emissions are CO 2 from direct
energy use. The major share of N2O emissions are from processes.
Figure 13. Total direct greenhouse gas emissions by type of greenhouse gas and source, derived
from [42]
0.6%
0.2% 0.1%
CO2 processes
CO2 energy
N2O processes
10.8%
N2O energy
24.3%
CH4 processes
CH4 energy
63.9%
3.4.5 Relating global production to emissions
Table 4 shows the emission factor and volume of global production for different major chemicals,
and their resultant total global emissions in 2005. Even though HCFC-22 and adipic acid have the
highest emission factors, the majority of total process emissions are from basic chemicals, such as
ammonia, ethylene and nitric acid. As these are used to produce other chemicals and products,
they play an important role in mitigation. Lowering their emission intensity would provide
significant emission reduction potential for overall global emissions.
It is worth noting that the chemical commodities in Table 4 (overleaf) require a range of fossil fuels
and raw materials to produce them, which also have varying emission factors and subsequent
impacts on the climate and wider environment. In terms of emissions reduction, there are avenues
to explore regarding fuel switching, from a more carbon-intensive to a less carbon-intensive fuel.
However, this is likely to be most relevant for nations which are heavily dependent on more
carbon intensive coal, such as China.
25You can also read


