European and Central Asian Actions on Air Quality - A regional summary of emission trends, policies, and programs to reduce air pollution - IVL ...
←
→
Page content transcription
If your browser does not render page correctly, please read the page content below
Nr C 598
                                                                        September
                                                                             2021

European and Central Asian
Actions on Air Quality
A regional summary of emission trends,
policies, and programs to reduce air
pollution

Stefan Åström, Lovisa Källmark, Katarina Yaramenka, Peringe Grennfelt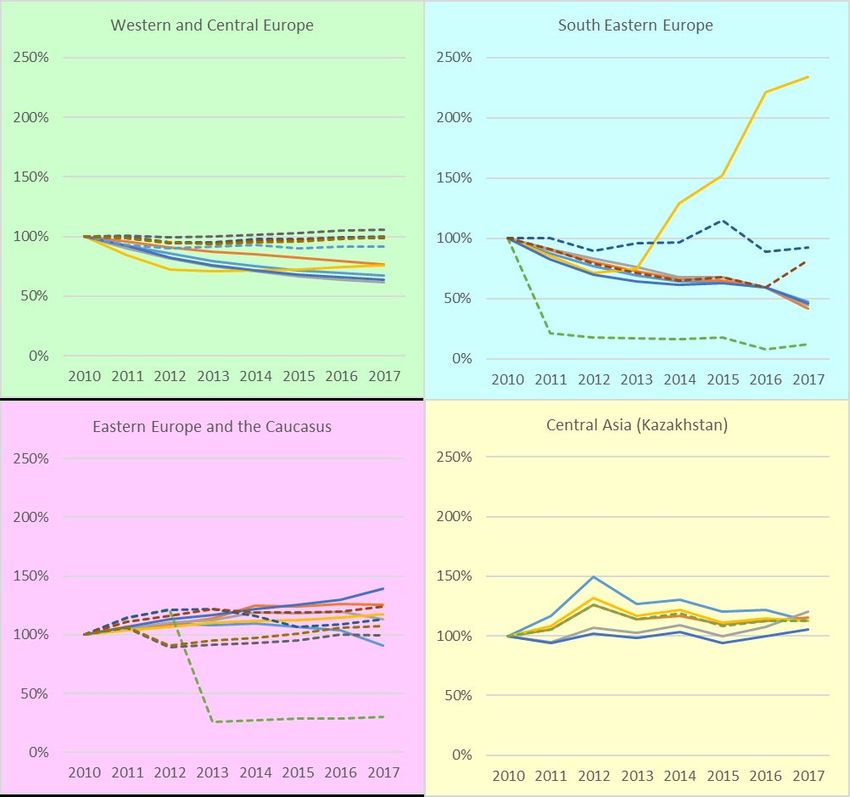
Author: Stefan Åström, Lovisa Källmark, Katarina Yaramenka, Peringe Grennfelt
Funded by: UNEP
Report number C598 , September 2021
ISBN 978-91-7883-300-9
Edition Only available as PDF for individual printing

© IVL Swedish Environmental Research Institute 2021
IVL Swedish Environmental Research Institute Ltd.
P.O Box 210 60, S-100 31 Stockholm, Sweden
Phone +46-(0)10-7886500 // www.ivl.se

This report has been reviewed and approved in accordance with IVL's audited and approved
management system.
Report C598 European and Central Asian Actions on Air Quality – A regional summary of emission trends,
policies, and programs to reduce air pollution
Executive Summary
The challenge with air pollution
Air pollution is the single greatest environmental risk factor for premature death globally. In
response to the global threat from air pollution, the United Nations Environment Programme have
since 2014 increased its engagement in air quality issues. One of the UNEP engagements on air
quality is to make a re-occurring global summary of the air quality problem, its trends, and policies
and instruments implemented to reduce it. The first global summary was published in 2016 and the
second global summary is published in Autumn 2021. In support of the global summary, there are
six regional reports (Africa, Asia-Pacific, Europe, Latin America, North America, and West Asia).
The purpose with the current European and Central Asian report is to provide detailed information
on emission trends and European actions on air quality during 2016-2020, thereby providing detailed
information in support to the second UNEP global summary of policies and programmes to reduce
air pollution. The pollutants in focus for the report are sulphur dioxide, nitrogen oxides, non-
methane volatile organic compounds, ammonia, and fine particulate matter (PM2.5). To a minor
extent the report also presents an update on trends and policies for emissions of arsenic, cadmium,
lead, and mercury.
Even though air pollution problems are more severe in other regions they still cause problems in the
pan-European region, despite much progress since the peak pollution years of the 1970-ies and 1980-
ies. In 2018, some 417,000 premature fatalities per year occurred in Europe due to fine particulate
matter in ambient air (European Environmental Agency 2020). Over the last winters, some cities in
South Eastern Europe even experienced the worst air quality in the world. 1
Key sources of air pollutants in Europe
Thanks to the continued strengthening of policies developed under the UNECE Convention on
Long-range Transboundary Air Pollution (in this report called the Air Convention), EU policies and
legislation and national legislations, emissions of most monitored air pollutants have decreased.
Since 2010, this trend has continued in Western, Central, Eastern and South Eastern Europe.
Emissions are however increasing in Central Asian countries. Looking at the entire European and
Central Asian region covered in this report, there is one pollutant that stands out: ammonia.
Ammonia emissions have in all sub-regions increased during 2010-2017, and there is no sign of
decline.
If focusing on emitting sectors instead of sub-regions, large combustion plants are the largest
polluters of sulphur dioxide and heavy metals, road transport is responsible for most of the nitrogen
oxides and carbon monoxide, whilst residential heating causes the highest emissions of fine
particulate matter. Not surprisingly, agriculture is almost solely responsible for emissions of
ammonia.
Actions taken in Europe
Several actions are taken in European countries to further improve air quality, and since 2016 there
are several indications that efforts are increasing. In 2020 at least 46 of 54 surveyed countries have
national air quality standards. Out of the survey respondents, one country has newly implemented
1 https://rs.n1info.com/english/news/a582617-air-visual-belgrade-most-polluted-world-city/
3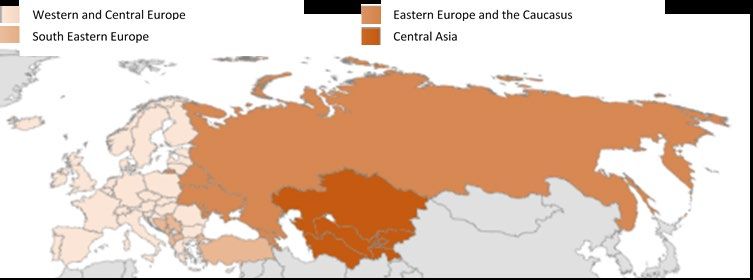
Report C598 European and Central Asian Actions on Air Quality – A regional summary of emission trends,
policies, and programs to reduce air pollution
standards since 2016. There are somewhat fewer countries with direct air quality management
strategies (42 countries).
If considering actions aimed at industrial sources, it can be seen that 76% of the 29 respondents have
clean production incentives in 2020. At least two countries have started to implement clean
production incentives since 2016. For transport sources, at least 43 countries mandate specific vehicle
emission standards for newly sold vehicles. Out of these, one country did not report mandatory
emission standards in 2016. Four countries have put in place more strict mandates since 2016, and
all respondents now report having at least Euro 4 (or equivalent) vehicle emission standards. Other
measures that are commonly implemented the last five years include promotion of electric mobility
and increased efforts on vehicle inspection and maintenance programmes. 38 of the surveyed
countries are regulating solid waste burning, out of which 6 have enforced stricter regulations the
last five years. Turning the attention to residential cooking and heating the survey indicates that 70%
of the respondents have national programmes promoting use of clean energy for cooking and
heating, a rate that is the same as in 2016. The most common focus in these programmes is on
increased energy efficiency in buildings.
Conclusions
There are large variations with respect to how engaged countries are in their efforts to improve air
quality. The EU member states and Norway, UK and Switzerland, with the largest past emission
reductions, are also those with well-developed air quality monitoring and assessment infrastructure.
In addition, these countries report the largest portfolio of further actions to reduce emissions in a
cost-effective manner, including investments in energy efficiency improvements as well as in clean
technologies.
Awareness and progress in efforts to improve air quality assessment infrastructures in Eastern and
South Eastern Europe as well as Central Asia are improving, and there are several examples of
knowledge-sharing initiatives and capacity building efforts. Particularly for Eastern Europe, air
quality assessment infrastructure is now almost on par with those in Central and Western Europe.
To reduce the risk for an increasing air quality induced human health divide in the region, it is
important to ensure reliable air quality monitoring and assessment infrastructures in all countries
and to complement these with reporting of progress and establishment of prospective emission
scenarios. Many Eastern and South Eastern European countries can focus on accelerating the
introduction of low-emission road transport and on reducing emissions from residential heating. All
countries need to increase efforts to reduce emissions of ammonia.
4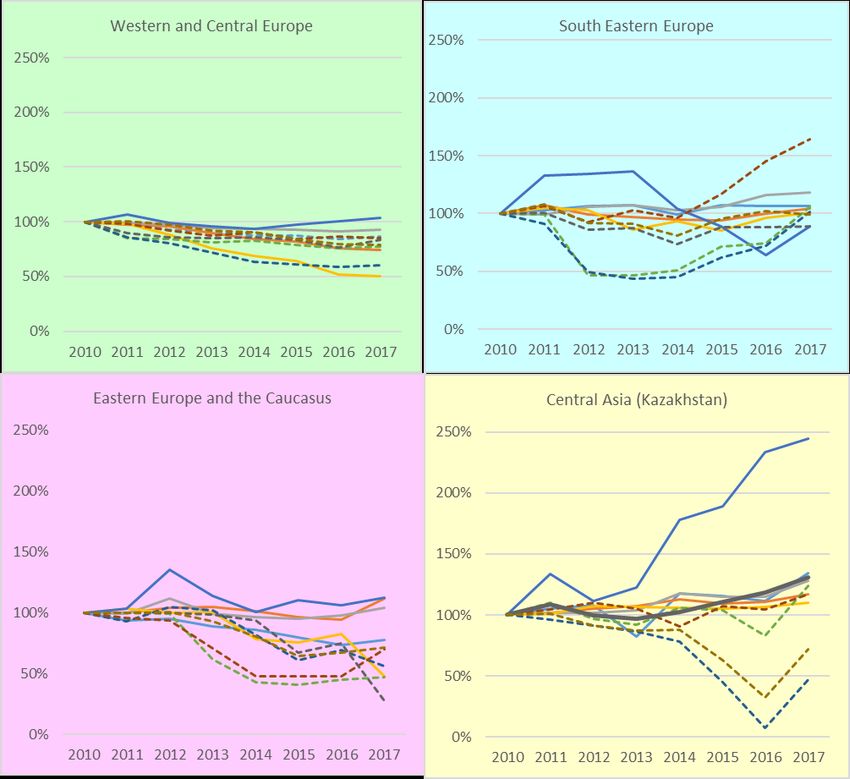
Report C598 European and Central Asian Actions on Air Quality – A regional summary of emission trends,
policies, and programs to reduce air pollution
Table of contents
Executive Summary................................................................................................................ 3
1. Introduction .................................................................................................................... 6
2. Regional Overview ............................................................................................................. 7
2.1. Background ............................................................................................................................................. 7
2.2. Countries considered in this report ...................................................................................................... 10
2.3. Emission source sectors analysed in this report ................................................................................... 11
2.4. Regional overview of air quality and trends ......................................................................................... 12
2.5. Regional overview of air pollution emissions ....................................................................................... 13
2.6. Key sectoral sources and trends in emissions of air pollutants ............................................................ 17
2.7. Macro-trends in policy formulation ...................................................................................................... 24
3. Measuring progress towards improved air quality.......................................................... 26
3.1. National air quality standards and Legislation ...................................................................................... 26
3.2. In which sectors are measures taken to improve air quality? .............................................................. 27
3.3. Lessons learnt and policy uptake .......................................................................................................... 35
4. Case studies ..................................................................................................................... 37
4.1. Case study 1 .......................................................................................................................................... 37
4.2. Case study 2 .......................................................................................................................................... 38
4.3. Case study 3 .......................................................................................................................................... 40
4.4. Case study 4 .......................................................................................................................................... 41
References ........................................................................................................................... 41
5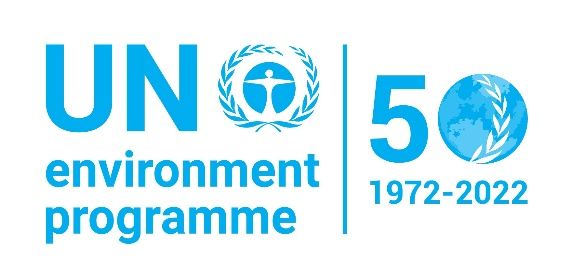
Report C598 European and Central Asian Actions on Air Quality – A regional summary of emission trends,
policies, and programs to reduce air pollution
1. Introduction
In June 2014, the United Nations Environment Assembly (UNEA) adopted resolution 1/7:
Strengthening the Role of the United Nations Environment Programme in Promoting Air Quality. This
resolution came in response to the growing global threat of air pollution. In 2017, the third session
of UNEA built on this commitment through UNEA resolution 3/8 requesting, inter alia, that United
Nations Environmental Programme (UNEP) develops an overview of the actions taken by
governments to promote better air quality. The 2016 report Actions on Air Quality (UNEP 2016)
presented results at that time in an online catalogue of 193 countries. Since then, UNEP has
developed an updated global summary of policy action using a detailed survey questionnaire of
member states and built on this work with a set of 6 regional reports (Africa, Asia and the Pacific,
Europe, Latin America and the Caribbean, North America and West Asia). These regional reports
provide more detailed information on the status of key actions being undertaken by governments
around the world to improve air quality.
For the pan-European region, the questionnaire was disseminated to 54 countries in total. 29
countries completed and three countries partially responded to the questionnaire. Due to the low
answer frequency and differences in methodology, any direct comparison with the results presented
in 2016 are made with caution. For some of the responding countries – and to enable regional
comparisons – some complementary sources were used. The graphs over the survey responses only
contain the actual responses. All methodological details of these reports are presented in Annex A
of the 2021 Global report (UNEP 2021).
This pan-European regional report on action for air quality contains an overview of how emission
trends of air pollutants have developed over the recent years. Following the introduction of the
scientific basis and state-of-play, the report presents developments in air quality legislation, policy
and action during the last five years. The report ends with presenting four case studies exemplifying
current air quality and air quality governance in the pan-European region.
The report has been written by Stefan Åström, Lovisa Källmark, Katarina Yaramenka and Peringe
Grennfelt, all at IVL Swedish Environmental Research Institute Ltd. The authors are grateful for
active engagement by the UNEP contact Tomas Marques at UNEP Europe Office, the authors of the
other UNEP regional reports, and all experts participating in the review of the draft: Kristof Doucot
(Aarhus Convention Secretariat), Christer Ågren (AirClim), Richard Ballaman (Federal Office for
the Environment FOEN, Switzerland), Yelyzaveta Rubach (Industrial Accidents Convention
Secretariat), Eli Marie Åsen (Ministry of Climate and Environment, Norway), Rob Maas (RIVM,
Netherlands), Petra Hagström (Swedish EPA), Peter Meulepas (VMM, Belgium), Victor Nthusi
(UNEP), Soraya Shmaon (UNEP), Ketevan Kordzakhia (UNECE), Krzysztof Olendrzynski
(UNECE), Carolin Sanz Noriega (UNECE), and several experts from the European Commission. All
errors are however the authors’ own.
6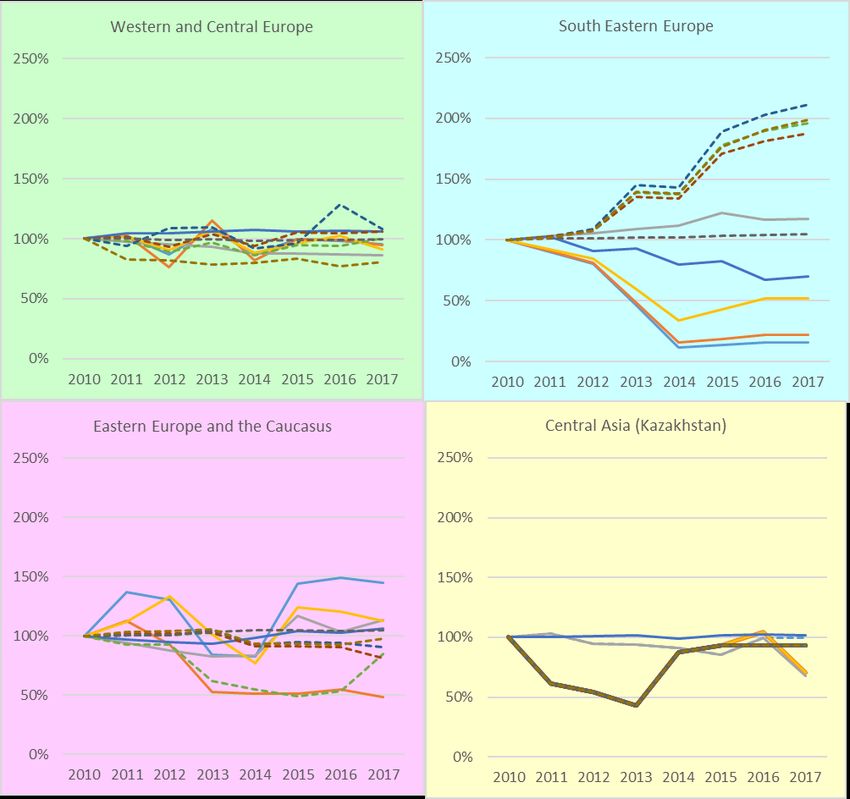
Report C598 European and Central Asian Actions on Air Quality – A regional summary of emission trends,
policies, and programs to reduce air pollution
2. Regional Overview
2.1. Background
Even though air pollution is more severe in other parts of the world it still causes problems in the
pan-European region, despite much progress since the peak pollution years of the 1970’s and 1980’s.
The World Health Organization (2014a, b) has identified that the largest health risk from
environmental causes is driven by human exposure to fine particulate matter (PM2.5) in the air.
PM2.5 in ambient air is mainly constituted of emissions of primary particles and of secondary
particles (such as ammonium nitrates and ammonium sulphates) formed in the atmosphere and
composed from emitted gases, such as non-methane volatile organic compounds (NMVOC),
nitrogen oxides (NOx), sulphur oxides (SO2), and ammonia (NH3). Human exposure to PM2.5 is
associated with premature mortality, heart- and lung related diseases, and many other illnesses
(Thurston et al. 2017). In 2018, some 417,000 premature fatalities per year occurred in Europe 2 due
to PM2.5 in ambient air, of which around 379,000 – in EU28. Premature fatalities due to exposure of
EU population to NO2 the same year is estimated at 54,000, while exposure to ground-level ozone is
estimated to have caused around 19,400 preterm fatalities (European Environment Agency 2020).
By comparison some 25,000 EU member state citizens died in traffic accidents in 2017 (European
Commission 2018). No future scenarios covering all of Europe have been reported, but the latest
projections for the EU member states is that exposure to PM2.5 in the ambient air will cause some
170,000 premature fatalities per year in 2030 in EU27 (Amann et al. 2020) – this is compared to
roughly 240,000 cases in 2020 estimated in the same source. Annual premature fatalities due to
exposure to ground-level ozone in 2030 is projected to be around 16,000. 3
Beside the effects on human health, emissions of the same air pollutants are associated with several
types of environmental effects and damage to buildings and cultural heritage. The most well
recognized non-health effects of air pollution are acidification of soils and freshwaters,
eutrophication of soils and waters, damages from tropospheric ozone to crops, and corrosion
damages to buildings and materials. In the European region, the evolution of these problems varies.
For most of these effects the problem is in decline, but for eutrophication the progress is slow and
for ozone the problem is mainly changing in nature, with a decrease in summertime peak ozone
concentrations in Europe and an increase or a stabilization of hemispheric background
concentrations (Maas and Grennfelt 2016).
In addition to these effects on air quality, emissions of several air pollutants are identified to have
short term and regionally varied impact on climate change. In general, PM2.5 as well as coarser
fractions of particulate matter contributes negatively to the radiative forcing 4 of the climate system,
while some sub-fractions of PM2.5 like black carbon (BC) as well as tropospheric ozone (affected by
emissions of NOx, NMVOC, and methane (CH4)) increase the radiative forcing.
2 EEA Europe, see the geographical coverage below
3Estimates made by Amann et al. 2020 are somewhat lower than the numbers presented in the European
Environmental Agency 2020 – this is due to methodological differences such as geographical scale and the
way PM2.5 from natural sources are taken into account (Amann et al. 2020).
4The radiative forcing of an air pollutant or greenhouse gas basically describes its impact on the climate
systems’ radiative energy balance (solar energy to earth minus heat energy from earth). Radiative forcing is
measured in watt per square meter of earth’s surface at the tropopause. Forster, P., et al. (2007). Changes in
Atmospheric Constituents and in Radiative Forcing. Climate Change 2007: The Physical Science Basis.
Contribution of Working Group I to the Fourth Assessment Report of the Intergovernmental Panel on Climate
Change. S. Solomon, D. Qin, M. Manning et al. Cambridge, United Kingdom, Cambridge University Press.
7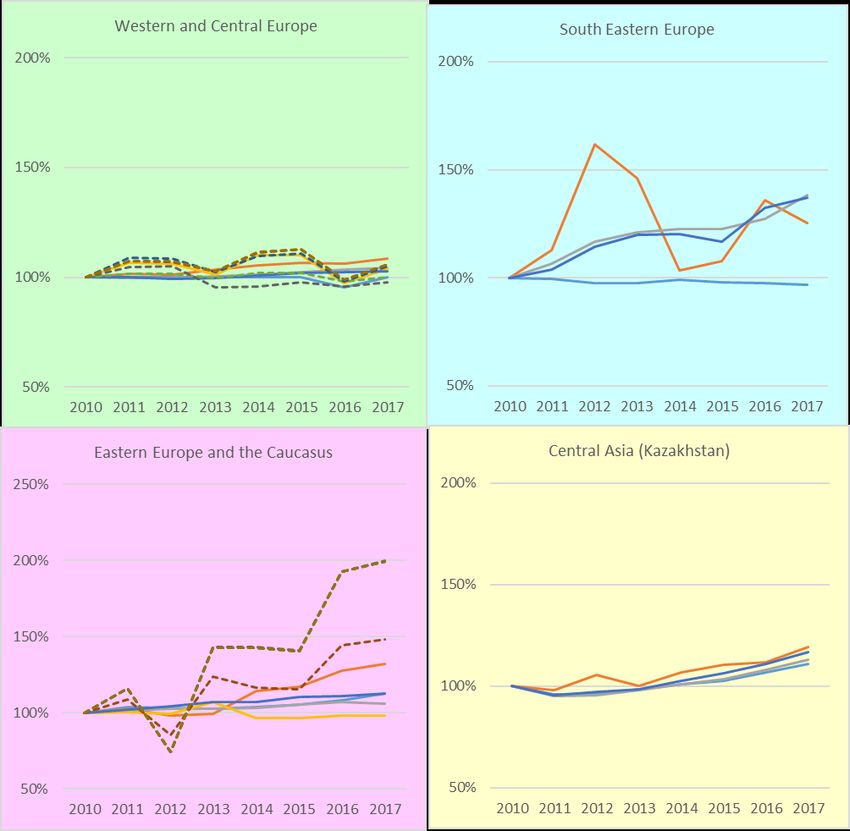
Report C598 European and Central Asian Actions on Air Quality – A regional summary of emission trends,
policies, and programs to reduce air pollution
There is no dispute on the fact that controlling carbon dioxide (CO2) emissions is the most important
policy to reduce climate change. It is however also important to consider climate effects of air
pollutants to achieve effective air quality policies that are integrated with climate change policies.
On a global scale, todays’ atmospheric concentration of particles induces cooling, and is on average
currently masking half the warming induced by anthropogenic CO2 concentrations in the
atmosphere. The global average of radiative forcing of particulates does however hide large regional
variation, and the impact of the particle components vary (Myhre et al. 2013). As an example, whilst
most particles are cooling, the global average direct radiative forcing of BC is warming the climate
half as much as current CO2 is, with indirect effects adding more unquantified warming (Bond et al.
2013, Myhre and Samset 2015). And emissions of ozone precursors, in particular methane, as well
as ozone itself also warms the climate (Myhre et al. 2013).
The air pollutant gaining most attention recently for its impact on climate change is BC. 5 Although
estimates are uncertain and dependent on when and where emissions occur, the current best
estimate is that one ton BC emissions have an impact on radiative forcing equivalent to 120-3200
tons of CO2 emissions, which might still be an underestimation (Myhre et al. 2013, Myhre and Samset
2015). Climate change impact has been identified for all the above presented air pollutants, as well
as for the effect of CH4 emissions on ozone formation (Etminan et al. 2016). Collectively, these are
therefore often termed short-lived climate forcers (SLCFs). 6 Control of SLCF emissions has been
shown to enable a reduction in the speed of global warming, contingent that CO2 emissions are
reduced (Shindell et al. 2012, Bowerman et al. 2013, Shoemaker et al. 2013). Several initiatives have
been taken to increase our understanding of the importance of the SLCFs as well as to control
emissions of those air pollutants with the largest impact on global warming. One initiative of interest
is the Climate and Clean Air Coalition (CCAC). 7 CCAC is hosted by UNEP and includes about 70
countries and many intergovernmental organizations and NGOs.
The most important international air quality policy processes in Europe are those under the United
Nations Economic Commission for Europe’s (UNECE) 1979 Air Convention, and the European
Union’s (EU) clean air policy and legislation – in particular initiatives such as the Zero Pollution
Action Plan 8 and a European Green Deal. 9 These form international and transnational agreements that
address the pollutants mentioned in this report. Since 1979, the Air Convention has implemented
eight protocols. The revised ‘Multi-Pollutant, Multi-effect’ (Gothenburg) protocol is together with
the revised HM protocol the most recent (both protocols were revised in 2012). The Gothenburg
protocol sets country-specific 2020 emission reduction targets for SO2, NOx, NH3, NMVOC, and
PM2.5.
In principle, all countries in the pan-European region are Parties to the Air Convention except Israel,
San Marino, Andorra and the Central Asian countries Tajikistan, Turkmenistan and Uzbekistan. The
Convention has throughout its entire 40 years history been a clearing house for air pollution
knowledge. Through the protocols and their amendments many countries have committed
themselves to far-reaching control measures.
5Black carbon is technically only the residual of a certain technique for measuring elemental carbon
concentration in air but has become established nomenclature for a specific carbonaceous subfraction of
PM2.5
6Other terms found in the literature are near-term climate forcers (NTCF) and short-lived climate pollutants
(SLCP).
7 https://ccacoalition.org/en
8 https://ec.europa.eu/environment/strategy/zero-pollution-action-plan_sv
9 https://ec.europa.eu/info/strategy/priorities-2019-2024/european-green-deal_en
8
Report C598 European and Central Asian Actions on Air Quality – A regional summary of emission trends,
policies, and programs to reduce air pollution
However, there are still countries in Eastern Europe, Caucasus and South Eastern Europe, that have
not yet signed or ratified the most recent Air Convention protocols. Even so, these countries have
been active in the convention and many of them have taken measures to reduce emissions. The
Central Asian countries have taken part in the work within the Air Convention as observers and
there have been several activities (workshops, training sessions) supported by the Air Convention
in order to increase awareness and national competence, e.g. on emission inventories (UNECE 2019).
See also Case study 3 in this report. One conclusion from the Air Convention work is that the
collaboration between countries, particularly in the scientific and technical bodies, have supported
actions within the participating countries.
The EU started its efforts to control air pollutants later than the Air Convention. Nevertheless, today
it regulates air pollution and air quality through several directives and other legislative acts, the
most recent being the National Emission reduction Commitments (NEC) Directive from 2016
(European Union 2016). The original NEC Directive from 2001 did set emission ceilings for 2010 and
onwards. The updated NEC Directive sets national emission reduction commitments to be achieved
by 2020-2029 and by 2030 and onwards for the EU member states. The Directive covers the same
pollutants as the Gothenburg protocol, with the same level of ambition for the period 2020-2029 but
it is more ambitious than the Gothenburg Protocol as regards the period 2030-onward. To support
policy makers and the achievement of the European Union environmental objectives, the European
Environment Agency (EEA) compiles and presents information on the environment. The EEA has
together with the subsidiary bodies of the UNECE Air Convention been important for the
establishment of infrastructures for data collection and reporting in EU and non-EU countries,
including several countries east of EU.
Another type of air pollution is heavy metals (HMs) such as lead, mercury, and cadmium. They
differ from the classical air pollutants in terms of sources, transport behavior and regulatory context.
Heavy metals are known for their toxicity in very low concentrations and have adverse effects on
human health and the environment. Heavy metals are naturally present in the environment, but
their levels in ecosystems have significantly increased compared to pre-industrial time because of
anthropogenic activity.
Anthropogenic emissions of heavy metals have been significantly reduced in Europe since the 1990s
(Maas and Grennfelt 2016). For some sectors the emission reductions have been particularly large;
lead emissions from road transport disappeared with the introduction lead-free petrol, a
requirement for catalytic converters in gasoline cars. Nowadays, the prevailing emission sectors of
the three considered metals include industrial combustion, non-industrial combustion, metal
production and electricity & heat production. However, human health and ecosystems continue to
be at risk in many European countries despite important reductions of heavy metals. To safeguard
human health and the environment the Air Convention Parties adopted the Aarhus protocol on
heavy metals in 1998 and amended it in 2012. Also, the UNEP Minamata Convention is an important
mechanism to reduce negative effects of mercury.
Hazardous substances may also be released into the air as a result of accidents at industrial facilities.
The UNECE Convention on the Transboundary Effects of Industrial Accidents aims at protecting
human beings and the environment against industrial accidents by preventing such accidents as far
as possible, by reducing their frequency and severity and by mitigating their effects. The Convention
presently has 41 contracting Parties, including most countries of Europe and Caucasus and one
country in Central Asia.
9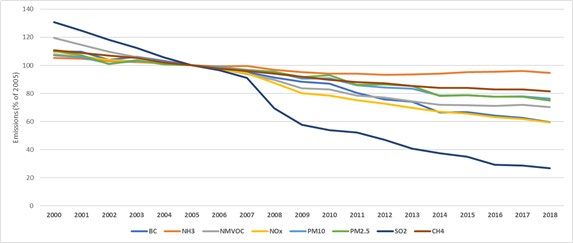
Report C598 European and Central Asian Actions on Air Quality – A regional summary of emission trends,
policies, and programs to reduce air pollution
2.2. Countries considered in this report
This report builds upon a UNEP-executed survey questionnaire as well as data from other sources
such as the European Environment Agency (EEA) and the Air Convention’s Centre for Emission
inventories and Projections (CEIP). 10 UNEP’s geographical scope includes 54 countries referred to as
the pan-European region. The region is further divided into four subregions: Western and Central
Europe, South Eastern Europe, Eastern Europe and the Caucasus and Central Asia (Table 1, Figure
1).
Table 1: The countries included in the UNEP pan-European region and sub-regions.
The UNEP pan-European region
Sub-region Countries*
Western and Central Europe (35 countries) Andorra, Austria, Belgium, Bulgaria, Croatia, Cyprus,
Czech Republic, Denmark, Estonia, Finland, France, Germany,
Greece, Hungary, Iceland, Ireland, Italy, Latvia, Liechtenstein,
Lithuania, Luxembourg, Malta, Monaco, Netherlands, Norway,
Poland, Portugal, Romania, San Marino, Slovakia, Slovenia, Spain,
Sweden, Switzerland, the United Kingdom
South Eastern Europe (7 countries) Albania, Bosnia and Herzegovina, North Macedonia,
Montenegro, Serbia, Turkey, Israel
Eastern Europe and the (7 countries) Armenia, Azerbaijan, Belarus, Georgia, Republic of
Caucasus Moldova, Ukraine, Russian Federation
Central Asia (5 countries) Kazakhstan, Kyrgyzstan, Tajikistan, Turkmenistan,
Uzbekistan
*Countries that provided answers to the 2020 UNEP survey questionnaire are marked in bold
Figure 1: Sub-regions in the UNEP pan-European region.
The geographical scope of EEA includes the 27 member states of the EU, the United Kingdom,
Iceland, Liechtenstein, Norway, Switzerland and Turkey, as well as the cooperating countries
Albania, Bosnia and Herzegovina, Kosovo under United Nations Security Council Resolution
1244/99, Montenegro, North Macedonia and Serbia. When referred to in this report, these 39
countries are grouped as EEA-Europe. The countries included in the reporting of emission trends
10 https://www.ceip.at/
10Report C598 European and Central Asian Actions on Air Quality – A regional summary of emission trends,
policies, and programs to reduce air pollution
constitutes a subset of the UNEP pan-European region. Since some countries in the pan-European
region don’t report 11 emission inventories to CEIP, the region for which there is CEIP data is referred
to as CEIP-Europe (Table 2).
Table 2: The countries in the UNEP pan-European region that report emission inventories to CEIP.
CEIP-Europe
Sub-region Countries
Western and Central Europe (33 countries) Austria, Belgium, Bulgaria, Croatia, Cyprus, Czech
Republic, Denmark, Estonia, Finland, France, Germany, Greece,
Hungary, Iceland, Ireland, Italy, Latvia, Liechtenstein, Lithuania,
Luxembourg, Malta, Monaco, Netherlands, Norway, Poland,
Portugal, Romania, Slovakia, Slovenia, Spain, Sweden, Switzerland,
the United Kingdom
South Eastern Europe (5 countries) Albania, North Macedonia, Montenegro, Serbia, Turkey
Eastern Europe and the (7 countries) Azerbaijan, Belarus, Georgia, Republic of Moldova,
Caucasus Ukraine, Russian Federation
Central Asia (1 country) Kazakhstan
Overall level of quality (completeness, transparency, and consistency) of submitted to CEIP emission
inventories differ between European countries. There might be certain gaps in submitted data; those,
however, have not been explicitly analyzed. Reported emissions in all countries are associated with
uncertainties regarding both activity data (e.g. fuel characteristics and amounts, number of
vehicles/appliances) and emission factors used.
2.3. Emission source sectors analysed in this
report
Following the structure of the questionnaire, both overview of emission trends and review of
progress towards improved air quality are focused on main six source sectors:
• Electricity & heat production and Industry,
• Road transport,
• Residential cooking and heating,
• Agriculture and forestry,
• Waste management,
• Other.
Sector “Other” covers land-based emissions sources not included in the other five sectors. However,
it is not implied that “other” emissions are insignificant. In particular, for emissions of NOx from
non-road traffic or NMVOC from solvent use, “other” is one of the key emission source sectors.
11Kyrgyzstan and Armenia have reported their emissions to CEIP for certain (including the most recent)
years. However, these time series are too aggregated (providing only the national totals) or/and too short
(covering very few years) to be included in the emission trends presented below for CEIP-Europe subregion
together with sector-specific emissions reported by other countries for the period 2010-2017. These countries
are therefore not mentioned in Table 2.
11Report C598 European and Central Asian Actions on Air Quality – A regional summary of emission trends,
policies, and programs to reduce air pollution
Air pollution levels in European countries are not affected solely by land-based emission sources.
Shipping, especially international shipping, is whilst not attributable to any country, an important
contributor to emissions of inter alia NOx and particles in the pan-European region. International
shipping, however, was not within the scope for the analysis in this report and is only covered with
respect to emission trends in chapter 2.5.
2.4. Regional overview of air quality and trends
Much because of policies and legislations, the European air quality has improved since the peak
emissions in the 1980-ies. However, it is not yet good enough to fully protect human health and the
environment. Unfortunately for this current report, an overview of air quality is only available for
EEA-Europe. In the 2020 report “Air Quality in Europe”, the European Environment Agency (EEA)
presents EEA-Europe status and trends for key air pollutants, with the most recent data from 2018.
The report presents that concentrations of PM2.5 vary across Europe with the highest daily-average
concentrations found in the South-Eastern part of EEA-Europe (European Environment Agency
2020). Even the annual mean concentrations are high and exceeds the World Health Organization
(WHO) air quality guideline (AQG) values in four of the countries in the South-Eastern part of EEA-
Europe. The most important sources of PM2.5-emissions are thermal power plants and household
heating. In addition, emissions from neighbouring countries and transboundary transport are
important for air quality even in cities (Belis et al. 2019, Colovic Daul et al. 2019).
The concentrations of particulate matter (PM10 and PM2.5) exceed the WHO AQGs in large parts of
Europe. The annual average WHO AQG for PM10 was exceeded at 53% of the monitoring stations
and in all the reporting countries, except Estonia, Iceland, and Ireland. The annual average WHO
AQG for PM2.5 was exceeded at 70% of the stations located in all the reporting countries.
Exceedances were not observed in Estonia, Finland, Iceland, and Ireland.
The PM concentrations have shown a slow downward trend between 2009 and 2018 for the EEA
stations. On average, over the last decade (2009‑2018) there was a reduction of 22% in annual mean
concentrations of PM2.5 for all station types, with the highest reduction for those stations situated at
industrial sites (Figure 2).
Figure 2: Average annual mean PM2.5-concentration by monitoring station type (adapted from fig. 4.8 in
EEA (2020)). Red dashed line indicates the current WHO AQG for annual average concentrations of PM2.5.
12Report C598 European and Central Asian Actions on Air Quality – A regional summary of emission trends,
policies, and programs to reduce air pollution
For ozone the WHO AQG value was exceeded at 96% of all the reporting stations. For NO2 and SO2
the situation is better; annual and daily mean WHO AQG are only exceeded at 8% and 33% of the
stations, respectively. The average NO2 annual mean concentrations within the EEA network
steadily decreased between 2009 and 2018. On average annual mean concentrations of NO2 have
fallen by 18% at industrial stations, by 19% in urban background stations, by 22% in suburban and
rural background stations and by 23% in traffic stations. This decrease is lower than the decrease of
26% in total NOx emissions in the same period and lower than that for road transport NOx emissions
(34%). 12
The EEA-Europe time series for ozone shows no clear trend and a high variability from year to year
over the period. This variability is mainly caused by variations in weather conditions. A trend
analysis confirms that 95% of the stations have non‑significant trends, while the 5% of the stations
with significant trends were equally distributed between increasing and decreasing trends.
2.5. Regional overview of air pollution
emissions
The significant but insufficient improvements in European air quality presented above have been
driven by substantial emission reductions of most pollutants.
Trends of air pollution emissions in the pan-European region are mainly compiled based on the self-
reported emission data available at CEIP. Emissions per region and per sector were summarized for
the period 2010-2017. This period is chosen to enable comparability of the trends in different regions.
Many of the considered countries did not report their emissions to CEIP for years before 2010; for
the years 2018-2019 not all emission inventories were available yet. Thus, trends for air pollutant
emissions are analysed for 2010-2017 while trends in implementation of policy measures (reviewed
below) cover the period 2016-2020.
In Table 3, emission trends between 2010-2017 are distributed between the main subregions (Central
Asian countries, except for Kazakhstan, are not included in the table). The overall trends in emissions
between 2010 and 2017 are also indicated in the table with colours.
Table 3: CEIP-European sub-regional trend in emissions of air pollutants, % change between 2010 and
2017.
Central and South Eastern Eastern Europe Central Asia
Western Europe Europe and the Caucasus (Kazakhstan)
NOx -21% -17% +7% +19%
SOx -46% -8% -49% +11%
PM2.5 -17% -8% -11% +21%
PM10 -14% -19% -11% +9%
NMVOC -13% +4% -2% +24%
CO -22% -37% -7% +34%
NH3 +2% +31% +12% +16%
Pb -18% -50% -53% +22%
As -16% -11% -71% +23%
Cd -11% +33% -26% +16%
Ni -30% -2% -42% -54%
Hg -19% -2% -27% -28%
12 Non-EU countries in South East Europe not included.
13Report C598 European and Central Asian Actions on Air Quality – A regional summary of emission trends,
policies, and programs to reduce air pollution
For NOx, which almost entirely is emitted from combustion, significant emissions occur in almost all
sectors. Electricity & heat production and industry together with road transport dominates. These
two sectors are making up almost 75% of the emissions with about the same share from both. There
are significant differences in emission trends between the different subregions. While emissions in
Western and Central Europe are reduced by 21% compared to the 2010 level, they have increased in
South Eastern Europe and Eastern Europe and the Caucasus with 8% and 17%, respectively.
Most emissions of sulphur dioxide origins from combustion of fossil fuels. The dominating sector is
electricity & heat production and industry (85%). A significant fraction is also coming from
residential cooking and heating, indicating that fossil fuels are still used in this sector. Emissions in
Western and Central Europe and Eastern Europe and the Caucasus were reduced by almost 50%
over the period. However, in South Eastern Europe the downward trend was limited to 8%.
Particulate matter, the key compound for health effects, has its origin in almost all sectors. However,
residential combustion is responsible for almost 50% of the fine particulate matter emissions (in total
in all sub-regions) and will therefore be of high importance for local health effects. Another large
source of PM-emissions is road transportation. All subregions show a decrease in PM2.5 and PM10
emissions, varying between 8- 17%.
Agriculture is the dominating source of ammonia emissions. The general trend is upwards in all sub-
regions. In South Eastern Europe there is an increase in emissions by 31% between 2010 and 2017,
while it is smaller (2-16%) in other regions.
For heavy metals, electricity & heat production and industry is the dominating sector contributing
with 62-82% of the emissions. Heavy metals show a downward trend between 11-30% in the Western
and Central Europe region. In Eastern Europe and the Caucasus, the decrease has been between 26-
71%. In South Eastern Europe the downward trend is pronounced for lead (Pb), while it is upwards
or neutral for the remaining three metals, cadmium (Cd), mercury (Hg) and nickel (Ni). The level of
increase is notable for Cd with an increase of 33%. It should however be noted that emission
inventories generally are uncertain for these compounds given that concentrations often are low and
heavy metal emission inventories often are based on irregular inventory campaigns.
In South Eastern Europe, an increase in emissions is observed for NMVOC, ammonia and Cd, while
emissions of other pollutants have been decreasing over the last years. Emission trends of main air
pollutants in the Western Balkan countries 13 are shown in Figure 3.
Part of the South Eastern Europe includes Albania, North Macedonia, Montenegro, Serbia and Bosnia and
13
Herzegovina. The latter does not report emissions to CEIP.
14Report C598 European and Central Asian Actions on Air Quality – A regional summary of emission trends,
policies, and programs to reduce air pollution
700
600
500
PM2.5
400
kt emissions
NOx
NMVOC
300 SOx
NH3
200
100
0
2010 2011 2012 2013 2014 2015 2016 2017
Figure 3: 2010-2017 Emission trends in the Western Balkan countries, based on CEIP data (kton emissions).
Figure 4 shows emission trends for the Central Asian republics. Not all countries in the Central
Asian sub-region are parties to the Air Convention. Comprehensive emission data submitted to CEIP
for longer time periods than 2016-2017 are only available for Kazakhstan. Figure 4 summarizes
emissions for 2010-2017 as estimated by CEIP experts in separate studies (EMEP 2014, EMEP 2016a,
EMEP 2016b, EMEP 2018, EMEP 2019) and used for official EMEP modelling by MSC-W (EMEP
2020). These data are different for Kazakhstan from those self-reported by Kazakhstan to CEIP in the
most recent submission (as in Table 3). According to these expert estimates for the Central Asian
sub-region, all emissions except SO2 are increasing. The overall SO2 emissions decreased by 8%
between 2010 and 2017. For NOx, there is a slightly upward trend of 13%. PM2.5 emissions show a
large increase (46%) over the period. Unfortunately, the emission inventories lack distribution by
sectors.
Kazakhstan is the country in Central Asia with the largest emissions for all pollutants except
ammonia. For sulphur dioxide, 80-90% of the sub-region’s emissions occur in Kazakhstan. For
ammonia, Uzbekistan and Kazakhstan have similar emission levels, and for the entire region
emissions are increasing by 19% over the period. For NMVOC and CO the downward trends are 7%
and 12% respectively.
15Report C598 European and Central Asian Actions on Air Quality – A regional summary of emission trends,
policies, and programs to reduce air pollution
Figure 4: 2010-2017 Expert (CEIP) estimate emission trends in Central Asia (kton emissions), as used in the
EMEP modelling (EMEP 2020).
Unlike the increasing emission trends in the Central Asian sub-region, Western and Central Europe
shows a downward trend for all emissions. For this sub-region, emission trends from the EU member
states cover enough parts of the region to be representative for the entire region. Overall emission
trends for EU27 and the United Kingdom have been published as part of the Second EU Clean Air
Outlook (European Commission 2021). The trends shown in Figure 5 reveal that since 2005 emissions
for almost all pollutants have decreased with 20-40%. For SO2 emissions have decreased by 60%
while emissions of NH3 only decreased by less than 10%.
16Report C598 European and Central Asian Actions on Air Quality – A regional summary of emission trends,
policies, and programs to reduce air pollution
Figure 5: 2000-2018 emission trends in EU27 and the United Kingdom, % of 2005 level (European
Commission 2021).
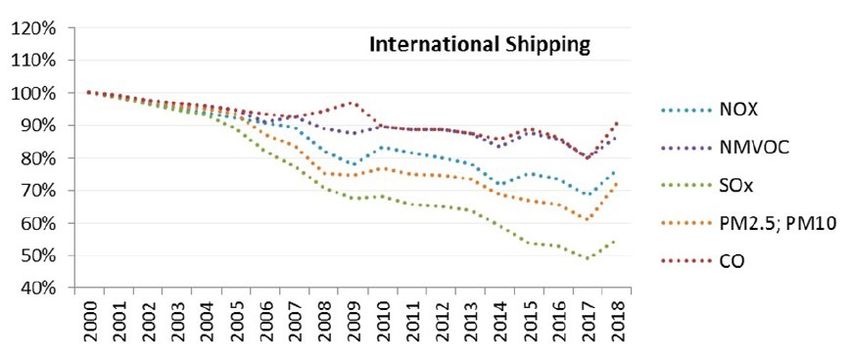
Emissions from international shipping in the European seas show decreasing trend for all
pollutants, although with a slight increase in 2018 – see Figure 6. Compared to the 2000 level,
shipping emissions in 2018 decreased by 10-45%, with the most pronounced reduction for sulphur
dioxide.
Figure 6: 2000-2018 emission trends for international shipping in the European seas, % of 2000 level (EMEP
2020).
2.6. Key sectoral sources and trends in
emissions of air pollutants
Just as there are differences between regions, the emission levels and trends differ between sectors.
For the entire CEIP-Europe region, Table 4 show the percent distribution of emissions between
sectors for the pollutants considered in this report. The overall trends in emissions between 2010 and
2017 are indicated in the table with arrows. With respect to sectoral origin of emissions, NOx
emissions mainly originate from energy, industry, and road transport. The sector Electricity & heat
production and industry is the dominating source of SO2 and heavy metal emissions. The use of coal
for production of electricity is still prominent in many parts of Europe, and emission control is not
17Report C598 European and Central Asian Actions on Air Quality – A regional summary of emission trends,
policies, and programs to reduce air pollution
applied in some sub-regions (HEAL et al. 2019). Particle emissions mainly origins from residential
cooking and heating, where the heating is most important. Correspondingly, emissions of particular
matter are seasonal (Belis et al. 2019). The agricultural sector dominates NH3 emissions. For industry,
energy and transport, the trends are consistent for almost all pollutants, whilst the trend is more
mixed for the other sectors. When studying the following tables and figures it is important to keep
in mind that the figures are self-reported from national authorities. The data availability and
collection efforts made vary substantially between countries reporting to CEIP. It is also important
to remember that most of the outlier trends presented in % of 2010 emissions in Figure 7 – Figure 11
below, are for sources with very low 2010 emission levels.
Table 4: Sectoral distribution of air pollutants in the CEIP-European part of the UNEP pan-European region
in 2017, % share of sectors’ contribution to total emissions. The arrows indicate if emissions are increasing
(red arrow) or decreasing (green arrow) during the period 2010- 2017 (CEIP database 2021) 14
Electricity & heat Residential
Road Agriculture Waste
production and cooking and Other
transport and forestry* management
industry heating
NOx 36% ↓ 37%↓ 8%↑ 6%↑ 0.4%↑ 13%↓
SOx 85%↓ 1%↓ 11%↓ 0.02%↓ 0.1%↑ 3%↓
PM2.5 30%↓ 10%↓ 46%↓ 4%↑ 4%↑ 7%↓
PM10 32%↓ 8%↓ 30%↓ 20%↑ 2%↑ 7%↓
NMVOC 20%↓ 17%↓ 11%↓ 19%↑ 1%↑ 32%↓
CO 22%↓ 38%↓ 30%↑ 0.4%↓ 2%↑ 8%↑
NH3 2%↓ 1%↓ 1%↑ 93%↑ 2%↓ 1%↓
Pb 69%↓ 14%↓ 9%↓ 0.03%↓ 1%↓ 7%↓
As 85%↓ 2%↑ 5%↓ 0.04%↓ 7%↓ 1%↓
Cd 68%↓ 3%↓ 17%↑ 2%↓ 3%↓ 7%↓
Ni 69%↓ 2%↓ 14%↓ 0.01%↓ 0.1%↓ 15%↓
Hg 82%↓ 2%↓ 7%↓ 0.3%↓ 5%↓ 3%↓
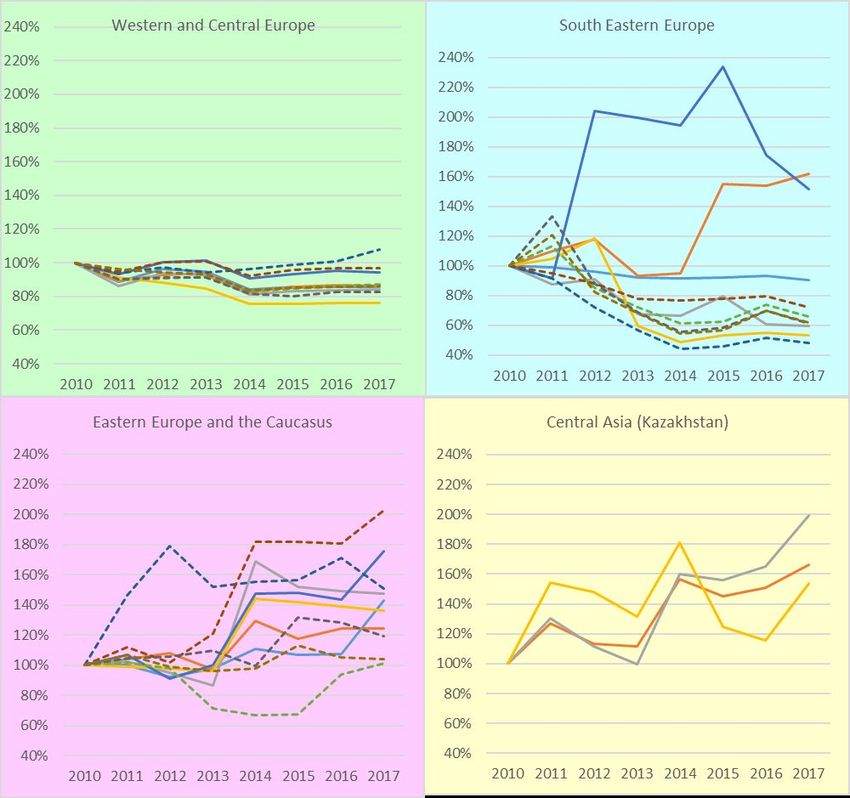
2.6.1. Electricity & heat production and industry
Emissions from electricity and heat production and industry are decreasing in Western and Central
Europe as well as in South Eastern Europe, Eastern Europe, and the Caucasus. However, emissions
in Central Asia are showing an increasing trend.
In Figure 7 the trends in emissions between 2010 and 2017 of the key sector electricity & heat
production and industry are presented for four regions within the pan-European region.
For Western and Central Europe (mainly EU member states) the emission trends show consistent
but small decrease, generally of the order of 20% or less. They are downward for all compounds
except for NH3. The trends represent the continuous fulfilment of the EU directives as well as
commitments under the Air Convention protocols.
For Eastern Europe and the Caucasus, the trend is downwards for most compounds, in some cases
of the order of 50% and more. For the key compounds NOx, NH3 and NMVOC, emissions are
however increasing. For the key component for health effects, PM2.5, the trend is decreasing.
For South Eastern Europe the development shows a downward trend for most compounds, although
for some compounds there is a tendency towards increasing emissions at the end of the period. For
the key components, NOx, NH3 and NMVOC, the emissions show a slight increase.
14 https://www.ceip.at/
18Report C598 European and Central Asian Actions on Air Quality – A regional summary of emission trends,
policies, and programs to reduce air pollution
The emission levels for the Central Asian country Kazakhstan are increasing. Although not a large
source in absolute terms (according to self-reported to CEIP data), emissions of NH3 increased with
almost 150% between 2010 and 2017 in the fertilizer production industry. For the key compounds,
emission trends are increasing with up to 20%.
In general, emission inventories and trends for heavy metals should be looked at with caution. The
underlying data is still uncertain and there is a need for improvement, especially for the non-EEA
countries.
Figure 7: Self-reported and indexed 2010-2017 Emission trends within Electricity & heat production and
industry per CEIP-Europe subregion.
19Report C598 European and Central Asian Actions on Air Quality – A regional summary of emission trends,
policies, and programs to reduce air pollution
2.6.2. Road Transport
Emissions for the key components from the road transport sector are decreasing in Western and
Central Europe. The emission of NOx, NMVOC and PM2.5 in 2017 are estimated to be 20-30% lower
than in 2010. However, emission inventories indicate that emissions of heavy metals are stable or
increasing.
For Eastern Europe and the Caucasus there are differing trends over the period. For PM2.5 there is
a downward trend of about 20%, while there is an upward trend of 20-25% for NOx. It is notable that
emissions of Pb show significant decrease between 2010 and 2017, which may indicate a phase-out
of leaded gasoline (Figure 8).
The key emissions from road traffic in South Eastern Europe are decreasing with approximately 40%
over the period, consistent with introduction of stricter vehicle emission standards in the region. A
similar rapid decrease in Pb emissions as reported for South Eastern Europe as well as for Eastern
Europe and the Caucasus. Finally, emissions of key components in Central Asia (Kazakhstan) show
an increase of up to 20%.
Figure 8: Self-reported and indexed 2010-2017 Emission trends from road transport per CEIP-Europe
subregion.
20Report C598 European and Central Asian Actions on Air Quality – A regional summary of emission trends,
policies, and programs to reduce air pollution
2.6.3. Waste management
Waste management is a relatively small source of emissions in the region compared to other sectors.
However, the emissions of NMVOC, PM2.5 and NOx (Figure 9) are of some significance. In Western
and Central Europe emissions of NMVOC are decreasing, while emissions of PM2.5 and NOx show
no trends. Emissions of heavy metals have been steady on the same level.
Emissions in South Eastern Europe show both significant upwards and downwards trends. While
emissions are decreasing for SO2, NOx, NH3 and PM2.5, they are increasing for heavy metals and
NMVOC. For Eastern Europe and the Caucasus emissions of NMVOC are increasing while they are
decreasing for NH3. For the remaining compounds, reported emissions are small without any clear
trends.
Figure 9: Self-reported and indexed 2010-2017 Emission trends from waste management per CEIP-Europe
subregion.
21Report C598 European and Central Asian Actions on Air Quality – A regional summary of emission trends,
policies, and programs to reduce air pollution
2.6.4. Residential cooking and heating
Residential heating in Europe is the main source of air pollution while cooking plays a less significant
role. The heating is often based on wood-burning (e.g. Northern and Western Europe) and in some
regions on coal-burning (e.g. Eastern and South-eastern Europe). In the countries where wood
and/or coal are supplementary heating sources, they still contribute significantly to emissions of inter
alia fine particles from the sector. Emissions from residential heating are together with road traffic a
main source of pollution exposure to humans. At the same time, these emissions are often estimated
based on several assumptions, due to the lack of data regarding exact number of heating appliances
of a certain type, their age distribution, fuel amounts and quality, burning techniques, etc. All of
which contributes to the uncertainties of the emission estimates for this sector. Residential heating
with small-scale combustion technologies is common all over Europe, and even more so in areas
with low seasonal temperatures.
In Western and Central Europe, the trends for PM2.5, NOx and NMVOC are downwards with
approximately 15% over the period 2010-2017 (Figure 10). SO2 emissions are down with 24%. In
South Eastern Europe the trends are mixed. While emissions of NOx have increased with 61%,
emissions of PM2.5 are down with 9% and those of NMVOC and SO2 are down with 40-50%.
In Eastern Europe and the Caucasus, the emissions are increasing. However, there are large
variations between years and compounds. In 2017 emissions of the key components PM2.5, NOx,
NMVOC and SO2 were between 25-47% larger than in 2010. For Central Asia (Kazakhstan) emissions
of NOx, NMVOC and SO2 increased by 66%, 99% and 54%, respectively, between 2010 and 2017.
Figure 10: Self-reported and indexed 2010-2017 Emission trends from residential cooking and heating per
CEIP-Europe subregion
22Report C598 European and Central Asian Actions on Air Quality – A regional summary of emission trends,
policies, and programs to reduce air pollution
2.6.5. Agriculture and forestry
Atmospheric emissions from the agriculture and forestry sector are mainly caused by agricultural
activities. For forestry, emissions are mainly caused by various forest management machineries.
Emissions of ammonia is a key problem for the agriculture sector. This sector is responsible for more
than 90% of all ammonia emissions in Europe. Despite awareness of the problem and measures in
many countries, there are no signs of reductions in the total emissions in the region.
In Western and Central Europe, the emissions of NH3 are 2% higher in 2017 compared to 2010 (Figure
11). For NMVOC emissions are up with 4% and those of NOx are up with 6%. In Eastern Europe and
the Caucasus, emissions of all key components are increasing; the 2017 emissions are up with 11%
for NH3 compared to 2010 and corresponding figures for NMVOC and NOx are 7% and 28%,
respectively.
For South Eastern Europe emissions of NH3 are up with 32% and NMVOC and NOx emissions have
increased with 27% and 36%, respectively. The emissions in Central Asia (Kazakhstan) are for all
components increasing with approximately 10% over the 2010-2017 period.
Figure 11: Self-reported and indexed 2010-2017 Emission trends from agriculture and forestry per CEIP-
Europe subregion.
23Report C598 European and Central Asian Actions on Air Quality – A regional summary of emission trends,
policies, and programs to reduce air pollution
2.7. Macro-trends in policy formulation
International and transnational actions are of large importance for the formulation and development
of air pollution control policies in Europe. The two main actors within the region are the Air
Convention and the EU. The Air Convention covers almost all countries in Europe while EU covers
27 countries today. EU air pollution legislation is also affecting countries having association
agreements with the EU. Furthermore, European air pollution control policy is in general developed
in co-production between policymakers and scientists, involving a broad palette of various scientific
interests and disciplines such as medicine, ecology, atmospheric science, environmental technology,
and economy. Integrated assessment modelling (IAM) has played an important role by linking the
various elements of knowledge into designing cost-effective policies. Correspondingly, European
policy formulation is to a large extent influenced by scientific results.
To take stock of progress and future needs, the Air Convention published a scientific assessment
report ‘Towards Cleaner Air’ 15 in 2016. The report points to the progress achieved within the region in
terms of improvements in emission reductions for the benefit of human health and ecosystems (Maas
and Grennfelt 2016). It also points out the need for further actions if long term objectives with respect
to health and ecosystems are to be achieved. The conclusions from the report formed the basis for an
updated long-term strategy for the period up to 2030, which was adopted by the Executive Body of
the Air Convention in 2018. 16 (The strategy will be further presented under Chapter 3).
The amended Gothenburg Protocol from
2012 include national reduction Towards Cleaner Air – Key Conclusions
commitments for SO2, NOx, NMVOC, • There is a need for coordinated actions going
NH3, and is the first international beyond the UNECE region.
agreement setting reduction targets for • Technical solutions are available to reach WHO
PM2.5. The protocol entered into force in guidelines for health impacts of air pollution and
2019 and is currently under review. avoid negative impacts of air pollution on
ecosystems in most parts of Europe
The clean air policy of the European
• Air pollution control costs are generally much
Union rests on three pillars. The first
lower than the damage costs of air pollution
pillar comprises the ambient air quality
• An integrated approach to climate change and air
standards set out in the Ambient Air
pollution could lead to significant co-benefits
Quality Directives for ground-level
• Actions are needed at different levels:
ozone, particulate matter, nitrogen
international, national and local.
oxides, heavy metals, and several other
pollutants. 17 If the set limit values are
exceeded, Member States are required to adopt air quality plans specifying measures to keep the
exceedance period as short as possible.
The second pillar consists of national emission reduction obligations set by the National Emission
reduction Commitments Directive (NEC Directive) 18 for SO2, NOx, NMVOC, NH3 and PM2.5.
15 https://unece.org/environment-policy/publications/towards-cleaner-air-scientific-assessment-report-2016
16Long-term strategy for the Convention on Long-range Transboundary Air Pollution for 2020−2030 and
beyond.
https://unece.org/fileadmin/DAM/env/documents/2018/Air/EB/correct_numbering_Decision_2018_5.pdf
17Directives 2004/107/EC (https://eur-lex.europa.eu/legal-content/EN/TXT/?uri=CELEX:32004L0107) and
2008/50/EC (https://eur-lex.europa.eu/legal-content/en/ALL/?uri=CELEX:32008L0050)
Directive (EU) 2016/2284 on the reduction of national emissions of certain atmospheric pollutants (‘NEC
18
Directive’)
24You can also read