Global Outlook on Financing for Sustainable Development 2019 - TIME TO FACE THE CHALLENGE
←
→
Page content transcription
If your browser does not render page correctly, please read the page content below
Global Outlook on Financing for
Sustainable Development 2019
TIME TO FACE THE CHALLENGE

HIGHLIGHTS
FOREWORD: INVESTING IN A BETTER SUSTAINABLE DEVELOPMENT MARKETPLACE                 │

           Foreword: Investing in a better sustainable development
                                   market

       By Jorge Moreira da Silva, Director, Development Co-operation Directorate
       In 2015, the international policy community made a marked shift away from framing the
       world as donors versus recipients, to embrace a shared development agenda. With
       conflict- and climate-driven crises reminding us of our interconnectedness, this
       repositioning was well overdue. It’s time for the funding design for our global agenda to
       match this shift. Financing for sustainable development is not a cost; it is an investment.
       Rather than a static web of providers and receivers, today’s ecosystem of financing for
       sustainable development (FSD) should be seen as a dynamic market, with providers
       competing to respond to global demands. Healthy competition will help to drive
       innovation, better tailor financing to the needs of developing countries, and promote
       higher social and economic returns.
       The Global Outlook on Financing for Sustainable Development takes a fresh look at the
       inter-linkages between sustainable development finance and policy, revealing that many
       paradoxes and inconsistencies exist. The sustainable development finance market is still
       in its infancy. This must be fixed through ambitious policy reforms (both in donor and
       recipient countries. In order to produce optimal financing mixes for developing countries,
       this market needs a triple shift: more transparency; new international standards and
       greater policy coherence. Ultimately, this will close emerging policy gaps like debt
       sustainability. A better FSD market will also reduce asymmetries of information with
       sustainable development impact metrics for investors. And, the “customers” of
       sustainable development finance will be empowered to make optimal choices. A properly
       functioning market calls for a more strategic interplay of beneficiaries, intermediaries and
       suppliers, so that each dollar spent is maximised and impactful.
       The role of official development assistance (ODA) does not shrink in this market: if
       anything, it is more relevant to ensure that no country and no one is left behind. OECD
       countries’ ODA is driven by a unique mandate, and, some argue, a moral imperative, to
       support development in countries most in need – including least developed countries,
       small island developing states, and fragile states. ODA is the principal investor in long-
       term resilience and stability. The Global Outlook acknowledges the role of ODA working
       in unison with private sector investors, the tax revenue system, migrants, philanthropists
       and others outside of traditional development circles, to support development goals.
       A better FSD market will not only mobilise new finance flows – some of which are
       catalysed by ODA – it also demands better orchestration of all resources. We need to
       improve the quality of public and private investment while we grow the market. Private
       sector actors, for example, are called on not just to help underwrite the SDGs but “to
       engage as partners in the development process, to invest in areas critical to sustainable
       development, and to shift to more sustainable consumption and production patterns”
       (United Nations, 2015[3]). Our goal must go beyond turning billions into trillions. The

GLOBAL OUTLOOK ON FINANCING FOR SUSTAINABLE DEVELOPMENT 2019 © OECD 2018
│ FOREWORD: INVESTING IN A BETTER SUSTAINABLE DEVELOPMENT MARKETPLACE

      larger objective is to turn all existing finance into more impactful investments for the
      billions of people that still live in extreme poverty today.
      Within the OECD, this cross-sectoral approach required close collaboration of four
      directorates to produce this report – the Development Co-operation Directorate, the
      Development Centre, the Centre for Tax Policy and Administration, and the Directorate
      for Financial and Enterprise Affairs. Further contributions were provided from the Office
      of the Secretary General, the Public Governance Directorate, among other Directorates
      and divisions. The Global Outlook will exist at the OECD not only as a report, but a
      platform to build momentum and resources for a better informed FSD market amongst
      OECD actors and with the UN, partner countries, and private investors.

                           GLOBAL OUTLOOK ON FINANCING FOR SUSTAINABLE DEVELOPMENT 2019 © OECD 2018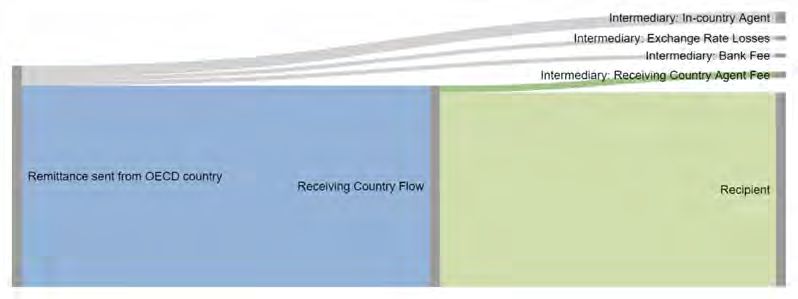
EDITORIAL    │

                                               Editorial

       By Angel Gurría, Secretary-General of the OECD
       The current Financing for Sustainable Development agenda urgently needs to be re-focussed.
       It must be examined through a broader lens, one where economic co-operation and
       development are viewed together as strategic partners in overcoming today’s most pressing
       global challenges. We know that failure to achieve the United Nations Sustainable
       Development Goals (SDGs) will result in unprecedented global impacts – increased natural
       disasters, epidemics, and large-scale forced migrations that respect no borders.
       The OECD Global Outlook on Financing for Sustainable Development presents a path
       forward for OECD countries to provide better support in advancing the Sustainable
       Development Goals. Even more importantly, the Outlook demonstrates that OECD countries
       have a powerful capacity to achieve both inclusive growth at home, and support development
       gains in countries most in need. This is not a zero-sum game: some of the same policy tools
       used to achieve inclusive growth in OECD-countries can be harnessed to increase SDG
       financing.
       The Outlook makes a powerful argument for development to be considered within domestic
       policy contexts, bringing Ministers of Finance, Revenue, Trade, Investment and others, to join
       the fight. It is clear that Financing for Sustainable Development today requires eliminating
       silos and strengthening policy dialogues. Taking just one example from the Outlook, while
       substantial amounts of cross-border financing ($1.7 trillion) and tax revenues ($4.3 trillion)
       accrued to developing countries in 2016, little is known about the development impact of the
       vast bulk of this financing, and what partners can do to maximise it.
       The Outlook also echoes the optimism of the 2030 Agenda for Sustainable Development,
       which has shifted the ambitions of Financing for Sustainable Development well beyond aid,
       to include private investment, remittances, taxation and philanthropy. In this respect, we need
       to redouble our efforts to build synergies across the spectrum of public and private actors in
       developing and developed economies and to channel these resources to where they are needed
       most. It is also critical that the international community harness this optimism, drive, and
       commitment. The indispensable and promised surge in resources to support the SDGs has not
       materialised and in some cases has even dropped. Collectively, we stand at a crossroads and
       the time to act is now.
       The OECD focuses on building strong, inclusive economies, setting common standards,
       expanding trade and investment, and contributing to development in OECD and non-OECD
       countries alike. We have also long documented the costs of artificial divisions. In a divided
       world, we all lose, and those most in need are left behind. In 2015, we witnessed the potential
       of multilateralism as global leaders stepped forward to agree to the 2030 Agenda – the UN
       Sustainable Development Goals, the Paris Climate Change Agreement, the Addis Ababa
       Action Agenda and AEOI as well as BEPs regarding the international tax agenda. We must
       now re-join forces and work better together – across new platforms and in new ways – to
       deliver the 2030 Agenda and better policies for better lives.

GLOBAL OUTLOOK ON FINANCING FOR SUSTAINABLE DEVELOPMENT 2019 © OECD 2018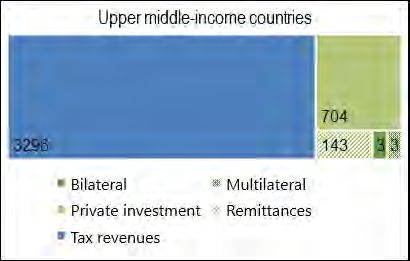
EXECUTIVE SUMMARY        │

                                      Executive summary

       The Sustainable Development Goals and 2030 Agenda have redefined global ambitions:
       creating a better world for all is a collective responsibility. As time passes, this agenda
       becomes ever more urgent – challenges such as extreme poverty and climate change can
       only be solved by a global, collective response.
       The Addis Ababa Action Agenda (AAAA) provides the framework to finance these
       collective ambitions. It calls on a diverse array of actors - governments, businesses,
       foundations and individuals - to mobilise more financial resources, in a more co-ordinated
       manner, and in the pursuit of economic growth that enhances human well-being and
       preserves the environment, particularly in developing countries.
       Yet three years after the AAAA was signed in 2015, the promised surge in finance
       available for those countries to achieve the SDGs has not materialised. Government
       revenues – the main pillar of financing for development at USD 4.3 trillion - remain on
       average in low-income countries below the 15% of GDP threshold often considered
       necessary for effective state functioning.
       Worryingly, the overall supply of external resources to developing countries has declined.
       Private investment in particular has shown a sharp decrease, with FDI dropping by 30%
       over 2016-17 to USD 750 billion, and project finance decreasing by an alarming 30% in
       the first trimester of 2018 alone. Other major financial flows are stable, but remain small
       in comparison: remittances by migrants reached a record high of USD 466 billion in
       2017; official development assistance is steady despite fiscal pressures in provider
       countries at USD 146.6 billion in 2017; and philanthropy contributes an average of USD
       7.9 billion a year over 2013-2015. As for innovative finance, this still accounts for a
       minor share of official providers’ efforts although it is growing.
       Declining financing for sustainable development is not only a risk for developing
       countries: it is a global threat, as failure to achieve sustainable and peaceful prosperity
       globally will have consequences for all.
       Therefore, this first edition of the Global Outlook on Financing for Sustainable
       Development calls for urgent and bold action to implement the AAAA and fulfil the
       promise of Agenda 2030 at home and abroad. Seeking to mobilise a greater quantity of
       financial resources for developing countries will not be enough; the quality, or sustainable
       development footprint, of all finance must be enhanced.
       The Global Outlook identifies three areas for reform. First, on measurement: we need
       better indicators and tools to assess the volume of financial flows, but also their alignment
       with the SDGs. Measurement must expand beyond aid to all flows from all actors, and to
       tracking flows towards specific SDGs and development objectives. For example, a dollar
       invested in polluting activities cannot be counted the same way as a dollar invested in
       clean energy. A culture of evaluation and impact needs to be developed to understand the
       actual footprint of resources as well as the trade-offs and synergies. The report thus calls
       for a new transparency initiative as a first step to address these gaps.

GLOBAL OUTLOOK ON FINANCING FOR SUSTAINABLE DEVELOPMENT 2019 © OECD 2018
│ EXECUTIVE SUMMARY
Second, policy reforms are needed to shift the trillions, i.e. create incentives for a greater
share of the total available finance to be invested in sustainable development. This
includes supporting the capacity of developing countries to make the most of financing
options; guiding providers of finance towards high standards, and preventing harmful
practices such as tax evasion and avoidance; and encouraging greater policy coherence
for sustainable development in the home countries of providers – for example, through
tax regimes and investment frameworks, and efforts to reduce the cost of remittance
transfers.
Third, we need to improve the co-ordination of various actors in their operations, so as to
better connect supply and demand for financing for sustainable development. In
particular, country development strategies need to be better linked with available
financing. Several diagnostic tools and guidelines are already available to help design
such strategies and identify matching resources, but co-ordination in countries remains
low. The Global Outlook urges donors to provide more coherent support to countries as
they develop the Integrated National Financing Frameworks called for in the AAAA.
The ambitious change agenda set out in this inaugural edition of the Global Outlook aims
to support the UN-led efforts to implement Agenda 2030 and the AAAA. The report puts
the onus on OECD providers of development co-operation to use all available levers to
support the visions and choices of partner countries for their sustainable development. It
recommends concrete actions, identifies areas for further policy dialogue, and points to
knowledge gaps which the next editions will aim to fill.
GLOBAL OUTLOOK ON FINANCING FOR SUSTAINABLE DEVELOPMENT 2019 © OECD 2018INFOGRAPHIC: FINANCING THE SUSTAINABLE DEVELOPMENT GOALS │
Infographic: Financing the Sustainable Development Goals
GLOBAL OUTLOOK ON FINANCING FOR SUSTAINABLE DEVELOPMENT 2019 © OECD 2018OVERVIEW: TIME TO FACE THE CHALLENGE │
Overview: Time to face the challenge
Financing the Sustainable Development Goals (SDGs) in developing countries is a
major challenge. Three years after the Addis Ababa Action Agenda (AAAA) in 2015
called on all actors - public and private - to co-ordinate better and mobilise more
financial resources, the outlook is not encouraging: external finance - which many
developing countries continue to depend on heavily - has been going down, largely
due to the drop in private flows, and co-ordination remains poor. The trend must be
reversed: financing the sustainable development of poor countries is an investment in
the well-being of all nations. OECD countries must face the challenge: urgent and
bold action is needed to implement the AAAA with their partners and fulfil the promise
of the 2030 Agenda for Sustainable Development at home and abroad. Mobilising
more finance for developing countries is not enough; the quality – i.e. the “sustainable
development footprint”– of all finance must be enhanced. This Overview chapter
synthesises the report's diagnosis and its recommendations for reforms in three areas:
(i) better measurement of the quantity and quality of finance for the SDGs; (ii) better
incentives to direct the finance already available globally to the SDGs; and (iii) better
co-ordination of actors to connect the supply and demand for financing for sustainable
development in developing countries.
GLOBAL OUTLOOK ON FINANCING FOR SUSTAINABLE DEVELOPMENT © OECD 2018│ OVERVIEW: TIME TO FACE THE CHALLENGE
“Prosperity, like peace, is indivisible. We cannot afford to have it scattered
here or there among the fortunate or to enjoy it at the expense of others.
Poverty, wherever it exists, is menacing to us all and undermines the
well-being of each of us. It can no more be localized than war, but spreads and
saps the economic strength of all the more-favored areas of the earth. We
know now that the thread of economic life in every nation is inseparably woven
into a fabric of world economy. Let any thread become frayed and the entire
fabric is weakened. No nation, however great and strong, can remain immune.
(…)
We know now that economic conflict must develop when nations endeavor
separately to deal with economic ills which are international in scope. To deal
with the problems of international exchange and of international investment is
beyond the capacity of any one country, or of any two or three countries.
These are multilateral problems, to be solved only by multilateral
cooperation.”
Address by the Honourable Henry Morgenthau Jr., U.S. Secretary of the Treasury, at
the Inaugural Plenary Session of the Bretton Woods International Monetary
Conference, 1 July 1944
In brief
By setting new ambitions for the world’s nations, the 2030 Agenda and the
Sustainable Development Goals (SDGs), adopted in 2015, kick-started a redefinition
of international co-operation. Creating a better world for all requires breaking free of
the limits of traditional North/South approaches. It demands a collective effort to share
prosperity and help all actors play their part in facing up to fast-evolving global
challenges. The 2015 Addis Ababa Action Agenda (AAAA), in line with the
2002 Monterrey Consensus, provided the framework to finance these ambitions. The
AAAA called on a broad diversity of actors – from central governments to local, from
private investors to philanthropies– to mobilise more domestic and external financial
resources, more effectively and in a more co-ordinated manner, in pursuit of economic
growth that enhances human well-being and preserves the environment.
Three years in to this commitment to the SDGs, this first edition of the Global Outlook
on Financing for Sustainable Development sounds an alarm. The need for financing
for sustainable development is increasing but the actual volume of external resources
available to developing countries is declining, and is not yet compensated by a
symmetric growth of domestic resources. The revenue of governments is the central
pillar of the FSD system, and while tax revenue-to-GDP ratios are increasing, in many
countries they remain stubbornly low. Moreover, the radical shift needed in the quality
of public and private investment, especially in the poorest economies, has barely
started. The urgent call to action issued from Addis Ababa has yet to be heard by all.
What would it take to heed that call and fix the financing for sustainable development
(FSD) system? What is the role of each actor? Where to start in the face of such
formidable complexity? The Global Outlook invites all actors to step back and take a
fresh look at this system as a market – one where the demand for more and better
investment in sustainable development (the SDG financing needs) must be met by a
variety of current and potential suppliers. The Global Outlook primarily targets the
responsibilities of OECD development co-operation policy makers, but has relevance
GLOBAL OUTLOOK ON FINANCING FOR SUSTAINABLE DEVELOPMENT © OECD 2018OVERVIEW: TIME TO FACE THE CHALLENGE │
for the broader international community. The analysis reveals the symptoms of an
imperfect, immature market that needs more transparency, better regulation and more
efficient co-ordination.
The report, therefore, calls on policy makers in the FSD system to face the challenge
and accelerate the maturation of this system. It proposes reform in three priority areas:
better inform actors in the market by more accurately measuring FSD flows and their
impact; improve policies and regulations in the system to create new incentives for
directing a greater share of public and private investment towards sustainable
development; and better implementation of the holistic approach put forward in the
Monterrey and AAAA commitments (Box 0.1) through more tailored and co-ordinated
operations.
This overview offers a list of recommendations, primarily for OECD policy makers, to
be prioritised and translated into concrete actions.
Box 0.1. What is a holistic approach to financing for sustainable
development?
The Monterrey Consensus on Financing for Development, in paragraph 8,
defines the holistic approach to financing for development as the
following:
In the increasingly globalising interdependent world economy, a holistic
approach to the interconnected national, international and systemic
challenges of financing for development – sustainable, gender-sensitive,
people-centred development – in all parts of the globe is essential. Such an
approach must open up opportunities for all and help to ensure that
resources are created and used effectively and that strong, accountable
institutions are established at all levels. To that end, collective and
coherent action is needed in each interrelated area of our agenda,
involving all stakeholders in active partnership (UN, 2003[1]).
Accordingly, the holistic, integrated approach has two main dimensions:
Areas of the development agenda – economic, social and
environmental – are interrelated;
Actions are coherent, involving all stakeholders in active
partnerships to make the most of their interactions, so that their
collective impact on sustainable development is more than the sum
of the parts.
The international community needs to accelerate the reform of the global system
of financing for sustainable development
The evolution of the FSD system since Monterrey and Addis Ababa may leave policy
makers feeling overwhelmed. First, by a sense of urgency as the ongoing decline in
financial flows to developing countries suddenly casts serious doubt on the world’s
collective capacity to reach the SDGs – with high stakes for countries at all levels of
development. Second, by the complexity of the system, with its growing diversity of
actors and instruments, their intricate interactions, and the constantly changing
GLOBAL OUTLOOK ON FINANCING FOR SUSTAINABLE DEVELOPMENT © OECD 2018│ OVERVIEW: TIME TO FACE THE CHALLENGE
financing needs over time. This complexity makes it harder to fully grasp and
effectively act to properly maximise these combined contributions to sustainable
development. Third, by a sense of unfinished business as the holistic approach has yet
to be fully implemented or its benefits reaped. Moreover, the innovation that is
occurring is promising, but is not producing results to scale.
Headwinds building in the global macroeconomic environment jeopardise
financing for sustainable development in the short and medium term
The availability of financing for sustainable development depends on a number of
factors, among them economic growth, debt levels, trade and investment trends, and
migration flows. Stresses on some of these factors in recent years have created a net,
downward pressure on development finance resources. Table 0.1 summarises the
effects of some of these changes.
Table 0.1. Macroeconomic determinants of financing for sustainable development:
A bleak outlook
2018 state of play
Growth pre-2008 levels not recovered
Commodity prices super-cycle ended in 2011
Debt levels at historic peak both in developed and developing countries
Migration increase of flows and in-donor refugee costs vs. increase in remittances
Technology mix of opportunities and threats
Growth: Since the 2008-09 crisis, GDP growth in OECD countries has remained flat
and forecasts have only recently improved. Despite an initial rebound, GDP growth in
emerging and developing economies also slowed, to 6-7% in the People’s Republic
of China (“China”) and around 3-4% in sub-Saharan Africa – far from double-digit
growth rates some of those countries experienced in previous decades. Global GDP
growth stood at 3.8% in 2017, down from 5.6 % prior to the crisis (IMF, 2018[2]). The
difference (1.8% average point) falls in the range of the estimated investment gap of
an incremental 1.5-2.5% of world GDP that, according to some estimates, is required
to finance the SDGs (Schmidt-Traub, 2015[3]). Slower growth negatively affects the
capacity of developing countries both to mobilise domestic resources for development
and to attract external financial flows.
Commodity prices: In 2017, 64% of developing countries derived 60% or more of
their exports from commodities (UNCTAD, 2017[4]). The end of the commodity
super-cycle in 2011 and the subsequent drop in commodity prices have severely
constrained growth and domestic resource mobilisation capacity of developing
countries. Conversely, commodity net-importing countries benefited.
Debt levels: Sustainable debt, which is essential to financing development, reached a
historic peak of USD 164 trillion in 2016, i.e. 225% of world GDP (Gaspar and
Jaramillo, 2018[5]). Debt levels could constrain the capacity of both beneficiaries
(through reduced absorption capacity) and providers (through reduced budgetary
flexibility) to marshal FSD resources. Fiscal balances have deteriorated in 70% of
low-income countries, and the number of developing countries at high risk or in debt
distress has nearly doubled, to 24 from 13, in the past five years (IMF, 2018[6]).
Migration: As of 2017, an estimated 258 million people live in a country other than
their country of birth, 49% more than in 2000. The increased migration flows to
GLOBAL OUTLOOK ON FINANCING FOR SUSTAINABLE DEVELOPMENT © OECD 2018OVERVIEW: TIME TO FACE THE CHALLENGE │
OECD countries since 2010, spurred by conflicts and economic hardship, have been
accompanied by steadily increasing remittance volumes. These reached USD 466
billion in 2017, about three times the value of official development assistance (ODA).
Technology: The overall effect of technological change on trade and FSD is still to be
determined. What, for instance, will be the balance between jobs lost to automation
and new jobs created? Is it within reach for all developing countries to leapfrogging
into a service economy? How fast will new instruments and more tools, such as
mobile payment of utility bills or taxes, improve domestic resource mobilisation?
The growing gap in financing for sustainable development is a global threat
Remittances flows are steadily growing while other essential sources of
financing for sustainable development are declining
In terms of individual flows of finance to developing countries, the drops in domestic
private investment and foreign direct investment (FDI) are major causes for concern.
Remittances have remained on an upward trend but mostly support household
consumption and thus will not compensate for an eventual loss of jobs and
government revenue. ODA also remains steady but is falling short of international
commitments (Table 0.2).
Table 0.2. Individual trends in sources of sustainable development finance: A mixed
picture
Worrying trends Encouraging trends
Domestic resource mobilisation – (public) Philanthropy – USD 8 billion a year on average
Tax revenue to GDP ratio (at 14% in (2013-15)
LDCs/LICs) still below the 15% recommended
threshold; (private) domestic private
investment in decline.
Private sector – M&A flows to developing Remittances – Record high USD 466 billion in
countries started to decline in 2012, followed 2017
by a 11% drop in FDI in 2016 and in project
finance in 2018 (-30% in the first semester). By
contrast, amounts mobilised by ODA, while still
limited, have rapidly increased.
Official assistance
Development Assistance Committee (DAC) bilateral assistance – USD 167 billion in 2017. USD
146.6 billion was concessional, or 0.31% of GDP (short of the 0.7% objective) and slightly dropping
0.6% compared to 2016 (+1.1% excluding drop of in-country refugee costs).
Non DAC – USD 6.9 billion in 2015.
The revenue of governments is the central pillar of the FSD system (Figure 0.1). In 2016,
tax revenues in developing countries amounted to USD 4.3 trillion, more than double cross-
border flows in the same year. Yet more revenue is needed. The tax revenue-to-GDP ratios
in low-income countries (LICs) and least developed countries (LDCs) average 14% and
remain below the 15% threshold that is increasingly recommended as a minimum
benchmark for effective state functioning. Tax revenues represented 42.7% of the overall
finance mix in LDCs, compared to 78.2% in upper middle-income countries (UMICs).
Domestic private investment is the main source of capital formation in most countries, but
by some measures it has been declining. For example, the volume of mergers and
acquisitions (M&As), a key measure of vibrancy in an economy, dropped by 60% in
GLOBAL OUTLOOK ON FINANCING FOR SUSTAINABLE DEVELOPMENT © OECD 2018│ OVERVIEW: TIME TO FACE THE CHALLENGE
developing economies (excluding China ) between 2010 and 2017, from USD 237 billion to
USD 95 billion.
Figure 0.1. On average, tax revenues are the largest financial resource for all developing
countries regardless of income category
USD billion, 2016
Note: The estimates have been calculated for the list of developing countries eligible for ODA but exclude
a number of countries and territories because of lack of data on tax revenue. Those excluded are the
following low-income countries (LICs): Democratic People's Republic of Korea; Somalia, which is also a
least developed country ([LDC]); and South Sudan (also an LDC).
Among lower middle-income countries and territories (LMICs), the following are excluded: Bhutan
(LDC), Kosovo, Mongolia, Myanmar (LDC), Sri Lanka, Syrian Arab Republic, Vanuatu (LDC), West
Bank and Gaza Strip. The third group to be excluded are upper middle-income countries (UMICs): Cuba,
Fiji, Former Yugoslav Republic of Macedonia, Libya, Montenegro, Nauru and Venezuela.
Source: (IMF, 2017[7]), “World revenue longitudinal data”, https://data.world/imf/world-revenue-
longitudinal-dat; and (OECD, n.d.[8]), “Global revenue statistics” (database),
https://stats.oecd.org/index.aspx?DataSetCode=REV; (OECD, 2018[9]), Creditor Reporting System,
https://stats.oecd.org/Index.aspx?DataSetCode=crs1; (World Bank, 2018[10]), “Migration and remittances
data”, http://www.worldbank.org/en/topic/migrationremittancesdiasporaissues/brief/
migration-remittances-data; (IMF, 2018[2]), “Balance of payments statistics 2017”,
http://www.imf.org/external/datamapper/datasets/BOP for private investment data.
StatLink 2 https://doi.org/10.1787/888933852635
International actors, both public and private, contribute substantive amounts of
cross-border finance to developing countries. The volume of external finance available
to developing countries has substantially increased to USD 1.7 trillion in 2016 from
USD 675 billion in 2000. But recent trends are sobering, with total external finance
declining by 12% between 2013 and 2016 (Figure 0.2).
GLOBAL OUTLOOK ON FINANCING FOR SUSTAINABLE DEVELOPMENT © OECD 2018OVERVIEW: TIME TO FACE THE CHALLENGE │
Figure 0.2. External financing to developing countries (2000-16)
2016 USD billions, constant prices
2000
1800
1600
1400
1200
1000
800
600
400
200
0
2000 2001 2002 2003 2004 2005 2006 2007 2008 2009 2010 2011 2012 2013 2014 2015 2016
Bilateral Multilateral Remittances FDI
Portfolio investments Long-term debt Short-term debt
Source: Author’s calculations based on OECD (2018[11]), “Creditor Reporting System” (database),
https://stats.oecd.org/Index.aspx?DataSetCode=crs1 for official bilateral and multilateral flows; World Bank
(2018[10]), “Migration and remittances data” http://www.worldbank.org/en/topic/
migrationremittancesdiasporaissues/brief/migration-remittances-data for remittances; IMF (2018[2]), “Balance
of Payments database”, http://www.imf.org/external/datamapper/datasets/BOP for FDI, portfolio investments,
and long-term and short-term debt.
StatLink 2 https://doi.org/10.1787/888933852711
The private sector provides the bulk of cross-border finance, but is in decline
(Figure 0.3). Commercial investors are the single largest provider, with around
USD 750 billion in foreign direct investment (FDI) and portfolio investment. A
30% drop in FDI to developing countries over 2016-17 is cause for alarm, not only
because it implies a substantive decline in financing but also because it means fewer
opportunities for developing countries to access international markets and technical
know-how. Trade stalled in the aftermath of the 2008-09 crisis and bounced back in
2017 on the back of better growth forecasts (4.7% growth in world merchandise trade
volume compared to 1.8% growth in 2016). Trade remains subject to protectionist
tensions and possible related setbacks, with growth forecast to slow to 3.9% in 2018
and 3.7% in 2019, subject to the issues of trade tensions and a loss of momentum
(World Trade Organization, 2018[12]).
Migrants from developing countries are an important provider of FSD and the least
volatile. They sent home a record USD 466 billion of remittances in 2017. In some
countries, they make up as much as 30% or more of GDP, as in Tajikistan, Kyrgyzstan
and Tonga.
GLOBAL OUTLOOK ON FINANCING FOR SUSTAINABLE DEVELOPMENT © OECD 2018│ OVERVIEW: TIME TO FACE THE CHALLENGE
Philanthropic foundations are emerging as increasingly important providers. They
provide smaller volumes of financing than many other actors, USD 24 billion for the
period 2013-15 (an average of USD 8 billion per year) but philanthropies are key
players in the health sector and sometimes pioneer innovative financing solutions.
Public sector or official providers, with combined resources amounting to
USD 311 billion in 2016, play a special role in targeting poverty reduction and the
most vulnerable countries. Since 2000, financing provided at below market rates or
concessional terms grew fastest for the group of low-income countries and fragile and
conflict-affected countries and territories. Among official providers, emerging
economies such as China play an increasing role.
Figure 0.3. Private investment inflows as a share of GDP in developing countries are
declining
% GDP
9
8
7
6
5
4
3
2
1
0
2000 2001 2002 2003 2004 2005 2006 2007 2008 2009 2010 2011 2012 2013 2014 2015 2016
LIC LMIC UMIC LDC
Source: Authors’ calculations based on (IMF, 2017[13]), “Balance of Payments” (database),
http://www.imf.org/external/datamapper/datasets/BOP; (IMF, 2018[14]), “World Economic Outlook”
(database), https://www.imf.org/external/pubs/ft/weo/2018/01/weodata/index.aspx.
StatLink 2 http://dx.doi.org/10.1787/888933852768
All nations need sustainable development globally to achieve more inclusive
growth at home
At the same time that resources for the sustainable development of developing
countries are diminishing, rapid global population growth, environmental degradation,
and persistent levels of fragility and conflict are putting upward pressure on financing
needs. The resulting scissor effect dramatically compromises the global ambitions of
the 2030 Agenda. Stress on financing capacities could result in a vicious circle that
effectively slows progress towards the SDGs through increased negative externalities
of non-inclusive or non-sustainable growth, the temptations of protectionism and
isolationism, and ultimately fewer resources for financing for sustainable
development.
GLOBAL OUTLOOK ON FINANCING FOR SUSTAINABLE DEVELOPMENT © OECD 2018OVERVIEW: TIME TO FACE THE CHALLENGE │
Countries at all levels of development would bear the cost of this vicious circle.
Achieving the SDGs may be primarily a domestic agenda, but the world is
interconnected and interdependent. Individual results, and the cost of achieving them,
depend on collective results. For example, collective failure to reduce negative
externalities in global migration, health or climate issues would not only slow human
progress in developing countries. It also would affect richer economies and
disproportionally harm the well-being of their more modest citizens. The stark
takeaway of this scenario is that OECD countries will not be able to achieve more
inclusive growth at home without more sustainable development globally. However,
increased global connectedness also means that a virtuous circle of development is
possible (Figure 0.4). Resources spent on achieving the SDGs in developing countries
are an investment in OECD members’ own sustainable and inclusive growth and their
capacity to achieve the SDGs at home.
Figure 0.4. Transforming the vicious circle into a virtuous circle
Source: Authors
The development crisis looming in consequence of such a scissor effect – that is, less
FSD at a time of mounting FSD needs – calls for macroeconomic policies to reverse
the downward global trends in growth, trade and investment in order to mobilise more
resources than are currently available. Yet short-term or medium-term relief of these
stressors is uncertain at best and focusing solely on mobilising additional domestic and
foreign and public and private resources is unlikely to be sufficient.
Defaulting on the promises of 2015, however, is unacceptable. This is why the FSD
system urgently needs to be reformed to enhance the sustainable development
footprint of each actor and each dollar spent. The international community is aware, as
demonstrated by the recent shift in priorities for the FSD agenda from mobilising, or
growing resources, to maximising them, or making the most of existing and future
additional resources through the AAAA’s holistic approach (Box 0.2).This requires a
better understanding of interactions among the various actors and instruments that
could lead to increased co-ordination and coherence. The growing complexity of the
FSD system greatly complicates the task of policy makers.
GLOBAL OUTLOOK ON FINANCING FOR SUSTAINABLE DEVELOPMENT © OECD 2018│ OVERVIEW: TIME TO FACE THE CHALLENGE
Box 0.2. From mobilising new resources (billions to trillions) to maximising the impact of
available resources (shifting the trillions)
The language and practice of major institutional sustainable development finance
actors have evolved. In the 2015 report (African Development Bank et al.[15]), the
Development Committee, From Billions to Trillions: Transforming Development
Finance, multilateral financial institutions committed “to promote and catalyse private
investment, addressing risk and uncertainty, helping to mobilize and scale up
resources and co-investment from traditional, institutional and other public and private
investors”.
A 2017 report for the Development Committee moved to the concept of what it calls
maximising finance for development, echoing the shift set out in Forward Look – A
Vision for the World Bank Group for 2030” (World Bank, 2018[10]). This latter report
introduced what is being called the cascade approach and argued for focusing on the
quality, and ultimately impact, of development finance rather than only its quantity
(i.e. amounts). It further proposed making better use of the interactions of the various
actors and sources of finance for sustainable development. One example of this would
be to create incentives for the channelling of migrants’ remittances towards productive
investment rather than final consumption, thereby opening opportunities for new
economic linkages between firms locally and broadening the tax base in the receiving
countries. Actions on different levels from finance providers to regulators would be
required.
Going from billions to trillions can appear daunting – to the extent that it may
discourage further budgetary efforts in difficult macroeconomic contexts. But shifting
the trillions acknowledges that most of said trillions in potential sustainable
development finance are already there, in the global economy, but need to be better
targeted to sustainable and inclusive growth. For example, governments spend
USD 500 billion in fossil fuel subsidies that, rather than supporting the SDGs,
encourages damage from the use of oil, gas and coal at an estimated cost of nearly
USD 5.3 trillion. Shifting this half-trillion to more sustainable uses would have
tremendous, positive knock-on effects on sustainable development.
The financing for sustainable development system has grown more complex,
leaving the international community unsure how to undertake its reform
Once concentrated on international aid, the international co-operation agenda has
moved to development finance and now towards financing for sustainable
development. With this shift has come a great expansion of the number and diversity
of financial actors who are called upon by the international community in Monterrey
and Addis Ababa to play a part. These include taxpayers, private investors, diaspora
communities, donors and philanthropic actors, among others, all of whom bring their
own rationales, roles, resources, instruments, incentives and intermediary objectives
and whose distinct contributions to sustainable development derive from their
respective and diverse comparative advantages. Their contributions are all very
different in nature and have different effects. Sustainable development, though, is not
about simply adding all these up. For example, it is one thing to enlist private firms
and emigrant remitters onto the roster of FSD suppliers. It is another to understand
how much of their investment and spending actually affects sustainable development
GLOBAL OUTLOOK ON FINANCING FOR SUSTAINABLE DEVELOPMENT © OECD 2018OVERVIEW: TIME TO FACE THE CHALLENGE │
positively. What is more, the growing diversity of instruments – concessional,
non-concessional and mixed – makes it harder for developing countries to craft the
optimal FSD mix that matches their needs. Finally, as countries develop, their FSD
needs change over time, as does their capacity to access certain resources such as
ODA. This complexity in turn complicates the work of policy makers to chart and
agree on a reform path for the FSD system.
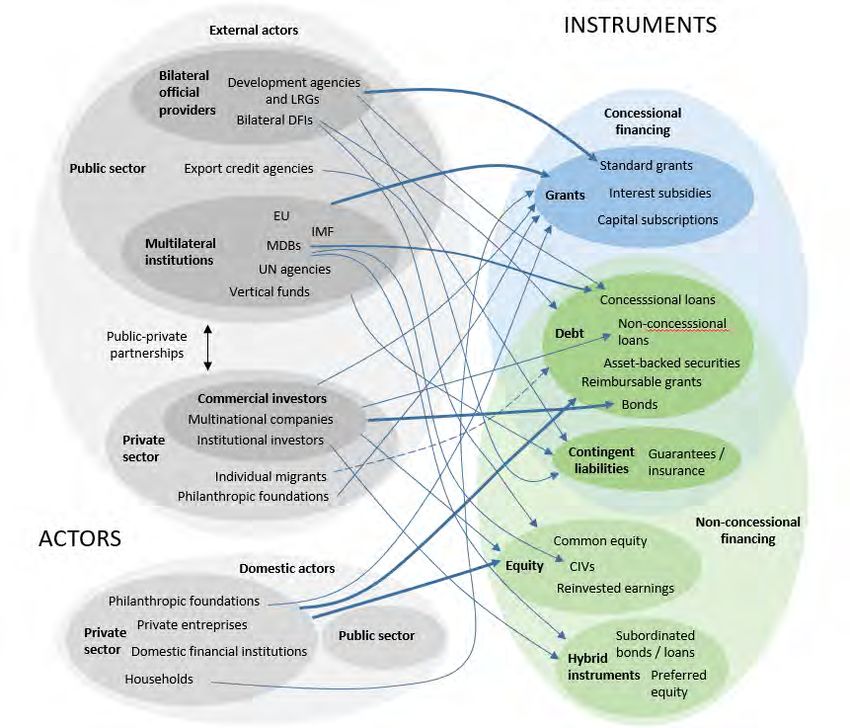
New financial instruments and their interactions add to the complexity, but
have yet to mobilise significant new resources
The multiplication of actors and openness to innovation have led to the use of more
diverse instruments in the FSD market (Figure 0.5). The expansion has contributed to
opportunities for more choices and better tailoring of solutions to developing
countries’ needs. At the same time, this profusion of choices, when combined with
some asymmetry of information, risks adding another layer of complexity to the
system. In consequence, further efforts to map and classify instruments are needed.
Countries’ needs (demand side) rather than the preference of providers (supply side)
should drive the choice of instruments. Responses to the Global Outlook Survey on
Financing for Sustainable Development demonstrate that this is not yet the case,
however (Chapter 3).
Figure 0.5. The spaghetti bowl of FSD instruments
Source: Authors
GLOBAL OUTLOOK ON FINANCING FOR SUSTAINABLE DEVELOPMENT © OECD 2018│ OVERVIEW: TIME TO FACE THE CHALLENGE
As the number of actors increases, so does the number of possible combinations of
resources. Ideally, a well-functioning system would help to leverage actors’ respective
comparative advantages and maximise their collective contribution to sustainable
development, thus transforming what has been termed the landscape of largely
uncoordinated actors into a more harmonious financing system. This would allow
developing country governments to build their own optimal financing mix in support
of their efforts to implement the SDGs. In reality, however, the FSD system is a very
complex place to navigate, and finding the optimal financing mix is challenging.
The multitude of financing approaches available is a complicating factor. There are
more than 1 000 FSD instruments to choose from. Official FSD providers increasingly
show interest in new instruments such as mezzanine finance, often with the intention
to mobilise private sector investors. Between 2000 and 2016, bilateral providers set up
167 facilities with a combined size of approximately USD 31 billion to engage in
blended finance transactions that are designed to involve the private investors in
development finance operations.
Innovation is taking place at a fast pace, with a plethora of new instruments, but it has
yet to achieve its full potential. The actual volumes raised through innovative
approaches, while on the rise, are still very small, both in absolute and relative terms.
Besides, if not properly introduced, innovation could add yet another layer of
complexity to financing decisions even if it enables FSD actors to choose among a
wider range of available approaches. Bringing innovation to scale to harness its
potential for sustainable development calls for a learning process with investment in
capacities.
Finally, the different resources interact with each other, creating potential synergies as
well as trade-offs that add more complexity. A lack of understanding of these
interlinkages can result in inefficient policies. For example, with regard to trade-offs,
developing countries frequently use tax incentives to attract foreign investment
without paying enough attention to whether these policies will indeed help to trigger
significant investment flows and compensate for domestic resource losses. Over 80%
of low-income and lower middle-income countries offer tax holidays and tax
exemptions on investment. But tax incentives often are not among the most important
factors in investment and location decisions. More research on interactions can inform
policy choice for developing country governments and for official providers who can
provide targeted support for policy areas with the greatest catalytic effect.
The demand of developing countries for financing for sustainable development
evolves over time, but supply cannot always respond
As countries transition from one category of income-per-capita to the next, their needs
(demand) and the mix of resources available to public and private actors (supply)
change. For example, countries exiting the OECD Development Assistance
Committee (DAC) list of recipients cease to be eligible for ODA yet may still be
unable to use alternative, costlier sources to finance some of their pressing
development needs. Complementarities of resources at different stages of transition are
yet to be fully explored and understood.
The development community needs to more systematically review and adjust FSD
mixes to different transition contexts. For example, while tax revenues are slightly less
than half the volume of total financing for low-income countries, they make up more
than 70% for lower middle-income countries and around 90% for upper middle-
GLOBAL OUTLOOK ON FINANCING FOR SUSTAINABLE DEVELOPMENT © OECD 2018OVERVIEW: TIME TO FACE THE CHALLENGE │
income countries. Among cross-border resources, the financing mix changes as well.
While private flows represent around 30% of cross-border resources in LICs, they
represent almost 70% for the wealthiest UMICs. (Figure 0.6). Developing country
governments have to manage the transition process with timely and well-coordinated
policies to promote domestic resource mobilisation and attract foreign investment. For
official FSD providers, who can support developing country governments in targeting
an optimal financing mix, this means that the phasing out of development finance has
to be carefully managed in co-ordination with the increase in other sources.
Figure 0.6. Financing resources available to developing countries, 2012-16
2015 prices
90% 12
11
Type of external flows / total external flows
80%
10
70%
9
60% 8
7
Tax revenues / total external flows
50%
6
40%
5
30% 4
3
20%
2
10%
1
0% 0
0 1000 2000 3000 4000 5000 6000 7000 8000 9000 10000 11000 12000
Low-income Lower-middle Upper-middle
countries income countries income countries
ODA(ODA
Poly. (% (%
of oftotal external
external flows, left)
finance)) OOF(OOF
Poly. (% of
(% total external
of external flows, left)
finance))
Private
Poly. market
(Private marketfinance (%ofofexternal
finance (% total external
finance)) flows, left) Remittances
Poly. (Remittances(%
(%ofof total external
external finance))flows, left)
Tax revenues
Linear / total
(Tax revenues (% ofexternal
GDP)) flows (right)
Note: The resources include concessional flows (ODA), non-concessional flows (OOF), private flows
(foreign direct investments, private securities, and claims from banks and other sources such as bonds,
equity, etc.), and remittances.
Sources: OECD calculations based on (OECD, 2018[9]), “Creditor Reporting System” (database),
https://stats.oecd.org/Index.aspx?DataSetCode=crs1 for official bilateral and multilateral flows; (World
Bank, 2018[10]), “Migration and remittances data”
http://www.worldbank.org/en/topic/migrationremittancesdiasporaissues/brief/migration-remittances-data
for remittances data; (IMF, 2018[2]), “Balance of payments statistics”
http://www.imf.org/external/datamapper/datasets/BOP for private market finance (FDI, portfolio
investments and long-term and short-term debt).
StatLink 2 https://doi.org/10.1787/888933852996
GLOBAL OUTLOOK ON FINANCING FOR SUSTAINABLE DEVELOPMENT © OECD 2018│ OVERVIEW: TIME TO FACE THE CHALLENGE
Towards a more efficient global system of financing for sustainable development
The stress on sources of FSD for developing countries will not be easily lifted or
reversed. To achieve the SDGs, a systemic change is needed. The
Monterrey Consensus and the Addis Ababa Action Agenda have shown the way by
calling for a holistic approach (Box 0.1) that promotes efforts to not simply increase
but to maximise financing, i.e. to enhance the development impact of existing and
future additional resources by using them more effectively and making the most of
their interactions.
Now, three years into the 2030 Agenda for Sustainable Development and the AAAA,
it is time to ask how successfully this new approach has been implemented. Have silos
among actors or AAAA action areas been broken? Has the promise of this holistic
approach been fully harnessed in terms of new scaling-up opportunities and
interactions and dynamic effects? Have risks associated with the emergence of new
actors and the use of new instruments and modalities been fully measured and
addressed?
The answer of this Global Outlook is a qualified “no”. In the absence of a clear
mapping of the different actors’ respective roles, resources, types of instruments, etc.,
the FSD system has in fact become harder to navigate, especially for developing
countries. Its amorphous character also presents a risk of dilution of responsibilities in
designing and implementing the necessary reforms.
One way of better grasping the complexity is to step back, and take a fresh look at the
system as a market – one where the demand for more and better investment in
sustainable development must be met by a variety of current and potential suppliers
(Box 0.3). This analogy, for all its faults and merits, reveals an imperfect, immature
market that needs more transparency, better regulation and more efficient
co-ordination.
This report is meant to send a wake-up call to actors in the FSD market. It urges policy
makers to accelerate its reform and highlights three priority areas:
Better measurement of FSD flows and their impact to reduce information gaps
for actors in the market. Traditionally, the international community including
the OECD has focused on measuring the flows. Little is known about the
needs, the gaps, and the impact or development footprint of those flows. One
dollar spent on polluting activities is still counted the same way as one dollar
spent on clean energies. A culture of evaluation and impact needs to be
developed and put in place.
New policies to regulate the market and direct a greater share of public and
private investment towards sustainable development. This means maximising
the opportunities – i.e. using a holistic approach to shift the trillions to the
SDGs – and minimising the risks by regulating the FSD system to increase its
transparency and efficiency.
Better implementation of the holistic approach called for in Monterrey and
Addis Ababa to achieve better co-ordination amongst actors in the market,
especially at country level where the global goals are to be achieved. Country
development strategies need to be better linked with available domestic and
external financing. This requires better co-ordination at all levels, from global
to local, while simultaneously taking into account sector-specific and
policy-specific needs (e.g. climate and gender).
GLOBAL OUTLOOK ON FINANCING FOR SUSTAINABLE DEVELOPMENT © OECD 2018OVERVIEW: TIME TO FACE THE CHALLENGE │
Box 0.3. Towards a market of financing for sustainable development?
A market is a system where parties engage in an exchange in more or less
spontaneous or structured ways. It is driven by the basic forces of supply
and demand that it matches up more or less efficiently.
The financing for sustainable development (FSD) system, on many
counts, increasingly shows the characteristics of a market. On the demand
side are the SDG financing needs – a demand for financing sustainable
development projects that is put at several trillions of dollars in investment
in developing countries alone. This demand is spread across the world
since the SDGs are universal.
On the supply side are global savings that could be channelled through
public or private investment towards sustainable development projects.
Supply can take many forms due to the variety of intermediaries:
taxpayers’ money is channelled through ODA, for instance; shareholders’
money is channelled through sustainable business investments;
pensioners’ and investors’ money is channelled through financial
institutions; and so on.
The market analogy might surprise those who see generosity as the
essence of development co-operation. Looking at FSD through this
perspective, though, does not undermine or devalue generosity. On the
contrary, the analogy helps reappraise the role of development
co-operation in light of market failures and the need to supply financing
for sustainable development on more concessional terms in sectors or
countries where the price established by the market is too high for the
demander – e.g. in fragile contexts.
Global savings largely exceed the estimated SDG financing needs. The
demand for FSD, however, is competing with demand for other types of
financing that might have a higher short-term return (e.g. pecuniary) but a
lower, unassessed or adverse long-term impact on sustainable
development. For example, investment in fossil fuel represents more than
twice the value of total climate investment. The case for FSD still needs to
be made. In addition, the relative share of FSD in total finance needs to
increase. But to do so, it is necessary to distinguish the share of finance
that effectively promotes more sustainable development from the share
that does not or that aggravates economic, social and environmental
outcomes. Hence the need for better measurement of impact.
As a result, a global SDG financing gap remains or, in market terms, some
of the demand for FSD is unsatisfied. The SDG financing challenge then
turns on mobilising more resources (increasing supply) and, more
importantly, remedying market failures by redirecting resources towards
the unsatisfied demand. This might require a better structuring of the FSD
market, first through increasing transparency and efficiency to avoid, for
instance, asymmetry of information and second, by creating policy
incentives to guide savings towards FSD gaps.
GLOBAL OUTLOOK ON FINANCING FOR SUSTAINABLE DEVELOPMENT © OECD 2018│ OVERVIEW: TIME TO FACE THE CHALLENGE
Better measurement of flows, alignment with the SDGs and impact is the first
step towards reforming the FSD system
Measurement is the first step to setting goals and targets and, ultimately, to defining
strategies and policies that maximise development impact and accelerate progress
towards the SDGs. Accurate and timely data are essential to ensuring transparency and
accountability of all actors in the provision of financing towards collective ambitions
including poverty eradication and peaceful societies.
So far, measurement efforts have focused on monitoring ODA flows and the target of
0.7% of the gross national income (GNI) of donors. By including new actors in the
picture, the AAAA has greatly expanded the need for measurement and, by extension,
the challenges that accompany measurement – notably that not every dollar invested
has the same sustainable development impact. There is still little measuring of
sustainable development impact, however, especially as concerns several major actors
including institutional investors who are managing trillions in potential financing.
To achieve the ambitions of the AAAA, the measurement of financing for sustainable
development must overcome three challenges (Figure 0.7). The first is measuring the
flows to determine the pace of FSD. The second is mapping the resources for the
SDGs to see if the direction of FSD is right. The third challenge is measuring impact.
This report concludes that some progress has been done on the first while little
progress has been made on the second and even less on the third.
Figure 0.7. Addressing financing for sustainable development measurement challenges:
A three-pronged approach
Source: Author
Measuring all resources in support of sustainable development requires new
mechanisms and measures
What volume of resources actually flows to developing countries once all the actors
and sources identified in the AAAA are taken into account? The development
community’s capacity to answer this basic question remains very limited. The AAAA
may have set a destination and even a direction, but FSD actors have been navigating
without a compass.
GLOBAL OUTLOOK ON FINANCING FOR SUSTAINABLE DEVELOPMENT © OECD 2018You can also read