Global scenarios of irrigation water abstractions for bioenergy production: a systematic review
←
→
Page content transcription
If your browser does not render page correctly, please read the page content below
Hydrol. Earth Syst. Sci., 25, 1711–1726, 2021
https://doi.org/10.5194/hess-25-1711-2021
© Author(s) 2021. This work is distributed under
the Creative Commons Attribution 4.0 License.

Global scenarios of irrigation water abstractions
for bioenergy production: a systematic review
Fabian Stenzel1,2,3,4 , Dieter Gerten1,2,3 , and Naota Hanasaki5
1 Potsdam   Institute for Climate Impact Research (PIK), Member of the Leibniz Association,
P.O. Box 60 12 03, 14412 Potsdam, Germany
2 Department of Geography, Humboldt-Universität zu Berlin,

Unter den Linden 6, 10099 Berlin, Germany
3 Integrative Research Institute on Transformations of Human-Environment Systems (IRI THESys),

Humboldt-Universität zu Berlin, 10099 Berlin, Germany
4 Water program, International Institute for Applied Systems Analysis (IIASA), Schlossplatz 1, 2361 Laxenburg, Austria
5 Center for Climate Change Adaptation, National Institute for Environmental Studies,

16-2 Onogawa, Tsukuba, Ibaraki 305-8506, Japan

Correspondence: Fabian Stenzel (stenzel@pik-potsdam.de)

Received: 2 July 2020 – Discussion started: 6 July 2020
Revised: 18 January 2021 – Accepted: 31 January 2021 – Published: 6 April 2021

Abstract. Many scenarios of future climate evolution and           bioenergy should be an integral part of global assessments
its anthropogenic drivers include considerable amounts of          of freshwater demand and use. For interpreting and compar-
bioenergy as a fuel source, as a negative emission technol-        ing reported estimates of possible future bioenergy water ab-
ogy, and for providing electricity. The associated freshwater      stractions, full disclosure of parameters and assumptions is
abstractions for irrigation of dedicated biomass plantations       crucial. A minimum set should include the complete water
might be substantial and therefore potentially increase water      balances of bioenergy production systems (including parti-
limitation and stress in affected regions; however, assump-        tioning of blue and green water), bioenergy crop species and
tions and quantities of water use provided in the literature       associated water-use efficiencies, rainfed and irrigated bioen-
vary strongly. This paper reviews existing global assessments      ergy plantation locations (including total area and meteoro-
of freshwater abstractions for bioenergy production and puts       logical conditions), and total biomass harvest amounts. In
these estimates into the context of scenarios of other water-      the future, a model intercomparison project with standard-
use sectors. We scanned the available literature and (out of       ized parameters and scenarios would be helpful.
430 initial hits) found 16 publications (some of which in-
clude several bioenergy-water-use scenarios) with reported
values on global irrigation water abstractions for biomass
plantations, suggesting water withdrawals in the range of          1   Introduction
128.4 to 9000 km3 yr−1 , which would come on top of (or
compete with) agricultural, industrial, and domestic water         Previous assessments of global green and blue water require-
withdrawals. To provide an understanding of the origins of         ments of a potential widespread bioenergy industry show
this large range, we present the diverse underlying assump-        a large variation in the estimates (withdrawals of 128.4–
tions, discuss major study differences, and calculate an in-       9000 km3 yr−1 ; De Fraiture et al., 2008; Hejazi et al., 2014),
verse water-use efficiency (iwue), which facilitates compari-      while there is still insufficient analysis of the underlying
son of the required freshwater amounts per produced biomass        sources of variation and assumptions that need to be stan-
harvest. We conclude that due to the potentially high water        dardized.
demands and the tradeoffs that might go along with them,              Projections of future energy demand and its partitioning
                                                                   increasingly assume replacement of carbon-intense fossil en-

Published by Copernicus Publications on behalf of the European Geosciences Union.
1712                           F. Stenzel et al.: Global scenarios of irrigation water abstractions for bioenergy production

ergy carriers with biomass, which could provide carbon-            tivity for reaching ambitious climate targets might promote
neutral electricity or fuels (Nakićenović et al., 1998; Rose     irrigation to reduce land requirement tradeoffs with, e.g.
et al., 2014; Bauer et al., 2018). However, in order to limit      food production. This however would happen at the expense
mean global warming to 2 ◦ C or even 1.5 ◦ C (UNFCCC,              of freshwater ecosystems (Poff and Zimmerman, 2010) and
2015), technologies providing additional negative emissions        human societies in terms of increased overall water stress
(NEs) are potentially needed to compensate for residual and        (Schewe et al., 2014) or lead to unwanted modification of
past emissions (Rockström et al., 2017; Minx et al., 2018;         terrestrial water cycling (Vervoort et al., 2009). Additional
Rogelj et al., 2018). One such NE technology (NET) is              investment in irrigation systems would be required (Hogan
bioenergy with carbon capture and storage (BECCS). Bioen-          et al., 2007), which might, however, become economically
ergy utilizes plant photosynthetic capacity to make available      feasible due to an increased value of biomass through car-
energy from sunlight in biomass, whereby CO2 is extracted          bon pricing (Bauer et al., 2018). Li et al. (2018) report at
from the atmosphere but at the same time water is transferred      least 15 % (and potentially much more due to most studies
from soil to the atmosphere in the process of evapotranspira-      not reporting this parameter) of field experiments with ligno-
tion. Due to the large amount of potentially needed NEs in         cellulosic bioenergy crops to be irrigated.
the second half of the century (e.g. 3.3 GtC yr−1 reported by         Additionally, the process chain from biomass to NEs re-
Smith et al., 2016 and 2–5 GtC yr−1 reported by Rogelj et al.,     quires water as well but has rarely been quantified (e.g. in
2015), the feedstock is projected to be grown on large man-        Smith et al., 2016). This might be because large-scale CCS
aged plantations and include substantial irrigation, demand-       is not yet in place and the process of conversion to energy
ing tradeoffs between negative emissions and area require-         and subsequent long-term storage is usually not modelled in
ments as well as water consumption to be solved sustainably.       detail by the existing models. One exception is Fajardy et al.
   Suggested energy carriers for BECCS are either energy-          (2018), who also include polluted (“grey”) water from the
rich plant organs (e.g. rapeseed, oil palms, sugarcane) to         biomass processing chain.
be directly converted to biofuels (first-generation bioenergy)        Review studies on the potentials of BECCS and other NE
or lignocellulosic biomass from fast-growing plants such           technologies (e.g. Creutzig et al., 2015; Smith et al., 2016 and
as maize, Miscanthus, switchgrass, willows, or Eucalyptus          Fuss et al., 2018), have so far not provided a comprehensive
(Yuan et al., 2008; Soccol et al., 2016), i.e. second-generation   overview of the associated freshwater abstractions (besides
bioenergy. These diverse plants have different growth rates,       their precursory mentioning).
preferred climatic zones, and – depending on the location             The suggested large quantities of blue water withdrawals
where they are projected to be grown – different freshwater        and/or consumptions assumed for BP irrigation in the litera-
demands (King et al., 2013).                                       ture, which may occur in competition with other water uses
   While burning of fossil energy carriers leads to (net pos-      and may increase water stress in relatively water-scarce re-
itive) emissions of greenhouse gases, use of biomass is net        gions where BPs are considered, motivate a comprehensive
neutral apart from land-use and process-chain emissions (Al-       understanding and quantification of their intrinsic water re-
Ansari et al., 2017). Thus, use of bioenergy can offset other      quirements (Hejazi et al., 2015; Wada et al., 2014). Thus,
carbon-intensive means of energy generation, such as coal,         the subject of the present paper is to fill this knowledge
gas, or oil (Gough et al., 2018; Fajardy and Mac Dowell,           gap and systematically review the current literature on pro-
2017). To provide respective NEs, bioenergy use needs to be        jected freshwater abstractions in global NE or energy scenar-
complemented by means of carbon storage. Proposed meth-            ios relying on BECCS or bioenergy. Additionally, we illus-
ods include pyrogenic carbon capture and storage (PyCCS;           trate how such global scale syntheses could be standardized
Werner et al., 2018; Schmidt et al., 2019), BECCS (Azar            in data requirements and formats, analytical frameworks,
et al., 2006; Lenton, 2010), or other long-term storage pre-       scopes of inference, supporting assumptions, and reconcili-
venting a release of the captured carbon back to the atmo-         ation across spatio-temporal scales.
sphere. For a comprehensive analysis of carbon capture tech-          The analysis is guided by the following questions:
nologies, see for example Markewitz et al. (2012).
   Bioenergy plantations (BPs) can be either completely rain-       1. What are the key modelling parameters and assump-
fed or partially irrigated. Plantations of the former type             tions of global bioenergy studies that affect the inherent
would completely depend on “green” precipitation water                 water demand projections? (Sect. 3.1 and 3.2)
stored in soils, while the latter additionally include more or      2. What are the global freshwater abstractions for irriga-
less pronounced use of “blue” water from lakes, rivers, reser-         tion of bioenergy plantations in the future as projected
voirs, and aquifers (Hoekstra et al., 2009; Fader et al., 2011;        in available global-scale studies? (Sect. 3.3)
Wang et al., 2017).
   The discussion for or against large-scale irrigation of BPs      3. How do amounts of freshwater abstractions for irri-
revolves around a set of economic and sustainability trade-            gated biomass plantations compare to other sectors?
offs, requiring a more comprehensive quantification of water           (Sect. 3.4)
use of bioenergy systems. The required high biomass produc-

Hydrol. Earth Syst. Sci., 25, 1711–1726, 2021                                       https://doi.org/10.5194/hess-25-1711-2021
F. Stenzel et al.: Global scenarios of irrigation water abstractions for bioenergy production                                  1713

    4. Is there a dependence between the simulated freshwa-        2.2   Calculating an inverse water-use efficiency (iwue)
       ter abstractions and the total global biomass production
       across studies? (Sect. 3.5)                                 Comparison of the literature values of water abstractions
                                                                   for BECCS is not straightforward because of the different
   The resulting literature corpus consists of 16 publications     assumptions studies made on important model parameters
containing a total of 34 scenarios. In principle one could also    and setups, as described in Sect. 3.2. Nevertheless, besides
include local or regional studies, but their numbers cannot        presenting the absolute global estimates of freshwater with-
be straightforwardly upscaled or compared with the global          drawal or consumption, we attempt to make the results of
studies due to a lack of site-specific data for plantation loca-   these studies directly comparable. The degree of assumed
tions in global studies. We separate quantities of blue water      bioenergy deployment varies strongly among studies. We
application on BPs into withdrawals (gross extraction from         thus relate the given freshwater abstractions to the absolute
rivers, lakes, reservoirs) or consumption (eventual evapo-         amount of biomass assumed to be grown. With this we quan-
transpiration, excluding return flows to the rivers and wa-        tify the estimated water abstractions per harvested biomass.
ter bodies that may occur after withdrawal). Existing studies      King et al. (2013) compute a similar “bioenergy water-use
are then compared regarding (a) the total global water vol-        efficiency at the farm gate” for several lignocellulosic bioen-
ume quantified as a component of the hydrologic cycle and          ergy species based on the yield of (bio)energy per hectare
(b) the global mean water-use efficiency per biomass pro-          per water volume evapotranspired. We extend this concept of
duced (iwue (inverse water-use efficiency) – the water ab-         local level water-use efficiency to the larger spatio-temporal
stractions per biomass produced; see Eq. 1) inferred from the      scale and apply it as an inverse (global) water-use efficiency
studies as a component of field-scale water management.            (iwue):
                                                                          "     #
                                                                                          water km3

                                                                            km3
2     Methods                                                      iwue            =                          .                (1)
                                                                            GtC       biomass harvest [GtC]
2.1    Literature search query                                     For the analysis, we separate the scenarios into those that
                                                                   report water withdrawals or consumption per energy unit
We scanned the Web of Science and the SCOPUS database
                                                                   supplied from bioenergy (“energy studies”) and those that
on 5 February 2020 with a query covering all global BECCS
                                                                   report NEs along with estimates of related withdrawals or
and bioenergy studies that mention use, consumption,
                                                                   consumption (“NE studies”). From the energy studies, we
withdrawal, or demand of water in their abstract, keywords,
                                                                   backtrack the approximate dry biomass harvests by using the
or title and excluded studies which focused on algae or
                                                                   gross calorific value of 18.5 MJ kgDM−1 (Haberl et al., 2010;
electrofuels:
                                                                   Brosse et al., 2012). This is equivalent to 37 MJ kgC−1 or
("BECCS" OR "bioenergy production" OR
                                                                   37 EJ GtC−1 , with the average carbon content of dry biomass
"bioenergy cultivation" OR "biomass
                                                                   being 0.5 kgC kgDM−1 (Schlesinger and Bernhardt, 1991,
production" OR "biomass plantation*")
                                                                   p. 120) (Eq. 2).
AND (( "water" AND ("use" OR "demand"
OR "consumption" OR "withdrawal"))                                                                        energy [EJ]
OR "irrigation") AND ("global") NOT                                biomass harvestfrom energy [GtC] =                            (2)
                                                                                                          37 EJ GtC−1
("algae" OR "algal" OR "electrofuels").
   From the resulting 430 studies, we removed those that do        With this we approximate the initial biomass harvest from
not deal with BPs or BECCS at all, have only a regional            the reported bioenergy supply, however, neglecting losses
scope, or only give qualitative estimates of the freshwater ab-    during processing if they were considered. Note that using
stractions of large-scale BPs (going from title to abstract to     one value for carbon content of biomass is an oversimplifica-
full text). The global bioenergy studies with water consump-       tion; naturally, the value depends on the bioenergy crop type
tion values by King et al. (2013); Smith et al. (2016); Smith      (Ma et al., 2018). Therefore, for ideal comparability not only
and Torn (2013); Varis (2007); Séférian et al. (2018) were in-     the feedstock type but also the harvest shares would need to
cluded as supplementary “green water studies” in our corpus        be reported. For NE studies that document an assumed car-
because they did not consider irrigation, rather only rainfed      bon conversion efficiency (ceff ; the fraction of carbon from
biomass plantations (and CCS process water in the case of          biomass harvest that is eventually sequestered and removed
Séférian et al., 2018). We manually added the study by He-         from carbon cycling), we derive the dry biomass harvest by
jazi et al. (2014), which did not show up in the systematic        division of the NE amount by ceff (Eq. 3). Since transport
query described above. The resulting total of 16 “blue wa-         and other losses are usually contained in ceff , the inferred ini-
ter” publications (+5 “green water”) together with the main        tial biomass values for NE studies are probably more reliable
parameters are listed in Table 1. Noticeably, the majority of      than those for energy studies.
publications are very recent – only two of them were pub-                                             NE [GtC]
lished before 2010.                                                biomass harvestfrom NE [GtC] =                                (3)
                                                                                                        ceff

https://doi.org/10.5194/hess-25-1711-2021                                       Hydrol. Earth Syst. Sci., 25, 1711–1726, 2021
1714 F. Stenzel et al.: Global scenarios of irrigation water abstractions for bioenergy production
Table 1. List of publications with published key bioenergy parameters analysed in this review. See supplementary dataset (Stenzel et al.,
2021) for additional parameters and all scenarios per study.
Author Year Area Energy NE Year Water abstraction Water c_effc
(public.) [Mha] [EJ yr−1 ] [GtC yr−1 ] (scen.) [km3 yr−1 ] processb [%]
Blue water studies
Beringer et al. (2011) 2011 142–454 52–174 – 2050 1481–3880 cons –
Berndes 2002 – 304 – 2100 2281 cons –
Bonsch et al. (2016) a 2016 468–740 300 – 2100 3362–5860 wd 31–43
Boysen et al. (2017) a 2017 441 – – 2100 125–2536 cons 50
Fajardy et al. (2018) 2018 930 – 3.3 2016 5700 cons 33
De Fraiture et al. (2008) 2008 42.2 – – 2030 128.4 wd –
Gerbens-Leenes et al. (2012) 2012 – 71 – 2030 466 cons –
Heck et al. (2016) a 2016 1500 – – 2005 1344–1501 cons –
Heck et al. (2018) a 2018 778–870 151–233 1.2–5.4 2050 1525 cons 48–90
Hejazi et al. (2014) a 2014 596–8195 40–140 0–10 2095 1000–9000 wd 94
Hu et al. (2020) a 2020 431 – 3.1 2100 2260–11 350 cons 36–72
Humpenöder et al. (2018) 2018 636 300 – 2100 973–1211 cons –
Jans et al. (2018) a 2018 400–4300 200–2350 – 2015 1300–9000 cons –
Mouratiadou et al. (2016) 2016 511 400 – 2100 2700 wd –
Stenzel et al. (2019) a 2019 1072–1416 – 4.4–8.9 2100 351–2946 cons 50–70
Yamagata et al. (2018) 2018 250 – 2.9 2095 1910 cons 33
Green water studies
King et al. (2013) 2013 363–493 33–47 – 2050 1000 cons –
Séférian et al. (2018) 2018 – 220–270 – 2100 178 cons –
Smith and Torn (2013) 2013 218–990 – 1.0 2100 1600–7400 cons 47
Smith et al. (2016) 2016 100–200 – 3.3 2100 720 cons 100
Varis (2007) 2007 – 83.52 – 2050 2088 cons –
a Parameter ranges span several scenarios. b Consumption (cons), withdrawals (wd). c Carbon conversion efficiency.
Some studies also consider the residues from agriculture and mosphere, ocean, and biosphere, with comparably less pro-
forestry (Beringer et al., 2011; Fajardy et al., 2018), tim- cess detail regarding human management of the biosphere
ber harvest from land-use conversion (Heck et al., 2018; including BPs, integrated assessment models (IAMs) focus
Stenzel et al., 2019), municipal solid waste, or animal ma- on future developments of, e.g. land and water use based
nures (Beringer et al., 2011) as bioenergy feedstock. Respec- on biophysical and economic boundary conditions – explic-
tive amounts, however, are only reported in Beringer et al. itly accounting for decisions on BP locations and resource
(2011)). We may therefore overestimate the raw bioenergy use. In contrast, climate or land-use patterns are typically
harvests or conversely underestimate the water abstractions prescribed to vegetation or hydrological models, which in
per unit of biomass from dedicated BPs. turn usually operate at higher spatio-temporal resolution and
provide more process-based interactions, especially regard-
ing the simulation of water availability and withdrawal. If
3 Results and discussion deriving global estimates of BP freshwater withdrawal or
consumption is an aim of a study, more straightforward
3.1 Overview and computationally inexpensive estimations might suffice.
Value chain models might be best suited if the details of the
We synthesize the results from the 16 publications into 34
BECCS process chain are of most interest.
scenarios of freshwater abstractions for bioenergy (the full
The natural water availability in bioenergy modelling stud-
dataset is available in Stenzel et al., 2021). As freshwater ab-
ies is largely determined by the considered climate input,
stractions, we extract reported estimates of blue water con-
which in the case of projections for the future also varies
sumption or withdrawals, with a preference on consumption.
among the general circulation models used. In this regard,
The modelling approaches used are very different, with
local water abstraction projections might also be analysed
each model focusing on a different part of the BECCS de-
in terms of the projected climate-driven water availability
ployment process. While Earth system models (ESMs) dy-
changes in the respective region.
namically represent large-scale feedbacks between the at-
Hydrol. Earth Syst. Sci., 25, 1711–1726, 2021 https://doi.org/10.5194/hess-25-1711-2021F. Stenzel et al.: Global scenarios of irrigation water abstractions for bioenergy production 1715
There could be potential bias of the dataset due to one tions for BPs (here referred to as “demand-driven studies”)
model providing data for the majority (LPJmL; 9 out of 16 in- or have the aim to find the maximum energy (or NE) poten-
cluding studies based on the MAgPIE model that uses some tial within given constraints of available land, water restric-
input from LPJmL) of the studies; however, these studies also tions, or management (“supply-driven studies”). Examples of
differ in terms of land type and area used for bioenergy culti- the former category of studies are De Fraiture et al. (2008),
vation, irrigation management, or structural parameters (car- Mouratiadou et al. (2016), Humpenöder et al. (2018), and
bon conversion efficiency or bioenergy demand trajectory) as Stenzel et al. (2019) and of the latter category are Beringer
can be seen in the spread in Figs. 2, A2, and the supplemen- et al. (2011), Jans et al. (2018), and Fajardy et al. (2018).
tary data (Stenzel et al., 2021). Modelling framework. While Berndes (2002) and Hu et al.
All of the studies targeted in this review also consider (2020) derived their results mainly from meta-analyses of
rainfed plantations that depend solely on green water stored existing literature and approximations of global water con-
in the soil (with added irrigation if necessary); however, sumption by extrapolating current water-use efficiencies for
the amount of evapotranspired green water is only reported future energy demand scenarios, others are based on simula-
in a few of them. An overview of studies reporting global tions from quite sophisticated global process models of dif-
green water abstraction for bioenergy, which either do not ferent types. Bonsch et al. (2016), Mouratiadou et al. (2016),
consider irrigated BPs (Séférian et al., 2018; Smith and and Humpenöder et al. (2018) used the MAgPIE agroeco-
Torn, 2013; Smith et al., 2016) or do not specify where nomic model determining the water withdrawal or consump-
the source of the evapotranspired water (King et al., 2013; tion for BPs under different scenario constraints. Bonsch
Varis, 2007) is given in Fig. A3. According to these stud- et al. (2016) specifically investigated the tradeoffs between
ies, green water consumption of bioenergy ranges from 50 to area and water withdrawals by comparing rainfed and irri-
over 3000 km3 GtC−1 of biomass harvest. Since this review gated BPs, while Humpenöder et al. (2018) analysed envi-
focuses on blue water requirements, those estimates are not ronmental and socioeconomic indicators in bioenergy sce-
included in the main analysis. narios. The majority of studies considered here (Beringer
Focusing on the blue water abstractions allows us to di- et al., 2011; Heck et al., 2016; Boysen et al., 2017; Heck
rectly compare them in the light of competition with other et al., 2018; Jans et al., 2018; Stenzel et al., 2019) were
human water uses and those of aquatic ecosystems, poten- based on a single dynamic global vegetation model (DGVM),
tially increasing overall water stress. A useful objective of LPJmL, yet used different model setups and imposing varied
future studies would be a more comprehensive quantification constraints to water availability and use (biophysical poten-
of the water requirements of bioenergy systems, partition- tials from LPJmL were also used as input to MAgPIE-based
ing sources into green and blue pathways and identifying po- studies). The main study goals were global bioenergy poten-
tential means of increasing water-use efficiency and decreas- tials and the associated tradeoffs with global water consump-
ing blue water abstractions. However, the current review is tion, plantation area demand, or planetary boundaries.
timely since information on the relative magnitudes of green The water (and land) implications of increasing biofuel
and blue water demands of large-scale bioenergy implemen- production in the future were analysed in De Fraiture et al.
tation, relative to other social and environmental needs, is (2008) with the water-use model WaterSIM and in Gerbens-
needed now for the best decision-making and policy devel- Leenes et al. (2012) with the agricultural decision support
opment. tool CROPWAT. Yamagata et al. (2018) assessed the im-
pact of large-scale BECCS deployment on land use, water
3.2 Study differences in parameter choices and other resources, and ecosystem services using the global hydrolog-
assumptions ical model H08 together with the terrestrial ecosystem model
VISIT. Fajardy et al. (2018) base their analysis of the whole
Study type. According to our literature review, estimating fu- BECCS supply chain on the MONET value chain model,
ture global water abstractions of BPs is being approached while Hejazi et al. (2014) employ a combination of GCAM
with a variety of models and methodologies. Berndes (2002) (an IAM) in conjunction with the global hydrological model
uses projections based on measured evapotranspiration fluxes GWAM to quantify global water scarcity under several future
from field studies (e.g. Berndes and Borjesson, 2001) com- climate change scenarios.
bined with bioenergy demand scenarios (e.g. Nakićenović Bioenergy plantation area. The global potential plantation
et al., 1998, p. 72–75) to compute the global freshwater con- area identified as suitable for BPs differs hugely in size be-
sumption of BPs. Hu et al. (2020) use a similar approach by tween 42 Mha in De Fraiture et al. (2008) (only biofuels) and
inversely calculating biomass harvest demands for RCP2.6 8195 Mha in Hejazi et al. (2014), with the median area being
(Vuuren et al., 2011) for three scenarios of carbon conversion 616 Mha (see Figs. 1 and A1). Reported maps show locations
factors, combined with literature values of water-use efficien- scattered around the globe (Stenzel et al., 2019), with clusters
cies for two C4 grasses. Most studies rely on numerical simu- in central Europe, North and South America and north-east
lation models based on an energy (or NE) trajectory control- China in Beringer et al. (2011) or South America and central
ling the location, productivity, and eventually water abstrac- Africa in Bonsch et al. (2016). Note, however, that BP area
https://doi.org/10.5194/hess-25-1711-2021 Hydrol. Earth Syst. Sci., 25, 1711–1726, 20211716 F. Stenzel et al.: Global scenarios of irrigation water abstractions for bioenergy production Figure 1. Range of key parameters (global estimates) determining projections of water abstractions for bioenergy in the scenarios examined (see supplementary data; Stenzel et al., 2021) presented as boxplots. Note that plantation area and carbon conversion efficiency are not reported in all studies. Inverse water-use efficiency per biomass harvest (iwue) is calculated for each scenario using the means of water abstractions and biomass harvest if ranges are given. size and especially location-specific water-use maps are not based on spatial and temporal optimization of costs (e.g. reported in every study, but would be crucial to compare and Humpenöder et al., 2018) or environmental impacts (e.g. interpret the projected magnitudes of global freshwater con- Heck et al., 2018); others use existing exogenous projections sumption as determined by the water availability and require- for designated BP areas (e.g. from RCP2.6-based studies in ments in the respective locations (King et al., 2013). Studies Boysen et al., 2017). Conversion of cropland to bioenergy without explicit bioenergy locations thus need to be inter- plantations is generally avoided (except in Yamagata et al., preted with caution. 2018 and Heck et al., 2016). Current cropland extent amounts The (geospatial) location of additional large-scale irriga- to 1564 Mha (Klein Goldewijk et al., 2017). The potentially tion might also be relevant from the perspective of feed- (theoretically) available land for biomass plantations today in backs with the climate system (Moore and Rojstaczer, 2002). each of the remaining categories would be: 385–472 Mha for Recently it was suggested that the influence of land-cover marginal land (Campbell et al., 2008), 6899 Mha for natural change and especially irrigation on evapotranspiration are vegetation (Boysen et al., 2017), 3286 Mha for natural vege- larger than expected (Van Noordwijk and Ellison, 2019; El- tation excluding protected or vulnerable land (Stenzel et al., lison et al., 2019), such that moisture recycling through tran- 2019), and 441 Mha for the BP area in RCP2.6-SSP2 in 2100 spired irrigation water and moisture transport to downwind (Boysen et al., 2017). regions may also be affected by the biomass plantations. Irrigation parameters. Within the studies that explicitly Thus, for example, as long as forests are not removed in order model irrigation of BPs, there is also strong variation in the to grow the biomass material, the upwind production of ad- parameterization of the irrigation systems. Some studies al- ditional biomass material could potentially have positive im- low potential irrigation, i.e. assuming unlimited availability pacts on downwind rainfall and water availability (DeAnge- of surface or groundwater and neglecting feedbacks resulting lis et al., 2010; Layton and Ellison, 2016). These atmospheric from water demands higher than available resources (Hejazi linkages make it all the more important to consider such in- et al., 2014). Conversely, irrigation is in some studies simu- terventions both strategically and spatially with the poten- lated to be constrained by surface water availability (Beringer tial to find synergies in cases where upwind irrigation under et al., 2011; Heck et al., 2016) or even further constrained high water availability might provide additional precipitation by additionally accounting for so-called “environmental flow to dry downwind regions. New modelling approaches track- requirements” (EFRs) to be withheld for protection of river- ing atmospheric moisture pathways (Tuinenburg and Staal, ine ecosystems (Jans et al., 2018; Humpenöder et al., 2018; 2020) or direct coupling of land-system and climate models Stenzel et al., 2019). Additionally, the water losses due to (Pokhrel et al., 2017) help us to better understand these pro- different efficiencies of irrigation systems can in theory vary cesses. between < 30 % for surface irrigation and > 70 % for drip The reported land types, which are projected to be con- irrigation (productive share of the withdrawals in Jägermeyr verted to BPs, show a large variety covering marginal land et al., 2015). Irrigation efficiencies for BPs are typically as- (e.g. Smith et al., 2016), and natural vegetation, partially ex- sumed to be rather on the upper end of this range (e.g. 66 % cluding protected or vulnerable lands (e.g. Beringer et al., in Humpenöder et al., 2018). Also, the fraction of planta- 2011). Some studies create new overall land-use patterns tions that are allowed to be irrigated varies widely. In their Hydrol. Earth Syst. Sci., 25, 1711–1726, 2021 https://doi.org/10.5194/hess-25-1711-2021
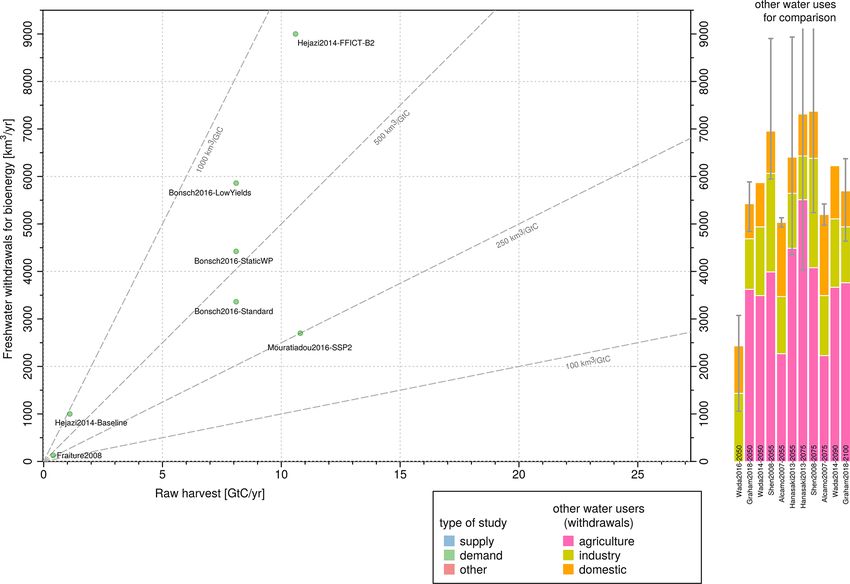
F. Stenzel et al.: Global scenarios of irrigation water abstractions for bioenergy production                                1717

“IrrExp” scenarios, Stenzel et al. (2019), e.g. allow for irri-   ranges only describe the CCS efficiency and disregard the
gation on all plantations, which would benefit from this irri-    supply chain carbon efficiency, which can be much lower.
gation constrained only by the availability of surface water      Smith and Torn (2013) give an overall conversion efficiency
and EFRs, while their “TechUp” and “Basic” scenarios are          of 47 % for typical BECCS process chains. For our literature
limited to 30 % of irrigated areas – those with high water        corpus, ceff (if reported at all) ranges from 31 %–33 % (Bon-
productivities preferred.                                         sch et al., 2016; Fajardy et al., 2018; Yamagata et al., 2018)
   Biomass feedstock. The majority of scenarios consider C4       to 94 % (Hejazi et al., 2014) (Fig. 1).
grasses like Miscanthus or switchgrass (29/34), temperate            Other constraints. As already briefly discussed in the con-
(18/34), and tropical tree species (17/34) as bioenergy feed-     text of irrigation parameters, the studies from our literature
stock (e.g. Boysen et al., 2017; Yamagata et al., 2018; Heck      corpus consider some other constraints to large-scale BECCS
et al., 2018). Among the reviewed studies, only two consider      implementation that are also likely to influence their fresh-
first-generation bioenergy plants like rapeseed, oil palm, or     water abstractions. Limiting human intervention with the en-
sugar cane as feedstock (De Fraiture et al., 2008; Gerbens-       vironment, specifically by respecting planetary boundaries
Leenes et al., 2012). Residues from agriculture or forestry,      (Rockström et al., 2009; Steffen et al., 2015), might limit
estimated to contribute up to 100 EJ yr−1 in 2050 (IEA, 2009;     the BECCS potential significantly as shown in Heck et al.
Haberl et al., 2010), are discussed by Beringer et al. (2011)     (2018). Similarly, Bonsch et al. (2016) identify a tradeoff
but not included in their analysis. Stenzel et al. (2019) and     between irrigation water and plantation area demand, which
Heck et al. (2018) include the one-time timber harvest from       corresponds to tradeoffs with planetary boundaries for fresh-
the land-use conversion of forests to biomass plantations. Fa-    water use, biosphere integrity, and land-system change. Ad-
jardy et al. (2018) include wheat straw residues as biomass       ditionally, economic constraints such as the accessibility of
feedstock. However, in the context of the current review, ma-     BPs, their distance to cities where most energy is needed,
jor impacts on water can probably only be expected by des-        and the availability of large geologic storage capacity close
ignated large-scale plantations.                                  to the locations of energy consumption are to be mentioned
   Some studies assume yield productivity changes in the          as further determinants of bioenergy water abstractions (e.g.
bioenergy harvest over the 21st century based on previous         considered in Fajardy et al., 2018).
productivity increases observed in crop harvests (Bonsch
et al., 2016; Mouratiadou et al., 2016; Humpenöder et al.,        3.3   Projections of global irrigation water abstractions
2018). There is also the argument that this increase of pro-            for bioenergy plantations
ductivity might be more difficult to reach than for food crops,
since the whole above-ground biomass is used for bioenergy        From the 16 studies, we synthesized 34 scenarios, for which
production instead of only a small ratio as in the case of food   we collected the projected freshwater abstractions and asso-
crops (Krausmann et al., 2013). Breeding programmes might         ciated data (see supplementary data; Stenzel et al., 2021).
also yield significant potential for improved water-use effi-     We collected the type of study, the modelling framework,
ciencies in bioenergy crops.                                      the bioenergy feedstock, the land type converted to a biocrop
   Timing of bioenergy implementation. For demand-driven          plantation, whether global maps for bioenergy locations are
studies, crucial (but mostly exogenous) parameters are            included, whether withdrawal or consumption is reported,
the starting year and trajectory for the BECCS demand,            the type of water (blue/green/grey), the simulation year for
e.g. whether deployment is assumed to start in 2015               which data is extracted, ceff , the plantation area, the provided
(Humpenöder et al., 2018) or in 2030 (Stenzel et al., 2019).      bioenergy, and/or the NEs (depending on study type).
Trajectories of the energy (or NE) demand (Boysen et al.,            The projections of potential future freshwater consump-
2017; Hejazi et al., 2014; Berndes, 2002) that require higher     tion for irrigation of BPs (125–11 350 km3 yr−1 ) vary sub-
yearly biomass yield demands at the end of the century will       stantially due to differences in model structure, scenarios,
likely also lead to higher yearly irrigation requirements. The    study goals, and data input. Extreme cases are the FFICT-
yearly water abstractions given in the studies are not always     B2 scenario in Hejazi et al. (2014) and the Food First (FF)
indicative of average irrigation water abstractions per year,     scenario in Jans et al. (2018), who simulate BP cultiva-
since demand studies mostly report end-of-study-period val-       tion on 4000–8000 Mha with associated water withdrawals
ues (e.g. mean 2090–2099) when irrigated areas are at their       of 5500–9000 km3 yr−1 . These scenarios include extremely
maximum.                                                          high amounts of irrigated BPs (Hejazi et al., 2014) or are
   Carbon conversion efficiency. An important parameter in        maximum potential scenarios (largely unconstrained in terms
the BECCS process chain (and indirectly influencing the wa-       of available area) (Jans et al., 2018) and, at least in the lat-
ter demand of BPs) is the carbon conversion efficiency (ceff ),   ter case, are not meant to be implemented as such. Assuming
which we define as the overall fraction of harvested biomass      water-use efficiencies of 585 m3 t−1 for Miscanthus, Hu et al.
carbon that can be sequestered and thus removed from car-         (2020) project the water consumption on RCP2.6 consistent
bon cycling. Gough and Vaughan (2015) report the capture          BP areas (431 Mha) to be up to 11 350 km3 yr−1 .
rates of the CCS processes to be 85 % to 90 %, but these

https://doi.org/10.5194/hess-25-1711-2021                                      Hydrol. Earth Syst. Sci., 25, 1711–1726, 2021
1718                             F. Stenzel et al.: Global scenarios of irrigation water abstractions for bioenergy production

Figure 2. Overview of scenarios of reported values of global blue water consumption required for bioenergy production through biomass
plantations (inlays show scenarios outside the plotting region). Scenarios are characterized by freshwater consumption for bioenergy plotted
against raw harvest (inferred from reported biomass based energy or negative emissions). They can provide ranges in water withdrawals
or raw harvest (illustrated by boxes) or contain single values (depicted by circles). The type of study is marked by the colour. Results for
studies that report blue water withdrawals can be found in Fig. A2 and studies of green water consumption in Fig. A3. For contextualization,
projections for other water uses (withdrawals) are shown to the right together with their uncertainty ranges. Names of the bioenergy scenarios
are constructed as {author}{publication year}–{scenario name} and those of “other water use” scenarios as {author}{publication year}–
{simulation year}.

3.4    Bioenergy plantation water abstractions in light of               ported to be 306 Mha in 2000 (Siebert et al., 2015). Esti-
       water use in other sectors                                        mates of present (between 2000 and 2010) agricultural water
                                                                         withdrawal are in the range of 2402–3214 km3 yr−1 . Future
The contemporary global green and blue water consumption                 agricultural water withdrawal is projected by grid-based nu-
on cropland is 5000–10 000 and 800–1500 km3 yr−1 , respec-               merical hydrological or crop growth models. For the mid-
tively (Hoff et al., 2010; Jägermeyr et al., 2015; Rosa et al.,          (around 2050) and the late 21st century (between 2075 and
2018). Runoff feeding these appropriations globally sums                 2090), estimates range between 2256–6037 km3 yr−1 and
up to approximately 40 000 km3 yr−1 (Sperna Weiland et al.,              2211–8434 km3 yr−1 , respectively. These wide ranges in esti-
2010; Gerten et al., 2013), of which, however, only 30 %–                mations are primarily attributed to the assumptions on future
40 % is geographically and temporally accessible to humans               irrigated area, which differ widely, as in the case of BP pro-
(Postel et al., 1996).                                                   jections. The lower ends assume that the irrigated area hardly
   To contextualize the above-discussed estimations of irri-             increases in the future, based on the view that land for new
gation water abstractions for bioenergy, earlier projections of          irrigation projects is no longer available (e.g. Alcamo et al.,
future water use for the three main other sectors of agricul-            2007 and the low-end scenario of Hanasaki et al., 2013a).
ture, industry, and households are collected (Alcamo et al.,             The high-end projection assumes that the irrigated area in-
2007; Shen et al., 2008; Hanasaki et al., 2013b, a; Wada                 creases at a rate of 0.6 % yr−1 (i.e. the high-end scenario of
and Bierkens, 2014; Wada et al., 2016; Graham et al., 2018)              Hanasaki et al., 2013a). Another case assumes that agricul-
and compiled for comparison (see Fig. 2 and supplemen-                   tural water use grows in proportion to the total population as
tary data). Agriculture is globally the largest water-using sec-         observed in the latter half of the 20th century (Shen et al.,
tor among the three, with a global total irrigated area re-              2008). Other assumptions with respect to changes in irri-

Hydrol. Earth Syst. Sci., 25, 1711–1726, 2021                                               https://doi.org/10.5194/hess-25-1711-2021
F. Stenzel et al.: Global scenarios of irrigation water abstractions for bioenergy production 1719
gation efficiency, crop intensity, and climate change further 3.5 Inverse water-use efficiency relating freshwater
widen the range of estimates. abstractions and harvest
Industry and domestic water use are the second- and third-
largest water-using sectors. The estimates of present indus- Reported primary bioenergy (energy content of the biomass
trial and domestic water withdrawals are in the range of 691– harvest to be converted to electricity) ranges from 40 to
894 and 328–474 km3 yr−1 , respectively. Future industrial 2350 EJ yr−1 , while NEs range from 1.2 to 10.0 GtC yr−1 .
and domestic water withdrawal is projected using empirical After converting primary bioenergy and NEs to initial
approaches. For instance, Alcamo et al. (2003) and Alcamo biomass harvests (see Sect. 2.2), we find the projections
et al. (2007) developed nationwide regression models to of global freshwater abstractions per harvested biomass
model water withdrawal in response to key drivers (e.g. pop- (iwue) to be in the range of 15 to 2761 km3 GtC−1 (15–
ulation, income, electricity production, efficiency improve- 1,250 km3 GtC−1 if the mean scenario values are used;
ments) used in an exponential form to express the empirical Fig. 1). This large range shows that freshwater withdrawals
facts that per activity water use continuously drops through or consumptions do not linearly depend on the amount of
time. Future industrial water withdrawals in the middle and cultivated biomass; it is rather the large variety in other pa-
the late 21st century are estimated to range between 433– rameters (which cannot be made comparable) that primar-
3313 and between 246–3772 km3 yr−1 , respectively. These ily discriminates the scenarios (Figs. 2 and A2). Scenar-
ranges primarily reflect differences in efficiency improve- ios “sust” from Boysen et al. (2017), “Basic”, “TechUp”,
ment settings. As for domestic water, ranges are 628–1563 and “TechUp355” from Stenzel et al. (2019), and “tCDR-
and 573–1726 km3 yr−1 , respectively, for the two future time g” from Heck et al. (2016) demonstrate iwue values below
periods. 100 km3 GtC−1 (15, 50, 49, 46 and 71 km3 GtC−1 ).
The median (first and third quartile) of total water with- In the theoretical scenario tCDR-g in Heck et al. (2016), no
drawal for the present and the mid- and late 21st century additional BP locations are determined, but all existing crop-
is 3770 (3724–3824), 5806 (5311–6378), and 6076 (5063– lands in year 2005 are assumed to be replaced with BPs and
6984) km3 yr−1 , respectively. assumed to be irrigated very efficiently, which results in high
Figures 2 and A2 indicate that 19 out of 34 estimations harvests and thus low iwue. In the “sust scenario” consid-
for global additional irrigation water withdrawal for bioen- ered in Boysen et al. (2017), only 40 out of a total 441 Mha
ergy exceed 2000 km3 yr−1 , which corresponds to half of the BP area are considered to be irrigated, but the authors do
present water withdrawals. This additional volume is roughly not provide values to discriminate the respective harvests. In
equivalent to the differences in total water withdrawal be- their “TechUp-WM” scenario, Stenzel et al. (2019) assume
tween SSP1 (4295 km3 yr−1 ; SSP = shared socioeconomic a high ceff of 70 % together with EFR restrictions on fresh-
pathway), SSP2 (6369 km3 yr−1 ), and SSP3 (8827 km3 yr−1 ) water withdrawals, which keeps iwue below 100 km3 GtC−1 .
in 2050 (Hanasaki et al., 2013a). A significant increase in wa- The highest projected iwue values are from the M ∗ sce-
ter withdrawal for biomass production is likely to intensify narios from Hu et al. (2020) (1102–1402 km3 GtC−1 ),
water stress in the respective regions if not carefully planned Beringer et al. (2011) (315–2761 km3 GtC−1 ), the “Base-
in view of other water uses. The estimated global total wa- line” (909 km3 GtC−1 ) and “FFICT-B2” (849 km3 GtC−1)
ter stressed population for SSP1, SSP2, and SSP3 are 2853, scenario from Hejazi et al. (2014), and the “Low-Yields”
3642, and 4265 million people. Although the water usage is scenario from Bonsch et al. (2016) (723 km3 GtC−1 ). Here
different, it implies that 2000 km3 yr−1 of additional irriga- we denote that the very high value (2771 km3 GtC−1 ) from
tion may increase the water-stressed population by 600–800 Beringer et al. (2011) might be an artefact of how we handle
million people (Hanasaki et al., 2013a). Importantly, integra- data value ranges, since the scenario producing the lowest-
tive studies that account for all major water users including energy yields is most likely not the one with the highest wa-
bioenergy in a consistent framework at global scale yet spa- ter consumption; the scenario is probably rather following a
tially explicit are basically lacking. trend of 1000 km3 GtC−1 .
The future price of biomass, as well as the value of fresh- However, we are still surprised to find that supply-driven
water, also likely depends on political decisions (Klein et al., studies do not consistently suggest higher harvest than
2014) or market forces in other sectors (Dinar and Mody, demand-driven studies. This could mean that even demand-
2004). Integrated assessments of the combined effects in a driven studies are operating at the limits of the Earth system,
globally monetized biomass and food market with potential and supply-driven studies, especially when considering sus-
limitations of irrigation water withdrawals (Hogeboom et al., tainability constraints, cannot provide more negative emis-
2020) or associated high costs (De Fraiture and Perry, 2002), sions than are already demanded for ambitious climate tar-
especially under conditions of continued climatic change, gets like 1.5 ◦ C.
poses interesting avenues for further research. Only a few global studies consider biofuels (e.g. Gerbens-
Leenes et al., 2012; De Fraiture et al., 2008), which (aside
from the irrigation water abstractions for the bioenergy feed-
stock considered in this review) require additional water for
https://doi.org/10.5194/hess-25-1711-2021 Hydrol. Earth Syst. Sci., 25, 1711–1726, 20211720 F. Stenzel et al.: Global scenarios of irrigation water abstractions for bioenergy production
processing. It should be noted that the additional water ab- The studies analysed in this paper span a publication time
stractions for the biofuel refinement process (on top of the of almost 20 years. There might, therefore, be significant
in-field water abstractions) are considered in many regional changes even among different versions of the same model
life cycle assessment studies and assumed to be about 4 (e.g. GCAM in Hejazi et al., 2014 vs. in Graham et al., 2018,
units of water per unit of ethanol according to Fike et al. as discussed in Calvin et al., 2019), suggesting the need for
(2007) and Keeney and Muller (2006). General assessments a concerted model intercomparison for projections of bioen-
including both primary bioenergy and biofuels would need ergy water demands under controlled assumptions and with
to consider different conversion efficiencies for the different the latest model versions.
biomass pathways (as in Bonsch et al., 2016 or Heck et al., These additional water abstractions for bioenergy, which
2018). are at the same magnitude of water demand projections for
conventional usage seem to paint a picture of a future where
water scarcity can become a global and perpetual issue.
4 Conclusions It would have been desirable to also include regional stud-
ies in our analysis, but this would have required more infor-
We report a large range of parameters and scenario criteria
mation than is usually provided to, for example, analyse local
(Table 1 and more details in the supplementary data) that
yield and/or water productivity and data on other water-use
are crucial for estimating the irrigation water abstractions for
sectors.
BPs. We are not able to quantify the contribution of each pa-
Besides the freshwater abstractions, potential impacts of
rameter; however, strong dependencies are expected for the
BPs mostly stem from the implied land-cover and land-
targeted primary bioenergy or negative emissions amounts,
use conversion. Replacing natural vegetation with bioenergy
the assumed carbon conversion efficiency, and the assumed
crops could affect biodiversity, while, if grown on cropland,
plantation area.
they could affect food security. Overall, most of the analysed
A number of necessary parameters were, however, not
scenarios do not explicitly replace existing cropland by BPs.
documented in the publications needed for a full assessment
This in turn means that most studies (at least implicitly) as-
of the hydrologic implications of widespread BP deploy-
sume investments in additional infrastructure for irrigation
ment. Thus we recommend that all scenario parameters be
assuming it is economically justifiable. Some scenarios also
reported in future publications on water use (including irri-
explicitly protect vulnerable natural areas. These considera-
gation) of BPs, enabling more straightforward interpretation
tions promote the use of marginal or degraded lands for BPs.
and comparison of results. A minimum set of reported pa-
This review provides a first comprehensive overview of the
rameters, ideally spatially detailed, should in our view in-
current literature on global projections of the freshwater ab-
clude the complete water balances of BPs (including parti-
stractions for irrigated bioenergy plantations. Furthermore,
tioning of blue and green water), water-use efficiencies of the
it is the first study that highlights the potential dependence
respective plant types, rainfed and irrigated BP locations (in-
on irrigation for BECCS to deliver NEs for ambitious cli-
cluding total area and climatic conditions), and total biomass
mate targets and calls for further investigation and reporting
harvest amounts.
on the underlying (model) assumptions. Integrated assess-
We find the global water withdrawals for irrigation of
ments that consider all water-use sectors (including bioen-
biomass plantations estimated from the available literature to
ergy, along with potential tradeoffs based on a detailed un-
be in the range of 128.4–9000 km3 yr−1 (consumption: 125–
derstanding of local limitations) are highly desirable and are
11 350 km3 yr−1 ), compared to about 1100–11 600 km3 yr−1
crucial to get a better understanding of the limits and options
for the sum of other (agricultural, industrial, and domestic)
of future water consumption.
water withdrawals and thus at similar magnitude. It needs to
be noted that the water abstractions for bioenergy production
would come on top of (or compete with) that for the other
uses.
Surprisingly, there is no clear relationship (e.g. linear)
between water abstractions and total bioenergy produc-
tion. However, by comparing the freshwater abstractions
per harvested biomass, we find that most of the scenarios
fall between 100–1000 km3 GtC−1 . The full range of 15–
1250 km3 GtC−1 for biomass harvest implies that, given a
carbon conversion efficiency of 50 %, we might need 99–
8250 km3 to reach NEs of 3.3 GtC yr−1 as projected to be
necessary by Smith et al. (2016).
Hydrol. Earth Syst. Sci., 25, 1711–1726, 2021 https://doi.org/10.5194/hess-25-1711-2021F. Stenzel et al.: Global scenarios of irrigation water abstractions for bioenergy production 1721
Appendix A: Supplementary information
Figure A1. Overview of reported total global area of bioenergy plantations.
Figure A2. Analogous to Fig. 2 but for scenarios of reported values of global blue water withdrawals required for bioenergy production
through biomass plantations. Scenarios are characterized by water withdrawals for bioenergy plotted against raw harvest (inferred from
reported biomass based energy or negative emissions). They can provide ranges in water withdrawals or raw harvest (illustrated by boxes)
or contain single values (depicted by circles). The type of study is marked by the colour. For contextualization, projections for other water
uses (withdrawals) are shown to the right, together with their uncertainty ranges. Names of the bioenergy scenarios are constructed as
{author}{publication year}–{scenario name} and those of “other water use” scenarios as {author}{publication year}–{simulation year}.
https://doi.org/10.5194/hess-25-1711-2021 Hydrol. Earth Syst. Sci., 25, 1711–1726, 20211722 F. Stenzel et al.: Global scenarios of irrigation water abstractions for bioenergy production
Figure A3. Analogous to Fig. 2, but for scenarios of reported global
green water consumption volumes required for bioenergy produc-
tion through biomass plantations. Scenarios are characterized by
water consumption for bioenergy plotted against raw harvest (in-
ferred from reported biomass based energy or negative emissions).
They can provide ranges in water consumption or raw harvest (illus-
trated by boxes) or contain single values (depicted by circles). For
contextualization, projections for other water uses (withdrawals) are
shown to the right, together with their uncertainty ranges. Names
of the bioenergy scenarios are constructed as {author}{publication
year}–{scenario name} and those of “other water use” scenarios as
{author}{publication year}–{simulation year}.
Appendix B: List of abbreviations
Description
BECCS bioenergy with carbon capture and storage
BP bioenergy plantation
CCS carbon capture and storage
ceff carbon conversion efficiency
DGVM dynamic global vegetation model
EFR environmental flow requirement
ESM Earth system model
IAM integrated assessment model
iwue inverse water-use efficiency
NE negative emission
NET negative emission technology
SSP shared socioeconomic pathway
Hydrol. Earth Syst. Sci., 25, 1711–1726, 2021 https://doi.org/10.5194/hess-25-1711-2021F. Stenzel et al.: Global scenarios of irrigation water abstractions for bioenergy production 1723
Data availability. The results from the literature analysis are avail- and Muratori, M.: Global energy sector emission reductions and
able at https://doi.org/10.5880/PIK.2020.007 (Stenzel et al., 2021). bioenergy use: overview of the bioenergy demand phase of the
Any additional data that support the findings of this study are in- EMF-33 model comparison, Climatic Change, 163, 1553–1568,
cluded within the article. https://doi.org/10.1007/s10584-018-2226-y, 2018.
Beringer, T., Lucht, W., and Schaphoff, S.: Bioenergy produc-
tion potential of global biomass plantations under environmen-
Author contributions. FS designed the study and carried out the tal and agricultural constraints, GCB Bioenergy, 3, 299–312,
literature analysis of bioenergy–freshwater abstractions. DG con- https://doi.org/10.1111/j.1757-1707.2010.01088.x, 2011.
tributed to the study design. NH carried out the literature analysis Berndes, G.: Bioenergy and water – the implications of large-
of the other water users. FS prepared the manuscript. DG and NH scale bioenergy production for water use and supply, Global
contributed to manuscript preparation. Environ. Chang., 12, 253–271, https://doi.org/10.1016/S0959-
3780(02)00040-7, 2002.
Berndes, G. and Borjesson, P.: Implications of irrigation and water
Competing interests. The authors declare that they have no conflict management for the net energy performance of bioenergy sys-
of interest. tems, Department of Physical Resource Theory, Chalmers Uni-
versity of Technology and Goteborg University, Goteborg, Swe-
den, 2001.
Bonsch, M., Humpenöder, F., Popp, A., Bodirsky, B., Dietrich, J. P.,
Acknowledgements. This study was funded by the CE-Land+
Rolinski, S., Biewald, A., Lotze-Campen, H., Weindl, I., Gerten,
project of the German Research Foundation’s Priority Programme
D., and Stevanovic, M.: Trade-offs between land and water re-
DFG SPP 1689 on “Climate Engineering – Risks, Challenges and
quirements for large-scale bioenergy production, GCB Bioen-
Opportunities?” Part of the research was developed during the
ergy, 8, 11–24, https://doi.org/10.1111/gcbb.12226, 2016.
Young Scientists Summer Program at the International Institute for
Boysen, L. R., Lucht, W., Gerten, D., Heck, V., Lenton, T. M.,
Applied Systems Analysis, Laxenburg, Austria, with financial sup-
and Schellnhuber, H. J.: The limits to global-warming mitiga-
port from the German National Member Organization.
tion by terrestrial carbon removal, Earths Future, 5, 463–474,
https://doi.org/10.1002/2016EF000469, 2017.
Brosse, N., Dufour, A., Meng, X., Sun, Q., and Ragauskas,
Financial support. The publication of this article was funded by the A.: Miscanthus: a fast-growing crop for biofuels and
Open Access Fund of the Leibniz Association. chemicals production, Biofuel. Bioprod. Bior., 6, 580–598,
https://doi.org/10.1002/bbb.1353, 2012.
Calvin, K., Patel, P., Clarke, L., Asrar, G., Bond-Lamberty, B., Cui,
Review statement. This paper was edited by Nunzio Romano and R. Y., Di Vittorio, A., Dorheim, K., Edmonds, J., Hartin, C., He-
reviewed by David Ellison, Mohamad Hejazi, and two anonymous jazi, M., Horowitz, R., Iyer, G., Kyle, P., Kim, S., Link, R., Mc-
referees. Jeon, H., Smith, S. J., Snyder, A., Waldhoff, S., and Wise, M.:
GCAM v5.1: representing the linkages between energy, water,
land, climate, and economic systems, Geosci. Model Dev., 12,
677–698, https://doi.org/10.5194/gmd-12-677-2019, 2019.
References Campbell, J. E., Lobell, D. B., Genova, R. C., and Field,
C. B.: The Global Potential of Bioenergy on Abandoned
Al-Ansari, T., Korre, A., Nie, Z., and Shah, N.: Integration of Agriculture Lands, Environ. Sci. Technol., 42, 5791–5794,
greenhouse gas control technologies within the energy, wa- https://doi.org/10.1021/es800052w, 2008.
ter and food nexus to enhance the environmental performance Creutzig, F., Ravindranath, N. H., Berndes, G., Bolwig, S., Bright,
of food production systems, J. Clean. Prod., 162, 1592–1606, R., Cherubini, F., Chum, H., Corbera, E., Delucchi, M., Faaij,
https://doi.org/10.1016/j.jclepro.2017.06.097, 2017. A., Fargione, J., Haberl, H., Heath, G., Lucon, O., Plevin,
Alcamo, J., Döll, P., Henrichs, T., Kaspar, F., Lehner, B., R., Popp, A., Robledo-Abad, C., Rose, S., Smith, P., Strom-
Rösch, T., and Siebert, S.: Global estimates of water man, A., Suh, S., and Masera, O.: Bioenergy and climate
withdrawals and availability under current and future change mitigation: an assessment, GCB Bioenergy, 7, 916–944,
“business-as-usual” conditions, Hydrolog. Sci. J., 48, 339– https://doi.org/10.1111/gcbb.12205, 2015.
348, https://doi.org/10.1623/hysj.48.3.339.45278, 2003. DeAngelis, A., Dominguez, F., Fan, Y., Robock, A., Kustu,
Alcamo, J., Flörke, M., and Märkner, M.: Future long-term changes M. D., and Robinson, D.: Evidence of enhanced pre-
in global water resources driven by socio-economic and climatic cipitation due to irrigation over the Great Plains of the
changes, Hydrolog. Sci. J., 52, 247–275, 2007. United States, J. Geophys. Res.-Atmos., 115, D15115,
Azar, C., Lindgren, K., Larson, E., and Möllersten, K.: Carbon cap- https://doi.org/10.1029/2010JD013892, 2010.
ture and storage from fossil fuels and biomass – Costs and poten- De Fraiture, C. and Perry, C.: Why is irrigation water demand in-
tial role in stabilizing the atmosphere, Clim. Change, 74, 47–79, elastic at low price ranges, in: Conference on Irrigation Water
https://doi.org/10.1007/s10584-005-3484-7, 2006. Policies: Micro and Macro Considerations, 15–17 June 2002,
Bauer, N., Rose, S. K., Fujimori, S., van Vuuren, D. P., Weyant, J., Agadir, Morocco, 15–17, 2002.
Wise, M., Cui, Y., Daioglou, V., Gidden, M. J., Kato, E., Kitous, De Fraiture, C., Giordano, M., and Liao, Y.: Biofuels and implica-
A., Leblanc, F., Sands, R., Sano, F., Strefler, J., Tsutsui, J., Bibas, tions for agricultural water use: blue impacts of green energy,
R., Fricko, O., Hasegawa, T., Klein, D., Kurosawa, A., Mima, S.,
https://doi.org/10.5194/hess-25-1711-2021 Hydrol. Earth Syst. Sci., 25, 1711–1726, 2021You can also read