Drought-induced biomass burning as a source of black carbon to the central Himalaya since 1781 CE as reconstructed from the Dasuopu ice core
←
→
Page content transcription
If your browser does not render page correctly, please read the page content below
Atmos. Chem. Phys., 21, 5615–5633, 2021
https://doi.org/10.5194/acp-21-5615-2021
© Author(s) 2021. This work is distributed under
the Creative Commons Attribution 4.0 License.

Drought-induced biomass burning as a source of black carbon to the
central Himalaya since 1781 CE as reconstructed
from the Dasuopu ice core
Joel D. Barker1,2 , Susan Kaspari3 , Paolo Gabrielli1,2 , Anna Wegner2 , Emilie Beaudon2 ,
M. Roxana Sierra-Hernández2 , and Lonnie Thompson1,2
1 ByrdPolar and Climate Research Center, The Ohio State University, Columbus, OH 43210, USA
2 Schoolof Earth Sciences, The Ohio State University, Columbus, OH 43210, USA
3 Department of Geological Sciences, Central Washington University, Ellensburg, WA 98926, USA

Correspondence: Joel D. Barker (barke269@umn.edu) and Paolo Gabrielli (gabrielli.1@osu.edu)

Received: 8 October 2020 – Discussion started: 20 October 2020
Revised: 19 February 2021 – Accepted: 27 February 2021 – Published: 13 April 2021

Abstract. Himalayan glaciers are melting due to atmo-            that the rBC record can be used to identify periods of drought
spheric warming, with the potential to limit access to wa-       in nearby regions that are upwind of Dasuopu glacier.
ter for more than 25 % of the global population that resides
in these glacier meltwater catchments. Black carbon has
been implicated as a factor that is contributing to Himalayan
glacier melt, but its sources and mechanisms of delivery to
the Himalayas remain controversial. Here, we provide a 211-      1   Introduction
year ice core record spanning 1781–1992 CE for refractory
black carbon (rBC) deposition from the Dasuopu glacier ice       Although the rate and extent of glacier melt differ geograph-
core that has to date provided the highest-elevation ice core    ically, the overall trend of glacier mass loss globally, particu-
record (7200 m). We report an average rBC concentration of       larly in mountain glaciers, is well documented (IPCC, 2013).
1.5 µg L−1 (SD = 5.0, n = 1628) over the 211-year period.        While warming summer temperatures resulting in increased
An increase in the frequency and magnitude of rBC deposi-        glacier mass loss (e.g., Gregory and Oerlemans, 1998) and
tion occurs after 1877 CE, accompanied by decreased snow         decreasing precipitation as snow (Raper and Braithwaite,
accumulation associated with a shift in the North Atlantic       2006) are important factors contributing to glacier mass
Oscillation Index to a positive phase. Typically, rBC is de-     wastage globally, the deposition of atmospheric aerosols that
posited onto Dasuopu glacier during the non-monsoon sea-         darken the glacier surface also contributes to melt (Flanner et
son, and short-lived increases in rBC concentration are asso-    al., 2007; Xu et al., 2009, 2012), particularly in proximity to
ciated with periods of drought within neighboring regions in     aerosol emission sources. The most efficient of these aerosols
northwestern India, Afghanistan, and Pakistan. Using a com-      is black carbon (BC), which is produced by a variety of com-
bination of spectral and back-trajectory analyses, as well as    bustion processes (Bond et al., 2004, 2013), most commonly
a comparison with a concurrent analysis of trace metals at       by the incomplete combustion of fossil fuels and biomass
equivalent depths in the same ice core, we show that biomass     (Jacobson, 2004; Hammes et al., 2007). BC is also the dom-
burning resulting from dry conditions is a source of rBC to      inant absorber of visible light in the atmosphere (Lindberg
the central Himalaya and is responsible for deposition that      et al., 1999) and exerts a positive radiative forcing globally,
is up to 60 times higher than the average rBC concentration      second only to CO2 (+1.1 and +1.6 W m−2 , respectively;
over the time period analyzed. We suggest that biomass burn-     Ramanathan and Carmichael, 2008). BC continues to absorb
ing is a significant source of rBC to the central Himalaya and   radiation upon deposition from the atmosphere onto glacier
                                                                 surfaces, reducing ice and snow albedo, which leads to melt

Published by Copernicus Publications on behalf of the European Geosciences Union.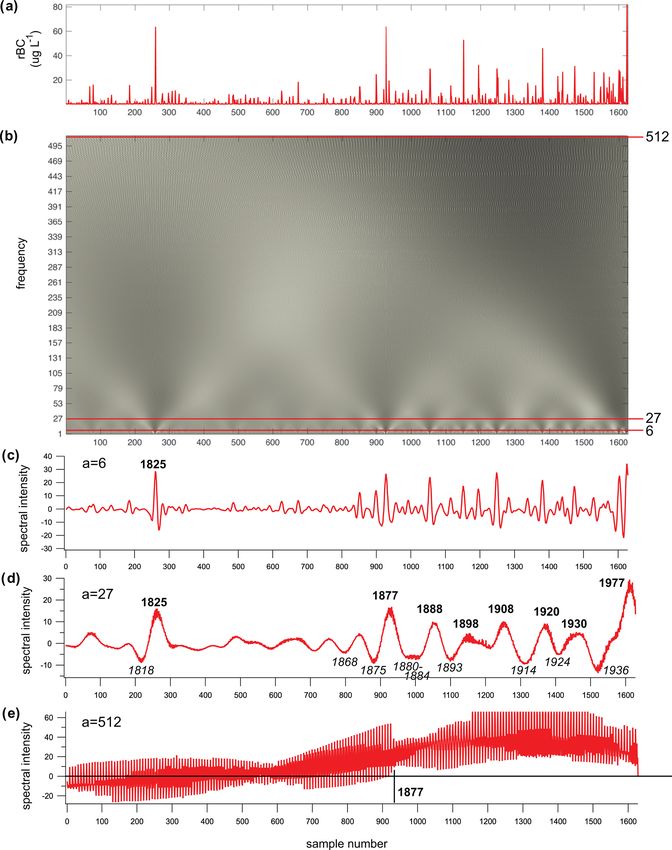
5616                                     J. D. Barker et al.: Drought-induced biomass burning as a source of black carbon

(Hansen and Nazarenko, 2004; Forster et al., 2007; Xu et al.,      Xu et al. (2009) report a period of relatively high concen-
2009; Doherty et al., 2013).                                       trations in the 1950s and 1960s in four Himalayan and Ti-
   A significant source of BC emitted to the atmo-                 betan Plateau glaciers (Muztagh Ata, Guoqu glacier, Noi-
sphere results from anthropogenic activity (Ramanathan and         jin Kangsang glacier, East Rongbuk glacier, and Tanggula
Carmichael, 2008; Bond et al., 2013). The BC flux to the at-       glacier) and suggest a European source of BC to these sites.
mosphere has increased by a factor of 2.5 since the Industrial     They also note an increase in BC on the easternmost site
Revolution, resulting in an increase in the global atmospheric     (Zuoqiupu glacier) beginning in the 1990s and suggest an In-
BC burden by a factor of 2.5–3 (Lee et al., 2013). BC’s rel-       dian source of BC for the region. Similarly, Liu et al. (2008)
atively short atmospheric residence time influences its distri-    report high elemental carbon at Muztagh Ata from 1955–
bution globally, with the highest concentrations being proxi-      1965. Ginot et al. (2014) report BC concentrations at Mera
mal to BC emission sources (Bond et al., 2007, 2013; Xu et         glacier from 1999–2010 and suggest that variations in BC
al., 2009). Asian regions surrounding the Himalaya are ma-         over this period respond primarily to monsoonal rather than
jor sources of atmospheric BC (Novakov et al., 2003; Bond          anthropogenic forcing.
et al., 2007, 2013; Ramanathan et al., 2007), and southern            Kaspari et al. (2011) were the first to present a BC record
Himalayan glaciers are particularly influenced by BC emis-         that extended back to the pre-industrial period (1860–2000)
sions from India (Kopacz et al., 2011; Gertler et al., 2016)       in an ice core from East Rongbuk glacier (6518 m a.s.l.) and
and more local emission sources that may add to the broader-       reported a threefold increase in BC deposition since 1975,
scale regional flux (Kaspari et al., 2011).                        indicating that anthropogenic BC is contributing to the BC
   Atmospheric aerosols, including BC, are warming the             flux to the southern Himalaya. Jenkins et al. (2016) report an
cryosphere, accelerating snowmelt in the western Tibetan           increase in BC deposition in the central Tibetan Plateau be-
Plateau and Himalayas (Lau and Kim, 2010), and altering            ginning in 1975 from the Guoqu glacier ice core record span-
the regional hydrologic cycle (Immerzeel et al., 2010). This       ning 1843–1982. These deep ice core records are valuable
is a concern because Hindu Kush Himalayan (HKH) glacier            for evaluating long-term trends in BC spanning the Indus-
melt affects water security, particularly during the early mon-    trial Revolution to the present and the concomitant increase
soon and post-monsoon season (Hill et al., 2020), for densely      in anthropogenically sourced BC emissions. Additional ice-
populated regions of Southeast Asia. Meltwater from HKH            core-derived BC records that span the period of industrial-
glaciers is the source of 10 major rivers that provide water       ization in Asia are required to corroborate existing historical
for irrigation, hydropower, and ecosystem services for two         records of BC deposition onto HKH glaciers and to establish
billion people across Asia (Scott et al., 2019); this is over      a regional baseline record for BC fluxes in the region. These
25 % of the global population.                                     records are currently lacking for the HKH and are essential
   Research into BC’s interaction with the HKH cryosphere          for identifying regional-scale trends in BC deposition.
has increased in recent years. Several studies have docu-             The highest-elevation ice core record ever obtained is
mented the magnitude and timing of BC deposition using             the Dasuopu ice core (C3; Thompson et al., 2000), which
short-term BC records preserved in surface snow that span          was retrieved from the Dasuopu glacier in the central Hi-
1–2 years (e.g., Xu et al., 2009; Ming et al., 2008, 2012; Kas-    malaya (28.38◦ N, 85.72◦ E; Fig. 1) in 1997 at an elevation of
pari et al., 2014; Zhang et al., 2018; Thind et al., 2019). More   7200 m a.s.l. Thompson et al. (2000) determined that mon-
recently, continuous surface measurements of near-surface          soonal precipitation is responsible for the net accumulation
aerosols, including BC, have been reported for the HKH re-         of snow onto the glacier surface, of the order of 1000 mm
gion (e.g., Marinoni et al., 2010; Bonasoni et al., 2010; Cao      water equivalent per year (in 1996), permitting an annu-
et al., 2010; Babu et al., 2011; Chaubey et al., 2011; Marinoni    ally resolved environmental record spanning 1440–1997 CE
et al., 2013; Niu et al., 2017; Negi et al., 2019). While useful   (Thompson et al., 2000). The remote location and high eleva-
for tracking the evolution of atmospheric BC at high tem-          tion of the Dasuopu ice core drill site suggest that any local
poral resolution, these studies do not provide a longer-term       influence on the deposition of atmospheric aerosols onto the
historical context against which current levels of BC can be       glacier surface is minimal and that accumulation is represen-
compared. Records of BC deposition preserved in ice cores          tative of mixed free tropospheric composition (Kumar et al.,
are useful as longer-term environmental archives for recon-        2015). Evidence suggesting that the Dasuopu glacier differs
structing atmospheric aerosol composition that span decades        from lower-elevation glaciers in the region with respect to
(Liu et al., 2008; Ming et al., 2008; Ginot et al., 2014). In      seasonal meteorology supports the hypothesis that the flux of
the HKH region, these archives are essential for identifying       aerosols onto the glacier surface may be more representative
trends in BC deposition onto HKH glaciers in response to in-       of free tropospheric composition rather than being affected
creasing BC emissions in surrounding regions. For example,         by local (valley-scale) meteorological conditions (Li et al.,
Ming et al. (2008) report an increasing trend in BC deposi-        2011). Generally, the lower limit of the free troposphere in
tion onto East Rongbuk glacier (Mt. Everest; 6500 m a.s.l.)        the central Himalaya occurs at ∼ 2.5 in the winter and 3.3 km
during a 10-year period beginning in 1965 and then another         in the summer (Solanki and Singh, 2014).
increase beginning in 1995 to the end of the record in 2001.

Atmos. Chem. Phys., 21, 5615–5633, 2021                                             https://doi.org/10.5194/acp-21-5615-2021
J. D. Barker et al.: Drought-induced biomass burning as a source of black carbon                                                    5617

Figure 1. The location of Dasuopu glacier, Mt. Xixiabangma, and other ice cores that have provided a historical record of BC deposition in
the region. The span of each BC record is indicated.

   Here, we quantify refractory BC (rBC; a subset of the               2     Methods
broader BC descriptor of carbonaceous particles that is
specifically measured by laser-induced incandescence; Pet-             2.1    The Dasuopu ice core
zold et al., 2013; Lack et al., 2014) in a section of the Da-
suopu ice core from 1781–1992 CE at annual to seasonal res-            Dasuopu glacier descends to the north from Mt. Xixia-
olution in the glacier ice portion. We employ spectral anal-           bangma in the central Himalaya (Fig. 1). The ice core ex-
ysis of the rBC ice core time series to identify trends in             amined here was drilled from the Dasuopu glacier surface
rBC deposited onto Dasuopu glacier across several temporal             to bedrock (145.4 m) with an electromechanical drill, with-
scales and to avoid “peak picking” that might lead to subjec-          out using drilling fluid, and provides a continuous record of
tively identifying episodes of increased rBC in the ice core           deposition onto the glacier surface from 1010 to 1997 CE
time series. The rBC record is compared to trace element               (Thompson et al. 2000). Here, we examine the upper sec-
analysis of samples from equivalent depths along the same              tion of the C3 ice core (hereafter referred to as the “Dasuopu
ice core, as described by Gabrielli et al. (2020), and an at-          core”) from 8.4–120.3 m of depth from the surface, corre-
mospheric back-trajectory analysis to elucidate the broader-           sponding to the period 1781–1992 CE. Sections of the Da-
scale trends of deposition and potential rBC sources to the            suopu core outside this interval were not available for anal-
southern Himalaya.                                                     ysis. We use the Thompson et al. (2000) chronology that
                                                                       was established using δ 18 O, dust, and NO−3 measurements, as
                                                                       well as annual layer counting confirmation using the location
                                                                       of the 1963 CE beta radioactivity peak from thermonuclear
                                                                       tests at a depth of 42.2 m to determine the core’s age–depth
                                                                       relationship. Thompson et al. (2000) also used two major
                                                                       monsoon failures (1790–1796 and 1876–1877) as age–depth

https://doi.org/10.5194/acp-21-5615-2021                                                 Atmos. Chem. Phys., 21, 5615–5633, 2021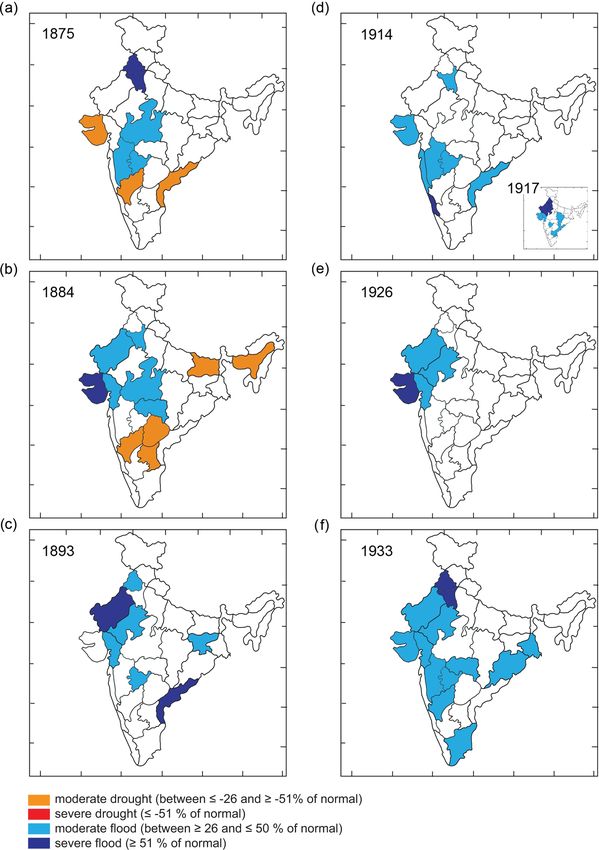
5618                                    J. D. Barker et al.: Drought-induced biomass burning as a source of black carbon

benchmarks that are reflected in the dust and Cl− records to     using the amplified output from two photodetectors (broad-
validate the ice core dating chronology. The chronology is       band and narrowband) to provide a detection range of ∼ 70–
accurate to ±3 years (Thompson et al., 2000).                    500 nm volume-equivalent diameter (VED; Kaspari et al.,
                                                                 2014). A five-point calibration curve (∼ 0.75–12.5 ppb) us-
2.2    Sample preparation                                        ing Aquadag standards and MQ water was performed daily
                                                                 to correct for BC loss during nebulization (Wendl et al.,
A portion of the Dasuopu core has been housed in the Ice         2014). MQ water was analyzed every five samples as a blank
Core Storage Facility (Byrd Polar and Climate Research           to monitor instrument baseline conditions. If the baseline
Center – BPCRC) at −30 ◦ C since the original analysis by        was above background levels, then MQ water would be run
Thompson et al. (2000). The portion of the Dasuopu core          through the system until stability was achieved. Baseline in-
analyzed here is characterized by consolidated firn from 8.4–    stability was not observed throughout the course of the anal-
56.4 m and glacier ice from 56.4–120.3 m of depth. Ice was       ysis. The SP2 data output was processed using the PSI SP2
sampled continuously (with the exception of intervals noted      Toolkit version 4.100a (Paul Scherrer Institute, Switzerland)
in Table S1 in the Supplement) in a cold room (−5 ◦ C) at sub-   and the IGOR Pro software platform (WaveMetrics Inc.,
annual resolution (2.5–10 cm sample interval) with a band        Portland, USA).
saw along the length of the ice section. Each ice sample was
divided in half to permit the analysis of BC and trace ele-      2.4   Spectral analysis
ments from identical depths throughout the core (n = 1572).
Prior to rBC analysis, each ice sample was rinsed with type 1    The record of rBC concentration with depth through the
Milli-Q (hereafter MQ) water at room temperature in a class      Dasuopu ice core provides a time series of rBC deposition
100 laboratory to remove any contaminants from the outer         onto Dasuopu glacier over time. The decomposition of the
edges of the core, placed in a sealable polyethylene bag, and    time series into time–frequency space using spectral analy-
immediately stored frozen (−34 ◦ C) to ensure that the sam-      sis (wavelet analysis) permits the identification of dominant
ple did not melt prior to analysis.                              modes of variability and their variance with time (Torrence
   Due to sample volume limitations resulting from previous      and Compo, 1998). Wavelet analysis is well suited to the
studies of the Dasuopu core (e.g., Thompson et al., 2000;        analysis of time series data with a frequency and/or mag-
Davis et al., 2005), 52 firn samples (5.5–10 cm length) were     nitude that is nonstationary through the signal (Debret et al.,
collected at discontinuous intervals (where sufficient sample    2007). For example, wavelet analyses have been used to iden-
volume was available) from 8.4–56.4 m of depth in the cold       tify Himalayan climatic oscillations related to orbital forcing,
room (−5 ◦ C) using a band saw. The outer 2 cm of each sam-      Dansgaard–Oeschger cycles, and Heinrich events in the 1992
ple (n = 56) was removed using clean stainless-steel knives      Guliya ice core (Yang et al., 2006). They have also been used
(soaked in 2 N HNO−  3 and rinsed with MQ water) under lam-      to characterize the increased role of El Niño–Southern Oscil-
inar flow conditions in the cold room to remove surface con-     lation (ENSO) climate forcing in Antarctic temperature since
taminants. Clean firn samples were stored frozen (−30 ◦ C)       ∼ 1850 from ice core records from East and West Antarctica
in double polypropylene bags until analysis.                     (Rahaman et al., 2019) as well as a switch from external forc-
                                                                 ing to internal forcing mechanisms on global climate during
2.3    BC analysis                                               the mid-Holocene (Debret et al., 2009).
                                                                    The ice core sampling strategy employed here may influ-
The rBC was quantified by laser-induced incandescence us-        ence the results of the spectral analysis because the upper-
ing a single-particle soot photometer (SP2; Droplet Mea-         most firn section was not sampled continuously and there
surement Technologies, Longmont, USA; Schwarz et al.,            are occasional sampling gaps in the glacier ice section (Ta-
2006; Wendl et al., 2014) at Central Washington Univer-          ble S1). The discontinuous sampling of the firn section likely
sity (Ellensburg, WA, USA). Frozen samples were melted at        resulted in an incomplete characterization of the rBC de-
room temperature, transferred from storage bags into 50 mL       posited onto the Dasuopu glacier since 1944 (56.4 m of
polypropylene centrifuge tubes, and sonicated for 20 min im-     depth). Further, the number of samples per year is not consis-
mediately prior to analysis. Each liquid sample was stirred      tent throughout the record because of interannual differences
with a magnetic bar as water was routed into a CETAC U-          in snow accumulation (Fig. S1 in the Supplement). It is im-
5000AT+ ultrasonic nebulizer (Teledyne CETAC Technolo-           portant to note that the spectral analysis treats the rBC time
gies, Omaha, USA; ∼ 18 % nebulization efficiency at 220,         series as a linear depth–time function. However, because the
356, and 505 nm particle size; Menking, 2013; Wendl et           depth–time relationship in the ice core is not linear, data are
al., 2014) using a peristaltic pump. The resultant aerosols      treated here as a function of the sample number of progres-
flowed to the SP2 inlet at a known rate using carbon-free        sion with depth in the ice core, while the dates of the individ-
air carrier gas. The peak intensity of light emitted by an in-   ual features detected relative to sample number are specified
candescing rBC particle is linearly proportional to its mass     using the Thompson et al. (2000) depth–age model. There-
(Schwarz et al., 2006), and the SP2 detects this emitted light   fore, the spectral decomposition of the time series into time–

Atmos. Chem. Phys., 21, 5615–5633, 2021                                            https://doi.org/10.5194/acp-21-5615-2021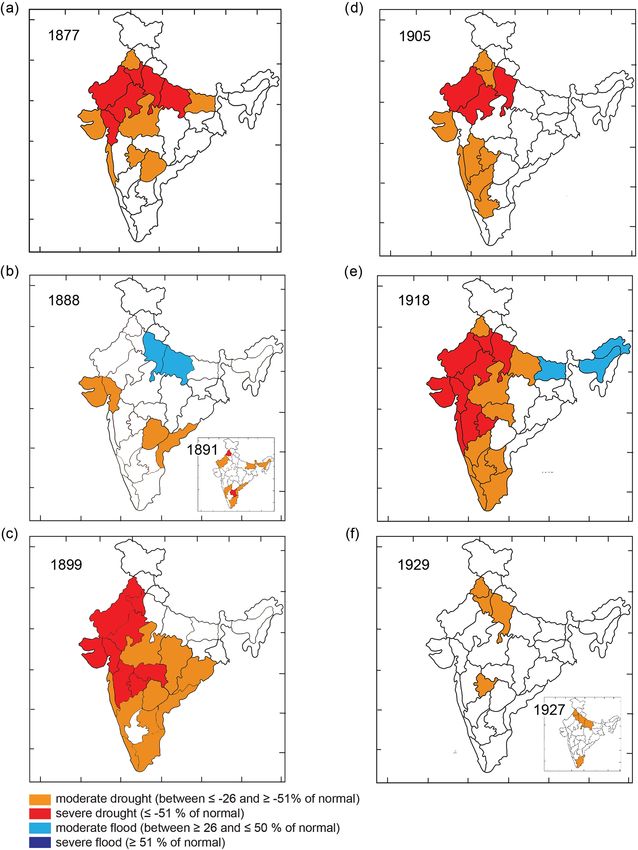
J. D. Barker et al.: Drought-induced biomass burning as a source of black carbon 5619
frequency space is achieved while minimizing the influence 3 Results
of data gaps and nonlinear accumulation rate.
The wavelet analysis of the Dasuopu rBC record was per-
3.1 The rBC record
formed using the Wavelet Toolbox in MATLAB (version
R2020a; MathWorks). A continuous 1-D wavelet transform
was generated to identify modes of variability and the char- Figure 2a shows the 211-year rBC record from the Da-
acteristics of that variability with time throughout the rBC suopu ice core. The mean rBC concentration is 1.5 µg L−1
record. The Mexican hat (or Rickler) mother wavelet was (SD = 5.0, n = 1628) from 1781 (±3 years) to 1992 CE. The
chosen because it is similar to the shape of the annual vari- mean rBC concentration in the glacier ice section from 1781
ability in the rBC concentration signal across the time series to 1944 and the discontinuously sampled firn section from
(Fig. S2 in the Supplement). 1944 to 1992 is 1.4 (SD = 4.4, n = 1572) and 6.0 µg L−1
(SD = 13.5, n = 52), respectively. Note that the median val-
2.5 Trace element analysis ues for the same time periods are less influenced by outliers
with high concentrations (median 1781 to 1944 = 0.2, 1944
Trace element quantification at equivalent depths to the rBC to 1992 = 0.6 µg L−1 ). Even though the rBC concentration in
was only possible for the glacier ice section of the Dasuopu the ice and firn described here is significantly different (two-
ice core due to lack of sampling volume in the correspond- tailed Mann–Whitney U test, p < 0.05), the effect of discon-
ing overlying firn sections. Trace element concentration was tinuously sampling the firn section and its accurate charac-
determined by inductively coupled plasma sector field mass terization of rBC since 1944 is unknown. It is possible that
spectrometry (ICP-SFMS) at BPCRC. A total of 23 trace el- the firn section is biased towards higher rBC concentrations
ements were measured (Al, As, Ba, Bi, Cd, Co, Cr, Cs, Fe, because only 13 % (7 of 52) of the firn samples correspond to
Ga, Mg, Mn, Mo, Nb, Ni, Pb, Rb, Sb, Ti, Tl, U, V, and Zn) snow deposited during monsoon conditions, as indicated by
using methods described in Uglietti et al. (2014) and reported depleted δ 18 O (Fig. S4 in the Supplement), which is a period
by Gabrielli et al. (2020). The trace element crustal enrich- associated with lower atmospheric aerosol loading (Lelieveld
ment factor (EF) is used to identify trace element contribu- et al., 2018). In general, increases in rBC concentration cor-
tions exceeding natural background levels and was calculated respond to δ 18 O enrichment (Fig. 3) and increased dust in
relative to Fe and elemental ratios of dust from the Tibetan glacier ice, indicating that higher rBC concentrations coin-
Plateau following Gabrielli et al. (2020) as an additional vari- cide with the non-monsoonal dry season (Figs. 3 and S4 for
able to be compared with rBC. firn section; Kaspari et al., 2014). Occasional exceptions oc-
cur; for example, in 1824 CE a period of high rBC concentra-
2.6 Back-trajectory analysis
tions corresponds to a relatively low dust concentration and
While the complex topography of the Himalayas affects lo- a low δ 18 O value (Fig. 3a). The relationship between δ 18 O
cal wind patterns, back-trajectory modeling permits the char- enrichment and rBC over a broader and continuous time win-
acterization of the broader regional catchment from which dow is show in Fig. 3d. Here, an analysis of the magnitude-
rBC may be derived. Atmospheric circulation capable of de- squared coherence between 1856 and 1943 at scales rang-
livering rBC to Dasuopu glacier was identified using the ing from a single rBC measurement (period = 1) to 953 rBC
Hybrid Single Particle Lagrangian Trajectory Model (HYS- measurements (period = 476 data points) shows high coher-
PLIT; NOAA Air Resources Laboratory). A 7 d back tra- ence at longer periods (> 256 data points) with no phase lag
jectory was chosen as a conservative estimate of rBC atmo- (as indicated by horizontal arrows oriented to the right) and
spheric residence time given the range reported in the liter- strong coherence between 1878 and 1900 CE at a period of
ature (e.g., Ogren and Charlson, 1983; Reddy and Boucher, 24–120 data points (∼ 2–10 years; 1 year = 12 data points;
2004, 2007; Samset et al., 2014; Lund et al., 2018). Back Fig. S1) with a lag in rBC of 0.25 for a cycle (as indicated
trajectories from the Dasuopu drill site were calculated at 6 h by the vertical arrow) or 0.25–2.5 years (6–30 data points),
intervals from 1948–1991 for January (winter/non-monsoon) suggesting that rBC increases at the end of the dry season
and July (summer/monsoon) using the NCEP/NCAR (Na- during this period. There is also a band of strong coherence
tional Centers for Environmental Prediction/National Center from 1910–1943 occurring with a periodicity of ∼ 15 years
for Atmospheric Research) reanalysis from 1948 (the limit (∼ 8 points yr−1 ; Fig. S1) with no phase lag, suggesting that
of the NCEP/NCAR dataset) to 1991. rBC concentrations reach their maximum at the peak of the
dry season.
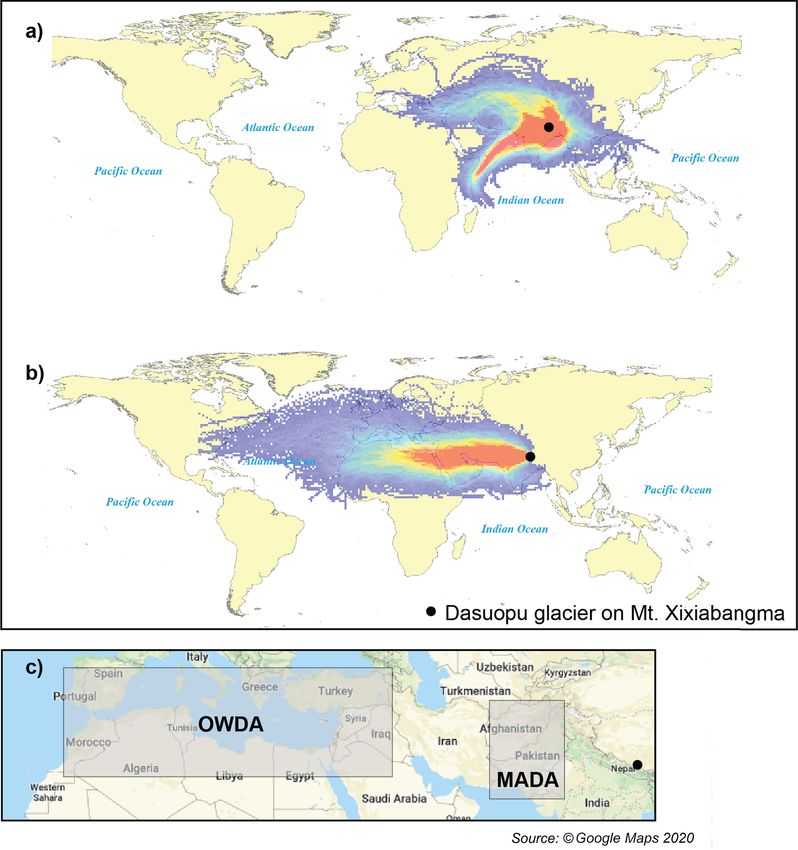
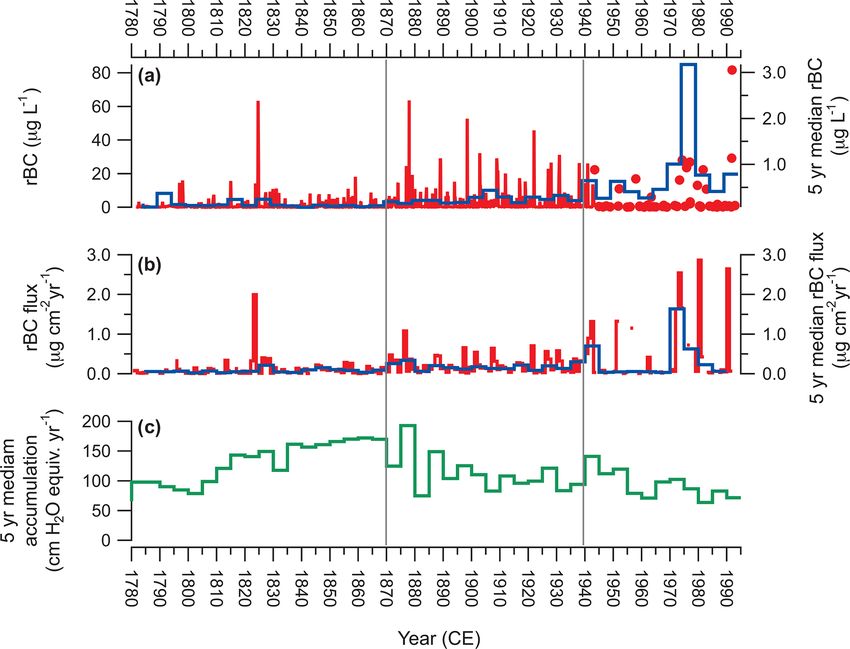
The smoothed (5-year median) rBC concentration and flux
(the product of mean annual rBC concentration and snow ac-
cumulation) records show an increase beginning in ∼ 1870
and again in ∼ 1935 (Fig. 2a and b). The discontinuous firn
section of the core has elevated concentrations during the late
1960s–1970s, consistent with observations from East Rong-
https://doi.org/10.5194/acp-21-5615-2021 Atmos. Chem. Phys., 21, 5615–5633, 2021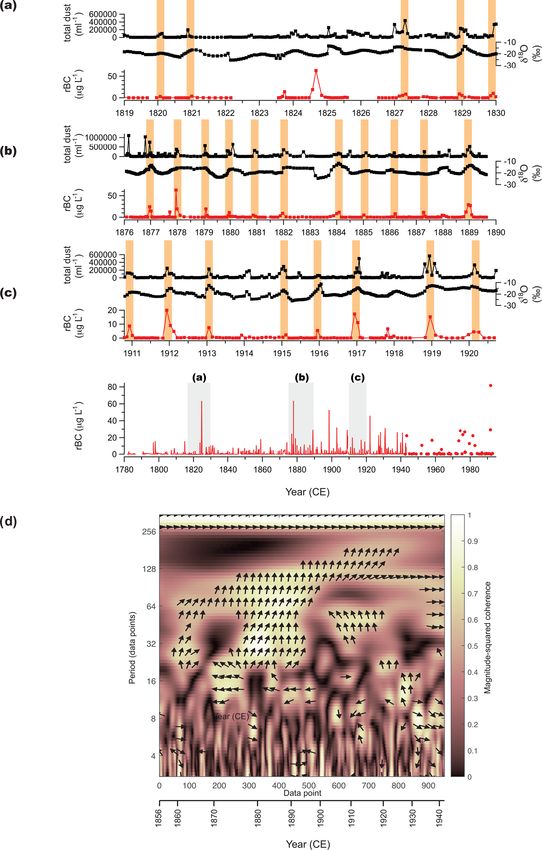
5620 J. D. Barker et al.: Drought-induced biomass burning as a source of black carbon
Figure 2. (a) The rBC record from the Dasuopu ice core (red). Red dots indicate discrete firn samples. The 5-year median is indicated (blue).
(b) The rBC deposition flux onto Dasuopu glacier (red) with the 5-year median (blue). (c) The annual snow accumulation record for the
Dasuopu ice core (Davis et al., 2005).
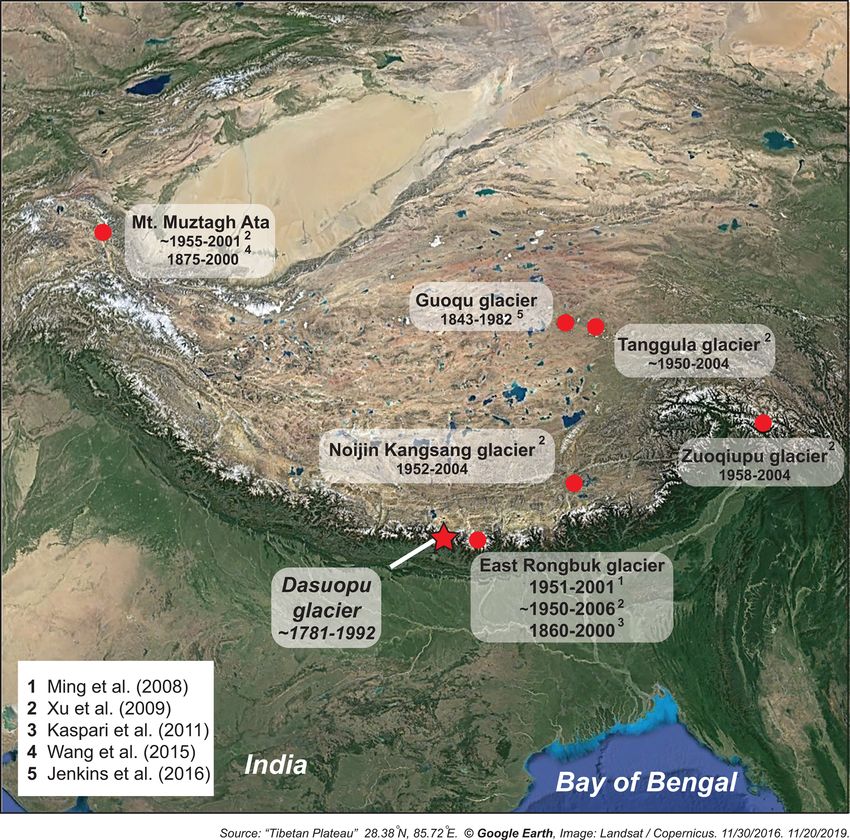
buk glacier by Ming et al. (2008) and Kaspari et al. (2011) 1877, 1888, 1908, 1920, 1930, and 1977 CE if peaks that
and for Tanggula glacier by Xu et al. (2009). are > 25 % of the largest peak amplitude in the time series
(1977 CE) are considered (Fig. 4d). Dips in the a = 27 spec-
3.2 Spectral analysis tral coefficients, indicating periods of low amplitude (de-
fined here as > 25 % of the amplitude of the lowest dip
We chose to examine three modes of variability within the at 1937 CE), occur at 1818, 1868, 1875, 1880–1884, 1893,
spectral analysis (Fig. 4b), two of which correspond to North 1914, 1924, and 1937 CE (Fig. 4d).
Atlantic sea surface temperature (SST), because of the im- The a = 512 (∼ 85-year) mode identifies a shift from
portant role of westerly atmospheric circulation in the Da- some samples with negative spectral coefficients (values be-
suopu region during the winter non-monsoonal season (Davis low zero) to those with positive spectral coefficients at ∼
et al., 2005); the annual frequency is responsible for 90 % of 1877 CE (Fig. 4e). All three modes identify a period early
the variance in the seasonal cycle of SST in the North At- in the rBC record characterized as a quiescent period (1781–
lantic (Feliks et al., 2011) and ∼ 4.5-year variability that is 1877 CE) during which rBC concentrations do not exceed
the middle value of three modes of SST oscillation (3.7, 4.5, 19.3 µg L−1 (mean = 0.8, SD = 3.0, n = 880), except for the
and 6.2 years; Feliks et al., 2011) in the Cape Hatteras re- isolated peak (63.3 µg L−1 ) at 1825 CE (Fig. 4a, c, and d).
gion of the North Atlantic (44◦ N, 47◦ W). A third mode of Prior to 1877 the rBC concentration in the ice core is signifi-
variability (∼ 85 years) was chosen to identify longer-term cantly lower (Mann–Whitney U test, p < 0.05) and less vari-
variation in the rBC record. able (mean = 0.8, SD = 3.03, n = 898) than the post-1877
The mode at a = 6 (a = 0.5 × frequency) indicates high- period (mean = 2.3, SD = 6.6, n = 732; Fig. 4). While the
frequency and generally relatively low-amplitude vari- ∼ 85-year mode identifies a shift from negative to positive
ability in spectral coefficients (81 % of rBC concentra- spectral coefficients in 1877, the 5-year median of the rBC
tions are < 1 µg L−1 ) occurring at approximately annual record identifies an increase occurring at ∼ 1870. This sug-
(12 data points yr−1 ; SD = 4.3, n = 112) resolution with iso- gests that the wavelet analysis may be sensitive to individual
lated relatively higher-amplitude events dispersed throughout or tightly clustered peaks in the rBC record, such as those
the record (Fig. 4c). The frequency of these higher-amplitude that occur between 1875 and 1880 (Figs. 3a and 4a).
events increases from ∼ 1877 until 1992 CE (Fig. 4a and c).
The lower-frequency mode (a = 27; ∼ 4.5 years) cap-
tures periodic peaks in rBC concentrations centered at 1825,
Atmos. Chem. Phys., 21, 5615–5633, 2021 https://doi.org/10.5194/acp-21-5615-2021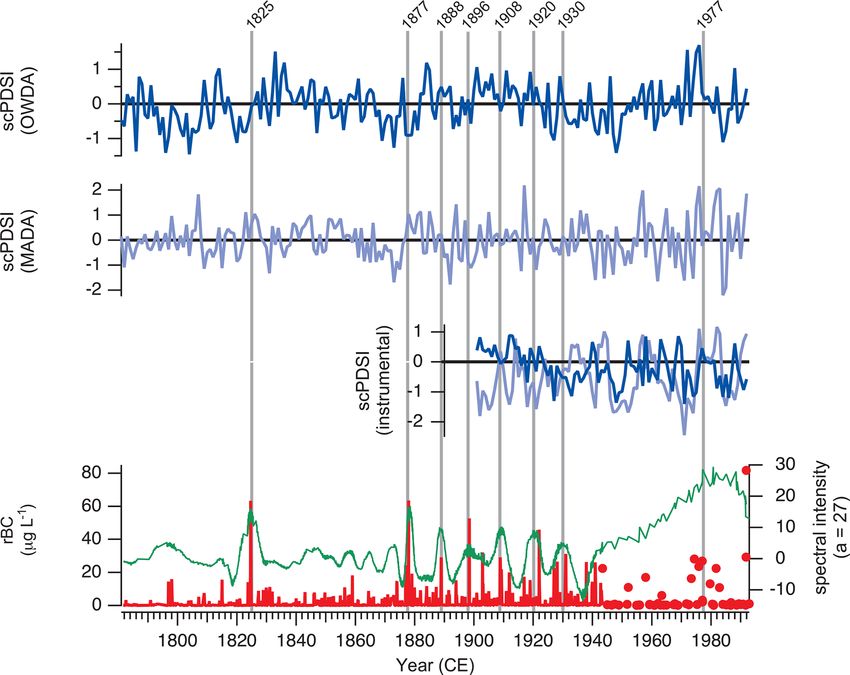
J. D. Barker et al.: Drought-induced biomass burning as a source of black carbon                                                       5621

Figure 3. Peaks in the rBC record compared to the total dust and δ 18 O records (Thompson et al., 2000) over three time intervals (a: 1819–
1830, b: 1876–1890, c: 1911–1921 CE) in the Dasuopu ice core. Note that peaks in the rBC record are associated with depleted δ 18 O and
increased dust deposition. The spectral coherence between rBC and δ 18 O between 1856 and 1943 CE (d) shows strong magnitude-squared
coherence at a long period (∼ 21 years) with no phase lag (as shown by arrows oriented in radian space (i.e., the arrow oriented to the right
indicates no phase lag; arrows oriented to the left indicate an antiphase relationship), strong magnitude-squared coherence between 2 and
10 years with a 0.5–2.5-year phase lag between 1878 and 1900 CE, and strong magnitude-squared coherence with no phase lag between 1910
and 1943 CE.

https://doi.org/10.5194/acp-21-5615-2021                                                   Atmos. Chem. Phys., 21, 5615–5633, 2021
5622                                        J. D. Barker et al.: Drought-induced biomass burning as a source of black carbon

Figure 4. The spectral analysis of the Dasuopu rBC concentration record. Sample number 1 is located at the bottom of the ice core (1781 CE),
and sample number 1628 is at the top of the firn section (1992 CE). (a) The rBC record plotted relative to sample number. (b) The spectral
analysis showing variance across all frequency scales relative to sample number ranging from a = 2 to a = 512. Darker shades indicate
relatively stronger (more positive) coherence between the wavelet and the rBC record, as indicated in the spectral coefficients. Panels (c–e)
are the spectral coefficients relative to sample number for frequency scales a = 6, 27, and 512, respectively.

3.3    Comparison of the rBC record with the trace                       ered independently, then the correlation between trace ele-
       element record                                                    ments and rBC is still statistically correlated (range of 0.26
                                                                         for Zn at n = 915 to 0.44 for Mg and Mn at n = 915). In
                                                                         contrast, the post-1877 period shows a statistically insignifi-
When considering the full record (n = 857 to 916 depending
                                                                         cant slightly negative correlation between the trace elements
on the element; Table 1), all of the trace element concentra-
                                                                         and rBC ranging from −0.04 (Cs and Nb, n = 913 and 915,
tions analyzed are significantly correlated with rBC (range
                                                                         respectively) to −0.10 (Bi and Mn, n = 857 and 915, respec-
of 0.15 for Zn at n = 915 to 0.27 for Rb at n = 914; Table 1;
                                                                         tively).
α = 0.01). The Spearman correlation test is used instead of
                                                                            The crustal enrichment factor (EF) for all of the trace ele-
the Pearson correlation test because the rBC and trace ele-
                                                                         ments was significantly weakly to moderately negatively cor-
ment data are not normally distributed. If the low-rBC pre-
                                                                         related with rBC for all trace elements, ranging from −0.21
1877 period, as indicated by the spectral analysis, is consid-

Atmos. Chem. Phys., 21, 5615–5633, 2021                                                     https://doi.org/10.5194/acp-21-5615-2021
J. D. Barker et al.: Drought-induced biomass burning as a source of black carbon 5623
Table 1. The Spearman correlation coefficient (rs , α = 0.01) for trace elements and the trace element enrichment factor (EF) relative to rBC
concentration throughout the Dasuopu ice core. Italics indicate a non-statistically significant rs .
Trace EF EF EF
element Total Pre-1877 Post-1877 total pre-1877 post-1877
(n) rs rs rs rs rs rs
Al (915) 0.22 0.40 −0.08 −0.45 −0.40 −0.55
As (914) 0.23 0.41 −0.06 −0.41 −0.41 −0.44
Ba (916) 0.26 0.43 −0.07 −0.24 −0.25 −0.28
Bi (857) 0.20 0.40 −0.10 −0.37 −0.33 −0.44
Cd (916) 0.23 0.37 −0.07 −0.50 −0.48 −0.62
Co (915) 0.23 0.41 −0.09 −0.38 −0.40 −0.42
Cr (915) 0.19 0.38 −0.09 −0.56 −0.53 −0.64
Cs (913) 0.25 0.41 −0.04 −0.39 −0.35 −0.48
Fe (915) 0.23 0.42 −0.07
Ga (915) 0.22 0.39 −0.07 −0.57 −0.54 −0.68
Mg (915) 0.24 0.44 −0.09 −0.21 −0.20 −0.22
Mn (915) 0.24 0.44 −0.10 0.02 −0.01 0.06
Mo (915) 0.22 0.37 −0.08 −0.54 −0.52 −0.63
Nb (915) 0.21 0.36 −0.04 −0.48 −0.46 −0.59
Ni (915) 0.22 0.39 −0.09 −0.50 −0.50 −0.57
Pb (916) 0.23 0.40 −0.08 −0.31 −0.31 −0.35
Rb (914) 0.27 0.43 −0.05 −0.49 −0.47 −0.60
Sb (916) 0.19 0.38 −0.07 −0.56 −0.52 −0.65
Ti (914) 0.23 0.41 −0.08 −0.28 −0.25 −0.42
Tl (916) 0.24 0.42 −0.08 −0.52 −0.49 −0.62
U (916) 0.24 0.41 −0.07 −0.29 −0.29 −0.34
V (915) 0.24 0.40 −0.07 −0.52 −0.51 −0.63
Zn (915) 0.15 0.26 −0.06 −0.53 −0.52 −0.63
for Mg to −0.57 for Ga, except for Mn, which was insignif- 4 Discussion
icantly positively correlated (0.02). The trace element EFs
were more negatively correlated with rBC during the post- 4.1 rBC concentrations
1877 period than the pre-1877 period (excluding Mn because
it was insignificantly correlated; SD = 0.14), although this The mean rBC concentration in the Dasuopu ice core from
difference is not statistically significant, with values t (22) = 1781 to 1992 CE is 1.5 µg L−1 (SD = 5.0, n = 1628); this is
1.88 and p = 0.07 (p < 0.05). 6 times higher than the average rBC reported by Kaspari et
al. (2011) for the period 1860–1992 and ∼ 2 times lower than
3.4 Back trajectory BC reported by Ming et al. (2008) and Xu et al. (2009) for
the East Rongbuk ice core record over similar time periods
Figure 5a shows the results of the July back trajectory: (Fig. 1). Note that while Kaspari et al. (2011) measured BC
aerosols are primarily derived from areas to the southwest from the East Rongbuk core using the same incandescence
of the Dasuopu drill site, from the Arabian Sea, and across method used here, samples were stored as liquid and mea-
western and northern India during the monsoon. A secondary sured concentrations are likely underestimated due to rBC
source is located to the west and draws atmospheric aerosols particle adherence onto the walls of the storage container
from the eastern Mediterranean Sea and Arabian Peninsula. and/or agglomeration of BC particles above the detected par-
January (non-monsoon) circulation is derived from the west- ticle size range (Wendl et al., 2014; Kaspari et al., 2014).
erly circulation across northeastern Africa, central Europe, In contrast, Ming et al. (2008) and Xu et al. (2009) mea-
the Arabian Peninsula, and northwestern India (Fig. 5b). sured BC concentration by thermo-optical methods, which
may result in an overestimation of reported BC due to or-
ganic matter pyrolysis during analysis (Gilardoni and Fuzzi,
2017), and a larger fraction of the carbonaceous particles be-
ing classified as BC.
https://doi.org/10.5194/acp-21-5615-2021 Atmos. Chem. Phys., 21, 5615–5633, 20215624 J. D. Barker et al.: Drought-induced biomass burning as a source of black carbon
Figure 5. Frequency of back trajectories for air masses arriving at Mt. Xixiabangma in (a) July and (b) January. Red and blue indicate
higher-frequency and lower-frequency air mass flow paths, respectively. The area included in the Old World Drought Atlas (OWDA; Cook
et al., 2015) and the Monsoon Asia Drought Atlas (MADA; Cook et al., 2010) reconstructions is indicated (c).
4.2 rBC seasonality 4.3 Temporal variations in high rBC concentrations
and regional climate
Seasonally, peaks in rBC concentration correspond to inter-
vals of increased dust concentration and enriched δ 18 O over The pre-1877 CE period differs from the post-1877 CE pe-
the entire ice core record (see examples in Fig. 3), indi- riod in the frequency and amplitude of variability in rBC
cating that high BC concentrations are associated with the concentration (Figs. 2a and 4e). The high-rBC-concentration
non-monsoonal season when drier westerly air masses dom- event in ∼ 1825 CE (Fig. 4c) occurs during an otherwise qui-
inate atmospheric circulation (Fig. 5). Weather station mea- escent pre-1877 CE period coinciding with a time of severe
surements and previous snow–ice studies in the region con- regional moisture stress and droughts, as reflected in sup-
firm that rBC concentrations are lower in near-surface air pressed tree ring growth across Nepal, peaking in 1817 CE
at the Nepal Climate Observatory-Pyramid (NCO-P; 5079 m (Figs. 6 and 7 in Thapa et al., 2017). This period of abnor-
a.s.l.) during the monsoon (Bonasoni et al., 2010; Marinoni mally dry conditions occurs after two large volcanic events:
et al., 2010, 2013) and higher during the pre-monsoon pe- the Tambora eruption of 1815 (Stothers, 1984) and an erup-
riod (Babu et al., 2011; Nair et al., 2013; Ginot et al., 2014; tion of unknown origin in 1809 CE (Cole-Dai et al., 2009).
Kaspari et al., 2014; Chen et al., 2018). Anchukaitis et al. (2010) argue that major explosive erup-
tions in the tropics can disrupt the Asian monsoon system
and result in drier conditions in central Asia for up to 8 years
afterward. Dry conditions are typically associated with an in-
crease in the frequency and severity of biomass burning in
Atmos. Chem. Phys., 21, 5615–5633, 2021 https://doi.org/10.5194/acp-21-5615-2021J. D. Barker et al.: Drought-induced biomass burning as a source of black carbon 5625
Southeast Asia (Baker and Bunyavejchewin, 2009), and the al., 2015) and include areas identified by the back-trajectory
association between dry conditions and increases in rBC con- analysis as being potential source regions for rBC to Da-
centration suggests that biomass burning may be a source of suopu glacier (Fig. 5b). The Monsoon Asia Drought Atlas
high-rBC-concentration events at Dasuopu glacier. (MADA; Cook et al., 2010) provides a similar dataset for
From ∼ 1877 CE until the end of the rBC record in 1992, regions in East Asia, including Pakistan and Afghanistan,
rBC concentrations are significantly higher and their am- which may contribute rBC on Dasuopu glacier (Fig. 5b). An
plitude increases, as indicated by the shift from negative instrumental record for both the OWDA and MADA begins
to positive spectral coefficients at a = 512 (Fig. 4e). This in 1901 (Fig. 6). Comparing the peaks in rBC concentra-
suggests a change in either the magnitude of rBC emission tion identified by the spectral coefficients (a = 27, ∼ 4.5-
source(s) or in the atmospheric mechanism that delivers rBC year frequency) centered at 1825, 1877, 1888, 1898, 1908,
to Dasuopu glacier after ∼ 1877 CE. The increase in rBC af- 1920, 1930, and 1977 CE (Fig. 4d) to the reconstructed and
ter ∼ 1877 corresponds to a decrease in snow accumulation instrumental self-calibrating Palmer Drought Severity In-
onto Dasuopu glacier (Fig. 2c; Davis et al., 2005) and an dex (scPDSI) for the summer season (positive and negative
increase in the rBC flux from the atmosphere beginning in scPDSI indicate wet and dry conditions, respectively; Fig. 6),
∼ 1880 (Fig. 2b). This decrease in snow accumulation has it is possible to identify periods of dryness that might con-
been linked to a strengthening of the Icelandic low-pressure tribute to the production of rBC by biomass burning.
system as temperatures in the Northern Hemisphere warmed The rBC wavelet coefficient peaks in 1825 and 1877 CE
at the termination of the Little Ice Age (LIA). This resulted in occur at the end of a decade-long period of negative scPDSI
a shift in the North Atlantic Oscillation Index (NAO) from a in the OWDA and MADA reconstructions, respectively
negative mode to a positive mode, contributing less moisture (Fig. 6). Similarly, 1888, 1898, and 1930 follow years of neg-
to the southern Himalaya during winter (Davis et al., 2005). ative scPDSI in either the OWDA or MADA reconstructions,
Less winter snow accumulation after ∼ 1877 would be asso- indicating periods of dryness preceding episodes of elevated
ciated with generally drier winter (non-monsoon) conditions rBC concentration at Dasuopu glacier (Fig. 6). The 1908 and
when the rBC concentration is highest at Dasuopu glacier. 1920 CE peaks do not follow periods of negative scPDSI in
the OWDA or MADA reconstructions, but they follow pe-
4.4 The influence of drought and biomass burning on riods of negative scPDSI in the MADA instrumental record
the rBC record (Fig. 6), indicating that dryness is associated with these rBC
concentration peaks as well. The peak centered at 1977 CE
Biomass burning and associated rBC emissions result from follows periods of positive scPDSI in the OWDA and MADA
dry conditions and drought, which lowers the water table and reconstructions and instrumental records. It does not appear
dries out biomass fuel (Baker and Bunyavejchewin, 2009; to be related to abnormally dry conditions and may indicate
Tosca et al., 2010). Further, aerosols produced during fires an unidentified source of rBC. Conversely, dips in the spec-
may contribute to a positive feedback cycle whereby smoke tral coefficients at a ∼ 4.5-year frequency (a = 27) indicate
plume shading decreases sea surface temperature, while in- periods of low rBC concentration occurring at 1818, 1868,
creased concentrations of atmospheric BC warm and stabi- 1875, 1880-1884, 1893, 1914, 1924, and 1936 CE. With the
lize the troposphere, suppressing convection and precipita- exception of the dip centered at 1875 and 1936 CE, dips
tion and intensifying drought conditions on land (Tosca et in the spectral coefficient record follow periods of positive
al., 2010). High BC aerosol levels in ambient air correspond- scPDSI in either the OWDA and MADA tree ring reconstruc-
ing to agricultural burning beginning in late April and forest tion or both. While dips centered at 1914 and 1924 CE follow
fire activity during the non-monsoon season were reported periods of positive scPDSI in both the OWDA and MADA
by Negi et al. (2019) from ambient air measurements at Chir- instrumental record, 1936 CE follows a period of positive
basa, India (Gangotri glacier valley) during 2016. The spec- scPDSI in the MADA instrumental record only (Fig. 6).
tral coefficients calculated here identify trends in the rBC In addition to the scPDSI from the OWDA and MADA
concentration on Dasuopu glacier and can be compared to tree ring reconstructions and the instrumental record (since
regional rainfall data from a network of rain gauge stations 1900 CE), an independent historical record for rainfall is
that are distributed across India to identify periods of dryness available for India that was compiled by Mooley et al. (1981)
(e.g., Parthasarathy et al. 1987) associated with higher rBC and has since been reported in terms of drought and flood
concentrations. severity by Parthasarathy et al. (1987; Supplement Table S1a
Continuous regional instrumental rainfall records within and b). As mentioned, several periods of high rBC concen-
the atmospheric catchment for atmospheric aerosols at Da- tration are identified by the spectral coefficients at a = 27
suopu glacier prior to the early 1900s CE are rare, and (∼ 4.5-year frequency) centered at 1825, 1877, 1888, 1898,
biomass burning records are nonexistent. However, contin- 1908, 1920, 1930, and 1977 CE (Fig. 4d). These periods of
uous tree-ring-based reconstructions of precipitation condi- high rBC concentration coincide with periods of drought
tions for Europe, North Africa, and the Middle East are pro- reported for India, particularly in western and northwest-
vided by the Old World Drought Atlas (OWDA; Cook et ern meteorological subdivisions (Parthasarathy et al., 1987),
https://doi.org/10.5194/acp-21-5615-2021 Atmos. Chem. Phys., 21, 5615–5633, 20215626 J. D. Barker et al.: Drought-induced biomass burning as a source of black carbon Figure 6. The Dasuopu rBC record (in red) compared to regional reconstructed and instrumental climate records from the Old World Drought Atlas (OWDA; dark blue) and the Monsoon Asia Drought Atlas (MADA; light blue). Note the correspondence between a negative self-calibrating Palmer Drought Severity Index (scPDSI) and periods of high rBC deposition. Data for both the reconstructed and instrumental climate records are obtained from the OWDA (drought.memphis.edu/OWDA/) and MADA (drought.memphis.edu/MADA). within the ±3-year dating error of the ice core chronology ceptional (Fig. S3), and it does not correspond to anoma- (Fig. 7; Fig. S3a in the Supplement). For example, from lously high rBC values (Fig. 2a), yet it corresponds to a pe- 1876–1878, India experienced widespread moderate to se- riod of highly positive spectral coefficients (Fig. 4c and d). vere drought conditions (Parthasarathy et al., 1987; Fig. 7a) Finite-length signal border effects (so-called edge effects) and soil moisture deficits (Mishra et al., 2019) that resulted have been well documented, whereby a wavelet transform in the “Madras famine” (Cook et al., 2010; Mishra et al., (such as that used here) yields abnormal coefficients as the 2019). In 1888 (and 1891, which is within the ±3-year ice wavelet extends into the “shoulder areas” of the record that core dating uncertainty), regions in western and northwest- do not have data (Su et al., 2011; Montanari et al., 2015). It ern India experienced moderate and severe drought condi- is possible that the peak identified here at a = 6 and a = 27 tions (Fig. 7b). In 1899 (corresponding to 1898 in the rBC is a result of wavelet transform edge effects. Alternatively, record, ±3 years), northwestern and western meteorologi- sources other than biomass burning that have not been iden- cal subdivisions (among others) experienced severe drought, tified here may contribute to the high rBC values observed in while moderate drought was experienced by most of India the Dasuopu ice core ∼ 1977 CE. (Fig. 7c), resulting in famine that affected 59.5 million peo- Dips in the a = 27 spectral coefficient record correspond ple (Mishra et al., 2019). In 1911 (1908 ± 3 years) there to periods of flooding in India. For example, the trough at was extreme drought reported in the northwest and moderate 1875 CE corresponds to reports of extreme flooding in the drought reported in the north-central and southwestern mete- northwest and moderate flooding in western India (Fig. 8a). orological districts (Fig. 7d). In 1918 (1920 ± 3 years), there It should be noted that moderate drought was reported in the was severe drought reported in the north and central-west far west and south, but these conditions did not result in an and moderate drought reported throughout the southern and rBC peak in the a = 27 coefficients (Fig. 4d). For the period north-central regions of the continent (Fig. 7e). From 1927– ∼ 1880 to 1886 CE, severe and moderate flooding is reported 1929 (1930 ± 3 years), moderate drought was reported in the in the west in 1884 CE, with moderate drought to the south northern region of India (Fig. 7f). Similar to observations and east that did not result in an rBC peak in the a = 27 co- from the OWDA and MADA comparisons, the ∼ 1977 pe- efficients (Fig. 8b). From 1880–1882 CE, the continent ex- riod does not stand out in the climate record as being ex- perienced relatively stable conditions, with moderate flood- Atmos. Chem. Phys., 21, 5615–5633, 2021 https://doi.org/10.5194/acp-21-5615-2021
J. D. Barker et al.: Drought-induced biomass burning as a source of black carbon                                                     5627

Figure 7. The distribution of meteorological subdivisions in NW India reporting drought during periods of high spectral intensity at a = 27
scale.

ing in some western and northwestern districts (Fig. S3).               4.5   rBC and trace metals
Western India experienced severe and moderate flooding in
the west and northwest in 1893 (Fig. 8c), corresponding to              Recent work by Gabrielli et al. (2020) suggests that atmo-
a dip in the a = 27 coefficients (Fig. 4d). The years 1914              spheric trace metals preserved in the Dasuopu ice core, likely
and 1917 (1914 ± 3 years), 1926 (1924 ± 3 years), and 1933              linked to the long-range transport of fine fly ash, are indica-
(1936 ± 3 years) all saw severe and/or moderate flooding in             tive of emissions from coal combustion and fires used to
western meteorological districts, with no drought conditions            clear forested areas to the west of the Himalayas since the
reported in the rest of India, corresponding to dips in the             beginning of the Industrial Revolution (∼ 1780 CE). Fly ash
a = 27 coefficients (Fig. 8d, e, and f, respectively).                  is composed of alumino-silicate and iron-rich by-products of
                                                                        coal combustion and biomass burning, and it is enriched in
                                                                        trace metals (Ross et al., 2002). Fly ash is not detected by the
                                                                        SP2 as configured here.

https://doi.org/10.5194/acp-21-5615-2021                                                  Atmos. Chem. Phys., 21, 5615–5633, 2021
5628 J. D. Barker et al.: Drought-induced biomass burning as a source of black carbon
Figure 8. The distribution of meteorological subdivisions in NW India reporting flood conditions during periods of low spectral intensity at
a = 27 scale.
We observe a general negative correlation between BC Increases in the concentration of rBC resulting from
and the crustal enrichment factor (EF; indicative of element biomass burning may be expected to correlate with trace ele-
concentrations above the natural background derived from ments associated with the biomass source material (K, Cl,
crustal material) of trace metals in the Dasuopu core, par- Zn, and Br; Echalar et al., 1995). Of these, only Zn was
ticularly after 1877 CE (Table 1) when rBC spectral coeffi- analyzed here. The Zn concentration is only weakly corre-
cients are positive at a = 512 (Fig. 4e). This illustrates that lated with rBC (0.15), although more strongly (0.26) in the
the enrichment of the non-crustal fraction of trace metals (as pre-1877 period than in the post-1877 period (−0.06), and
indicated by a positive EF) and fly ash occurred out of phase Zn’s EF is moderately negatively correlated, particularly in
from rBC. the post-1877 period (−0.63). While the lack of correlation
between potential biomass-burning-derived trace elements
Atmos. Chem. Phys., 21, 5615–5633, 2021 https://doi.org/10.5194/acp-21-5615-2021J. D. Barker et al.: Drought-induced biomass burning as a source of black carbon 5629
such as Zn and rBC might suggest a non-biomass-burning bustion, appear to be of minor influence during these periods
source for rBC, one should be cautious in attributing spe- of increased rBC deposition as indicated by the absence of
cific trace elements to biomass burning events. For exam- correlation between rBC concentration in the Dasuopu core
ple, trace elements emitted during partial combustion can and the crustal enrichment of industrially sourced trace ele-
vary depending on fire intensity (flaming vs. smoldering), ments at equivalent depths in the ice core. It should be noted
fuel source (savanna vs. forest) (Echalar et al., 1995), and that the Dasuopu ice core rBC record is discontinuous during
size-dependent particle adhesion (Samsonov et al., 2012). the period of increased regional industrial activity; thus, the
Further, biomass burning remobilizes soil-derived particles, available data cannot address the importance of this regional
which would lower the individual trace element’s EF (Gau- industrialization for rBC deposition onto Dasuopu glacier.
dichet et al., 1995), causing a negative correlation between Together, evidence presented here indicates that while rBC
rBC and EFs. There is a statistically significant negative cor- transport in the free troposphere is influenced by large-scale
relation with rBC for all of the trace element EFs (except for synoptic circulation, regional sources of rBC strongly influ-
Mn), suggesting that rBC enrichment is not associated with ence rBC deposition onto Dasuopu glacier, particularly after
non-crustal trace element enrichment, which is interpreted as ∼ 1877, and that the rBC record from Dasuopu glacier may
an indicator of fly ash deposition (Gabrielli et al., 2020) that provide a proxy record for drought and resultant biomass
is enriched above the natural dust input. Of importance is that burning within its catchment of atmospheric circulation.
the discontinuous sampling of firn in the Dasuopu ice core
record presented here does not capture a continuous record
of rBC deposition during the post-1970s, which is a period Data availability. The data presented in this work are archived at
when rBC is reported to have increased in the southern Hi- the National Oceanic and Atmospheric Administration World Data
malaya (Kaspari et al., 2011) and Tibetan Plateau (Jenkins et Service for Paleoclimatology at https://www.ncdc.noaa.gov/paleo/
al., 2016; Wang et al., 2015). study/32952 (Barker, 2021).
Supplement. The supplement related to this article is available on-
5 Conclusions
line at: https://doi.org/10.5194/acp-21-5615-2021-supplement.
Here, we present the highest-elevation (7200 m a.s.l.) record
of rBC ever reported. This record is unique in its high eleva-
Author contributions. JDB performed the sample preparation, BC
tion and represents conditions in the free troposphere, away analysis, and interpretation and was the primary author of the pa-
from local sources of BC. The Dasuopu record also con- per. SK assisted with the BC analysis and interpretation of the BC
tributes to the limited number of proxy records of BC in the record. PG designed the overall project and performed the trace ele-
HKH region where glacier melt, and therefore factors such ment analysis with AW. AW, EB, and MRS-H cut the samples from
as BC that affect glacier melt, influences the water security the ice core and performed the trace element analysis. LT retrieved
of one of the most densely populated regions of the planet. the Dasuopu ice core. All authors contributed to paper preparation.
While the Dasuopu rBC record presented here is not well
resolved during the period after the 1970s, the record does
indicate elevated BC during 1970–1980, consistent with the Competing interests. The authors declare that they have no conflict
Everest ice core BC record that shows elevated BC post-1970 of interest.
(Kaspari et al., 2011).
The rBC concentration at the Dasuopu site is highest dur-
ing the winter (non-monsoon) season when westerly circula- Acknowledgements. This work was funded by the NSF Atmo-
spheric Chemistry Program, the NSF-ESH program, The Ohio State
tion is dominant. Back-trajectory analyses indicate that this
University, the Ohio State Committee of Science and Technology,
westerly circulation predominantly includes areas of west-
and the National Natural Science Foundation of China. We thank
ern and northwestern India, Afghanistan, Pakistan, northern the many scientists, engineers, technicians, and graduate students
Africa, central Europe, and the Mediterranean. Dry condi- from the Byrd Polar and Climate Research Center and the Lanzhou
tions increase the production of rBC through biomass burn- Institute of Glaciology and Geocryology (China) that contributed to
ing, and we suggest that regional biomass burning con- the collection and previous analysis of the Dasuopu ice core. We are
tributes to periods of high rBC deposition onto the Dasuopu grateful to Julien Nicolas for performing the graphic display of the
glacier during periods of dryness as indicated by historical back trajectories. We thank two anonymous reviewers who provided
records of precipitation within the atmospheric catchment of input to greatly improve this paper.
Dasuopu glacier. The continuous historical record of precip-
itation for India, in particular, suggests an association be-
tween moderate to severe drought conditions in western and Financial support. This research has been supported by the NSF
northwestern India and rBC concentration in the Dasuopu ice Atmospheric Chemistry Program (grant no. 1149239).
core. Upwind industrial sources of rBC, such as coal com-
https://doi.org/10.5194/acp-21-5615-2021 Atmos. Chem. Phys., 21, 5615–5633, 20215630 J. D. Barker et al.: Drought-induced biomass burning as a source of black carbon
Review statement. This paper was edited by Aurélien Dommergue tion in the SE Tibetan Plateau, J. Atmos. Chem., 67, 45–60,
and reviewed by two anonymous referees. https://doi.org/10.1007/s10874-011-9202-5, 2010.
Chaubey, J. P., Babu, S. S., Gogoi, M. M., Kompalli, S.
K., Sreekanth, V., Moorthy, K. K., and Prabhu, T. P.:
Black carbon aerosol over a high altitude (∼ 4.52 km) sta-
tion in Western Indian Himalayas, J. Inst. Eng., 8, 42–51,
References https://doi.org/10.3126/jie.v8i3.5930, 2011.
Chen, X., Kang, S., Cong, Z., Yang, J., and Ma, Y.: Con-
Anchukaitis, K. J., Buckley, B. M., Cook, E. R., D’Arrigo, R. D., centration, temporal variation, and sources of black carbon
and Ammann, C. M.: Influence of volcanic eruptions on the cli- in the Mt. Everest region retrieved by real-time observa-
mate of the Asian monsoon region, Geophys. Res. Lett., 37, 1–5, tion and simulation, Atmos. Chem. Phys., 18, 12859–12875,
https://doi.org/10.1029/2010GL044843, 2010. https://doi.org/10.5194/acp-18-12859-2018, 2018.
Babu, S. S., Chaubey, J. P., Moorthy, K. K., Gogoi, M. M., Cole-Dai, J., Ferris, D., Lanciki, A., Savarino, J., Baroni,
Kompalli, K. K., Sreekanth, V., Bagare, S. P., Bhatt, B. C., M., and Thiemens, M. H.: Cold decade (AD 1810–1819)
Gaur, V. K., Prabhu, T. P., and Singh, N. S.: High alti- caused by Tambora (1815) and another (1809) strato-
tude (∼ 4520 m amsl) measurements of black carbon aerosols spheric volcanic eruption, Geophys. Res. Lett., 36, L22703,
over western trans-Himalayas: Seasonal heterogeneity and https://doi.org/10.1029/2009GL040882, 2009.
source apportionment, J. Geophys. Res.-Atmos., 116, D24201, Cook, E. R., Anchukaitis, K. J., Buckley, B. M., D’Arrigo, R. D.,
https://doi.org/10.1029/2011JD016722, 2011. Jacoby, G. C., and Wright, W. E.: Asian monsoon failure and
Baker, P. J., and Bunyavejchewin, S.: Fire behavior and fire megadrought during the last millennium, Science, 328, 486–489,
effects across the forest landscape of continental South- https://doi.org/10.1126/science.1185188, 2010.
east Asia, in: Tropical Fire Ecology, Springer Praxis Books, Cook, E. R., Seager, R., Kushnir, Y., Briffa, K. R., Buntgen, U.,
Springer, Berlin, Heidelberg, https://doi.org/10.1007/978-3-540- Frank, D., Krusic, P. J., Tegel, W., van der Schrier, G., Andreu-
77381-8_11, 2009. Hayles, L., Baillie, M., Baittinger, C., Bleicher, N., Bonde, N.,
Barker, J. D.: Dasuopu, China 210 Year Ice Core Refractory Black Brown, D., Carrer, M., Cooper, R., Cufar, K., Dittmar, C., Es-
Carbon Data, NOAA National Centers for Environmental Infor- per, J., Griggs, C., Gunnarson, B., Gunther, B., Gutierrez, E.,
mation, available at: https://www.ncdc.noaa.gov/paleo-search/ Haneca, K., Helama, S., Herzig, F., Heussner, K.-U., Hofmann,
study/32952, last access: 7 April 2021. J., Janda, P., Kontic, R., Kose, N., Kynci, T., Levanic, T., Lin-
Bonasoni, P., Laj, P., Marinoni, A., Sprenger, M., Angelini, F., derholm, H., Manning, S., Melvin, T. M., Miles, D., Neuwirth,
Arduini, J., Bonafè, U., Calzolari, F., Colombo, T., Decesari, B., Nicolussi, K., Nola, P., Panayotov, M., Popa, I., Rothe, A.,
S., Di Biagio, C., di Sarra, A. G., Evangelisti, F., Duchi, R., Seftigen, K., Seim, A., Svarva, H., Svoboda, M., Thun, T., Ti-
Facchini, MC., Fuzzi, S., Gobbi, G. P., Maione, M., Panday, monen, M., Touchan, R., Trotsiuk, V., Trouet, V., Walder, F.,
A., Roccato, F., Sellegri, K., Venzac, H., Verza, GP., Villani, Wazny, T., Wilson, R., and Zang, C.: Old world megadroughts
P., Vuillermoz, E., and Cristofanelli, P.: Atmospheric Brown and pluvials during the Common Era, Sci. Adv., 1, e1500561,
Clouds in the Himalayas: first two years of continuous obser- https://doi.org/10.1126/sciadv.1500561, 2015.
vations at the Nepal Climate Observatory-Pyramid (5079 m), At- Davis, M. E., Thompson, L. G., Yao, T., and Wang, N.: Forcing of
mos. Chem. Phys., 10, 7515–7531, https://doi.org/10.5194/acp- the Asian monsoon on the Tibetan Plateau: Evidence from high-
10-7515-2010, 2010. resolution ice core and tropical coral records, J. Geophys. Res.,
Bond, T. C., Streets, D. G., Yarber, K. F., Nelson, S. M., Woo, J.-H., 110, D04101, https://doi.org/10.1029/2004JD004933, 2005.
and Klimont, Z.: A technology-based global inventory of black Debret, M., Bout-Roumazeilles, V., Grousset, F., Desmet, M., Mc-
and organic carbon emissions from combustion, J. Geophys. Manus, J. F., Massei, N., Sebag, D., Petit, J.-R., Copard, Y.,
Res.-Atmos., 109, D14, https://doi.org/10.1029/2003JD003697, and Trentesaux, A.: The origin of the 1500-year climate cy-
2004. cles in Holocene North-Atlantic records, Clim. Past, 3, 569–575,
Bond, T. C., Bhardwaj, E., Dong, R., Jogani, R., Jung, S., Ro- https://doi.org/10.5194/cp-3-569-2007, 2007.
den, C., Streets, D. G., and Trautmann, N. M.: Historical emis- Debret, M., Sebag, D., Costra, X., Massei, N., Petit, J.-R.,
sions of black and organic carbon aerosol from energy-related Chapron, E., and Bout-Roumazeilles, V.: Evidence from
combustion, 1850-2000, Global Biogeochem. Cy., 21, GB2018, wavelet analysis for a mid-Holocene transition in global
https://doi.org/10.1029/2006GB002840, 2007. climate forcing, Quaternary Sci. Rev., 28, 2675–2688,
Bond, T. C., Doherty, S. J., Fahey, D. W., Forster, P. M., Bern- https://doi.org/10.1016/j.quascirev.2009.06.005, 2009.
sten, T., DeAngelo, B. J., Flanner, M. G., Ghan, S., Karcher, Doherty, S. J., Grenfell, T. C., Forsström, Hagg, D. L., Brandt,
B., Koch, D., Kinne, S., Kondo, Y., Quinn, P. K., Sarofim, M. R. E., and Warren, S. G.: Observed vertical redistribution
C., Schultz, M. G., Shulz, M., Venkataraman, C., Zhang, H., of black carbon and other insoluble light-absorbing particles
Zhang, S., Bellouin, N., Guttikunda, S. K., Hopke, P. K., Jacon- in melting snow, J. Geophys. Res.-Atmos., 118, 5553–5569,
son, M. Z., Kaiser, J. W., Klimont, Z., Lohmann, U., Schwarz, https://doi.org/10.1002/jgrd.50235, 2013.
J. P., Shindell, D., Storelvmo, T., Warren, S. G., and Zender, C. Echalar, F., Gaudichet, A., Cachier, H., and Artaxo, P.: Aerosol
S.: Bounding the role of black carbon in the climate system: A emissions by tropical forest and savanna biomass burning: char-
scientific assessment, J. Geophys. Res.-Atmos, 118, 5380–5552, acteristic trace elements and fluxes, Geophys. Res. Lett., 22,
https://doi.org/10.1002/jgrd.50171, 2013. 3039–3042, https://doi.org/10.1029/95GL03170, 1995.
Cao, J., Tie, X., Xu, B., Zhao, Z., Zhu, C., Li, G., and Liu,
S.: Measuring and modeling black carbon (BC) contamina-
Atmos. Chem. Phys., 21, 5615–5633, 2021 https://doi.org/10.5194/acp-21-5615-2021You can also read