Impact of wind pattern and complex topography on snow microphysics during International Collaborative Experiment for PyeongChang 2018 Olympic and ...
←
→
Page content transcription
If your browser does not render page correctly, please read the page content below
Atmos. Chem. Phys., 21, 11955–11978, 2021
https://doi.org/10.5194/acp-21-11955-2021
© Author(s) 2021. This work is distributed under
the Creative Commons Attribution 4.0 License.

Impact of wind pattern and complex topography on snow
microphysics during International Collaborative Experiment
for PyeongChang 2018 Olympic and Paralympic winter
games (ICE-POP 2018)
Kwonil Kim1 , Wonbae Bang1 , Eun-Chul Chang2 , Francisco J. Tapiador3 , Chia-Lun Tsai1 , Eunsil Jung4 , and
Gyuwon Lee1
1 Department  of Astronomy and Atmospheric Sciences, Center for Atmospheric REmote sensing (CARE),
Kyungpook National University, Daegu, Republic of Korea
2 Department of Atmospheric Sciences, Kongju National University, Gongju, Republic of Korea
3 Earth and Space Sciences Research Group, Institute of Environmental Sciences,

University of Castilla-La Mancha, Toledo, Spain
4 Department of Advanced Science and Technology Convergence, Kyungpook National University, Sangju, Republic of Korea

Correspondence: Gyuwon Lee (gyuwon@knu.ac.kr)

Received: 13 February 2021 – Discussion started: 12 March 2021
Revised: 23 June 2021 – Accepted: 6 July 2021 – Published: 10 August 2021

Abstract. Snowfall in the northeastern part of South Ko-           ward side, resulting in significant aggregation in the coastal
rea is the result of complex snowfall mechanisms due to a          region, with riming featuring as a primary growth mechanism
highly contrasting terrain combined with nearby warm wa-           in both mountainous and coastal regions. The cold-low pat-
ters and three synoptic pressure patterns. All these factors to-   tern is characterized by a higher snowfall rate and vertically
gether create unique combinations, whose disentangling can         deep systems in the mountainous region, with the precipi-
provide new insights into the microphysics of snow on the          tation system becoming shallower in the coastal region and
planet. This study focuses on the impact of wind flow and to-      strong turbulence being found in the layer below 2 km in the
pography on the microphysics drawing of 20 snowfall events         mountainous upstream region (linked with dominant aggre-
during the ICE-POP 2018 (International Collaborative Ex-           gation). The warm-low pattern features the deepest system:
periment for PyeongChang 2018 Olympic and Paralympic               precipitation here is enhanced by the seeder–feeder mecha-
winter games) field campaign in the Gangwon region. The            nism with two different precipitation systems divided by the
vertical structure of precipitation and size distribution char-    transition zone (easterly below and westerly above). Overall,
acteristics are investigated with collocated MRR (micro rain       it is found that strong shear and turbulence in the transition
radar) and PARSIVEL (particle size velocity) disdrometers          zone is a likely reason for the dominant riming process in
installed across the mountain range. The results indicate that     the mountainous region, with aggregation being important in
wind shear and embedded turbulence were the cause of the           both mountainous and coastal regions.
riming process dominating the mountainous region. As the
strength of these processes weakens from the mountainous
region to the coastal region, riming became less significant
and gave way to aggregation. This study specifically analyzes      1   Introduction
the microphysical characteristics under three major synoptic
patterns: air–sea interaction, cold low, and warm low. Air–sea     Understanding the developing mechanism of heavy snowfall
interaction pattern is characterized by more frequent snow-        in the eastern part of the Korean Peninsula (Gangwon region)
fall and vertically deeper precipitation systems on the wind-      could have a great impact on improving the accuracy of fore-

Published by Copernicus Publications on behalf of the European Geosciences Union.
11956                               K. Kim et al.: Impact of wind pattern and complex topography on snow microphysics

casts in winter. The snowfall in this region is known to be       different to the lake-effect snow (Laird et al., 2009; Minder
characterized by strong orographic effects due to complex         et al., 2015; Kristovich et al., 2017; Wiley and Mercer, 2020)
terrain in the west (Taebaek Mountains) and by the air-mass       except in that the source of moisture and heat fluxes is here
transformation in the nearby ocean in the east (East Sea). The    the ocean and not a lake.
orographic enhancement and sea effect induce heavy snow-             It is also known that low-pressure systems passing through
fall in this region (Chung et al., 2004; Cheong et al., 2006;     the southern part of the Korean Peninsula support the easterly
Cho and Kwon, 2012; Jung et al., 2012, 2014). The com-            or northeasterly flow over the East Sea in the later part of the
plexity of the snowfall mechanism arises from the steepness       low-pressure passage and supply abundant moisture from the
of terrain from the Taebaek Mountains to the ocean (hori-         Southern Ocean, leading to heavier snowfall (Seo and Jhun,
zontal distance of about 20 km and vertical heights of 1000–      1991; Park et al., 2009; Gehring et al., 2020). Song et al.
2000 m) in combination with air-mass transformation over          (2016) classified the synoptic environments when Siberian
the warm ocean. Thus, complex airflows of this region affect      highs expand eastward with and without low-pressure sys-
microphysics, in particular the snow growth process above         tems. They showed that the mean precipitation amount in-
the melting layer.                                                creased by about 45 % in the presence of both Kaema high
   The details of the interactions between airflows and mi-       and low pressure.
crophysical processes have been partially investigated in the        The complex and steep orography of the Taebaek Moun-
past. Indeed, it is well recognized that the dynamics associ-     tain ranges is another important factor for both the dynamics
ated with the shear have important implications for two pri-      and the precipitation system (amount, distribution, and du-
mary snow growth processes (i.e., aggregation and riming).        ration). The orographic effect on airflow and precipitation is
Under strong shear conditions, the turbulent cell and induced     difficult to characterize because of the many different mech-
updraft are favored, being responsible for the production of      anisms, as many as 20, following Houze (2012). Yu et al.
a considerable amount of supercooled water that promotes          (2007) also pointed out that multiple precipitation cells pro-
both aggregation and riming as they increase the probability      duced by different mechanisms can appear simultaneously in
of collision between hydrometeors, in particular, snowflakes      complex terrain.
and supercooled water droplets (Houze and Medina, 2005;              Previous studies on the impact of the Taebaek Mountains
Barnes et al., 2018). Colle et al. (2014) also investigated the   in the precipitation systems were carried out mainly by nu-
relationship between degree of riming and radar measurables       merical simulation. Lee and Kim (2008) examined the effect
(Doppler radial velocity, spectrum width, etc) from vertically    of the Taebaek Mountains on the distribution and intensity
pointing radar and determined the degree of riming every 15–      of snowfall by removing their topography in numerical ex-
30 min for 12 cyclone events. They reported turbulent mo-         periments. They showed that, with the mountains, updraft
tions and strong updrafts and downdrafts in heavy riming          is strengthened from 0.2 to 1.2 m s−1 , and the accumulated
events. Further insight into the role of the warm conveyor belt   precipitation amount increases 8.5 times more in mountain-
and its dynamics on the snow microphysics in the Gangwon          ous areas than the experiment without mountains. They also
region was provided by Gehring et al. (2020), who argued          found that a topographic blocking by the Taebaek Mountains
that ascents in the warm conveyor belt contributed to per-        causes horizontal convergence and stronger updraft along
sisting production of supercooled liquid water and that the       the coastal region, resulting in heavy snowfall. Lee and Lee
process enhances the riming process during extreme snow-          (2003) also investigated the effect of the Taebaek Moun-
fall events.                                                      tains by numerical simulation for two heavy snowfall events.
   The mean airflow governed by the synoptic patterns con-        They reported that the Froude number, which can represent
trols snowfall in the region. Numerous studies have reported      the blocking degree, is important to determine whether the
that favorable synoptic conditions for heavy snowfall are the     precipitation amount is more in the coastal region or in the
eastern expansion of Siberian high pressure and a cyclone         mountainous region. An insufficient Froude number favors
passing through the central or southern part of the Korean        an occurrence of convergence between blocked and envi-
Peninsula (Lee and Kim, 2008; Park et al., 2009; Jung et al.,     ronmental flow and a shift in maximum precipitation to the
2012; Cho and Chang, 2017; J. Kim et al., 2019). The eastern      coastal area (Ohigashi et al., 2014; Veals et al., 2020). On
expansion of Siberian high pressure (the so-called “Kaema         the other hand, when the Froude number is large enough, the
high pressure”) is responsible for snowstorms by air-mass         maximum precipitation tends to occur over the mountainous
transformation, which is induced by cold easterly or north-       or inland area (Veals et al., 2020).
easterly flow over the East Sea. Sea-effect snow (Estoque            It is also known that the wind flow plays a critical role
and Ninomiya, 1976; Nakamura and Asai, 1985; Ikeda et al.,        in the precipitation patterns of this region. In particular,
2009; Kindap, 2010; Nam et al., 2014; Bao and Ren, 2018;          easterly flow or northeasterly (or sometimes northerly) flow
Steenburgh and Nakai, 2020) is the same kind of mesoscale         is thought to be necessary for the development of heavy
precipitation caused by the air-mass transformation of cold       snowfall (Nam et al., 2014; Cho and Chang, 2017; Tsai
air over warm ocean. It develops over the East Sea and affects    et al., 2018; J. Kim et al., 2019). The term Korea easter-
downstream of the wind flow. This mechanism is not greatly        lies (Kor’easterlies hereafter) was proposed by Park and Park

Atmos. Chem. Phys., 21, 11955–11978, 2021                                         https://doi.org/10.5194/acp-21-11955-2021
K. Kim et al.: Impact of wind pattern and complex topography on snow microphysics                                         11957

(2020) to emphasize the unique features of the easterly flow       before 2016 due to the limited availability of intensive mi-
in the East Sea, which bring sufficient moisture and inter-        crophysical observations.
act with topography. In relation to the Taebaek Mountains,            A field campaign named ICE-POP 2018 (International
the Kor’easterlies can be interpreted as a cross-barrier flow.     Collaborative Experiment for PyeongChang 2018 Olympic
The higher cross-barrier wind speed tends to have a stronger       and Paralympic winter games) took place in the Gangwon
precipitation rate (Veals et al., 2019). The observation-based     region to address this issue (Gehring et al., 2020, 2021; Lim
study of the evolutions of wind flow and precipitation in this     et al., 2020; Jeoung et al., 2020). The ICE-POP 2018, con-
region was carried out by Tsai et al. (2018). They used a          tributed to by 29 agencies from 12 countries, was a World
three-dimensional high-resolution wind field retrieved from        Weather Research Programme (WWRP) of the World Me-
six Doppler radars and found that a small temporary change         teorological Organization (WMO) and was led by the Ko-
in direction or speed of cross-barrier flow can consider-          rea Meteorological Administration (KMA). One of the main
ably affect the distribution and intensity of precipitation. Y.-   scientific goals of the field campaign was to understand the
J. Kim et al. (2019) discussed whether it is possible to deter-    complex winter precipitation with intensive microphysical
mine precipitation over the Gangwon region only by synoptic        observations. For two winter seasons (2016–2017 and 2017–
pressure patterns and found that the synoptic pattern (east-       2018 winters), a dense observational network was operated
ward expansion of Siberian high) itself is not the only fac-       ranging from ground microphysical instruments to remote
tor determining precipitation. They suggested that the wind        sensing. The 2017–2018 winter added 19 additional sites op-
speed of cross-barrier flow and thermal stability, which deter-    erated as supersites. MRR (micro rain radar) and PARSIVEL
mine the Froude number, should be examined together with           (particle size velocity) instruments were located in selected
pressure patterns. Another interesting characteristic in this      locations both along the coastal line and crossing the Tae-
region led by the Kor’easterlies is cold-air damming in the        baek Mountains (parallel to the coastal line). Radiosondes
eastern region of the mountain range (Bailey et al., 2003;         were launched at high temporal resolution at more than eight
Lee and Xue, 2013; Nam et al., 2020). As the Kor’easterlies        sites in the Gangwon region during the field campaign. A
are blocked and weakened by the mountain barrier, the flow         microphysical study in the Gangwon region with this kind of
favors their being turned into northwesterly along the bar-        observational network had not previously been carried out.
rier resulting from the weakened Coriolis force due to the         Such unique comprehensive observations and datasets cre-
disrupted balance between the Coriolis and pressure gradi-         ated during ICE-POP 2018 now enable progress towards a
ent force (Bailey et al., 2003; Lee and Xue, 2013). The air        deeper understanding of the complex winter precipitation in
mass in the eastern region of the barrier then becomes cold,       the region.
stable, and dense as cold air from the north is advected by           The purpose of this paper is to elucidate the microphys-
the northwesterly and accumulated, which is referred to as         ical characteristics of snow in the Gangwon region in both
cold-air damming. This cold-air damming creates a strong           different heights and surface by using MRR and PARSIVEL
convergence zone, resulting in the thermal contrast between        datasets obtained in the two winter seasons during the ICE-
the dammed air and East Sea being intensified and the max-         POP 2018 project. We analyze all the events that were jointly
imum precipitation shifted away from the Taebaek Moun-             observed by both remote and in situ instrumentation. Such
tains (Jung et al., 2012; Lee and Xue, 2013). The updraft can      a combination makes the research unique in terms of the
also be induced by low-level cold-air damming in coastal ar-       datasets and allows us to provide new results about the mi-
eas because its density is relatively higher than that of the      crophysics in the region. The article is organized as follows.
air mass coming from the ocean (Tsai et al., 2018). It is          Section 2 describes how observations were performed during
also worth noting that when the layer with the Kor’easterlies      ICE-POP 2018, the sites and instruments used for analysis,
is generated, we expect that a layer of obvious directional        and how data were processed and analyzed. In Sect. 3, the
wind shear is located between the westerly flow aloft and          three main synoptic conditions which were responsible for
the Kor’easterlies below. It implies that shear-generated tur-     the heavy snowfall during ICE-POP 2018 are presented. In
bulence may be present and contribute to some microphys-           Sect. 4, the general microphysical characteristics of snow and
ical processes. In spite of these precedents, little research      the characteristics for each synoptic pattern are presented.
has been conducted in the area to examine the impact of the        The conclusions of this study (Sect. 5) transcend the cases
synoptic patterns and topography on the microphysical pro-         presented and provide insights into the microphysics of snow.
cesses. One of the main reasons for this was the lack of sys-
tematic microphysical observations in this region (Nam et al.,
2014). It is necessary to explore how the snow microphysical       2     Data and methodology
characteristics differ according to both synoptic patterns and
terrain to fully understand winter precipitation in the Gang-      2.1    Experimental design
won region. In spite of great efforts in previous studies, a
comprehensive and intensive study had not been conducted           The ICE-POP 2018 field campaign employed 19 supersites,
                                                                   which include ground and remote sensing microphysical in-

https://doi.org/10.5194/acp-21-11955-2021                                        Atmos. Chem. Phys., 21, 11955–11978, 2021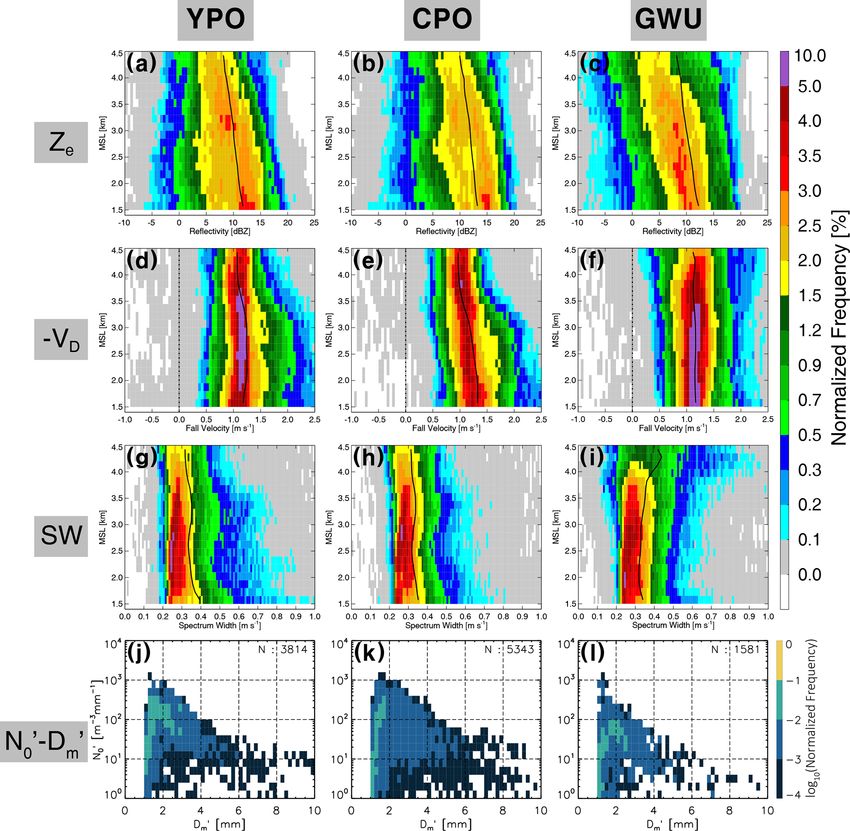
11958 K. Kim et al.: Impact of wind pattern and complex topography on snow microphysics
struments, six fixed 3-hourly radiosounding sites (In et al., The range (vertical) resolution of MRR is adjustable with
2018), four mobile sounding sites including dropsonde from 31 range steps. During the field experiment, an identical ob-
research aircraft (Jung et al., 2020) and radiosounding from servational strategy was assigned to MRRs for each site. The
mobile cars and the research ship Gisang 1 (Choi et al., time resolution was 10 s, and the range resolutions were 200
2020), and two wind profilers in both coastal and moun- and 150 m for 2016–2017 and 2017–2018 winters, respec-
tainous areas (see Fig. 1). The supersites are designed to tively.
be aligned both along the coastal line (from the Sokcho re- Because this instrument was originally developed to ob-
gional weather office, SCW, to the Donghae regional weather serve liquid precipitation, it has been used for rain observa-
office, DHW, site) and across (from the Gangneung–Wonju tion (Löffler-Mang et al., 1999; Yuter and Houze, 2003; Pe-
National University, GWU, to the PyeongChang observatory, ters et al., 2005; Tokay et al., 2009; Adirosi et al., 2016).
PCO, site) the Taebaek Mountains. The PARSIVEL disdrom- However, after Kneifel et al. (2011) and Maahn and Kol-
eters had been deployed at all 19 supersites, as indicated as lias (2012) showed that MRR can be utilized for snow ob-
an open circle in Fig. 1b. The MRRs were collocated with servation, MRR started to be actively used in snow stud-
the PARSIVEL disdrometers at 10 supersites (filled circle). ies (Kristovich et al., 2017; Souverijns et al., 2017; Durán-
We take advantage of the site design to investigate the ver- Alarcón et al., 2019; Vignon et al., 2019). We applied the
tical structure and size distribution of snow according to the post-processing algorithm proposed by Maahn and Kollias
topography (crossing the Taebaek Mountains), which is char- (2012), which is suited to snow (or weak rain) measure-
acterized by steep orography that rises abruptly from the ment. This algorithm improves the sensitivity of MRR by en-
coast to an altitude of 800 m (see Fig. 1b). hancing noise level estimation and de-alias Doppler velocity.
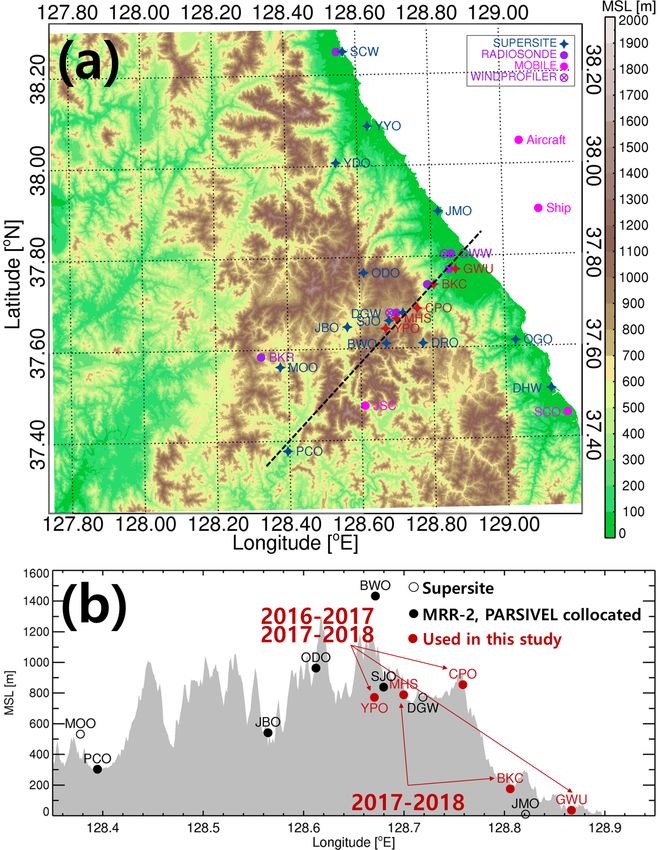
We selected five sites for the study with the criteria (1) Unless this algorithm is applied to the MRR measurement,
being aligned in transect (dashed line in Fig. 1a) from upward-moving particles will appear as very high Doppler
a mountainous area to coastal area so that they capture velocity.
the precipitation evolution and modification with the In addition to MRR, five laser-based optical disdrometers
cross-barrier flow, (2) stable collection of data during the were utilized to see characteristics of size distribution on the
campaign, and (3) having a good environment for the ground. The PARSIVEL, manufactured by OTT Hydromet,
observation (i.e., no taller trees or buildings near the MRR provides the size and fall velocity of each hydrometeor at
antenna and PARSIVEL). Based on the criteria, we selected the ground (Löffler-Mang and Joss, 2000; Tapiador et al.,
YPO (Yongpyong Observatory; 37.6433◦ N, 128.6705◦ E; 2010; Tokay et al., 2014). The measuring area of the instru-
772 m a.m.s.l.), MHS (Mayhills supersite; 37.6652◦ N, ment is 54 cm2 (180 mm×30 mm), and minimum observable
128.6996◦ E; 789 m a.m.s.l.), CPO (Cloud Physics Obser- size and fall velocity are 0.2 mm and 0.2 m s−1 , respectively
vatory; 37.6870◦ N, 128.7188◦ E; 855 m a.m.s.l.), BKC (Tapiador et al., 2010). The PARSIVELs used in the study
(Bokwang-ri community center; 37.7382◦ N, 128.7586◦ E; were collocated with MRRs (Petersen et al., 2018; Petersen
175 m a.m.s.l.), and GWU (37.7717◦ N, 128.8703◦ E; and Tokay, 2019) so that the size distribution of snow was
36 m a.m.s.l.) from west to east. Three sites (YPO, MHS, obtained at each MRR site.
and CPO) are located in mountainous regions (Yeongseo, The PARSIVEL has been widely used in microphysical
PyeongChang county), and the others (BKC and GWU) are studies for solid particles (Yuter et al., 2006; Aikins et al.,
in coastal regions (Yeongdong, Gangneung city). 2016; Pokharel et al., 2017) as well as for rain (Friedrich
During the field campaign, 20 events were observed by et al., 2016; Park et al., 2017). As documented in Friedrich
collocated MRR and PARSIVEL at five sites (Table 1). The et al. (2016), however, PARSIVEL can suffer from splash-
MRR and PARSIVEL measurements of a total of 374 h ing of particles (observed as a small diameter with large fall
(15.6 d) were used to analyze the vertical structure and size velocity when particles fall on the head of the sensor) and
distribution in the Gangwon region. margin fallers (observed as a faster velocity than true fall ve-
locity when particles fall through the edge of the sampling
2.2 Instruments area). Some limitations in measuring snow particles due to
particle shape assumption are well described in Battaglia
This study analyzes measurements from MRR, which is the et al. (2010). To address these issues, we applied a quality
K-band (24.23 GHz) frequency-modulated continuous-wave control procedure that discards particles with a diameter of
(FM-CW) vertically pointing radar. MRRs were deployed at < 1 mm to avoid splashing and border effects (Yuter et al.,
10 sites in total during the field campaign (Petersen et al., 2006; Aikins et al., 2016). Further, particles with a fall veloc-
2018; Gatlin and Wingo, 2019). The MRR can provide ver- ity of above 1.4 times the empirical fall velocity of rain (Atlas
tical profiles of the equivalent reflectivity factor (Ze ), mean et al., 1973) were removed. To eliminate rain data, we clas-
Doppler velocity (VD ), and the Doppler spectral width (SW). sified the major precipitation type every minute based on the
These variables are used to gather detailed information on precipitation type classification mask of Yuter et al. (2006).
the vertical structure of precipitation according to the obser- If the number of raindrops was greater than 40 % of the total
vational sites.
Atmos. Chem. Phys., 21, 11955–11978, 2021 https://doi.org/10.5194/acp-21-11955-2021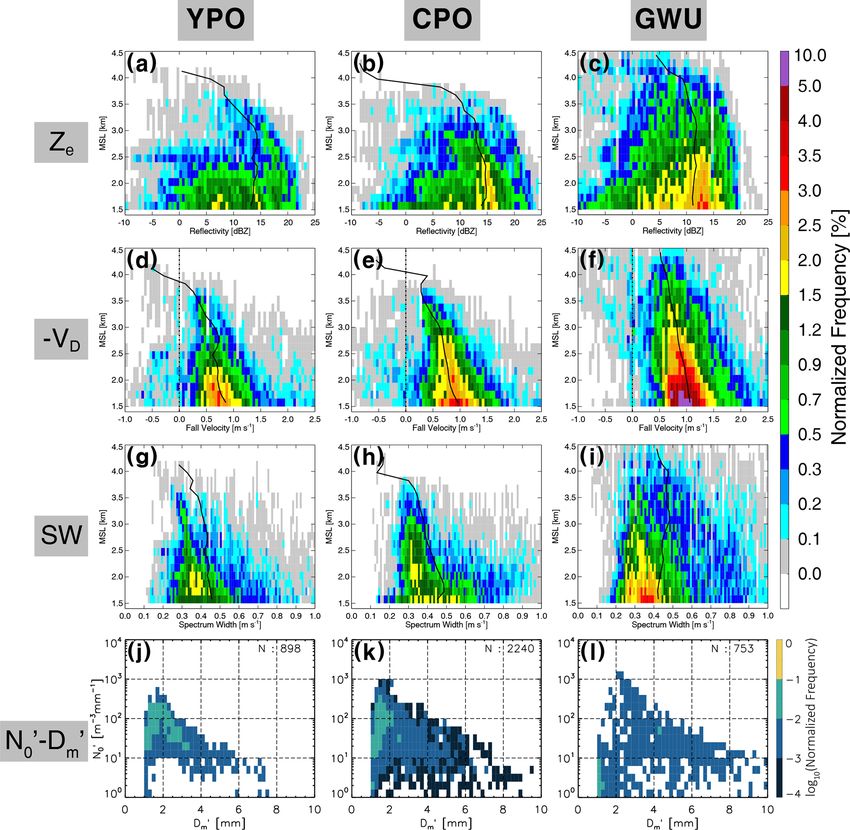
K. Kim et al.: Impact of wind pattern and complex topography on snow microphysics                                                    11959

Figure 1. (a) Locations of supersites and sounding sites of ICE-POP 2018 and (b) the vertical cross-section along the thick dashed line in
(a). Terrain height is filled in gray in (b). The five sites used in this study are colored red. The period of MRR and PARSIVEL measurements
is noted with arrows.

number of particles, we considered the major precipitation              between two winter seasons (200 and 150 m). We can thus
type to be rain and discarded this time interval.                       compare the values of CFADs at each height between sites,
                                                                        which is a similar approach to that of Minder et al. (2015) ex-
2.3   Methodology                                                       cept for the height interpolation. The lowest two range gates
                                                                        are discarded in order to avoid a near-field effect (Maahn
The vertical structure of snow can be characterized by CFAD             and Kollias, 2012; Minder et al., 2015). The CFADs are con-
(contour frequency by altitude diagram) analysis (Yuter and             structed from 1.5 km a.m.s.l. height by considering the site
Houze, 1995), which represents the frequency of each vari-              height (maximum of 855 m) and the near-field effect.
able as a function of height. Here, the frequency distribu-                The microphysical characteristics of snow at the ground
tion is normalized by the number of all times elapsed dur-              level are analyzed by particle size distribution (PSD; N (D))
ing the events listed in Table 1. For the comparison between
the sites, the CFADs are interpolated into a common height
grid of 150 m since the height resolution of MRR is different

https://doi.org/10.5194/acp-21-11955-2021                                               Atmos. Chem. Phys., 21, 11955–11978, 2021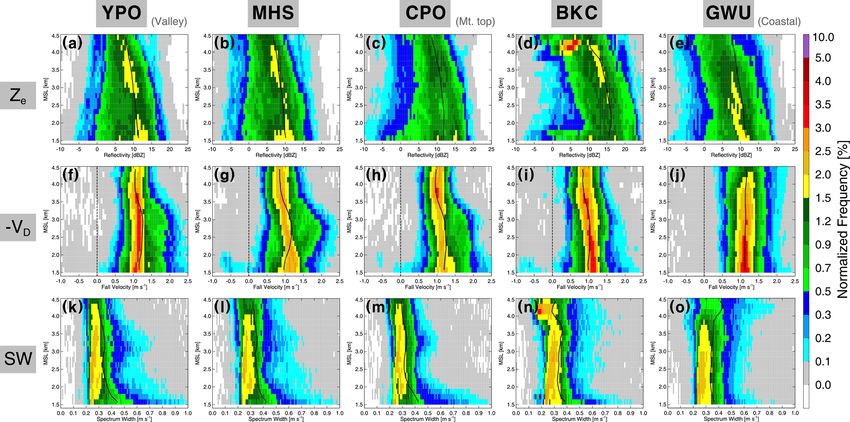
11960                                   K. Kim et al.: Impact of wind pattern and complex topography on snow microphysics

Table 1. Summary of events used in this study. The time is in UTC.

                           No.   Year        Synoptic pattern       Date and time [UTC]
                           1     2016–2017   Air–sea interaction    4 January 2017 20:00–5 January 2017 13:00
                           2                                        30 January 2017 02:00–30 January 2017 10:00
                           3                                        2 March 2017 00:00–2 March 2017 09:00
                           4                                        14 March 2017 00:00–14 March 2017 10:00
                           5                 Warm low               8 January 2017 00:00–8 January 2017 20:00
                           6                                        29 January 2017 03:00–29 January 2017 24:00
                           7                                        21 February 2017 20:00–22 February 2017 15:00
                           8                                        1 March 2017 00:00–1 March 2017 24:00
                           9     2017–2018   Air–sea interaction    15 March 2018 18:00–16 March 2018 09:00
                           10                Cold low               9 December 2017 21:00–10 December 2017 16:00
                           11                                       7 January 2018 20:00–8 January 2018 20:00
                           12                                       22 January 2018 03:00–22 January 2018 22:00
                           13                                       30 January 2018 07:00–30 January 2018 24:00
                           14                                       22 February 2018 03:00–22 February 2018 24:00
                           15                Warm low               23 December 2017 18:00–24 December 2017 16:00
                           16                                       16 January 2018 10:00–17 January 2018 02:00
                           17                                       28 February 2018 00:00–28 February 2018 24:00
                           18                                       4 March 2018 15:00–5 March 2018 09:00
                           19                                       7 March 07 2018 05:00–9 March 2018 04:00
                           20                                       20 March 2018 18:00–21 March 2018 14:00

from PARSIVEL, which is calculated as                                     calculate generalized characteristic parameters every minute
                                                                          after the quality control process.
              X           Ni,j
N(Di ) =                          ,                                (1)       Snowfall rate (SR) is calculated from particle size distri-
                  j
                      Avi,j 1t1Di                                         bution:
                                                                                                P         3
where i and j are the index of the diameter and velocity chan-                    π X ρ(Di ) j Ni,j Di
nel, respectively; Di is the diameter of ith diameter channel;            SR =                               .                      (5)
                                                                                 6ρw i          A1t
Ni,j is the number of observed particles of the j th velocity
bin in ith diameter bin; A is the horizontal measurement area             Here, the assumed density–size relationship was proposed by
(54 cm2 ); vi,j is the fall velocity of the j th velocity bin in ith      Brandes et al. (2007):
diameter bin; 1t is the sampling time interval; and 1Di is
the width of ith diameter channel.                                        ρ(D) = 0.178D −0.92 ,                                      (6)
   Generalized characteristic number concentration (N00 ) and
diameter (Dm  0 ) are calculated with third and fourth moments            where ρ is the density of snow, and ρw is the density of liquid
as follows (Testud et al., 2001; Lee et al., 2004; Bang et al.,           water.
2020):

        M35                                                               3     Classification by synoptic patterns
N00 =         ,                                                    (2)
        M44                                                               The synoptic patterns are classified into three categories in
 0   M4                                                                   our study: “air–sea interaction”, “warm low”, and “cold low”
Dm =    , and                                                      (3)
     M                                                                    (Jeoung et al., 2020). The following sections describe each
     X3
Mn =   N (Di )Din 1Di ,                                            (4)    synoptic pattern in detail and explain how observed events
         i                                                                are classified into three defined synoptic patterns.

where Mn is nth moment of particle size distribution in units             3.1    Air–sea interaction
of m−3 mmn . The N00 and Dm  0 can represent the shape of par-

ticle size distribution. The parameter N00 is proportional to             The “air–sea interaction” pattern is related to the air-mass
the intercept parameter of an exponential PSD, and Dm     0 is            transformation by cold air and relatively warm ocean. This is
the volume-weighted mean diameter (Lee et al., 2004). We                  known to be related to the synoptic condition of the Siberian

Atmos. Chem. Phys., 21, 11955–11978, 2021                                                  https://doi.org/10.5194/acp-21-11955-2021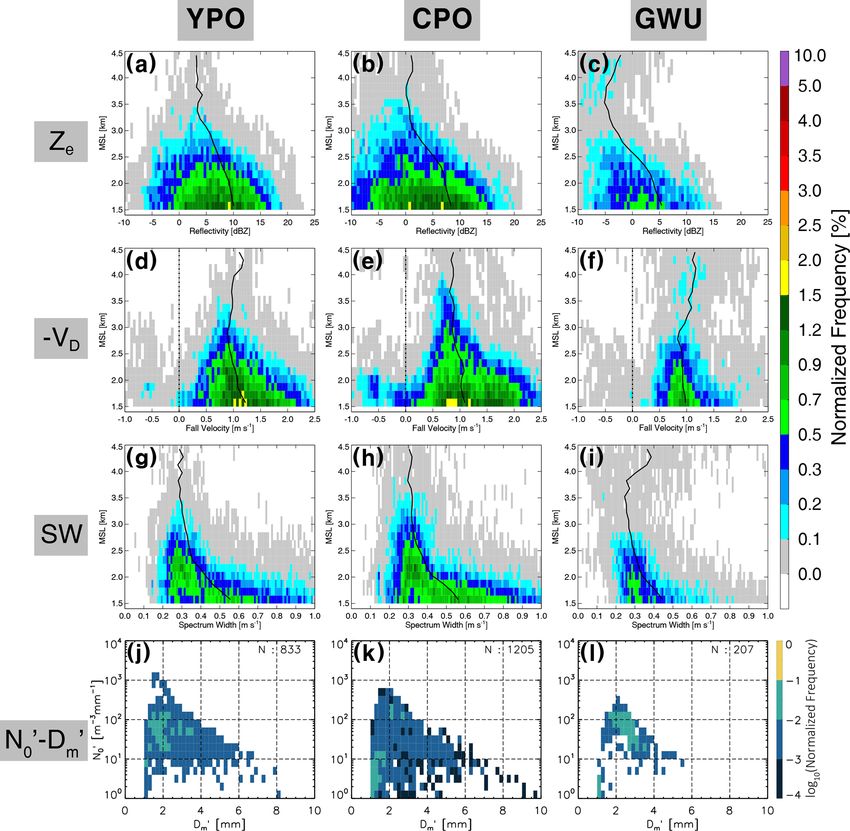
K. Kim et al.: Impact of wind pattern and complex topography on snow microphysics 11961
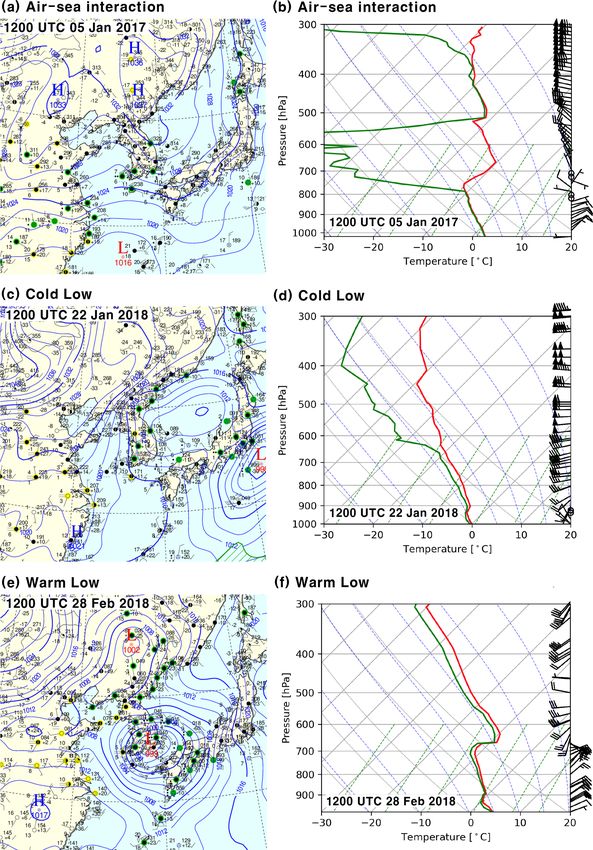
high pressure expanding eastward to the Kaema Plateau One of the examples of weather chart and sounding of
(i.e., Kaema high pressure), located in the northeastern part this pattern is shown in Fig. 2. The radiosonde is launched
of the Korean Peninsula. The snowfall mechanism is air-mass in a coastal area. The northeasterly wind is induced in the
transformation by warm ocean surface and cold-air outbreak. East Sea and eastern coastal region along with the eastward
The precipitation system is initiated and developed by air- expansion of the Siberian high to the East Sea (Fig. 2a).
mass transformation over the East Sea, then propagates to in- A saturated layer is observed from the surface to 790 hPa,
land areas due to Kor’easterlies and is intensified as it is lifted along with the northeasterly or easterly winds. This layer is
by steep topography. The precipitation pattern is known to be responsible for the snowstorm by air–sea interaction. The
linked with the cross-barrier flow (Cheong et al., 2006). The layer is bounded to the altitude where the Kor’easterlies
precipitation intensifies as the cross-barrier flow is strength- exist. A strong thermal-inversion layer is located from the
ened and dissipates as the cross-barrier flow is weakened height slightly higher than the upper boundary of the satu-
when the pressure gradient is reduced, or the wind direction rated layer to 650 hPa with dry and weak wind speed of less
changes. Because the precipitation cannot go further west be- than 5 m s−1 . The easterly winds in the lower level then turn
yond where the Kor’easterlies can reach it, the precipitation to northwesterly and westerly above the inversion layer, with
area is restricted in the eastern area of the Korean Peninsula. a dry layer up to 500 hPa. Note that the saturated layer above
The Gangwon region can frequently have precipitation of this 500 hPa is not a typical situation in this pattern and was not
type. According to Choi and Kim (2010), the occurrence of related to the snowfall in this event.
the snowfall events in Korea associated with expansion of
Siberian high is 43.8 % for 36 years. 3.2 Cold low
Previous studies have emphasized the importance of both
synoptic and regional factors in the snowfall in this region In the “cold low” pattern, the low pressure is located in the
(Nam et al., 2014; J. Kim et al., 2019). It has been shown north of the polar jet stream and crosses the middle of the
that the correlation between the precipitation in this region Korean Peninsula. In this synoptic condition, the precipita-
and sea level pressure over the Kaema Plateau and Bering tion is associated only with a low-pressure system (not with
sea has intensified recently (after 1999) (Cho and Chang, induced airflow) and moves towards the east. The western
2017). Kwon et al. (2015) investigated low-level stratiform area (mostly in the middle area) of the Korean Peninsula as
cloud associated with heavy snowfall and showed that it is well as the eastern area is expected to have precipitation as
mostly related to the expansion of Siberian high pressure the low crosses the Korean Peninsula.
with an air–sea temperature difference of 7–12 ◦ C. Nam et al. The Gangwon region is not always expected to have heavy
(2014) reported a correlation of R = 0.67 between the snow- precipitation in this pattern. The moisture is consumed by
fall amount in coastal areas and temperature difference be- precipitation in the western part of the mountains when the
tween 850 hPa and sea surface temperature (SST) over the low system approaches the Gangwon region. The eastern
East Sea. Kim and Jin (2016) emphasized the importance coast (leeward) usually has less precipitation than the moun-
of SST as a source of the energy for the formation of air– tainous area (windward) in the Gangwon region due to sub-
sea interaction snowfall. Their results suggest that the warm limation of snow by diabatic warming and drier conditions
SST anomalies in the East Sea result in heavy snowfall as the when crossing the mountains.
lower part of the air mass becomes warmer, which increases Precipitation can occur not only when there is a well-
thermal instability and moisture. The role of low-level insta- developed low-pressure system but also in the middle part
bility by cold-air outbreak and warm ocean in heavy snowfall of the Korean Peninsula, even when a weak surface trough
was also highlighted by Lee et al. (2012). The strong surface extends out over the Yellow Sea. In this case, the heated air
heat fluxes produced by the East Sea are also known to be an parcel over the Yellow Sea, which forms warm advection un-
important contributor to heavy snowfall in this region (Lee der 850 hPa, is lifted by a cold pool inland, which is usually
et al., 2018). Air–sea interaction pattern depends greatly on intensified in the early morning. However, this system tends
these factors. to precipitate mostly in the western part of the Korean Penin-
Various terms have been used to refer to this synoptic pat- sula and is not likely to produce heavy snow in the Gangwon
tern. It was referred to as air-mass transformation type (AT) region. This type is considered to be a cold low in this study.
in Cheong et al. (2006). It is also called east coast terrain ef- Since the low-pressure system is responsible for the pre-
fect type (TE) (Cheong et al., 2006) since a snowstorm of this cipitation, the snowfall rate depends on the location and in-
type is likely to interact with the complex topography. On the tensity of the low-pressure system in contrast to air–sea inter-
other hand, Song et al. (2016) called it “cP high expansion” action type. The cold low is the same type as the extratropical
type or “cP high expansion type + trough” type, emphasizing cyclone type (EC; Cheong et al., 2006) in which the precip-
the cold and dry air mass. It is also referred to as stagnation itation is mainly produced by cold and warm fronts of the
type (Ko et al., 2016) as is often related to an atmospheric extratropical cyclone that crosses the middle part of the Ko-
blocking pattern (Rex, 1950). rean Peninsula. This pattern is called the low crossing type
in the synoptic classification by Ko et al. (2016). Song et al.
https://doi.org/10.5194/acp-21-11955-2021 Atmos. Chem. Phys., 21, 11955–11978, 2021
11962                                 K. Kim et al.: Impact of wind pattern and complex topography on snow microphysics

Figure 2. (a, c, e) Surface weather chart from the KMA for (a) air–sea interaction, (c) cold-low, and (e) warm-low types. (b, d, f) The
radiosonde data plotted on a skew T -log p chart in a coastal area (Gangwon regional weather administration, GWW, near GWU) for (b) air–
sea interaction, (d) cold-low, and (f) warm-low types. The skew T -log p chart was created using the MetPy package (May et al., 2008–2021)
in Python. The red (green) solid line represents the temperature (dew point temperature).

Atmos. Chem. Phys., 21, 11955–11978, 2021                                                https://doi.org/10.5194/acp-21-11955-2021
K. Kim et al.: Impact of wind pattern and complex topography on snow microphysics                                          11963

(2016) interprets this pattern as a low passing type, but it is   interpreted this vertical structure as a two-layer cloud and re-
close to a low crossing type based on their description of this   ported that the altitudes of both inversion and shear layers are
type where a low-pressure system crosses the middle part of       at 3 km a.m.s.l. In contrast to the air–sea interaction pattern
the Korean Peninsula.                                             that is dry in the upper inversion layer, this pattern is mostly
   Figure 2c shows an example of the surface chart of a cold-     saturated, even in the upper layer.
low pattern. The low-pressure system was originated from             In the later stage, when the low moves to the southeast of
Shandong Peninsula and propagated to the East Sea, lead-          the peninsula, Kor’easterly-associated precipitation remains
ing to precipitation in the middle of the Korean Peninsula.       as the low pressure in the south can still induce an easterly
It can be seen from the vertical wind profile in Fig. 2d that     flow in the East Sea. The Kor’easterlies tend to change from
the westerly is dominant except for near the surface. Wind        southeasterly to northeasterly because of eastward movement
speed at higher levels than 800 hPa is stronger than 15 m s−1 .   of low pressure (Tsai et al., 2018). The depth of precipitation
Saturated air is found up to 650 hPa, which is relatively         is shallow, and precipitation features are similar to those of
higher than that of an example of air–sea interaction pattern     air–sea interaction type.
(Fig. 2b).                                                           The warm-low type is thought to be a favorable con-
                                                                  dition for heavy snowfall. The north–south-oriented high-
3.3   Warm low                                                    to-low pressure pattern is generally known to promote
                                                                  Kor’easterlies and heavy snowfall (Bae and Min, 2016; Lee
The “warm low” type indicates the synoptic situation where        et al., 2018), which is the case when Kaema high pressure is
the low is located south of the polar jet stream and leads to     supported. When atmospheric blocking (Rex, 1950) restrains
precipitation over the Korean Peninsula. The low is usually       this system from propagating to the east, extreme snowfall
formed over east-central China and moves through the south        events (snow depth of 192.6 cm within 9 d) in the Gangwon
and southeast of the Korean Peninsula (see Fig. 2e). This syn-    region could occur (Bae and Min, 2016). All the synoptic
optic type is the most complicated and has several interesting    patterns of three extreme heavy snow events over 12 years
features that can only be found in the Gangwon region.            (2001–2012) analyzed by Kwon et al. (2014) were similar
   Tsai et al. (2018) showed that the system can be sep-          to the warm-low type. Nam et al. (2014) analyzed snowfall
arated into two stages with different precipitation mecha-        amount and frequency for 100 years (1912–2012) and found
nisms during the passage of a low-pressure system through         that the Gangwon region has more frequent and more intense
the southern Korean Peninsula. As the low-pressure system         precipitation in late winter (i.e., February and March). This
approaches the Korean Peninsula (early stage), precipitation      is consistent with the period when the polar jet moves north
that is directly related to low pressure affects the southern     as the cold continental air mass is weakening, leading to a
and central parts of the Korean Peninsula. A large amount of      greater possibility of a warm low rather than a cold low.
moisture from the warm ocean along the southwesterly flow            The possible causes for the heavy snowfall could be as fol-
is continuously supplied to the system, resulting in a verti-     lows. (1) The substantial heat and moisture from the ocean
cally developed deep precipitation system. Tsai et al. (2018)     both south and east of the Korean Peninsula can contribute
demonstrated that the precipitation is associated with a warm     to the precipitation system; (2) precipitation enhancement by
front and warm advection, which means the intensities of          a seeder–feeder mechanism (Bergeron, 1965; Rutledge and
low pressure and snowfall rate are correlated. Additionally,      Hobbs, 1983; Minder et al., 2015) is led by the microphysi-
the Kor’easterlies are induced on the eastern coast of Korean     cal interaction between falling seeding precipitation particles
Peninsula by the low in the south, leading to air-mass trans-     aloft generated by the low-pressure system and the feeder
formation in the East Sea. The Kor’easterlies and resulting       orographic cloud below (note that the feeder cloud in this re-
air-mass transformation can be more intense if the Kaema          gion is originally produced in the East Sea and is expected
high-pressure system is present, being the synoptic condition     to be further developed by steep orography); (3) thermody-
of the air–sea interaction.                                       namic instability at a low level over the East Sea causes the
   Thus, the system in the early stage is divided into two        snow by air-mass transformation, resulting from cold and dry
layers vertically. The precipitation (embedded in the low-        air brought by a cold-air outbreak over the warm ocean (Lee
pressure system) above the shear layer develops up to a           et al., 2012; Lee and Xue, 2013; Nam et al., 2014); (4) up-
high altitude of almost 10 km along with the westerly, and        draft occurs in the steep orographic ascent region (or coastal
there is precipitation generated by Kor’easterlies below the      area due to orographic blocking or damming) by an oro-
shear layer (see Fig. 2f). In the layer where the westerly        graphic effect in unblocked condition, leading to production
and Kor’easterlies meet, named the transition zone, there is      of supercooled liquid water and growth by riming (Medina
a thermal-inversion layer (see 670 hPa in Fig. 2f). The ther-     and Houze Jr., 2003; Rotunno and Houze, 2007); and (5)
mal inversion in the shear layer can also be found in Tsai        both aggregation and riming processes are facilitated by a
et al. (2018) (see dash-dotted line and wind barbs in their       turbulent cell in a directional shear layer (Houze and Med-
Fig. 7) and Kim et al. (2018) (see their Fig. 6a) when the        ina, 2005).
synoptic condition is similar to this stage. Kim et al. (2018)

https://doi.org/10.5194/acp-21-11955-2021                                       Atmos. Chem. Phys., 21, 11955–11978, 2021
11964 K. Kim et al.: Impact of wind pattern and complex topography on snow microphysics
The distribution of accumulated precipitation is concen-
trated both in the southern region (directly influenced by pre-
cipitation embedded in the low-pressure system) and on the
east coast (indirectly produced by Kor’easterlies induced by
the low-pressure system) since this type has two stages and
two layers. Thus, the precipitation area is sometimes used to
determine this kind of synoptic pattern. Ko et al. (2016) re-
ferred to this type as low passing, and they determined it by
searching for precipitation events only in the southern Ko-
rean Peninsula and eastern coastal area. Here the term “low
passing” may imply that the low passes through the southern
part of the Korean Peninsula.
There have been several terminologies of this synoptic
condition in previous studies. Song et al. (2016) called it
the south trough type in their synoptic classification. Cheong
et al. (2006) refer to the extratropical cyclone type in the
south of the Korean Peninsula (ECS). They mentioned that
the snowstorm is indirectly affected by extratropical cyclones
and is supported by abundant moisture and orographic ef-
fect. They also reported that the relative importance of fac-
tors controlling the precipitation development could vary de-
pending on the location of low pressure. In addition, when
the expansion of Siberian high pressure and the low pressure
passing through the southern sea occurs simultaneously, they
used the term combined type (COM). Arguably, there will be
more different terms depending on the perspective of look-
ing at the pattern in the same synoptic condition, but most of
these are consistent with the synoptic condition and precipi-
tation features of our classification.
Figure 2e shows well-developed low pressure located in
the southern part of the Korean Peninsula with a minimum
mean sea level pressure of 993 hPa. Precipitation in the
Gangwon region is in the early stage of a warm-low pattern
at this time. The easterly and northeasterly are shown on the
eastern coast and in the East Sea since they are located north
of low pressure. A strong directional wind shear and collo-
cated thermal inversion are identified in the skew T -log p
chart (Fig. 2f). An obvious veering of wind just below and
above the transition zone is found, indicating the warm ad-
vection. It is also revealed that the air is nearly saturated from
the ground to the altitude over 300 hPa, indicating a verti-
cally deep precipitation system. It is expected that tempera-
ture, moisture, and wind profile will change to be similar to
the air–sea interaction type (Fig. 2b) in the later stage when
the low-pressure system is located in the East Sea.
As discussed above, a seeder–feeder process is expected
due to “seeding” precipitation from the frontal precipitation
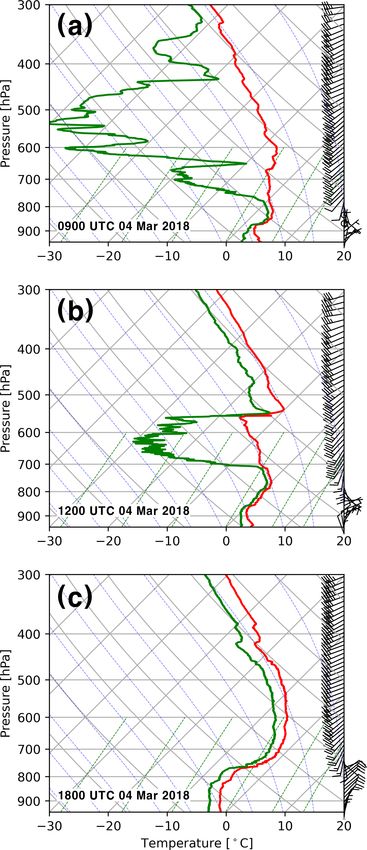
Figure 3. Skew T -log p diagrams for (a) 09:00 UTC, (b)
system and air–sea effect (and orographic) “feeder” cloud.
12:00 UTC, and (c) 18:00 UTC of a warm-low event (4 March 2018)
A dual-layered cloud structure, which is necessary for the at the Daegwallyeong weather office (DGW; mountainous area).
seeder–feeder process, can be confirmed by looking at an The skew T -log p chart was created using the MetPy package (May
example of typical vertical structure of a warm-low event et al., 2008–2021) in Python. The red (green) solid line represents
from upper-air sounding (Fig. 3). A distinct lower cloud pre- the temperature (dew point temperature).
existed below 800 hPa with the Kor’easterlies at 09:00 UTC
(Fig. 3a), and an upper layer (associated with westerly) be-
came saturated from high altitude (300 hPa at 09:00 UTC)
Atmos. Chem. Phys., 21, 11955–11978, 2021 https://doi.org/10.5194/acp-21-11955-2021K. Kim et al.: Impact of wind pattern and complex topography on snow microphysics 11965
to the middle layer (540 hPa at 12:00 UTC) (Fig. 3a and b). and TE), cold-low (EC), and warm-low (ECS and COM)
Then all the altitudes were covered by the clouds with an ap- types, respectively. The frequency ratio between the cold-
parent thermal-inversion layer collocated with the transition low and warm-low type is similar to the dataset of Cheong
zone between the easterly below and westerly aloft (Fig. 3c). et al. (2006) (the warm-low type is almost double the cold
These three plots indicate that the upper cloud and lower low). However, air–sea interaction pattern in our studied
cloud were separated initially, then combined later as the events is relatively less frequent. The air–sea interaction type
low-pressure center moved closer to the south of the stud- is mostly found in 2016–2017, while the cold-low type oc-
ied area. Note that this kind of vertical structure was evident curred only in 2017–2018. Note that the warm-low events in
in warm-low events. 2017–2018 are mostly related to the heavy snowfall events
during the ICE-POP 2018.
3.4 Classification of observed events
We have determined a synoptic pattern for each event based 4 Results
on our knowledge of each pattern. Basically, the weather
map, composite radar image, and ground-accumulated pre- 4.1 General snow characteristics during ICE-POP
cipitation distribution provided by the KMA were utilized. 2018
Precipitation distribution is obtained from a heated tipping
rain gauge at automatic weather stations (AWSs) of the In this section, the characteristics of vertical structure and
KMA. If Siberian high pressure expands to the east, and pre- snow size distribution from the ICE-POP 2018 period
cipitation is concentrated on the east coast, it was determined (i.e., 2017–2018 winter, 12 events) are analyzed according to
as an air–sea interaction pattern. If precipitation is concen- the topography to explore general characteristics of snow in
trated in the west-central region of the Korean Peninsula, the Gangwon region. During ICE-POP 2018, five sites (YPO,
and the location of precipitation on the radar image is di- MHS, CPO, BKC, and GWU from the west to the east) were
rectly related to the location of low pressure, it is classified equipped with PARSIVEL and MRR. To examine the verti-
as a cold-low type. When the surface trough of low pressure cal structure of precipitation, CFADs of reflectivity, Doppler
extends to the Yellow Sea, snowfall due to warm advection velocity, and spectral width are plotted for the five selected
in 850 or 925 hPa was also classified as a cold-low type. It sites (Fig. 4).
was determined as a warm-low pattern when low pressure The reflectivity is generally increased with decreasing
passed through the south of the Korean Peninsula, and pre- heights at all sites, resulting from the growth of snow parti-
cipitation was concentrated on the south and east coasts of cles. However, the increase can be characterized by different
the Korean Peninsula, and precipitation developed in the East slopes of roughly 2.0 (0.5) dBZ km−1 above (below) 3.0 km
Sea due to the indirect effect of low pressure as well as the height, particularly at the CPO, BKC, and GWU sites. The
Kor’easterlies. steady growth below 3 km heights is shown at the mountain
It is necessary to confirm our classification using other sites, YPO and MHS. This may imply that some different
available observation data. Radiosondes launched at GWW microphysical processes occur based on the altitude of 3 km
(Gangwon regional weather administration, 37.8046◦ N, when comparing between coastal and mountainous regions.
128.8554◦ E; 79 m a.m.s.l.) near GWU on the east coast A distinctly different characteristic can also be seen in the
were utilized to check the vertical wind profile and depth CFAD of Doppler velocity. The values of frequency peak of
of the precipitation system. We also checked soundings in Doppler velocity are 1–1.5 m s−1 at all sites, with a slight in-
the mountainous region if necessary. Surface wind from crease as height decreases, consistent with typical terminal
AWSs at GWW and DGW (Daegwallyeong weather of- velocity of snow particles. However, an increase in Doppler
fice; 37.6773◦ N, 128.7188◦ E; 773 m a.m.s.l.) near MHS in velocity at 3.0–3.5 km clearly appears at mountainous (YPO,
the mountainous region was also utilized to check the pre- MHS, and CPO) sites and weakly at the BKC site. These in-
vailing wind. In addition, we also checked wind profiles creased Doppler velocities maintain their speed as height de-
from ultra-high-frequency (UHF) wind profilers at GWW creases. Since the Doppler velocity of the vertically pointing
and DGW. Satellite images of infrared and visible channels radar is the combination of reflectivity-weighted terminal ve-
from the Communication, Ocean, and Meteorological Satel- locity of particles and vertical wind, increases in Doppler ve-
lite (COMS) were also utilized in order to check the location locity could be explained by faster-falling particles or down-
of clouds. draft. We hypothesize that the increased Doppler velocity is
We chose 20 events when both MRR and PARSIVEL ob- mostly contributed to by faster-falling particles. This is be-
served well for all sites (see Table 1). We identified 5 air– cause it is unlikely that there was a sustained downdraft or
sea interactions as well as 5 cold-low and 10 warm-low updraft for most of the precipitation events in such a huge
patterns among the events. Cheong et al. (2006) reported volume with a height of almost 2 km (1.5–3.5 km altitude).
that the frequency of each synoptic pattern within 21 years It is also found that spectral width is noticeably in-
(1981–2001) is 65, 14, and 30 for the air–sea interaction (AT creased at the level where the Doppler velocity is increasing
https://doi.org/10.5194/acp-21-11955-2021 Atmos. Chem. Phys., 21, 11955–11978, 202111966 K. Kim et al.: Impact of wind pattern and complex topography on snow microphysics
Figure 4. CFADs of radar reflectivity (dBZ; a–e), negative of Doppler radial velocity (m s−1 ; f–j), and spectral width (m s−1 ; k–o) from
MRR for 2017–2018 winter at (a, f, k) YPO at the valley, (b, g, l) MHS, (c, h, m) CPO at the mountain top, (d, i, n) BKC, and (e, j, o) GWU
sites at the coastal region. The solid line indicates the average value for each diagram. Dash-dotted lines represent 0.0 m s−1 in Doppler
velocity. The mean liquid-equivalent precipitation rate from the Ze –SR relationship at 24.23 GHz (Souverijns et al., 2017) at 1.5 km height
is 0.79, 0.61, 0.86, 1.91, and 0.84 mm h−1 for YPO, MHS, CPO, BKC, and GWU, respectively.
(i.e., 3.0–3.5 km) at mountainous sites. The enhanced spec- at YPO. This is consistent with relatively higher normalized
tral width can be contributed to by either turbulence or di- frequency of reflectivity in moderate intensity (0–15 dBZ) at
versity of fall speed of particles due to coexistence of non- YPO, although the reflectivity pattern is similar, with a mean
rimed and rimed particles. The most likely causes for en- value of approximately 12 dBZ at 1.5 km height for two sites.
hanced spectral width at 3.0–3.5 km is the turbulence rather To support the fact that YPO has heavier snow due to
than the diversity of fall speed. If this is caused by diversity broader particle size distribution, the difference in normal-
of fall speed, we should still see a similarly high value at the ized frequency of N00 –Dm 0 between the two sites is shown in
altitude below the layer, but we can see the spectral width Fig. 6. The difference in normalized frequency of N00 –Dm 0 is
is decreased as the height decreases. Note that the enhanced consistent with that found in Fig. 4. Higher number concen-
spectral width is stronger at mountainous sites and further tration is more frequent for a given diameter, and a larger
intensified at western sites. The higher spectral width at 1.5– diameter for a given number concentration is found at the
2.0 km height is also shown at mountainous sites, indicating YPO site, resulting in broader snow size distribution. This
the turbulence at this level because only the diversity of fall implies that a higher snowfall rate is frequent at YPO, with
speed may not be attributable to such a high spectral width larger snowflakes due to more active aggregation as well as
such as 1.0 m s−1 . At the coastal sites (BKC and GWU), de- stronger riming.
positional growth or aggregation process is dominant, and
the degree of turbulence is lower because neither significant 4.2 Snow characteristics in air–sea interaction pattern
increased Doppler velocity nor spectral width is found.
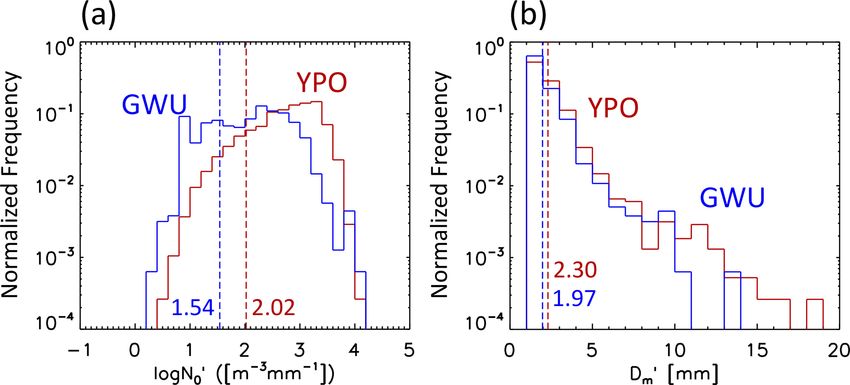
Size distribution of snow on the ground is represented We divide the 20 observed events into 3 synoptic patterns,
in N00 and Dm 0 (Fig. 5). Normalized frequency of N 0 and
0
as described in Sect. 3. In this section, the snow characteris-
Dm 0 for the YPO and GWU sites shows that the mountain- tics during the air–sea interaction pattern are explored. Com-
ous site (YPO) has a greater number concentration (mean pared with the previous section, MHS and BKC sites are ex-
value of 97.72 m−3 mm−1 ) and a larger diameter (mean value cluded because they were deployed during the 2017–2018
of 2.38 mm) compared with the coastal site (GWU), which winter season only.
has a mean number concentration of 38.02 m−3 mm−1 and a The echo top height is higher in the coastal region (GWU)
mean diameter of 2.04 mm, leading to higher snowfall rate compared with the mountainous region (YPO and CPO), in-
dicating that the vertical depth of precipitation is decreased
Atmos. Chem. Phys., 21, 11955–11978, 2021 https://doi.org/10.5194/acp-21-11955-2021K. Kim et al.: Impact of wind pattern and complex topography on snow microphysics 11967
Figure 5. Normalized frequency of (a) log N00 and (b) Dm
0 for YPO (in red) and GWU (in blue) sites. Dashed lines denote the mean value of
each site.
the updraft is present, there is a secondary peak of reflectivity
(at lower reflectivity less than 12 dBZ) and enhanced spectral
width at mountainous sites up to a height of 3 km. This may
suggest that new ice crystals are generated at a low level due
to adiabatic cooling resulting from the updraft in mountain-
ous regions. Increased spectral width may be contributed to
by turbulence due to interaction between airflow and com-
plex topography.
Although reflectivity is higher at CPO compared with
GWU, the particles on the ground show higher frequency
of big snowflakes at GWU, not CPO. The lower frequency
of small snowflakes and higher frequency of big snowflakes
at GWU indicate that the aggregation process is active in
the coastal area. The aggregation signature can also be
found in the histograms of characteristic diameter shown in
Figure 6. Difference in normalized frequency of N00 –Dm
0 between
Fig. 8. The mean values of characteristic diameter increase
YPO and GWU sites. A warm (cold) color indicates that YPO from west (YPO, 2.28 mm) to east (GWU, 3.88 mm). The
(GWU) has more frequency.
snowflakes with a diameter larger than 12 mm are shown only
at GWU, and a broader distribution is found at GWU, which
indicates that strong aggregation is favorable in coastal re-
when the system crosses the mountains (Fig. 7). The re-
gions. This result agrees with the findings of Bang et al.
flectivity is rapidly increased until 3.0 km with increasing
(2019), who conducted a similar analysis using two air–
Doppler velocity as height decreases at all sites, suggest-
sea interaction events and showed that the GWU site has a
ing depositional growth. Below 2.5–3.0 km, primary peaks
greater number concentration and a larger diameter than the
of reflectivity (larger reflectivity) show nearly constant val-
YPO site.
ues with a steady increase in Doppler velocity. This implies
that the riming is the main snow growth process in this layer
regardless of site location. When riming occurs, Doppler ve- 4.3 Snow characteristics in cold-low pattern
locity is increased because the mass of snow increases due to
collection of supercooled liquid water, while the size of the In the cold-low pattern, the moisture is likely consumed in
snow does not greatly enlarge (Heymsfield, 1982), resulting the western part of the Korean Peninsula, resulting in less
in a nearly constant or smaller increase in reflectivity. strong precipitation in the eastern part. As expected, the re-
The Doppler velocities less than 0 m s−1 below 3 km are flectivity generally showed a low mean value of less than
revealed at YPO and CPO, indicating that updraft exists at 10 dBZ, and the lowest mean value of 5 dBZ is shown at
mountainous sites. These updrafts may be induced by uplift GWU at the bottom layer (Fig. 9). This can also be sup-
of airflow by topography. Updraft is also found at the GWU ported by the smaller values of both N00 and Dm0 at the GWU
site with less frequency at higher levels. In the layer where site, suggesting strong evidence of depletion or sublimation
https://doi.org/10.5194/acp-21-11955-2021 Atmos. Chem. Phys., 21, 11955–11978, 2021You can also read