Fuller Working Lives Evidence Base 2017 - February 2017
←
→
Page content transcription
If your browser does not render page correctly, please read the page content below
Fuller Working Lives
Evidence Base 2017

                     February 2017
Fuller Working Lives Evidence Base – 2017

DWP ad hoc research report no. 46

A report of research carried out by the Department for Work and Pensions.

© Crown copyright 2017.
You may re-use this information (not including logos) free of charge in any format or
medium, under the terms of the Open Government Licence. To view this licence, visit
http://www.nationalarchives.gov.uk/doc/open-government-licence/or write to the
Information Policy Team, The National Archives, Kew, London TW9 4DU,or email:
psi@nationalarchives.gsi.gov.uk.
This document/publication is also available on our website at:
https://www.gov.uk/government/collections/research-reports
If you would like to know more about DWP research, please email:
Socialresearch@dwp.gsi.gov.uk
First published 2017.
ISBN 978-1-78425-903-7

Views expressed in this report are not necessarily those of the Department for Work and
Pensions or any other Government Department.

                                                                                        1
Fuller Working Lives Evidence Base – 2017
Contents
List of Charts and Tables ........................................................................................... 4
1. Executive Summary ............................................................................................ 6
2. Introduction ....................................................................................................... 10
2.1 Data Sources .............................................................................................. 10
2.2 The Age Focus of Fuller Working Lives ...................................................... 11
2.3 Fuller Working Lives Ambition and Monitoring ............................................ 11
3. The Demographic Challenge ............................................................................ 13
4. The Labour Market for Older Workers - UK ...................................................... 17
4.1 Economic Inactivity and Unemployment ..................................................... 21
4.2 Ways of Working ......................................................................................... 23
4.3 Transitions in Work ..................................................................................... 24
4.4 Key Sectors for Employment of Older Workers ........................................... 25
4.5 The Future of Work and Skills ..................................................................... 26
5. The Key Factors and Potential Barriers to Fuller Working Lives ....................... 28
5.1 Drivers of ‘Voluntary’ Labour Market Exit .................................................... 29
5.1.1 Retirement and Individual Attitudes ...................................................... 29
5.2 Drivers of ‘Involuntary’ Labour Market Exit .................................................. 30
5.2.1 Health ................................................................................................... 30
5.2.2 Informal Care ........................................................................................ 33
5.2.3 Skills and Older Workers ...................................................................... 35
5.2.4 Redundancy ......................................................................................... 38
6. Impact of Fuller Working Lives on Individuals ................................................... 39
6.1 Impact on Later Life Income ........................................................................ 39
6.2 Impact on Health and Wellbeing ................................................................. 40
7. Impact of Fuller Working Lives on Employers ................................................... 42
8. Impact of Fuller Working Lives on the Economy ............................................... 44
8.1 Impact on GDP............................................................................................ 45
8.2 Welfare Costs.............................................................................................. 46
9. Concluding Remarks and Areas for Future Research ....................................... 48
Appendix 1 – Definitions........................................................................................... 49
Appendix 2 – Economic activity by single year of age 20 – 70 years old ................. 53
Appendix 3 – Reason for leaving last job, by current economic labour market status
................................................................................................................................. 55
2Fuller Working Lives Evidence Base – 2017
Appendix 4 – Reasons for leaving the labour market by last industry worked .......... 56
Appendix 5 – Data Sources...................................................................................... 58
Appendix 6 – I-Pen model detail .............................................................................. 61
Contact ..................................................................................................................... 64
References ............................................................................................................... 65
3Fuller Working Lives Evidence Base – 2017
List of Charts and Tables
Charts
Chart 3.1: Projected change in UK population – 2017 to 2022
Chart 3.2: Average age of exit from the labour market and cohort life expectancy at
65 years
Chart 3.3: OECD average effective retirement age and normal retirement age, 2009-
2014
Chart 4.1: Economic labour market status of individuals aged 50-State Pension age,
July 2015 – June 2016
Chart 4.2: Economic labour market status of individuals aged 50 – 64, 1996 to 2016
Chart 4.3: Employment rates for men and women, 1996 to 2016
Chart 4.4: Economic activity by single year of age (July 2015-June 2016)
Chart 4.5: Economic activity by single year of age (July 2005-June 2006)
Chart 4.6: Reasons for not looking for work, individuals aged 50-64, who are inactive
but are willing to or would like to work
Chart 4.7: International comparison of employment rates for 55-64 year olds, 2005
and 2015 (OECD)
Chart 4.8: Proportion people employed that are self-employed and/or work part time,
2006 and 2016
Chart 4.9: Employment by sector for individuals aged 50-64 years, by gender
Chart 4.10: Employment by sector, all age
Chart 5.1: Reason for leaving last job, individuals aged 50-64 who are not in work
Chart 5.2: Proportion of population with long term health conditions, by age and
number of conditions
Chart 5.3: Proportion of the adult population with informal caring responsibilities, by
age and gender
Chart 5.4: Employment rate of people aged 50-64, by gender and time spent caring
(per week)
Chart 5.5: Percentage of the population with a given qualification level, by age
Chart 5.6: Percentage of individuals employed that had completed job related
training in the last four weeks
Chart 5.7: Proportion of individuals in employment that had participated in a training
course in the last four weeks, by age and duration of training
4Fuller Working Lives Evidence Base – 2017
Chart 5.8: Annual UK Learning expenditure per head, by age group, 2009
Chart 8.1: OECD employment rates of younger and older workers
Chart 8.2: Median gross household expenditure (per week), 2001/02 to 2014/15.
Chart A2.1: Economic activity by single year of age 20 – 70 years old, males, July
2015 – June 2016
Chart A2.2: Economic activity by single year of age 20 – 70 years old, females, July
2015 – June 2016
Chart A3.1: Reason for leaving last job broken down by current economic labour
market status, individuals aged 50-64 years
Figures
Figure 4.1: Trends shaping future UK jobs and skills
Tables
Table 5.1: Main long term health condition by age group, total adult population (%)
Table 5.2: Employment rate of working age adults, by health status and age group
(%)
Table 8.1: Benefit expenditure and caseload for 50 – 64 year olds, May 2016 (GB)
Table A4.1: Reasons for leaving the Labour Market by last industry worked, men
Table A4.2: Reasons for leaving the Labour Market by last industry worked, women
Table A6.1: Labour market histories for ELSA sample
5Fuller Working Lives Evidence Base – 2017
1. Executive Summary
This document sets out the evidence base that underpins the UK Government Fuller
Working Lives (FWL) strategy titled Fuller Working Lives: A Partnership Approach.
New analysis and evidence is presented here in relation to how individuals,
employers and the economy can benefit from FWL.
All evidence and analysis relates to people in the UK aged 50 years and over, unless
otherwise specified.
The stated ambition for FWL is: To support individuals aged 50 years and over to
remain in and return to the labour market and tackle the barriers to doing so.
The Challenge – Demographics and Labour Market Early Exit
The UK, along with other developed countries, is currently in a period of
demographic change. The number of individuals aged 50 years and over as a
proportion of the adult population is projected to increase from 42 per cent in 2010 to
50 per cent by the mid-2030s.
The average age of leaving the labour market has increased over the past two
decades, but it is still lower than it was in 1950 and is not keeping pace with
increases in life expectancy. Given the ageing workforce and scale of early exit
from the labour market, the future UK economy is likely to face significant challenges
in areas such as the financing of State Pension provision and maintaining the supply
of labour.
As people approach State Pension age (SPa), the rate of employment declines
and economic inactivity rates rise as people leave the labour market ‘early’.
Employment as a proportion of the working age population falls from around 80 per
cent for men and 75 per cent for women in the mid-50s age groups, to around 35 per
cent for men and 25 per cent for women in their mid-60s.
Over half of men and women are not in work in the year before reaching SPa.
Moreover, one in four men and one in three women reaching SPa have not
worked for five years or more.
The Labour Market for Older Workers
Individuals can be classified into three distinct economic activity groups: those in
employment; those who are economically inactive and those who are
unemployed, with individuals flowing between these groups.
The UK employment rate of individuals aged 50 years and over has been
increasing over the past two decades, yet has only recently returned to the
rate last seen in the 1970s. This increase in employment rates has largely been
driven by a higher proportion of women moving into work over this period. There has
also been a change in ways of working across the whole UK labour market, with
increases in self-employment and flexible working, both of which are relevant to
older workers.
6Fuller Working Lives Evidence Base – 2017
Currently, there are almost one million individuals aged 50-64 years old that
are not in employment but state that they are willing to, or would like to, work.
It is not possible to predict the future of the labour market, particularly in the current
economic climate. However, it is likely that the UK workforce in 2030 will be more
multi-generational, older and female. It is also predicted that technology will be
universal, jobs more fluid and the global labour market highly competitive. It is
increasingly important that workers of all ages have up to date, relevant and
transferable skills.
The Key Factors and Potential Barriers to Working Later in Life
A significant proportion of people aged 50 years and over ‘voluntarily’ leave
the labour market, because they want to, and/or they have planned a financially
stable retirement. However, as life expectancy increases, some individuals may not,
in reality, have enough income to maintain the standard of living they would like.
Such individuals often have skills and experience that employers demand and could
benefit the economy should they remain in the labour market.
It is estimated that 1.1 million people aged 50-64 who left their job in the past eight
years may have done so for ‘involuntary reasons’, typically due to ill-health, caring
responsibilities or redundancy. Some individuals could be supported to overcome
these barriers and remain in, or return to, some form of work.
Poor health is known as a significant factor given by individuals aged 50-64 who
leave the labour market early. Evidence suggests that good, appropriate paid work
can be beneficial for individuals’ health and wellbeing. Maintaining good health
throughout the life course is key to people being able to and wanting to stay in work.
An ageing population and workforce mean that a greater proportion of the working
age population are likely to provide informal care in future years. The likelihood of
being a carer increases significantly with age. Currently, three in five carers are
over the age of 50, with 50-54 being the peak age of caring, particularly for
women. In addition, evidence suggests that caring for 10 plus hours a week can
have a substantial negative effect on employment and therefore pension
contributions.
A lack of skills can also be a barrier to working longer. Continued adult learning is
set to be increasingly important as people have longer working lives. Lifelong
learning can also have indirect benefits by improving social capital and integration,
health behaviours, and skills, as well as employment outcomes.
Attitudes to retirement are beginning to change. Recent analysis of the British
Social Attitudes Survey showed that nearly two thirds (65 per cent) of all employees
interviewed said that they expect to retire in their 60s and 17 per cent expect to retire
in their 70s. Those in younger age groups are more likely to say that they expect to
retire in their 70s (37 per cent of 18-24s, 21 per cent of 25-34s). Of those who expect
to retire at 65 or before, the most likely reason given is because they want to (36 per
cent) followed by being able to afford to (20 per cent). Of those already retired, 39
per cent said they did so because they wanted to; 20 per cent said they retired due
to ill-health.
7Fuller Working Lives Evidence Base – 2017
Impact of Fuller Working Lives on Individuals
There are many potential benefits for people remaining in or returning to work
in later life. Individuals who work longer can enjoy additional income from
earnings, a boosted private pension income and State Pension contributions.
Department for Work and Pensions analysis (2013) shows that 12 million people of
working age are heading towards inadequate retirement incomes. Around a third of
people who stopped work aged 50 to SPa between 2008 and 2010 saw their
household income drop by more than half. For these people, and many others, doing
some work can help to improve finances through earnings and private pension
income; maximising opportunities and reaching a higher standard of living in
retirement.
Analysis shows that by delaying retirement until 65 instead of 55, a male
average earner could have £280,000 extra income and might increase his
pension pot by 55 per cent. By retiring at 63 instead of 55, a female average
earner who took a 10 year career break, could have £180,000 extra income and
might increase her pension pot by 50 per cent.
Impact of Fuller Working Lives on Employers
The attitudes and policies of employers towards older workers are key to the
lived experience at work and wellbeing of older workers. Polling research
conducted with private sector businesses in 2015 highlighted that employers value
older workers in their workforce:
• Over three quarters of employers believed that the experience of workers
over 50 was the main benefit of having them in their organisation.
• 65 per cent highlighted the reliability of older workers.
• Nearly a third said workers over 50 were easier to manage than younger
workers (54 per cent said they were equally easy to manage).
• 54 per cent value the role that older workers play as mentors.
• 87 per cent of employers reject the idea that the skills of older workers are
unsuitable for their business.
However, recent DWP qualitative research with employers has highlighted the scale
of the challenge. While employers stated that they valued a mixed age
workforce and were aware in general of an ageing population, few were taking
active steps to change their policies and practices regarding the recruitment,
retention and training of older workers.
Impact of Fuller Working Lives on the Economy
Older workers do not take jobs from younger workers. As people work later in
life, there are often concerns that older workers displace younger workers in the
labour market. However, there is no empirical evidence that younger workers are
‘crowded out’ of the labour market by the employment of older workers. Younger
and older workers should be recognised as complements to each other in
terms of their skills and experience, rather than substitutes.
8Fuller Working Lives Evidence Base – 2017
Research shows that adding one year to everyone’s working life could
increase GDP by one per cent per year after a period of transition (equivalent to
£18bn in 2015).
In 2016, £7.6 billion was spent on out of work benefits for 50-64 year olds, and
45 per cent of the ESA caseload (over 450,000 individuals) were aged 50 years and
over.
Next Steps
An ageing population provides both challenges and opportunities for individuals,
employers and the economy. This highlights the important role that older workers
play in the labour market and the growing need to enable older workers to remain in
and to return to the workforce.
In the strategy document ‘Fuller Working Lives: A Partnership Approach’ the
Government has provided information and evidence to help employers and
individuals adapt to changing demographics. Key messages for individuals are that
working is good for your income and standard of living in later life, whilst appropriate
paid work can be beneficial for health and wellbeing. Recommendations are also
made around options for flexible working, retraining for a new career, self-
employment, volunteering and phased retirement.
Through a combination of headline measures the government will monitor progress
on FWL. The measures identified will be publically available so that individuals,
employers and stakeholders as well as government, can monitor change. The
measures will be published as part of the annual DWP Official Statistical release -
Economic labour market status of individuals aged 50 and over since 1984.1
Headline measures
i. Employment rate of individuals aged 50 years and over, by five year
age band and gender.
ii. Average age of exit from the labour market. The age at which people
are most likely, on average, to leave the labour force.
iii. Employment rate gap between 50-64 year olds and 35-49 year olds,
broken down by gender.
We are continually developing our understanding and evidence base, through
internal DWP analysis and research and by collaborating with expert academics and
researchers.
Achieving a better understanding of changes in the attitudes, behaviours,
expectations and experiences of individuals and employers is integral to the
achievement of the FWL ambition. Developing the evidence base to understand
what people want, experience and require in later life remains central to our future
programme of FWL research and analysis.
1
DWP (2016b) Economic labour market status of individuals aged 50 and over since 1984 (experimental), Official Statistics.
Available at: https://www.gov.uk/government/statistics/economic-labour-market-status-of-individuals-aged-50-and-over-since-
1984-experimental
9Fuller Working Lives Evidence Base – 2017
2. Introduction
The aim of this document is to set out the evidence base that underpins the UK
Government’s Fuller Working Lives (FWL) strategy, to encourage and enable
working in later life.2 New analysis and evidence is presented on how individuals,
employers and the economy can benefit from FWL. Evidence is presented on the
key factors associated with people working later in life such as health, caring
responsibilities and relevant skills. The paper also presents what we know about the
attitudes of both employers and individuals towards working later in life.
This document builds on the ‘Fuller Working Lives: Background Evidence’ published
report by DWP in 2014.3 To avoid repetition, this report focusses on relevant new
and updated research, evidence and analysis. The Department plans to further
develop the evidence base through a dedicated programme of research and
analysis, working in partnership with leading academic and policy stakeholders.
This document is split into eight main sections:
This section (section 2) clarifies the data sources used, the age focus of FWL
and the FWL ambition.
Section 3 provides an overview of the policy rationale for FWL, outlining the
demographic challenge and ageing workforce in the UK.
Section 4 provides an overview of the UK labour market for the population
aged 50 years and over, including trends over time, changes in the ways of
working and draws on new analysis on labour market transitions of older
workers.
Section 5 provides analysis and evidence on the key factors and potential
barriers to working longer for individuals. These include both ‘voluntary’ and
‘involuntary’ reasons for early labour market exit.
Sections 6-8 outline the benefits and impacts of FWL for, respectively,
individuals, employers and the economy.
2.1 Data Sources
Throughout this document new statistics and analysis are presented derived from a
variety of data sources: the UK Labour Force Survey; the Annual Population Survey;
the Family Resources Survey; the English Longitudinal Study of Ageing; DWP
benefit data and DWP pension models. Robust published statistics quoted in other
research reports are also referred to.
Details of the main data sources and methodologies adopted can be found in
Appendices 5 and 6. Due to the variety of data sources used, analysis may cover
different time periods and age bands, therefore, estimates could be subject to slight
variation.
2
DWP (2017d) Fuller Working Lives: A Partnership Approach. Available at: https://www.gov.uk/government/publications/fuller-
working-lives-a-partnership-approach
3
DWP (2014) Fuller Working Lives - Background Evidence. Available at: https://www.gov.uk/government/statistics/fuller-
working-lives-background-evidence
10Fuller Working Lives Evidence Base – 2017
As part of the Pensions and Ageing Society statistical DWP strategy4, an annual
experimental Official Statistic was published in July 2016 – ‘Economic labour market
status of individuals aged 50 and over since 1984.’5
New evidence from a programme of DWP FWL research recently published, to
further develop the evidence base, is also used. This includes: an evaluation of trials
of enhanced Jobcentre Plus provision for claimants aged 45 and over; qualitative
research with employers to better understand their experiences of recruiting,
retaining and retraining older workers and new analysis of national employer data to
understand recent trends regarding age related practices in the workplace and the
impact of older workers on workplace performance. In 2015, we also examined the
changing nature of expectations and attitudes towards working later in life.6
2.2 The Age Focus of Fuller Working Lives
The focus of this report is on people aged 50 and over, both in and out of work.
Analysis is also provided for those who are aged 50 to SPa. To align with the age
breakdowns used in National Statistics and other government departments, the age
bands 50-64 years and 65 years and over as the main sub-groups.
It is important to note that individuals who are currently under 50 are also relevant to
the FWL agenda. Decisions made throughout the lifecourse of an individual, as well
as the key defining characteristics experienced at both younger and older ages, have
an impact on later life.
Recent legislative changes have been introduced. The Default Retirement Age was
removed in 2011. Up to November 2018, the SPa for women will continue to
increase gradually to 65 years old. Between December 2018 and October 2020 the
SPa for men and women is currently legislated to increase to 66 years and then to
67 between 2026 and 2028.
For definitions used throughout this document please see Appendix 1.
2.3 Fuller Working Lives Ambition and Monitoring
The stated FWL ambition is: To support individuals aged 50 years and over to
remain in and return to the labour market and tackle the barriers to doing so.
A combination of headline measures will be used to monitor progress on FWL. The
measures identified below will be publically available so that individuals, employers,
stakeholders and government can monitor change transparently. The measures will
4
DWP (2016d) Pensions and Ageing society statistics: release strategy. Available at:
https://www.gov.uk/government/publications/pensions-and-ageing-society-statistics-release-strategy.
5
DWP (2016b) Economic labour market status of individuals aged 50 and over since 1984 (experimental), Official Statistics.
Available at: https://www.gov.uk/government/statistics/economic-labour-market-status-of-individuals-aged-50-and-over-since-
1984-experimental
6
DWP (2016a) Attitudes to Working in Later Life: analysis of British Social Attitudes 2015. Available at:
https://www.gov.uk/government/uploads/system/uploads/attachment_data/file/574655/attitudes-to-working-in-later-life-british-
social-attitudes-2015.pdf
DWP (2017a) Employer experiences of recruiting, retaining and retraining older workers. Available at:
https://www.gov.uk/government/publications/employer-experiences-of-recruiting-retaining-and-retraining-older-workers-
qualitative-research
DWP (2017b) Older Workers and the Workplace: Evidence from the Workplace Employment Relations Survey. Available at:
https://www.gov.uk/government/publications/older-workers-and-the-workplace-evidence-from-the-workplace-employment-
relations-survey
DWP (2017c) Sector-based work academies and work experience trials for older claimants: Qualitative and quantitative
research. Available at: https://www.gov.uk/government/publications/sector-based-work-academies-and-work-experience-trials-
for-older-claimants-combined-quantitative-and-qualitative-findings
11Fuller Working Lives Evidence Base – 2017
be published as part of the annual DWP Official Statistical release - Economic labour
market status of individuals aged 50 and over since 1984.7
Headline measures
i. Employment rate of individuals aged 50 years and over, broken down
by five year age band and gender.8 This will enable the identification of
trends that may affect specific age groups within this population.
ii. Average age of exit from the labour market. The age at which people
are most likely, on average, to leave the labour force.9
iii. Employment rate gap between 50-64 year olds and 35-49 year olds,
broken down by gender.
It is important to note that cause and effect in relation to policies and outcomes can
only be robustly estimated under a controlled evaluation scenario. Consequently,
any changes in the measures outlined above could be due to a number of factors
taking place within the labour market and wider economy.
Changes in the attitudes and behaviours of individuals and employers are integral to
the achievement of the FWL ambition. Understanding any attitudinal changes will be
central to the future programme of FWL research and analysis.
The latest (Q2 2016) headline measures are outlined below:10
i. 50-64 Employment Rate, Males: 75.8 per cent (Level: 4.5m)
50-64 Employment Rate, Females: 65.7 per cent (Level: 4.0m)
50-64 Employment Rate, All: 70.6 per cent (Level: 8.6m)
65+ Employment Rate, Males: 14.2 per cent (Level: 0.7m)
65+ Employment Rate, Females: 7.5 per cent (Level: 0.5m)
65+ Employment Rate, All: 10.6 per cent (Level: 1.2m)
ii. Average Age of Exit, Males: 65.2 years
Average Age of Exit, Females: 63.7 years
iii. Employment Rate Gap (between 50-64 and 35-49 years), Males: 14.0pp11
Employment Rate Gap (between 50-64 and 35-49 years), Females: 12.2pp
Employment Rate Gap (between 50-64 and 35-49 years), All: 13.1pp
35-49 Employment Rate, Males: 89.7 per cent
35-49 Employment Rate, Females: 77.9 per cent
35-49 Employment Rate, All: 83.7 per cent
7
DWP (2016b) Economic labour market status of individuals aged 50 and over since 1984 (experimental), Official Statistics.
Available at: https://www.gov.uk/government/statistics/economic-labour-market-status-of-individuals-aged-50-and-over-since-
1984-experimental
8
Data for measures i) and iii) can be broken down by five year age bands to monitor gaps between different age groups within
the 50 plus population. These are: 50-54, 55-59, 60-64, 65-69 and 70+.
9
For more information on this indicator please see the Appendix 1 - Definitions.
10
Source: Labour Force Survey Quarter 2 (Q2) April – June.
11
pp = percentage points.
12Fuller Working Lives Evidence Base – 2017
3. The Demographic Challenge
The UK, along with other developed countries, is currently in a period of
demographic change. Population projections show that this is not a short term
phenomenon; older individuals will represent an increasingly significant
proportion of the population and the workforce in the future.
The number of individuals aged 50 years and over as a proportion of the UK adult
population is projected to increase from 42 per cent in 2010 to 50 per cent by the
mid-2030s and remain above 50 per cent thereafter.12
Chart 3.1 shows the expected change in the UK population over the next five years
(from 2017 to 2022) by age band. The population aged 50 years and over will
increase, whilst the younger population will decline. There will be a 6.1 per cent
increase in those aged 50-64 (0.8m individuals) and 9.5 per cent rise in individuals
aged 65 and over (1.1m individuals). Over the same period, the 16-24 and 25-49
populations are expected to decrease by 3.9 per cent and 0.1 per cent respectively.
The increase in the proportion of the population aged 50 years and over
highlights the important role that older workers play in the labour market.
Chart 3.1: Projected change in UK population – 2017 to 2022
Population 65+
1,137,000 (9.5%)
Population 50-64
763,000 (6.1%)
Population 25-49
-13,000 (-0.1%)
Population 16-24
-279,000 (-3.9%)
Source: ONS 2014-based population projections
The average age of leaving the labour market has increased over the past two
decades, but it is still lower than it was in 1950 and is not keeping pace with
the increases in life expectancy (Chart 3.2).13
Alongside changing demographics, changes to the SPa14 will also contribute to an
increase in the working age population. In 2010, one in four of the working age
population were aged 50 years and over; this is projected to increase to one in three
by 2022.15
12
ONS (2014) Population Estimates and 2014-based Population Projections. Available at:
https://www.ons.gov.uk/peoplepopulationandcommunity/populationandmigration.This is consistent with Office of Budget
Responsibility projections on migration. See the “Additional Figures” sheet of the supporting Statistical Reference Tables for
details of the calculation.
13
Life Expectancy - ONS 2014-based projections.
Average Exit Age - Blöndal, S. and S. Scarpetta (1999), ONS Pension Trends and LFS Q2 analysis.
14
See SPa definition in section “2.3 Definitions” for more information on legislated changes to Spa.
15
ONS (2014) Population Estimates and 2014-based Population Projections. Available at:
https://www.ons.gov.uk/peoplepopulationandcommunity/populationandmigration. See the “Additional Figures” sheet of the
supporting Statistical Reference Tables for details of the calculation.
13Fuller Working Lives Evidence Base – 2017
Given the ageing workforce and scale of early exit from the labour market,
there are likely to be significant challenges for the future UK economy in areas
such as financing of state pension provision and maintaining labour supply.
This could have a detrimental impact on economic growth and productivity. As the
population and workforce continue to age, in order to avoid a loss of labour scenario,
employers are likely to need to draw on the skills and experience of older workers.
Demographic change will also have a marked impact on the UK dependency ratio,
there will be fewer people of working age generating income in order to support a
larger population who are aged over SPa.16
Average life expectancy is increasing and people are living longer. Current
average life expectancy at 65 is 23.8 years for females and 21.6 years for males.17
Since 1980, this has increased by 5.8 years and 7.6 years respectively; since 2001,
by 2.2 and 2.8 years. Between 2017 and 2064 average life expectancy is projected
to increase by an additional five years for both males and females.
From 1985 to 2009 (before the change to SPa for women), the average age of exit
from the labour market increased by 1.8 years for females and 1.0 years for males.
Over the same time period, life expectancy increased for females and males by 4.5
years and 5.8 years respectively.
Chart 3.2: Average age of exit from the labour market and cohort life
expectancy at 65 years18
95
90
85
80
Age
75
70
65
60
1950
1960
1970
1980
1990
2000
2010
2020
2030
2040
2050
2060
Year
UK - Female Labour Market exit age UK - Female cohort life expectancy at 65
UK - Male Labour Market exit age UK - Male cohort life expectancy at 65
Sources: Life Expectancy - ONS 2014-based projections.
Average Exit Age - Blöndal, S. and S. Scarpetta (1999), ONS Pension Trends and LFS Q2 Analysis.
16
The Government has asked John Cridland to review the State Pension age: this will be published in spring 2017.
17
ONS (2014) ONS 2014-based Expectation of Life Projections. Available at:
https://www.ons.gov.uk/peoplepopulationandcommunity/birthsdeathsandmarriages/lifeexpectancies/datasets/lifetablesprincipal
projectionunitedkingdom
18
For further information on how the average age of exit from the labour market is calculated, see Appendix 1 – Definitions.
14Fuller Working Lives Evidence Base – 2017
Average UK life expectancy19 has risen substantially for all social classes and
geographic regions in recent years.20 However, there remain inequalities that
have/present potential challenges for some individuals to work in later life. In 2012-
14, the highest life expectancy in England for men at age 65 occurred in Kensington
and Chelsea (21.6 years) and the lowest in Manchester (15.9 years). For women at
this age, the highest life expectancy at 65 was in Camden (24.6 years) and again
lowest in Manchester (18.8 years). Moreover, men aged 65 who worked in higher
managerial and professional occupations were expected to live almost four years
longer than those in routine/manual roles (for women this was three years). 21
When considering increases in average life expectancy, and the potential for people
to work longer, it is also important to consider average healthy life expectancy.
From 2000-02 to 2009-11, it is estimated that average healthy life expectancy
increased for females and males by 1.3 and 1.2 years respectively. Research
suggests that, particularly for older ages, increases in healthy life expectancy are not
keeping pace with gains in life expectancy. Moreover, inequalities in healthy life
expectancies between local areas in the UK are much larger than inequalities in life
expectancy and are widening.22 However, analysis of health expectancies is
challenging as the underlying health and disability questions in surveys have
changed considerably over past decades. This means that caution should be taken
when comparing life expectancy and healthy life expectancy.
The average effective age of exit from the labour market varies substantially across
the OECD countries (Chart 3.3). The UK is below the OECD average for the
effective age of exit from the labour market. Over the 2009-2014 period, countries
such as New Zealand, Australia and Sweden had a higher average effective age of
labour market exit than the UK. Other European counties such as a France, Italy and
Netherlands had lower effective age of exit compared with the UK. For some
countries, the rise in employment rates among older people is part of a longer-term
trend in response to rising life expectancy rates. As people derive benefits from
better health, longer healthier life expectancy can enable the ability to work for
longer.
19
The life expectancies discussed in this section are measured by "period life expectancy" as opposed to the “cohort life
expectancy” measure used in Chart 3.2. For further information on the differences between period and cohort life expectancy,
please visit:
https://www.ons.gov.uk/peoplepopulationandcommunity/birthsdeathsandmarriages/lifeexpectancies/methodologies/periodandc
ohortlifeexpectancyexplained
20
ONS (2015a) Life Expectancy at Birth and at Age 65 by Local Areas in England and Wales: 2012 to 2014, Statistical Bulletin.
Available at:
https://www.ons.gov.uk/peoplepopulationandcommunity/birthsdeathsandmarriages/lifeexpectancies/bulletins/lifeexpectancyatbi
rthandatage65bylocalareasinenglandandwales/2015-11-04
21
ONS (2015b) ONS Longitudinal Study (LS) based estimates of Life Expectancy (LE) by the National Statistics Socioeconomic
Classification (NS-SEC): England and Wales. Data available at:
https://www.ons.gov.uk/peoplepopulationandcommunity/birthsdeathsandmarriages/lifeexpectancies/datasets/onslongitudinalstu
dylsbasedestimatesoflifeexpectancylebythenationalstatisticssocioeconomicclassificationnssecenglandandwales
22
Jagger, C. (2015) Trends in life expectancy and healthy life expectancy, Foresight/Government Office for Science. Available
at:
https://www.gov.uk/government/uploads/system/uploads/attachment_data/file/464275/gs-15-13-future-ageing-trends-life-
expectancy-er12.pdf
15Fuller Working Lives Evidence Base – 2017
Chart 3.3: OECD average effective retirement age and normal retirement age,
2009-201423,24
Korea
Mexico
Chile
Iceland
Japan
Israel
New Zealand
Portugal
Switzerland
United States
Ireland
Australia Female Normal
Sweden Retirement Age
Norway
Turkey
Canada Male Normal
United Kingdom
Estonia Retirement Age
Czech Republic
Denmark
Netherlands Female
Germany Effective Age of
Hungary Retirement
Slovenia
Austria Male Effective
Spain
Poland
Age of
Luxembourg Retirement
Finland
Greece
Italy
Slovak Republic
Belgium
France
OECD
80 60 40 20
0 20 40 60 80 100
Age
Source: OECD (2015), OECD Pensions at a Glance
23
See definitions for more information.
24
2008 instead of 2014 for women in Turkey.
16Fuller Working Lives Evidence Base – 2017
4. The Labour Market for Older Workers - UK
The labour market for older workers is different to that for younger and mid-age
workers in terms of employment rates, incentives to work and the characteristics of
individuals. The decision to work longer is influenced by a range of social,
environmental and economic factors across the lifecourse of an individual. There is a
trade-off between work and leisure at all ages. The incentive to work tends to decline
as individuals near SPa as a result of changes in financial incentives as well as the
motivation to work.25
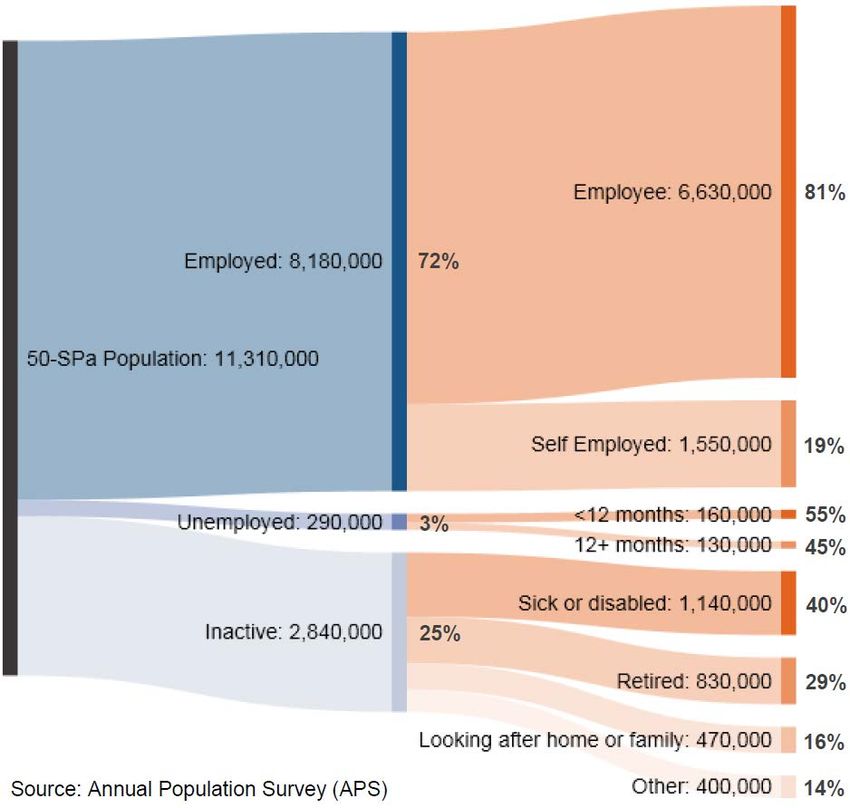
Individuals can be classified into one of three distinct economic activity
groups: those in employment; those who are economically inactive and those
who are unemployed, with individuals flowing between these groups (chart
4.1).26
Chart 4.1: Economic labour market status of individuals aged 50-SPa, July
2015 – June 2016
25
Adam. S, Brewer. M, Shephard. A. (2006) Financial Work Incentives in Britain: comparisons over time and between family
types, IFS Working Paper 06/20. Available at: http://www.ifs.org.uk/wps/wp0620.pdf
26
For definitions of these terms please see Appendix 1.
17Fuller Working Lives Evidence Base – 2017
The employment rate of individuals aged 50 years and over has been
increasing over the past two decades, yet has only recently returned to the
rate last seen in the 1970s (Chart 4.2.)27,28
In Q2 2016, the employment rate for individuals aged 50-64 was 70.6 per cent,
which was 13 percentage points (pp) higher than the rate twenty years ago. The
employment rate for those aged 65 and over was 10.6 per cent, which was more
than double the rate seen in 2000. These figures compare to an employment rate of
83.1 per cent for 25-49 year olds. 29
Chart 4.2: Economic labour market status of individuals aged 50 - 64, 1996 to
201630
80%
70.6%
70%
Employment Rate
60% 57.5%
50%
Rate
38.5%
40%
Inactivity Rate
30% 26.9%
20%
10% 6.5%
Unemployment Rate 3.4%
0%
1996 2001 2006 2011 2016
Year
Source: LFS Q2 analysis
The average employment rate masks differences between sub-groups of the
population, including gender differences. There have been significant changes in the
ways of working and attitudes to work by gender since the 1970s.31 Employment
rates are lower today than in 1970 for men across all five-year age bands from 50-54
to 65-69. Conversely, for women there have been increases in employment rates in
all of these age bands.
The employment rate gap between men and women aged 50-64 years has
declined over time, as more women move into employment and work for
longer. Yet, the gap is still significant, standing at 10pp in 2016 (Chart 4.3).
27
In any given year, the employment rate, inactivity rate and unemployment rate do not add up to exactly 100 per cent. This is
because the employment rate and inactivity rate are calculated as a proportion of the population in the age group, whereas the
unemployment rate is calculated as a proportion of the number of economically active individuals in the age group.
28
LFS Q2; Banks, J. (2015) Extending Working Lives: A Solution to the Challenges of an Ageing Population?, Institute for
Fiscal Studies Annual Lecture 2015, University of Manchester. Available at:
http://www.ifs.org.uk/uploads/Presentations/JB_IFSAnnualLecture.pdf
29
LFS Q2.
30
See Appendix 5 - Data Sources for information on how these rates are consistent with other publically available results
(Section B “The Labour Force Survey and the Annual Population Survey”).
31
Chandler, D. and Tetlow, G. (2014) Retirement in the 21st Century, IFS Report R98. Available at:
https://www.ifs.org.uk/publications/7384
18Fuller Working Lives Evidence Base – 2017
Chart 4.3: Employment rates for men and women, 1996 to 2016
90%
All, 25-49
80%
Males, 50-64
70% All, 50-64
Females, 50-64
60%
50%
Rate
40%
30%
20%
Males, 65+
10% All, 65+
Females, 65+
0%
1996 2001 2006 2011 2016
Year
Source: LFS Q2 analysis
The size of the female labour force is expected to increase at a faster rate than the
male labour force in the future, reflecting a combination of increased participation of
women in the labour market and the gradually increasing SPa for women.32
Research suggests that rises in the SPa for women have had a significant impact on
employment, both full time and part time. The analysis concluded that women’s
employment rates at ages 60 to 61 increased by 6.3pp as a result of the SPa
increase from age 60 to age 62 between April 2010 and March 2014. In addition to
the impact on employment rates, the findings indicate that the policy change also led
to a 4.0pp increase in the proportion of women reporting themselves as sick or
disabled and a 1.2pp increase in the fraction of women who were unemployed and
actively seeking work, at ages 60 and 61. These observed increases in employment,
reported poor health and unemployment were offset by an 11.5pp reduction in the
proportion reporting themselves to be retired.33
As people approach SPa, employment rates decline and economic inactivity
rates rise, as people leave the labour market ‘early’. Employment as a proportion
of the individual year of age population falls from around 80 per cent for men and 75
per cent for women in their mid-50s, to around 35 per cent for men and 25 per cent
for women in their mid-60s (Chart 4.4).34
32
ONS (2014) Population Estimates and 2014-based Population Projections. Available at:
https://www.ons.gov.uk/peoplepopulationandcommunity/populationandmigration.This is consistent with Office of Budget
Responsibility projections on migration.
33 Cribb, J., C. Emmerson and G. Tetlow (2014), ‘Signals matter? Large retirement responses to limited financial incentives’,
Labour Economics, 42: October, 203-212. Available at: http://www.sciencedirect.com/science/article/pii/
S0927537116301245
34
APS Jul 15 – Jun 16
19Fuller Working Lives Evidence Base – 2017
Over half of men and women are not in work in the year before reaching SPa.35
Moreover, one in four men and one in three women reaching SPa have not
worked for five years or more.36
Chart 4.4: Economic activity by single year of age (July 2015-June 2016)37
Males Females
100%
Proportion of Population at Given Age
90%
80%
70%
60%
50%
40%
30%
20%
10%
0%
50 52 54 56 58 60 62 64 66 68 70 50 52 54 56 58 60 62 64 66 68 70
Age Age
Employed Unemployed Inactive (Sick or Disabled) Inactive (Looking after home/family) Inactive (Retired/Other)
Source: APS July 2015 - June 2016.
Note: The lighter bars indicate ages at and above the 2016 State Pension age (Men: 65 years
old, women: 63 years old).
The analysis in Chart 4.4 has been extended to cover ages 20 to 70 years old (see
Appendix 2). This shows that employment rates for men aged 30 to 50 years old are
similar to the employment of people in their early 50s, at approximately 90 per cent.
The employment rates for women increase from about 75 per cent in their 30s to
almost 80 per cent for those in their late 40s, before declining after age 52.
Chart 4.5 shows the situation ten years ago. As previously seen (Chart 4.2), the
overall employment rate for individuals aged 50-64 years old has increased over the
last ten years. Analysis by single year of age highlights where these increases have
occurred, in particular, for males aged 60-70 and for females aged 56-62. For males,
the increases in employment rates have coincided with a decrease in the proportion
reporting they are economically inactive due to being sick or disabled. For females,
the increases in employment rates are largely offset by decreases in the
economically inactive proportion due to being retired (or other).
35
For the time period referred to, this is taken to be 64 for men and 62 for women. Although women’s SPa increased
incrementally over the year covered by this data.
36
APS Jul 15 – Jun 16. See the “Additional Figures” sheet of the supporting Statistical Reference Tables for details of the
calculation.
37
Due to small sample sizes at ages 67 and over, responses for Unemployed, Inactive (Sick or Disabled), Inactive (Looking
after home/family) and Inactive (Retired/Other) have all been grouped into the Inactive (Retired/Other) category.
20Fuller Working Lives Evidence Base – 2017
Chart 4.5: Economic activity by single year of age (July 2005-June 2006)38
Males Females
100%
Proportion of Population at Given Age
90%
80%
70%
60%
50%
40%
30%
20%
10%
0%
50 52 54 56 58 60 62 64 66 68 70 50 52 54 56 58 60 62 64 66 68 70
Age Age
Employed Unemployed Inactive (Sick or Disabled) Inactive (Looking after home/family) Inactive (Retired/Other)
Source: APS July 2005 - June 2006.
Note: The lighter bars indicate ages at and above the 2006 State Pension age (men: 65 years
old, women: 60 years old).
4.1 Economic Inactivity and Unemployment
There are 3.3 million individuals aged 50-64 years old (27.8 per cent of the total
population aged 50-64) who report themselves as economically inactive and 300,000
individuals (2.5 per cent of the population) who report that they are unemployed.39
There are almost one million individuals aged 50-64 years old that are not in
employment but state that they are willing or would like to work.40 This group is
made up of the 300,000 individuals that are unemployed, 40,000 individuals who are
seeking a job but were not available to start work in the next two weeks and 600,000
individuals (18 per cent of the economically inactive population) who are not
currently seeking a job but report they would like to work (Chart 4.6).
38
Due to small sample sizes at ages 68 and over for males and 65 and over for females, responses for Unemployed, Inactive
(Sick or Disabled), Inactive (Looking after home/family) and Inactive (Retired/Other) have all been grouped into the Inactive
(Retired/Other) category.
39
APS Jul 15 – Jun 16.
40
APS Jul 15 – Jun 16.
21Fuller Working Lives Evidence Base – 2017
Chart 4.6: Reasons for not looking for work, individuals aged 50-64, who are
inactive but are willing to or would like to work
Not started Other
Looking 110,000
26,000 19%
4%
Believes no Jobs
13,000
2%
Looking after
home or family
97,000
16%
Long term sick or
disabled
312,000
52% Temporarily sick
or injured
38,000
Source: APS July 2015 - June 2016 7%
The unemployment level of individuals aged 50 years and over is relatively low
compared to the levels of economic inactivity and employment. This level has
decreased over the past five years by over 70,000 individuals (18.5 per cent).41
Yet, the long term unemployment rate for those aged 50 years and over is
higher than for both younger and mid-age groups. A total of 138,000 (43.8 per
cent) of unemployed individuals aged 50 years and over have been unemployed for
over 12 months. This compares to 29.5 per cent for 25-49 year olds and 19.5 per
cent for 18-24 year olds.42
It is estimated that, of the 225,000 individuals aged 50-64 who are currently
unemployed and have left their job in the last eight years, 36 per cent were
dismissed/made redundant, 18 per cent said their job came to an end, 13 per cent
left due to ill health and four per cent retired.43
Further information on individuals’ reasons for leaving the labour market can be
found in Section 5.
Internationally, the UK performs above average for older worker employment
rates, but there remains room for improvement. OECD countries such as New
Zealand, Sweden and Iceland have employment rates for 55-64 years olds of above
70 per cent. This is compared with the UK’s rate of 62.2 per cent (Chart 4.7).
41
LFS (Q2 2016 compared to Q2 2011). See table A05 (not seasonally adjusted) from the UK Labour Market Statistical bulletin
published by ONS. Available at:
https://www.ons.gov.uk/employmentandlabourmarket/peopleinwork/employmentandemployeetypes/bulletins/uklabourmarket/pr
eviousReleases
42
LFS Q2 2016. See table UNEM01 (not seasonally adjusted) from the UK Labour Market Statistical bulletin published by ONS.
Available at:
https://www.ons.gov.uk/employmentandlabourmarket/peopleinwork/employmentandemployeetypes/bulletins/uklabourmarket/pr
eviousReleases
43
APS Jul 15 – Jun 16.
22Fuller Working Lives Evidence Base – 2017
Chart 4.7: International comparison of employment rates for 55-64 year olds,
OECD, 2005 and 201544,45
90%
80%
70%
Employment Rate
60%
50%
40%
30%
20%
10%
0%
Colombia
Japan
Greece
Slovenia
Poland
Czech Republic
Finland
Hungary
Austrai
Chile
Norway
Sweden
Luxenburgh
Portugal
Ireland
Latvia
Korea
Slovakia
Russia
Germany
New Zealand
Iceland
Belgium
Italy
Mexico
United Kingdom
United States
Denmark
South Africa
Netherlands
Israel
Turkey
Spain
France
OECD
Australia
Estonia
Switzeland
Canada Country
2015 2005
Source: OECD Labour Market Statistics (2016)
4.2 Ways of Working
There are more people in work than ever before, yet there has not been a
corresponding increase in the labour supply measured by total hours worked.
Over the past ten years, there have been changes in ways of working in the UK
labour market, including an increase in self-employment and flexible
working.46
Recent analysis (2016) of the English Longitudinal Study of Ageing (ELSA)47 shows
that between 2002-03 and 2014-15, the proportion of men aged 50-69 years in the
survey, in any paid work, increased from 59 per cent to 65 per cent, whilst hours
worked increased by two per cent. For women aged 50-69 in the survey, the
proportion in paid work over the same period increased from 48 per cent to 54 per
cent and hours worked increased by 13 per cent.48
The proportion of individuals reporting that they are self-employed increases
with age; the majority of work taking place post-SPa is part time and/or self-
employed (Chart 4.8).
44
Note: OECD weighted average. OECD (2016) Employment rate by age group (indicator). Available at:
https://data.oecd.org/emp/employment-rate-by-age-group.htm [accessed 07 November 2016]
45
2006 data for Turkey as 2005 was not available.
46
To note that, in November 2016 the Government commissioned Matthew Taylor to conduct a review of modern employment
practices. For more information see: https://www.gov.uk/government/news/taylor-review-on-modern-employment-practices-
launches
47
For more information on the English Longitudinal Study of Ageing (ELSA) please see Appendix 5.
48
Banks J., Batty, G. D., Nazroo, J. and Steptoe A. (2016) The Dynamics of Ageing: Evidence from the English Longitudinal
Study of Ageing 2002-15 (Wave 7), Institute for Fiscal Studies. Available at: https://www.ifs.org.uk/publications/8696
23Fuller Working Lives Evidence Base – 2017
Chart 4.8: Proportion of people employed that are self-employed and/or work
part time49
2016 2006
80%
Percentage of the age group that are
70%
60%
50%
employed
40%
30%
20%
10%
0%
18-24 25-49 50-64 65+ 18-24 25-49 50-64 65+
Self Employed Part Time
Source: LFS Q2 2016 and Q2 2006
Evidence suggests that there is high demand for more flexible work among older
employees; this approach may help workers and employers to better manage the
demands of work and age. However, recent research has shown that employers
tend to think of younger workers as the primary beneficiaries of flexible working
arrangements in relation to parenting and childcare responsibilities – more flexible
ways of working for older workers could be equally beneficial.50,51
4.3 Transitions in Work
Recent analysis of ELSA also shows that the labour market for older age groups is
more dynamic than might previously have been thought, with people changing jobs
frequently during the later stages of their working lives - although this labour market
mobility still falls with age and is lower for women. The analysis also shows that
these job transitions are strongly associated with reductions in hours worked. This is
particularly true for low socioeconomic status workers and those in poor health, who
seem less likely to be able to vary their hours without such employment changes.52
Over 12 per cent of people aged 50-54 and eight per cent of people aged 55-59 in
the survey changed jobs in the period 2008-10 to 2012-14, and approximately two
per cent of people aged 50-69 years entered paid work between this period.53 The
analysis shows that those with fewer qualifications and those with lower wealth were
less likely to change jobs or re-enter the labour market if they were out of work.
49
An individual in employment is classified as either full time or part time. Any individual in employment (whether full time or
part time) can be classified as self-employed.
50
DWP (2016a) Attitudes to Working in Later Life: analysis of British Social Attitudes 2015. Available at:
https://www.gov.uk/government/uploads/system/uploads/attachment_data/file/574655/attitudes-to-working-in-later-life-british-
social-attitudes-2015.pdf;
51
DWP (2017a) Employer experiences of recruiting, retaining and retraining older workers. Available at:
https://www.gov.uk/government/publications/employer-experiences-of-recruiting-retaining-and-retraining-older-workers-
qualitative-research
52
Banks J., Batty, G. D., Nazroo, J. and Steptoe A. (2016) The Dynamics of Ageing: Evidence from the English Longitudinal
Study of Ageing 2002-15 (Wave 7), Institute for Fiscal Studies. Available at: https://www.ifs.org.uk/publications/8696; Chandler,
D. and Tetlow, G. (2014) Retirement in the 21st Century, IFS Report R98. Available at:
https://www.ifs.org.uk/publications/7384;
53
Sample is all individuals aged 50-69 in ELSA waves 1-6 who were observed in the subsequent wave two years later.
24You can also read