Assessing branched tetraether lipids as tracers of soil organic carbon transport through the Carminowe Creek catchment (southwest England)
←
→
Page content transcription
If your browser does not render page correctly, please read the page content below
Biogeosciences, 17, 3183–3201, 2020
https://doi.org/10.5194/bg-17-3183-2020
© Author(s) 2020. This work is distributed under
the Creative Commons Attribution 4.0 License.

Assessing branched tetraether lipids as tracers of soil organic
carbon transport through the Carminowe Creek catchment
(southwest England)
Jingjing Guo1 , Miriam Glendell2 , Jeroen Meersmans3 , Frédérique Kirkels1 , Jack J. Middelburg1 , and
Francien Peterse1
1 Departmentof Earth Sciences, Utrecht University, 3584 CB Utrecht, the Netherlands
2 TheJames Hutton Institute, Craigiebuckler, Aberdeen, AB15 8QH, UK
3 TERRA Teaching and Research Centre, Gembloux Agro-Bio Tech, University of Liège, 5030 Gembloux, Belgium

Correspondence: Jingjing Guo (j.guo@uu.nl)

Received: 19 December 2019 – Discussion started: 11 March 2020
Revised: 14 May 2020 – Accepted: 25 May 2020 – Published: 24 June 2020

Abstract. Soils represent the largest reservoir of organic          of cyclization (DC = 0.23 ± 0.02 in creek bed sediments and
carbon (OC) on land. Upon mobilization, this OC is ei-              0.32±0.08 in lake core sediments). Thus, in this small catch-
ther returned to the atmosphere as carbon dioxide (CO2 ) or         ment, brGDGTs do not allow us to trace soil OC transport.
transported and ultimately locked into (marine) sediments,          Nevertheless, the downcore changes in the degree of cycliza-
where it will act as a long-term sink of atmospheric CO2 .          tion and the abundance of isoprenoid GDGTs produced by
These fluxes of soil OC are, however, difficult to evalu-           methanogens in the Loe Pool sediment do reflect local en-
ate, mostly due to the lack of a soil-specific tracer. In this      vironmental conditions over the past 100 years and have
study, a suite of branched glycerol dialkyl glycerol tetraethers    recorded the eutrophication history of the lake.
(brGDGTs), which are membrane lipids of soil bacteria, is
tested as specific tracers for soil OC from source (soils un-
der arable land, ley, grassland, and woodland) to sink (Loe
Pool sediments) in a small catchment located in southwest           1   Introduction
England (i.e. Carminowe Creek draining into Loe Pool).
The analysis of brGDGTs in catchment soils reveals that             Globally, around 1500–2000 Pg of carbon is stored in soils in
their distribution is not significantly different across dif-       the form of organic matter, which is about 2 times the amount
ferent land use types (p > 0.05) and thus does not allow            of carbon in the atmosphere and 3 times the amount of car-
land-use-specific soil contributions to Loe Pool sediments          bon in vegetation (Janzen, 2004; Smith, 2008). Soil organic
to be traced. Furthermore, the significantly higher contribu-       carbon (OC) plays an important role in the global carbon cy-
tion of 6-methyl brGDGT isomers in creek sediments (iso-            cle, as subtle alterations in the soil OC reservoir may affect
merization ratio (IR) = 0.48 ± 0.10, mean ± standard devi-          the concentration of atmospheric CO2 and thus influence cli-
ation (SD); p < 0.05) compared to that in catchment soils           mate change (Davidson and Janssens, 2006). Atmospheric
(IR = 0.28 ± 0.11) indicates that the initial soil signal is sub-   CO2 that is fixed by plants through photosynthesis will be
stantially altered by brGDGT produced in situ. Similarly,           stored in the soil OC pool, part of which will be transferred to
the riverine brGDGT signal appears to be overwritten by la-         streams and rivers. Upon fluvial discharge, soil OC is buried
custrine brGDGTs in the lake sedimentary record, indicated          and locked into the marine or lacustrine sediment, where it
by remarkably lower methylation of branched tetraethers             will act as a long-term carbon sink. However, instead of a
(MBT05ME = 0.46 ± 0.02 in creek bed sediments and 0.38 ±            passive pipeline in the carbon cycle, rivers actually represent
0.01 in lake core sediments; p < 0.05) and a higher degree          a dynamic channel, where part of the soil OC is respired back
                                                                    to the atmosphere, and another part may be stored in river

Published by Copernicus Publications on behalf of the European Geosciences Union.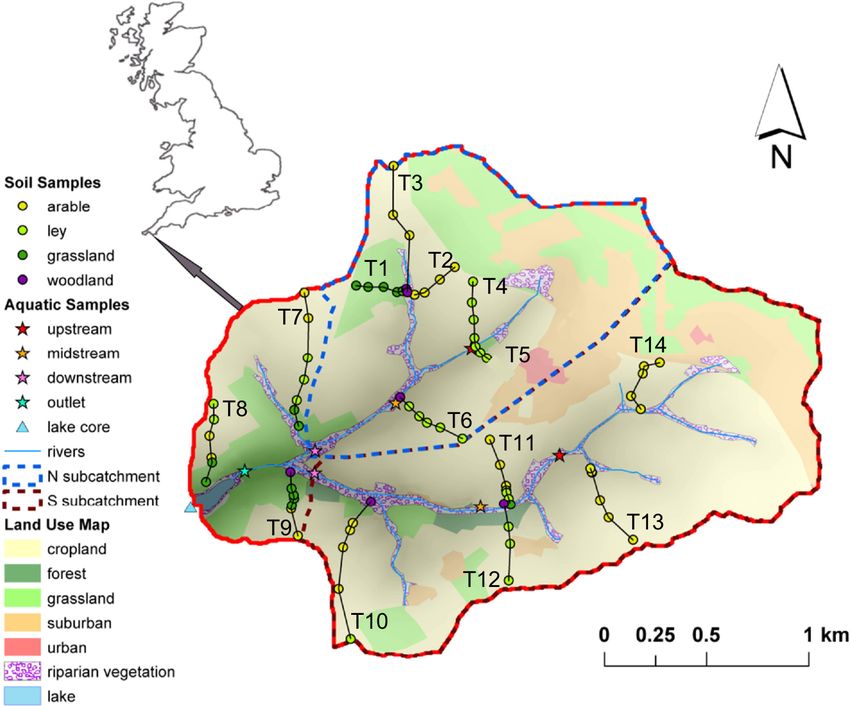
3184                                                          J. Guo et al.: Tetraether lipids as tracers of soil organic carbon

bed or lake sediments before reaching the ocean (Cole et al.,       matography method used for brGDGT analysis, a modified
2007; Battin et al., 2009; Aufdenkampe et al., 2011). Hence,        temperature proxy, the MBT05ME was developed (De Jonge
it is hard to determine the exact amount of soil OC that is         et al., 2013, 2014b). Furthermore, the relative abundance of
transported to the ocean, as the dynamic processes that soil        6-methyl brGDGT isomers, quantified as the isomerization
OC undergoes during transport, such as degradation and se-          ratio (IR), appeared to also relate to soil pH (De Jonge et
questration, are elusive. This is mostly due to the lack of a       al., 2014b). Indeed, the analysis of brGDGTs in peat profiles
specific tracer to distinguish soil OC from the total pool of       and loess–paleosol sequences has resulted in long-term con-
OC that is also comprised of plant-derived OC, aquatically          tinental paleotemperature records for various areas, e.g. in
produced OC, and fossil OC from rock erosion (Blair et al.,         deglacial central China (Peterse et al., 2011) and northeast
2004; Aufdenkampe et al., 2011).                                    China (Zheng et al., 2017), and western Europe during the
   To circumvent this problem, lipid biomarkers can be used         early Eocene (Inglis et al., 2017).
to trace a specific part of the total OC pool in complex natural       These brGDGTs have not only been found in soils, but
environmental systems (Brassell and Eglinton, 1986; Wake-           also in coastal marine sediments, where they have been used
ham and Lee, 1993). For example, odd-numbered long-chain            as the terrestrial end-member in the branched and isoprenoid
n-alkanes derived from epicuticular plant waxes are widely          tetraether (BIT) index that determines the relative contribu-
used to detect the contribution of terrestrial OC to river-         tion of fluvially supplied soil organic matter to marine sed-
dominated marine sediments (Eglinton and Hamilton, 1967;            iments, where the latter is represented by amounts of the
Hedges et al., 1997; Fernandes and Sicre, 2000; Glendell et         isoprenoid GDGT crenarchaeol (Hopmans et al., 2004). For
al., 2018). Similarly, lignin, an abundant biopolymer in vas-       example, the relative abundance of brGDGTs in a marine
cular plants (Hedges et al., 1997), has been used to trace OC       sediment core from the Bay of Biscay revealed the early
transport along the terrestrial–aquatic continuum in, for ex-       re-activation of European rivers after the last deglaciation
ample, the Mississippi River (Goñi et al., 1997; Bianchi et         (Ménot et al., 2006). Furthermore, brGDGTs stored in con-
al., 2004), the Amazon River (Hedges et al., 1986, 2000;            tinental margin sediments are assumed to represent an inte-
Feng et al., 2016), and Arctic rivers (Feng et al., 2013). How-     grated climate signal of the nearby land and have been used
ever, these biomarkers are derived from vegetation, which,          as such to generate temperature records of deglacial tropi-
although land-derived, is not fully representative of soil OC.      cal Africa (Weijers et al., 2007b) and Pliocene northwestern
Thus, in order to specifically trace and quantify the pool of       Europe (Dearing Crampton-Flood et al., 2018).
soil OC, another biomarker is needed.                                  Recently, however, brGDGTs have also been found to be
   Branched glycerol dialkyl glycerol tetraethers (brGDGTs;         produced in aquatic systems such as coastal marine areas
Fig. 1) are membrane-spanning tetraether lipids synthesized         (Peterse et al., 2009; Sinninghe Damsté, 2016), rivers (Kim
by heterotrophic bacteria that thrive in soils and peats all        et al., 2012; Zell et al., 2013, 2014) and lakes (Sinninghe
over the world (Weijers et al., 2006a, 2007a; Naafs et al.,         Damsté et al., 2009; Tierney and Russell, 2009; Loomis et
2017). Although the exact producers of these lipids are still       al., 2011, 2014; Schoon et al., 2013; Weber et al., 2015,
unknown, after the detection of a brGDGT and the presumed           2018), which complicates the interpretation of brGDGT-
brGDGT precursor lipid iso-diabolic acid in Acidobacterial          based proxy records. A contribution of in situ-produced
cultures (Sinninghe Damsté et al., 2011, 2014, 2018), it was        brGDGTs in lakes or on the continental shelf may bias BIT
assumed that members of this phylum are the main source or-         index values towards a more terrestrial signal (e.g. Sinninghe
ganisms of brGDGTs in soils. However, a biological source           Damsté et al., 2009; De Jonge et al., 2015). Aquatic pro-
outside the phylum of Acidobacteria cannot be excluded              duction in coastal marine areas first became apparent upon
(Sinninghe Damsté et al., 2018). The occurrence and rela-           comparison of brGDGTs in Svalbard fjord sediments and
tive distribution of brGDGTs in a global set of modern sur-         nearby soils. Whereas the brGDGT signal in the fjord sed-
face soils showed that they can have 4 to 6 methyl groups at-       iments was dominated by compounds containing cyclopen-
tached to their alkyl backbone, where the degree of branching       tane moieties, soils were characterized by brGDGTs with-
increases in soils from colder areas. Furthermore, brGDGTs          out cyclization (Peterse et al., 2009). These substantially dif-
respond to changes in soil pH by forming up to two cyclopen-        ferent brGDGT signatures in combination with the increas-
tane moieties following internal cyclization, where a higher        ing concentration of brGDGTs towards the open ocean then
number of cyclopentane moieties corresponds to a higher soil        pointed towards a contribution of in situ-produced brGDGTs
pH (Weijers et al., 2007a). Initially, a combination of two         to the fjord sediments. Similarly, brGDGT distributions in
proxies, the methylation of branched tetraethers (MBT) in-          lake sediments were found to differ from those in soils sur-
dex and cyclization of branched tetraethers (CBT) index, was        rounding the lake (Sinninghe Damsté et al., 2009; Tierney
proposed as a proxy to reconstruct the mean air temperature         and Russell, 2009) and generated temperature estimates that
(MAT) and pH of a soil (Weijers et al., 2007a; Peterse et al.,      severely underestimated actual MAT, mostly due to a high
2012). After the identification of novel brGDGT isomers that        relative abundance of hexamethylated brGDGTs (e.g. Tier-
possess a methyl group at the α and/or ω position 6 rather          ney et al., 2010; Loomis et al., 2014; Weber et al., 2015).
than at position 5 (Fig. 1) and the improvement of the chro-        Finally, the presence of brGDGTs with a polar headgroup

Biogeosciences, 17, 3183–3201, 2020                                                    https://doi.org/10.5194/bg-17-3183-2020
J. Guo et al.: Tetraether lipids as tracers of soil organic carbon                                                                    3185

Figure 1. Molecular structures of 5-methyl and 6-methyl branched GDGTs, GDGT-0, and crenarchaeol. The 6-methyl brGDGTs are repre-
sented by apostrophes. The structures of penta- and hexamethylated brGDGTs with cyclopentane moiety(ies) IIb0 , IIc0 , IIIb0 , and IIIc0 are
tentative.

still attached in suspended particulate matter (SPM) of sev-            a relatively high contribution of 6-methyl brGDGT isomers
eral large rivers (Zhang et al., 2012; Zell et al., 2013; De            and can be quantified using the IR (De Jonge et al., 2014a).
Jonge et al., 2014a) provided strong evidence for aquatic pro-             Here we test brGDGTs as tracers for soil OC in Carmi-
duction, as these headgroups are thought to be lost within              nowe Creek catchment, a small catchment in southwest Eng-
days after cell death (e.g. Harvey et al., 1986). Notably, these        land. Previously, an attempt was made to follow OC trans-
and subsequent studies proposed ways to recognize in situ               port from soil (source) to Loe Pool, the final sink of this
production of brGDGTs in aquatic environments. For exam-                catchment, using a combination of stable isotopes of bulk soil
ple, a high degree of cyclization is an indicator of brGDGT             OC and plant leaf wax n-alkanes as fingerprints for the dif-
production in coastal marine zones (Peterse et al., 2009; Sin-          ferent vegetation types present in the catchment (i.e. arable
ninghe Damsté, 2016), for which Sinninghe Damsté (2016)                 land, grassland, ley, and woodland) (Glendell et al., 2018).
proposed that a weighted number of rings in tetramethylated             Although most land use types had a distinct n-alkane fin-
brGDGTs, quantified as #ringstetra > 0.7 indicates a purely             gerprint, OC derived from arable land and temporary grass-
marine source of brGDGTs in continental margin sediments.               land (ley) could not be distinguished (Glendell et al., 2018).
In rivers, aquatic brGDGTs appear to be characterized by                Hence, by assuming a primary soil source of the brGDGTs,

https://doi.org/10.5194/bg-17-3183-2020                                                          Biogeosciences, 17, 3183–3201, 2020
3186                                                          J. Guo et al.: Tetraether lipids as tracers of soil organic carbon

their analysis in the same samples may contribute to trac-          After addition of a known amount of C46 GDGT internal
ing soil OC from different land use types during transport          standard (Huguet et al., 2006), the TLEs were dried under
in Carminowe Creek. Moreover, changes in GDGT distri-               a N2 stream and then separated into apolar and polar frac-
butions in a 50 cm long sediment core from Loe Pool may             tions by passing them over an activated Al2 O3 column using
be used to infer changes in soil OC transport dynamics in           hexane–DCM (9 : 1, v/v) and DCM–MeOH (1 : 1, v/v) re-
the catchment over the past century and potentially couple          spectively. The polar fraction, which contains the GDGTs,
them to climate or anthropogenic activity related events in         was evaporated to dryness under a gentle N2 stream. After
the catchment area.                                                 this, the samples were prepared for further analysis by re-
                                                                    dissolving them in a hexane–isopropanol (99 : 1, v/v) mix-
                                                                    ture, and filtration through a 0.45 µm polytetrafluoroethylene
2     Methods                                                       (PTFE) filter.
                                                                       The GDGTs were analysed on an Agilent 1260 In-
2.1    Study site and sampling                                      finity ultra-high-performance liquid chromatographer (UH-
                                                                    PLC) coupled to an Agilent 6130 single quadrupole mass
An overview of the study area and sampling sites is given by
                                                                    spectrometer (MS) with settings according to Hopmans
Glendell et al. (2018). Briefly, the Carminowe Creek catch-
                                                                    et al. (2016). The GDGTs were separated over two sil-
ment is located in Cornwall in southwest England (50◦ 140 N,
                                                                    ica Waters Acquity UPLC BEH Hilic columns (1.7 µm,
5◦ 160 W), covers an area of around 4.8 km2 and varies in el-
                                                                    2.1 mm × 150 mm) preceded by a guard column with the
evation from 0 to 80 m above sea level (a.s.l.; Fig. 2). It is
                                                                    same packing. GDGTs were eluted isocratically at a flow rate
divided into two subcatchments (“north” and “south”). The
                                                                    of 0.2 mL min−1 using 82 % A and 18 % B for 25 min, fol-
two streams converge around 100 m before their joint outlet
                                                                    lowed by a linear gradient to 70 % A and 30 % B for 25 min,
and then flow into a natural freshwater lake, Loe Pool (50 ha),
                                                                    where A = hexane and B = hexane–isopropanol (9 : 1, v/v).
which is separated from the Atlantic Ocean by a natural shin-
                                                                    Sample injection volumes were 10 µL. Ionization of the
gle barrier. The mean annual temperature (MAT) and mean
                                                                    GDGTs was achieved by atmospheric pressure chemical ion-
annual precipitation (MAP) in this area are approximately
                                                                    ization with the following source settings: gas temperature
11 ◦ C and 1000 mm yr−1 , respectively. The land use in this
                                                                    200 ◦ C, vaporizer temperature 400 ◦ C, N2 flow 6 L min−1 ,
studied catchment is dominated by arable land and temporary
                                                                    capillary voltage 3500 V, nebulizer pressure 25 psi and
grasslands (ley), which are under rotation. The steeper hill-
                                                                    a corona current of 5.0 µA. By scanning the [M + H]+
slopes are under permanent grassland, and riparian woodland
                                                                    ions (protonated mass) in selected ion monitoring (SIM)
covers the areas near the creek. For this study, 74 surface soil
                                                                    mode, the target compounds were detected at m/z 1302
samples (0–15 cm) were collected along 14 hillslope tran-
                                                                    (GDGT-0), 1292 (crenarchaeol), 1050 (brGDGT–IIIa), 1048
sects, including 31 arable land sites, 14 permanent grassland
                                                                    (brGDGT–IIIb), 1046 (brGDGT–IIIc), 1036 (brGDGT–IIa),
sites, 24 temporary grassland (ley) sites, and 5 woodland sites
                                                                    1034 (brGDGT–IIb), 1032 (brGDGT–IIc), 1022 (brGDGT–
(Fig. 2). Riverbed sediments were collected at three locations
                                                                    Ia), 1020 (brGDGT–Ib), and 1018 (brGDGT–Ic), with
along each of the two tributaries (upstream, midstream, and
                                                                    m/z 744 for the internal standard. Quantitation was achieved
downstream), and one more at the joint outlet. A 50 cm long
                                                                    by peak area integration of the [M + H]+ ions in Chemsta-
sediment core was taken in the lake, about 150 m away from
                                                                    tion software B.04.03.
the joint outlet. The lake core has been dated by the activ-
ity of caesium-137 (137 Cs), and it covers the last 100 years       2.4   GDGT proxy calculations
(Glendell et al., 2018).
                                                                    The roman numerals in the following equations refer to the
2.2    Bulk soil properties                                         molecular structures of GDGTs in Fig. 1. The ratios below
                                                                    were calculated based on the fractional abundances (indi-
Total carbon contents were reported by Glendell et al. (2018).      cated by using square brackets) of GDGTs. The BIT index
Soil pH was measured in this study using a pH meter in a            was calculated according to Hopmans et al. (2004) and mod-
soil-to-water ratio of 1 : 5 (w : v) after shaking for 2 h.         ified to also include 6-methyl brGDGTs:
2.3    GDGT extraction and analysis                                             [Ia]+[IIa]+[IIIa]
                                                                                 +[IIa0 ]+[IIIa0 ]
                                                                    BIT =                             .                        (1)
In total, 74 soil samples, 7 creek bed sediment samples, and                [Ia]+[IIa]+[IIIa]+[IIa0 ]
25 lake core sediment samples were analysed for GDGTs.                      +[IIIa0 ]+[crenarchaeol]

First, 5–7 g of the soils or 3–5 g of the sediments were freeze
                                                                    The degree of methylation (MBT05ME ) and relative abun-
dried and homogenized, after which they were extracted 3
                                                                    dances of tetra-, penta-, and hexamethylated brGDGTs were
times with dichloromethane (DCM)–MeOH (9 : 1, v/v) us-
                                                                    calculated following De Jonge et al. (2014b) and Sinninghe
ing an accelerated solvent extractor (ASE 350, Dionex™) at
                                                                    Damsté (2016):
100 ◦ C and 7.7 × 10⁶ Pa to obtain a total lipid extract (TLE).

Biogeosciences, 17, 3183–3201, 2020                                                       https://doi.org/10.5194/bg-17-3183-2020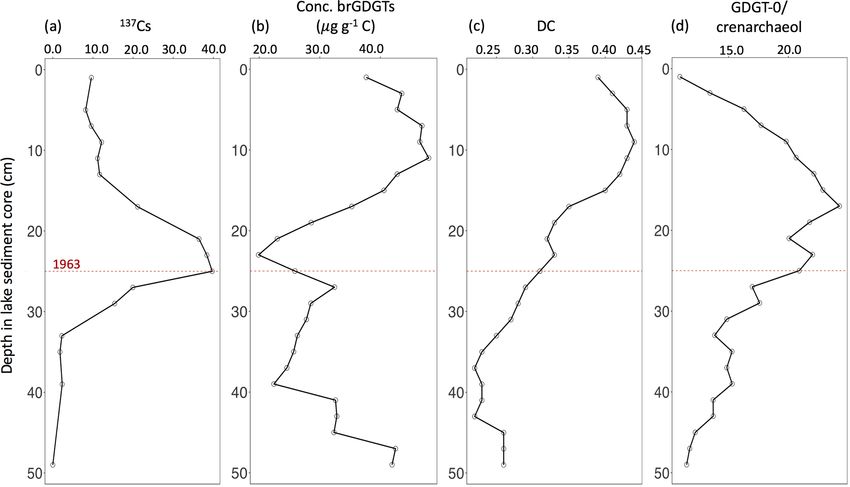
J. Guo et al.: Tetraether lipids as tracers of soil organic carbon                                                                    3187

Figure 2. Map of the Carminowe Creek catchment in southwest England showing land use types, 14 soil transects (labelled T1–14), creek
bed and lake core sediment sampling locations. The coloured circles and stars indicate soil samples under different land use types and creek
bed sediments along the streams, respectively. Adjusted from Glendell et al. (2018).

              [Ia] + [Ib] + [Ic]                                                           [IIa0 ]+[IIb0 ]+[IIc0 ]
MBT05ME =     [Ia]+[Ib]+[Ic]+[IIa]
                                   ,                           (2)                        +[IIIa0 ]+[IIIb0 ]+[IIIc0 ]
                                                                        IR =                                                      .     (7)
              +[IIb]+[IIc]+[IIIa]                                                 [IIa]+[IIa0 ]+[IIb]+[IIb0 ]+[IIc]+[IIc0 ]
                                                                               +[IIIa]+[IIIa0 ]+[IIIb]+[IIIb0 ]+[IIIc]+[IIIc0 ]
         X
%tetra =   tetramethylated brGDGTs
      = [Ia] + [Ib] + [Ic],                                    (3)      2.5    Statistical analysis and data visualization
         X
%penta =       pentamethylated brGDGTs                                  The statistical analysis and data visualization were under-
       = [IIa] + [IIb] + [IIc] + IIa0 + IIb0 + [IIc0 ],                 taken in R software (version 3.5.2) (R Core Team, 2018).

                                                               (4)
        X                                                             Differences in the concentration of brGDGTs and brGDGT-
%hexa =       hexamethylated brGDGTs                                    based proxies between different land use types (i.e. arable
      = [IIIa] + [IIIb] + [IIIc] + IIIa0 + IIIb0

                                                                        land, grassland, ley, and woodland), creek bed, and lake core
       + [IIIc0 ].                                             (5)      sediments were examined by one-way nested ANOVA un-
                                                                        der a generalized linear model (GLM) followed by post hoc
Furthermore, the degree of cyclization (DC) was calculated              analysis (Tukey honest significant difference test) and were
according to Baxter et al. (2019):                                      performed with the packages “car”, “carData”, and “agrico-
                                                                        lae”. Differences were considered to be significant at a level
                  [Ib] + 2 · [Ic] + [IIb] + [IIb0 ]                     of p < 0.05. To show how close our sample mean is to the
DC =                                                       . (6)
       [Ia] + [Ib] + [Ic] + [IIa] + IIa0 + [IIb] + [IIb0 ]              population mean, standard deviation is used (mean ± SD).

                                                                        To examine whether brGDGT signatures could distinguish
The isomerization ratio (IR) is the ratio between penta- and            soil OC derived from different land use types, principal com-
hexamethylated 6-methyl brGDGTs and the total amount of                 ponent analysis (PCA) was performed with package “Fac-
both 5- and 6-methyl penta- and hexamethylated brGDGTs                  toMineR” and “factoextra”. The box plot and scatter plots
(De Jonge et al., 2014a):                                               were carried out with package “ggplot2”.

https://doi.org/10.5194/bg-17-3183-2020                                                              Biogeosciences, 17, 3183–3201, 2020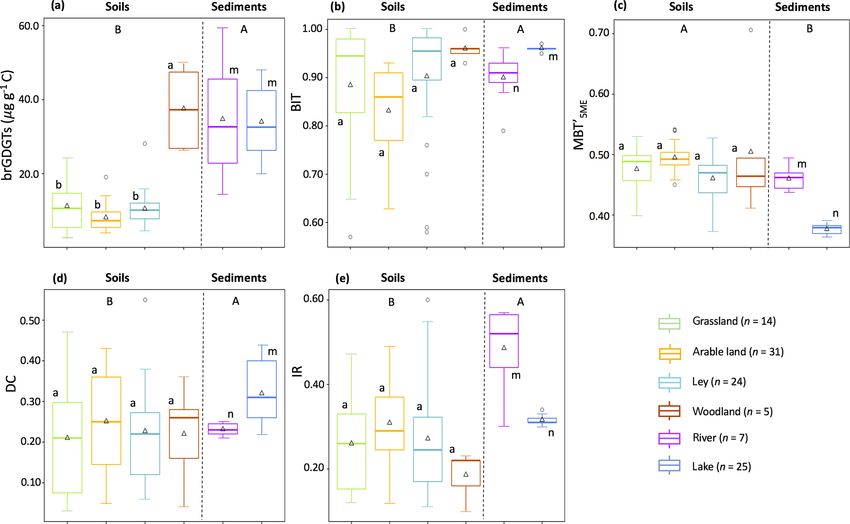
3188 J. Guo et al.: Tetraether lipids as tracers of soil organic carbon
3 Results
∗ From Glendell et al. (2018).
hexamethylated brGDGTs), DC (degree of cyclization), IR (isomerization ratio) (mean ± standard deviation, SD).
MBT5ME
Table 1. C% (carbon content), pH values, average concentrations of brGDGTs, and brGDGT-based proxies under different land use types. BIT (branched and isoprenoid tetraether ratio),
Lake (25)
creek (7)
all soils (74)
woodland (5)
ley (24)
grass (14)
arable (31)
Land use (n)
0
3.1 BrGDGTs in soils
(methylation of 5-methyl branched tetraethers), %tetra (percentage of tetramethylated brGDGTs), %penta (percentage of pentamethylated brGDGTs), %hexa (percentage of
Most of the brGDGTs were present in all soils. Only
brGDGT–IIIc and brGDGT–IIIc0 were always below the de-
7.5 ± 1.0
2.3 ± 0.8
4.0 ± 1.8
8.2 ± 2.1
3.6 ± 0.9
5.6 ± 1.2
2.9 ± 0.5
tection limit (peak height > 3× baseline), and brGDGT–
C%∗
IIc0 was below the detection limit in 13 of the soils
(three in arable land, four in grassland, and six in ley).
The brGDGTs were dominated by pentamethylated (49.4 ±
5.7 ± 0.2
7.1 ± 0.2
6.2 ± 0.5
5.4 ± 0.7
6.0 ± 0.3
6.0 ± 0.5
6.6 ± 0.4
3.0 %, mean ± SD), followed by tetramethylated (39.7 ±
4.9 %) and then hexamethylated brGDGTs (10.9 ± 2.6 %;
pH
Table 1). The concentration of brGDGTs ranged between
0.1 and 1.7 µg g−1 soil, with an average of 0.2 ± 0.1 µg g−1
(µg g−1 soil)
soil in arable land, 0.6 ± 0.4 µg g−1 soil in grassland, and
2.6 ± 0.7
0.8 ± 0.4
0.6 ± 0.8
3.0 ± 1.0
0.4 ± 0.3
0.6 ± 0.4
0.2 ± 0.1
0.4 ± 0.3 µg g−1 soil in ley (i.e. the temporary grassland).
Conc.
However, the concentration of brGDGTs in woodland was
3.0 ± 1.0 µg g−1 soil, which was significantly higher than
that in other land use types (0.4 ± 0.3 µg g−1 soil; p < 0.05;
34.7 ± 17.4
37.6 ± 11.0
(µg g−1 C)
34.0 ± 8.7
11.5 ± 8.9
10.5 ± 4.8
11.2 ± 6.7
8.1 ± 3.6
Fig. 3a). The C-normalized concentration of brGDGTs in
Conc.
catchment soils ranged between 2.8 and 49.8 µg g−1 C, 8.1 ±
3.6 µg g−1 C in arable land, 11.2 ± 6.7 µg g−1 C in grassland,
10.5±4.8 µg g−1 C in ley, and 37.6±11.0 µg g−1 C in wood-
0.96 ± 0.01
0.90 ± 0.06
0.87 ± 0.12
0.96 ± 0.03
0.90 ± 0.12
0.88 ± 0.14
0.83 ± 0.09
land (Fig. 3a; Table 1). The trend of the concentration of
brGDGTs along the soil transects was not obvious.
BIT
BIT index values ranged from 0.57 to 1.00 among land
use types (Fig. 3b), with an average value of 0.96 ± 0.03
0.38 ± 0.01
0.46 ± 0.02
0.48 ± 0.04
0.50 ± 0.12
0.46 ± 0.04
0.48 ± 0.04
0.50 ± 0.02
in woodland, 0.90 ± 0.12 in ley, 0.88 ± 0.14 in grassland,
MBT5ME
and 0.83 ± 0.09 in arable land (without significant differ-
0
ences, p > 0.05). However, the BIT values increased from
hillslope to downslope along several transects in the north
catchment, while the BIT values show no clear trends in the
45.4 ± 13.0
28.9 ± 0.7
30.1 ± 4.5
39.7 ± 4.9
37.8 ± 3.7
39.8 ± 4.0
40.1 ± 3.1
south catchment (Fig. A1a in Appendix A). The MBT05ME
%tetra
ranged from 0.37 to 0.71 and was mostly similar between
all land use types (0.48 ± 0.04; p > 0.05; Fig. 3c; Table 1).
The degree of cyclization between land use types was similar
50.2 ± 1.8
45.0 ± 0.7
49.4 ± 3.0
44.4 ± 8.3
50.2 ± 2.0
49.4 ± 2.3
49.7 ± 1.5
(DC = 0.23 ± 0.13; Fig. 3d; Table 1; p > 0.05); likewise, the
%penta
IR ranged from 0.10 to 0.60 (0.28±0.01 on average; Fig. 3e;
Table 1; p > 0.05), without a clear trend along the soil tran-
sects. However, four transects in the north catchment have on
21.0 ± 1.4
24.9 ± 4.7
10.9 ± 2.6
10.3 ± 4.8
12.0 ± 2.9
10.8 ± 2.1
10.2 ± 1.8
average significantly higher IR values (> 0.36) than the other
%hexa
transects in the catchment (0.24 ± 0.09; p < 0.05; Fig. A1b).
In general, the IR increases with increasing soil pH in the
catchment (r 2 = 0.36, p < 0.001).
0.32 ± 0.08
0.23 ± 0.02
0.23 ± 0.13
0.22 ± 0.12
0.23 ± 0.14
0.21 ± 0.14
0.25 ± 0.11
3.2 BrGDGTs in creek bed sediments
DC
All brGDGT compounds were detected in creek bed sed-
iments, except for in the site upstream from the north
0.32 ± 0.01
0.48 ± 0.10
0.28 ± 0.11
0.19 ± 0.05
0.27 ± 0.13
0.26 ± 0.12
0.31 ± 0.10
catchment, where brGDGT–IIIc0 was below the detection
limit. The brGDGTs in creek bed sediments were dom-
inated by pentamethylated brGDGTs (45.0 ± 0.7 %), fol-
IR
lowed by tetramethylated brGDGTs (30.1 ± 4.5 %) and hex-
amethylated brGDGTs (24.9 ± 4.7 %) (Table 1). The C-
normalized concentration of brGDGTs in creek bed sed-
Biogeosciences, 17, 3183–3201, 2020 https://doi.org/10.5194/bg-17-3183-2020J. Guo et al.: Tetraether lipids as tracers of soil organic carbon 3189
Figure 3. Box plots displaying (a) the C-normalized concentration of brGDGTs and brGDGT-based proxies, (b) BIT index (branched
and isoprenoid tetraether ratio), (c) MBT05ME (methylation of 5-methyl branched tetraethers), (d) DC (degree of cyclization), and (e) IR
(isomerization ratio). The triangles represent the average values, the bold line indicates the median (50th percentile), the bottom and top of
the box indicate first quartile (25th percentile) and third quartile (75th percentile) respectively, and whiskers cover the smallest and largest
value within 1.5 times of the interquartile range (i.e. the distance between the top and bottom of the box). Any data points outside the
whiskers are considered as outliers. Different letters indicate differences between samples: A and B for differences between catchment soils
and aquatic sediments, a and b for soils under different vegetation types, and m and n for creek bed and lake core sediments (p < 0.05).
iments was 34.7 ± 17.4 µg g−1 C on average (Fig. 3a; Ta- 3.3 BrGDGTs in the Loe Pool sediment core
ble 1), where the concentration increased from 32.7 to
57.0 µg g−1 C downstream in the north catchment, and from
14.3 to 25.2 µg g−1 C downstream in the south catchment, All brGDGTs were detected in the lake sediment core, except
reaching a maximum value of 59.3 µg g−1 C at the outlet at 20 cm depth, where brGDGT–IIIc0 was below the detec-
(Fig. 5a). The concentration of brGDGTs in creek bed sedi- tion limit. The brGDGTs in the lake sediments were mainly
ments was higher than that in soils under any land use types, dominated by pentamethylated brGDGTs (50.2±1.8 %), fol-
except for woodland (9.6 ± 4.9 µg g−1 C; Fig. 3a; Table 1). lowed by tetramethylated brGDGTs (28.9 ± 0.7 %) and hex-
The BIT values for creek sediments were on average amethylated brGDGTs (21.0 ± 1.4 %; Table 1). The amount
0.90 ± 0.06 (Fig. 3b; Table 1). The MBT05ME was relatively of brGDGTs in lake core sediments ranged from 19.9 to
constant between 0.44 and 0.49, with an average of 0.46 ± 48.0 µg g−1 C (Fig. 3a; Table 1). The brGDGT concentra-
0.02. The DC ranged from 0.21 to 0.25 in the creek sedi- tion in the surface sediment (0–2 cm), of 37.7 µg g−1 C,
ments with an average of 0.23 ± 0.02 (Fig. 3e; Table 1). The which was about 1.6 times lower than that in the creek
IR was relatively invariable with an average of 0.48 ± 0.10 sediment at the outlet (Fig. 5a), increased to a maximum
(Fig. 3e; Table 1). The brGDGT-based proxies for creek bed of 48.0 µg g−1 C at around 11 cm depth and then decreased
sediments were similar to those for soils, except for the IR, to a minimum of 19.9 µg g−1 C at 23 cm depth (Fig. 6b).
which was higher than that in soils under any land use types The concentration of GDGT-0 ranged between 9.0 µg g−1 C
(0.28 ± 0.11; Fig. 3; Table 1). and 27.1 µg g−1 C with an average of 17.4 ± 6.0 µg g−1 C,
and the concentration of crenarchaeol ranged from 0.6 to
1.4 µg g−1 C with an average of 1.0±0.2 µg g−1 C in the lake
sediment core. In general, the concentration of brGDGTs in
the lake core (34.0 ± 8.7 µg g−1 C; Table 1) was similar to
https://doi.org/10.5194/bg-17-3183-2020 Biogeosciences, 17, 3183–3201, 20203190 J. Guo et al.: Tetraether lipids as tracers of soil organic carbon
that in rivers and in woodlands, while it was significantly vegetation cover does exert a great influence on brGDGT sig-
higher than the brGDGTs in soils except for the woodland natures in soils from Minnesota and Ohio, USA (Weijers et
(9.6 ± 4.9 µg g−1 C; p < 0.05; Fig. 3a; Table 1). al., 2011); around Lake Rotsee, Switzerland (Naeher et al.,
The BIT values for the lake sediment core were rather uni- 2014); in the Tibetan Plateau (Liang et al., 2019); and paddy
form, varying between 0.95 and 0.97 (Fig. 3b). Similarly, the and upland soils from subtropical (China and Italy) and trop-
values of MBT05ME along the lake core ranged only between ical (Indonesia, Philippines and Vietnam) areas (Mueller-
0.36 and 0.39. The MBT05ME of 0.37 for the lake surface Niggemann et al., 2016). The explanations for the similar
sediment was significantly lower than that in creek bed sedi- distribution of brGDGTs under different land use types in
ments (0.46 ± 0.02; p < 0.05; Figs. 3c; 5b). Conversely, the the Carminowe Creek catchment could be the rotation and
DC in the lake surface sediment was 0.39, which was signif- ploughing in land use in combination with the turnover time
icantly higher than that in creek bed sediments (0.23 ± 0.02; of brGDGTs. Although the soil bacterial community com-
p < 0.05; Figs. 3d; 5b). The average value of DC for the lake position is generally different across distinct land use types
core sediments was 0.32 ± 0.08. The DC increased from the (Fierer and Jackson, 2006; Steenwerth et al., 2003), the reg-
surface to a maximum value (0.44) at around 10 cm depth ular rotation (generally less than 5 years) of arable land and
and then decreased with slight fluctuations to 0.22 at 43 cm temporary grassland (ley) in the catchment (Glendell et al.,
depth (Fig. 6c). The IR was constant downcore (0.32 ± 0.01 2018) may create a mixed bacterial community under all
on average; Fig. 3e; Table 1) and was significantly lower than vegetation types. Beyond vegetation, regular ploughing as
that in creek bed sediments (p < 0.05; Fig. 3e). applied across the Carminowe catchment soils (arable land
and ley) is recognized to have a more dominant, long-lasting
effect on microbial communities (Drenovsky et al., 2010).
4 Discussion Moreover, brGDGTs in terrestrial environments have a rel-
atively long turnover time (ca. 18 years in soils, Weijers et
4.1 Spatial variation of brGDGT signals in catchment al., 2010; and up to 40 years in peat, Huguet et al., 2017), es-
soils pecially when compared to the cropland rotation time. Taken
together, these factors may contribute to the relatively similar
Spatial variations in the relative distribution of brGDGTs in brGDGT signal in all soils in the Carminowe catchment, fur-
all catchment soils were first evaluated by performing prin- ther limiting the variation in brGDGT signals in catchment
cipal component analysis (PCA) using the fractional abun- soils.
dances of the 13 major brGDGTs detected. The first two Some spatial trends are visible in spite of the overall com-
principal components (PCs) explain 65.2 % of the variance in parable brGDGT signals across the catchment (Fig. A1),
the dataset. PC1 describes 49.5 % of the variance and sepa- which may be explained by variations in other environmental
rates acyclic brGDGT–Ia and brGDGT–IIa from all the other factors than land use or vegetation. Mean air temperature and
brGDGTs (Fig. 4a). In line with this observation, PC1 has soil pH have been shown to be the main factors controlling
a strong positive relationship with the degree of cyclization the distribution of brGDGTs in soils worldwide (Weijers et
of brGDGTs in the soils (r 2 = 0.97; Fig. 4c). PC2 describes al., 2007a; Peterse et al., 2012; De Jonge et al., 2014b). How-
another 15.7 % of the variance and separates tetramethy- ever, in the small (ca. 4.8 km2 ) Carminowe Creek catchment,
lated brGDGTs as well as most of the 6-methyl brGDGTs the annual mean air temperature is practically the same for
from the majority of the 5-methyl penta- and hexamethylated all soils. Similarly, the range in soil pH is relatively small
brGDGTs. As a result, PC2 is negatively correlated with among different land use types (from 5.4 ± 0.3 in wood-
MBT05ME (r 2 = 0.49; Fig. 4d) as well as the IR (r 2 = 0.58; land to 6.6 ± 0.1 in arable land; Table 1), which makes it
Fig. 4e) in soils. Despite the clear relation of the first two PCs difficult to separate brGDGT signals based on these param-
with the degree of cyclization and the degree of methylation, eters. Additionally, the soil water content (SWC) has been
respectively, the position of the soils in the PCA diagram shown to affect the distribution and abundance of brGDGTs
reveals that different land use types are largely overlapping in soils, either directly by changing the microbial commu-
(Fig. 4b). Indeed, the brGDGT proxies for different land use nity or indirectly by altering soil temperature, soil pH, or
types are not significantly different (p > 0.05; Fig. 3), mak- soil oxygen content (Dirghangi et al., 2013; Menges et al.,
ing it difficult to distinguish the provenance of soil OC solely 2014; Dang et al., 2016). The SWC is positively correlated
based on brGDGT signatures. with the abundance of brGDGTs in soils from the Qinghai–
Indeed, previous work has also shown that brGDGT dis- Tibetan Plateau (Wang et al., 2013), as well as in soils along
tributions are not primarily affected by land use. For exam- an aridity transect in the USA (Dirghangi et al., 2013). More-
ple, brGDGTs in soils along an altitudinal transect in the over, the degree of methylation of 6-methylated brGDGTs
Ethiopian highlands revealed that brGDGTs mainly reflect is sensitive to the SWC, especially in semi-arid and arid re-
the decrease in temperature with increasing elevation, re- gions (Dang et al., 2016). Although MAP is also the same
gardless of drastic changes in land use along the transect for the whole catchment, the subtle altitudinal differences in
(Jaeschke et al., 2018). However, other studies report that this small creek catchment (i.e. 0–80 m a.s.l.) may result in
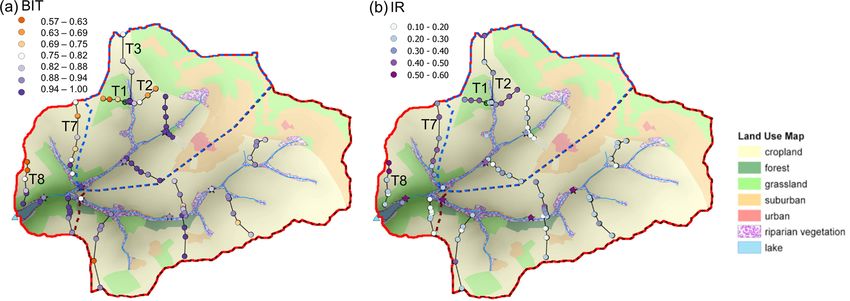
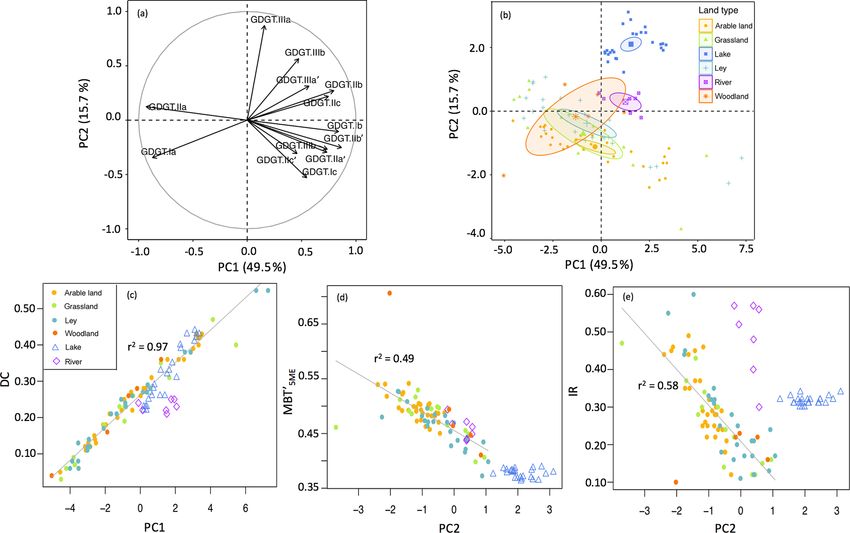
Biogeosciences, 17, 3183–3201, 2020 https://doi.org/10.5194/bg-17-3183-2020J. Guo et al.: Tetraether lipids as tracers of soil organic carbon 3191 Figure 4. PCA based on the relative abundances of 13 major brGDGTs. Panel (a) shows the distribution of 13 brGDGTs (brGDGT-IIIc and brGDGT-IIIc’ are excluded as they are below the detection limit) along the first two PCs, roman numerals and letters represent the compounds shown in Fig. 1. Panel (b) shows sampling site loading scores on the first two PCs and 95 % confidence interval ellipses surrounding the mean point of different groups of land use: arable land (n = 31), grassland (n = 14), ley (n = 24), woodland (n = 5), creek (n = 7), and lake (n = 25). Panel (c) shows cross plots between PC1 and DC (degree of cyclization). Panels (d) and (e) show cross plots of PC2 with MBT05ME (methylation of 5-methyl branched tetraethers) and IR (isomerization ratio) respectively. The linear correlation was calculated excluding creek and lake sediments. an increase in SWC from hilltop to downslope. This would theless, these trends in the BIT index are visible in five of the introduce just enough variability in SWC to explain some of transects and only occur in the north part of the catchment. the trends in brGDGT signals along hillslope transects. In Interestingly, the IR is also significantly higher in soils the north catchment, the BIT index values gradually increase along four transects in the north catchment (all > 0.36 on from the presumably better aerated soils at the hilltops to- average for Transects 1, 2, 7, and 8) compared to the average wards the wetter soils closer to the creek (Fig. A1a). The IR value for the rest of the transects in the entire catchment increase is > 0.3 for Transects 1 and 8, but Transects 2, 3, (0.24±0.09; p < 0.05). The majority of the sites with higher and 7 also show an increase in BIT values downslope, albeit IR are in cropland, except for those in Transect 1, which is to a smaller degree (0.17, 0.19, and 0.04, respectively; Ta- under grassland (Fig. A1b). Although a relative increase in ble A1 in Appendix A). The change in BIT index values is 6-methyl brGDGTs has been linked to higher soil pH in the driven by both an increase in the amount of brGDGTs and a global soil dataset (De Jonge et al., 2014b), this relation is slight decrease in crenarchaeol concentrations with the pre- not so strong in the soils from the Carminowe creek catch- sumed increase in SWC downslope, similar to previous find- ment (r 2 = 0.36, p < 0.001), likely due to the relatively mi- ings (Dirghangi et al., 2013; Wang et al., 2013; Menges et nor range and variation in soil pH (from 5.4±0.3 to 6.6±0.1). al., 2014). The trend in BIT is likely enhanced by the (mi- Nevertheless, the soils with high IR values in the north catch- nor) change in soil pH along Transects 1 and 8 (from 6.2 to ment also have pH values > 6.0 with an average value of 6.1 along Transect 1 and from 6.6 to 5.7 along Transect 8), 6.6 ± 0.1. which may influence the BIT index as a result of the gen- erally positive relation of crenarchaeol concentrations and a negative relation of brGDGT concentrations with increasing soil pH (Weijers et al., 2006b; Peterse et al., 2010). Never- https://doi.org/10.5194/bg-17-3183-2020 Biogeosciences, 17, 3183–3201, 2020
3192 J. Guo et al.: Tetraether lipids as tracers of soil organic carbon
4.2 Tracing brGDGTs from soils to creek bed iments (IRcreek = 0.47) and the following equation (Eq. 8).
sediments
[6-mecreek ]
IRcreek =
Based on the similar brGDGT signatures for soils under dif- [5-mecreek ] + [6-mecreek ]
ferent land use types, these compounds cannot be used to [6-mewoodland ] + [6-mein situ ]
= (8)
trace back the exact source of the soil OC after mobiliza- [5-mecreek ] + [6-mewoodland ] + [6-mein situ ]
tion and transport throughout the catchment. However, the Solving this equation results in a minimum amount of
concentration and general soil signature of the brGDGTs 7.4 µg g−1 C 6-methyl brGDGTs that needs to be addition-
can be compared with those in creek bed sediments to trace ally produced in the creek to reach the higher IR. This ac-
the transfer of OC from the soils into the creeks. The C- counts for 65 % of the total amount of 6-methyl brGDGTs
normalized concentration of brGDGTs in the creek sedi- in the creek bed sediment that we measured. Considering a
ments is higher than that in most of the soils (34.7 ± 17.4 mixture of all soils rather than only woodland as the source
and 9.6 ± 4.9 µg g−1 C respectively), except for those in the of soil-derived brGDGTs in the creek results in the in situ
woodland soils at the riverbanks (37.6 ± 11.0 µg g−1 C; Ta- production of 9.3 µg g−1 C 6-methyl brGDGTs, correspond-
ble 1). Thus, purely based on the concentration, this sug- ing to 81 % of the 6-methyl brGDGT pool in the creek bed
gests that brGDGTs in the creek would be primarily de- sediments. This implies that the initial soil brGDGT signal
rived from the woodland, which also appeared to be the is rapidly overprinted by a riverine in situ signal upon en-
main source of n-alkanes in creek bed sediments (Glendell tering the creek. Only the IR for the downstream site in the
et al., 2018). However, when looking at the relative distri- northern creek approaches that of the adjacent soil (IR = 0.30
bution of the brGDGTs, the percentage of hexamethylated in the creek bed sediment and 0.38 ± 0.07 for Transect 7;
brGDGTs in creek sediments is higher than that in soils Fig. A1b) and may be explained by its use as arable land
(24.9 ± 1.8 % and 10.9 ± 0.3 %, respectively), whereas the (Fig. 5a), which involves regular ploughing and subsequent
percentage of tetramethylated brGDGTs is lower than that in soil mobilization and implies a temporary, local overprint.
soils (30.1 ± 1.7 % and 39.7 ± 0.6 %, respectively; Table 1). The absence of a clearly recognizable soil brGDGT sig-
Furthermore, brGDGTs in creek sediments have a signifi- nal in the creek bed sediments may be further explained by
cantly higher IR (i.e. 0.48 ± 0.04) than soils under any of the relatively limited input of soil material into the creek. So
the land use types (0.28 ± 0.01 on average in the catchment; far, river systems that have been shown to transport a soil-
p < 0.05; Fig. 3e; Table 1). This is clearly reflected in the derived brGDGT signal are either characterized by a distinct
PCA, which separates the creek sediments from both the soils rainy season (e.g. the Congo River, Weijers et al., 2007b;
and lake sediments on PC2 that is associated with the IR Hemingway et al., 2017; or the Amazon River, Kim et al.,
(Fig. 4e). The higher IR in the creek bed sediments can be 2012), or have experienced a recent episode of extreme rain-
explained by a contribution of aquatically (i.e. in situ) pro- fall (e.g. the Danube River, > 100 mm in 3 d causing a 100-
duced 6-methyl brGDGTs. Similar contributions of 6-methyl year flood event, Freymond et al., 2017; or the Rhône River,
brGDGTs, and thus higher IR, were also observed in sus- with heavy rainfall during sampling; Kim et al., 2015). The
pended particulate matter from the Yenisei River (De Jonge Carminowe creek area does not have a clear rainy season and
et al., 2014a), and upstream of the Iron Gates in the Danube is further characterized by its limited relief. Hence, the rela-
River, where the higher IR was coupled to in-river produc- tively minor input of soil-derived brGDGTs seems to be eas-
tion facilitated by the lower flow velocity and decreased tur- ily overprinted by riverine in situ production. Alternatively,
bidity of the river water (Freymond et al., 2017). Hence, the the soil-derived brGDGTs could be preferentially degraded
significantly higher IR in combination with the higher C- in an aquatic environment as a result of the priming effect
normalized concentrations of brGDGTs in the Carminowe (Bianchi, 2011), which would lead to a signature that is dom-
creek sediments suggests that the brGDGT signal is mainly inated by brGDGTs that are produced in situ.
aquatic.
In an attempt to further prove the riverine in situ produc- 4.3 Sources of brGDGTs in the sediments of Loe Pool
tion of brGDGTs, we roughly estimate the minimum amount
of 6-methyl brGDGTs that needs to be produced in the creek In theory, rivers would transport soil-derived OC together
in order to reach the higher IR. We hereby assume that the with any aquatic OC produced along the way. Once dis-
brGDGTs derived from woodland soils are completely trans- charged, in this case into a lake, the OC would settle and then
ferred into the creek without any degradation. Thus, the con- be buried into the sediments where it would act as a long-
centration of 6-methyl brGDGTs in the creek sediments [6- term sink of OC. However, the soil brGDGT signal cannot
mecreek ] resembles the sum of the average concentration of 6- be recognized in the sediments from Loe Pool since it is al-
methyl brGDGTs in woodland soils [6-mewoodland ] and those ready lost upon entering Carminowe creek. Indeed, the PCA
produced in situ [6-mein situ ]. The minimum amount of 6- of the relative distributions of brGDGTs indicates that lake
methyl brGDGTs produced in situ can then be calculated sediments plot completely separately from both the soils and
using the brGDGT-concentration-weighted IR for creek sed- creek sediments, mostly due to a higher relative abundance
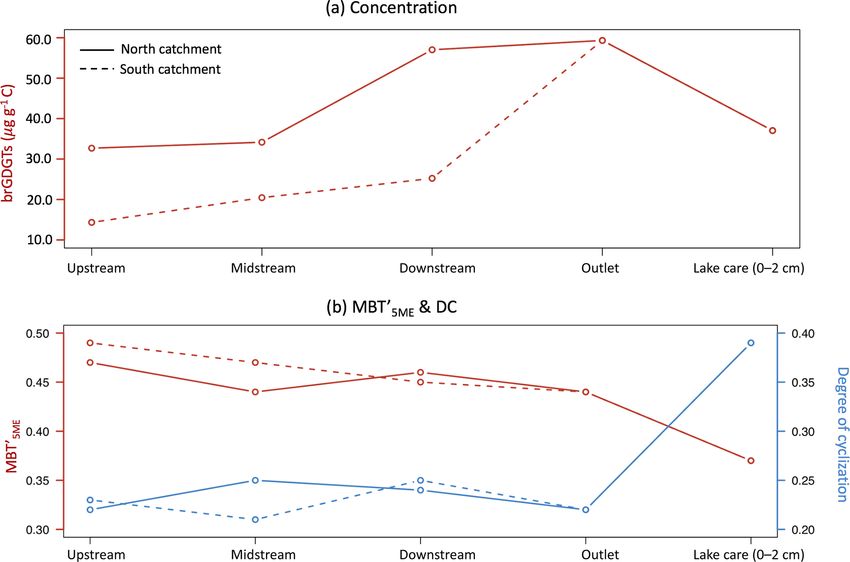
Biogeosciences, 17, 3183–3201, 2020 https://doi.org/10.5194/bg-17-3183-2020J. Guo et al.: Tetraether lipids as tracers of soil organic carbon 3193 Figure 5. Spatial variability of (a) C-normalized concentration of brGDGTs and (b) MBT05ME (methylation of 5-methyl branched tetraethers) and DC (degree of cyclization) in the downstream direction of both substreams in the Carminowe Creek catchment. of GDGT–IIIa (Fig. 4a, b). As a result, the MBT05ME is sig- contribution of GDGT–IIIa mainly consists of brGDGT– nificantly lower in Loe Pool sediments (0.38 ± 0.00) com- IIIa0 (Russell et al., 2018), which is less prominent in Loe pared to in the creek bed sediments (0.46 ± 0.01; p < 0.05) Pool. Although the identity of the brGDGT-producer(s) in and soils (0.48 ± 0.01; p < 0.05; Fig. 5b; Table 1). Further- lakes still remains elusive, a recent study from the stratified more, the DC is significantly higher in lake sediments than in Lake Lugano (Switzerland) showed that the majority of the both soil and creek bed sediments (0.32 ± 0.02, 0.23 ± 0.01, brGDGTs are produced in the lower, anoxic part of the water and 0.23 ± 0.01, respectively; p < 0.05; Fig. 3d; Table 1). column rather than in the sediment (Weber et al., 2018). Fur- The distinct brGDGT signature of the lake sediments sug- thermore, the combination of brGDGT analysis with molec- gests that brGDGTs in the lake are again significantly altered ular biological methods revealed that brGDGTs appeared compared to those in the soils and creek sediments. This im- to be produced by multiple groups of bacteria thriving un- plies that the riverine brGDGT signal is either replaced or der different redox regimes in this stratified lake. Specifi- overwritten in the lake. cally, brGDGT–IIIa occurred in the entire water column and Lacustrine in situ production of brGDGTs has been re- continuously increased with depth, whereas brGDGT–IIIa0 ported in other studies (Sinninghe Damsté et al., 2009; Tier- was mainly produced in the upper, oxygenated part of wa- ney and Russell, 2009; Buckles et al., 2014; Loomis et al., ter column (Weber et al., 2018). Extrapolating the ecolog- 2011, 2014; Weber et al., 2015, 2018; Miller et al., 2018). ical niches of brGDGT production in Lake Lugano to Loe However, there are no generally recognized indicators (yet) Pool we can speculate that brGDGT-IIIa, which is dominat- to identify lacustrine brGDGT production, although several ing the brGDGT signal in the Loe Pool sediments, is mostly studies reported a “cold bias” while attempting to recon- produced in the lake during summer, when the eutrophic struct the mean air temperature (MAT) based on brGDGTs state of the lake may seasonally cause the anoxic conditions in lake sediments using a soil-based transfer function (Tier- favourable for its (i.e. brGDGT-IIIa) production. However, ney et al., 2010). In a study on East African lakes, this cold our dataset does not allow us to further pinpoint the time bias was linked to a large in situ contribution of brGDGT– and depth of lacustrine brGDGT production or to determine IIIa (Tierney et al., 2010), similar to in Loe Pool. However, whether brGDGTs are solely produced in the water column the East African lake dataset was generated using the “old” of Loe Pool or also in the lake sediment. chromatography method that does not separate 5-methyl and 6-methyl brGDGTs. A recent study that has re-analysed the East African lake dataset indicates that the presumed https://doi.org/10.5194/bg-17-3183-2020 Biogeosciences, 17, 3183–3201, 2020
3194                                                            J. Guo et al.: Tetraether lipids as tracers of soil organic carbon

Figure 6. Lake sediment core profiles of (a) 137 Cs to date, (b) C-normalized concentration of brGDGTs, (c) DC (degree of cyclization) and
(d) ratio between GDGT-0 and crenarchaeol. The red dashed line indicates the year of 1963.

4.4    Reconstructing local environmental changes based                high brGDGT concentrations and DC in the sediments likely
       on GDGTs in Loe Pool lake sediments                             reflect the eutrophic conditions of the lake resulting from
                                                                       the increased nutrient input to the lake (Coard et al., 1983).
Downcore variations in the brGDGT distribution of Loe Pool             The DC then recorded the increase in lake water pH associ-
sediments may provide information on past environmental                ated with eutrophication, whereas brGDGT concentrations
changes in the catchment, in spite of the lacustrine in situ           express increased aquatic production. Due to remediation
production in Loe Pool. The 50 cm deep sediment core cov-              measures taken by the local government in 1996 (∼ 12 cm
ers about the last 100 years based on 137 Cs activity (Glendell        depth), the eutrophication has reduced over the past 20 years
et al., 2018). The peak activity, correlated with bomb testing         (Glendell et al., 2018). The partial recovery of the lake has
in the 1960s, was detected at 26 cm depth (Fig. 6a), which             likely resulted in a return to lower lake water pH, as mani-
can thus be linked to 1963 (Glendell et al., 2018).                    fested in the decrease in the DC from ∼ 10 cm depth upwards
   The C-normalized concentration of brGDGTs starts to in-             (Fig. 6c).
crease at around 23 cm, reaching a maximum concentration                  The process of eutrophication and subsequent recovery
of 48.0 µg g−1 C at 11 cm depth (Fig. 6b). The increased               can also be recognized in the ratio between GDGT–0 and
brGDGT concentrations coincide with an increase in the de-             crenarchaeol, which are isoprenoidal GDGTs produced by
gree of cyclization (Fig. 6c), which generally responds to             Archaea. Crenarchaeol is produced by ammonia oxidizing
a change in pH, where more cyclopentane moieties corre-                Thaumarchaeota (Sinninghe Damsté et al., 2002) in aquatic
spond to a higher pH (Weijers et al., 2007a; Schoon et al.,            environments (Schouten et al., 2000; Powers et al., 2004) and
2013). According to historical records, agriculture and an-            to a lesser extent also in soils (Weijers et al., 2006a), whereas
thropogenic perturbations such as mining and urban pol-                GDGT–0 is a membrane lipid that occurs in all major groups
lution intensified in the 1960s (∼ 26 cm depth), which in-             of Archaea but is indicative of methanogens and thus anaer-
creased the input of soil and nutrients into Loe Pool (Coard           obic conditions, with a typical ratio of GDGT-0 to crenar-
et al., 1983) and resulted in eutrophication (i.e. blooms of           chaeol of > 2 (Blaga et al., 2009). The ratio of GDGT-0 to
cyanobacteria and algae) since at least 1986 (∼ 23 cm depth)           crenarchaeol in the sediments of Loe Pool is > 2 throughout
(O’Sullivan, 1992; Flory and Hawley, 1994). Earlier stud-              the entire core, and ranges between 10.9 and 24.3, indicating
ies have also recognized an increased use of farmyard ma-              that at least the bottom waters of the lake have been (sea-
nures and septic tanks at this time in the nitrogen isotopic           sonally) anoxic over the past 100 years (Fig. 6d), although
composition of the lake sediments and have detected higher             the isoGDGTs may potentially be produced in deeper sedi-
inputs of terrestrial organic material resulting from intensi-         ments. The ratio reaches its maximum at 16 cm depth, sug-
fied farming practices and a higher erosion rate during the            gesting that eutrophic conditions and bottom water anoxia
1960s to 1980s based on ratios of aquatically and terrestri-           were most severe around this time. The recovery of the lake
ally derived plant waxes (Glendell et al., 2018). Thus, the

Biogeosciences, 17, 3183–3201, 2020                                                        https://doi.org/10.5194/bg-17-3183-2020
J. Guo et al.: Tetraether lipids as tracers of soil organic carbon 3195 after the remediation measures is again reflected in the return to pre-1960 values at ∼ 10 cm depth (Fig. 6d). 5 Conclusions In this study, brGDGTs were tested as a tracer for the trans- port of soil OC from different vegetation and land use types from source (soil) to sink (Loe Pool) in the Carminowe Creek catchment with the aim of reconstructing the provenance of the soil OC in Loe Pool sediments over time. Unfortunately, brGDGT signatures in the catchment soils are not distinct for land use types, indicating that other environmental parame- ters have a larger influence on the distribution of brGDGTs in these soils. Although temperature and precipitation can be considered equal for all soils due to the small size of the catchment, changes in BIT index values and the relative con- tribution of 6-methyl brGDGTs along a part of the hilltop transects indicate that SWC may exert a control on brGDGT signals, assuming that SWC increases downslope. The regu- lar rotation of cropland in this catchment and the relative long turnover time of brGDGTs in soils could be another reason to explain the limited spatial variation in brGDGT signals. Comparison of the soil-derived brGDGT signals to that of creek bed sediments reveals that the soil brGDGT sig- nal is almost completely overprinted by aquatically pro- duced brGDGTs, indicated by a substantially higher frac- tional abundance of 6-methyl brGDGTs in the creek. Upon discharge into the lake, the creek brGDGT signal is replaced by and/or mixed with a lacustrine in situ-produced brGDGT signal, which is characterized by a relatively higher DC and lower MBT05ME , as well as a specifically high fractional abundance of brGDGT-IIIa. Despite regular ploughing of the land, the absence of a profound rainy season and limited re- lief likely limits the degree of soil mobilization necessary to transfer the soil-derived brGDGT signal to the lake sed- iments in the modern system. Still, downcore variations in GDGT distributions in the sediments of Loe Pool do reflect local environmental conditions over the past 100 years. The degree of cyclization of brGDGTs as well as the ratio of iso- prenoidal GDGT-0 and crenarchaeol produced by Archaea trace the historical record of lake eutrophication induced by increased nutrient input from intensified agricultural activ- ity in the catchment during the 1960s to 1980s, and its re- covery after measures taken by the owner since 1996. Our study shows that GDGTs in sedimentary archives are good recorders of past environmental and land management (e.g. agricultural intensification, increased fertilizer use) change, although the ability of brGDGTs to trace soil OC along a soil–aquatic continuum requires a higher degree of soil mo- bilization. https://doi.org/10.5194/bg-17-3183-2020 Biogeosciences, 17, 3183–3201, 2020
3196                                                                J. Guo et al.: Tetraether lipids as tracers of soil organic carbon

Appendix A

Table A1. BIT values along 14 transects (Tx indicates the transect number, and Sx indicates the sample point, where 1 represents the hilltop
and subsequent numbers are further downslope). Transects with a clear increase in BIT from hilltop to downslope are indicated in bold
(> 0.3) or italic (> 0.1).

                      BIT                           North catchment                                         South catchment
                               T1      T2      T3      T4      T5      T6      T7      T8      T9     T10     T11     T12     T13    T14
         Hilltop      S1     0.65    0.66    0.77     0.97   0.99     0.97   0.77    0.58    0.92    0.92     0.84   0.95     0.84   0.86
                      S2     0.57    0.66    0.86     0.99   0.99     0.93   0.65    0.59    0.91    0.63        –      –     0.73   0.88
                      S3     0.73    0.77    0.87     1.00   1.00     0.94   0.82    0.80    0.98    0.90     0.92   0.98     0.91   0.88
                      S4     0.88    0.83    0.96     0.99      –     0.96   0.70    0.85    1.00    0.92     0.72   0.98     0.92   0.86
                      S5     0.95       –       –        –      –     0.97   0.76    0.98    1.00    0.91     0.91   1.00     0.91   0.93
                      S6        –       –       –        –      –     0.96   0.94    0.97    1.00    0.93     0.85      –     0.90      –
                      S7        –       –       –        –      –        –   0.81       –    0.95       –     0.92      –        –      –
       Downslope      S8        –       –       –        –      –        –      –       –       –       –     0.92      –        –      –

Figure A1. Spatial variability of the (a) BIT (branched and isoprenoid tetraether ratio) and (b) IR (isomerization ratio) along 14 soil transects
in the Carminowe Creek catchment. The coloured circles show the concentrations and proxy values. Tx indicates soil transects discussed in
the text. The background colours indicate different land use types. Adjusted from Glendell et al. (2018).

Biogeosciences, 17, 3183–3201, 2020                                                             https://doi.org/10.5194/bg-17-3183-2020
J. Guo et al.: Tetraether lipids as tracers of soil organic carbon 3197
Data availability. All data are available in the Supplement or at along a north–south transect, J. Paleolimnol., 41, 523–540,
https://doi.org/10.1594/PANGAEA.918523 (Guo et al., 2020). https://doi.org/10.1007/s10933-008-9242-2, 2009.
Blair, N. E., Leithold, E. L., and Aller, R. C.: From bedrock to
burial: the evolution of particulate organic carbon across coupled
Supplement. The supplement related to this article is available on- watershed-continental margin systems, Mar. Chem., 92, 141–
line at: https://doi.org/10.5194/bg-17-3183-2020-supplement. 156, https://doi.org/10.1016/j.marchem.2004.06.023, 2004.
Brassell, S. C. and Eglinton, G.: Molecular geochemical indicators
in sediments, in: Organic Marine Geochemistry ACS Sympo-
Author contributions. JM, FK, and FP designed the study. MG and sium Series 305, edited by: Sohn, M. L., 10–32, American Chem-
JM collected the sample material. JG conducted the biomarker anal- ical Society, Washington, 1986.
ysis and interpreted the data under supervision of FP and JJM. JG Buckles, L. K., Weijers, J. W. H., Tran, X.-M., Waldron, S.,
and FP wrote the paper with input from all co-authors. and Sinninghe Damsté, J. S.: Provenance of tetraether mem-
brane lipids in a large temperate lake (Loch Lomond, UK):
implications for glycerol dialkyl glycerol tetraether (GDGT)-
based palaeothermometry, Biogeosciences, 11, 5539–5563,
Competing interests. The authors declare that they have no conflict
https://doi.org/10.5194/bg-11-5539-2014, 2014.
of interest.
Coard, M. A., Cousen, S. M., Cuttler, A. H., Dean, H. J., Dearing,
J. A., Eglinton, T. I., Greaves, A. M., Lacey, K. P., O’Sullivan,
P. E., Pickering, D. A., Rhead, M. M., Rodwell, J. K., and
Acknowledgements. Desmond Eefting and Klaas Nierop (UU) are Simola, H.: Paleolimnological studies of annually-laminated sed-
acknowledged for technical support. Robert Sparkes, the two iments in Loe Pool, Cornwall, U.K., Hydrobiologia, 103, 185–
anonymous reviewers and associate editor Anja Engel are thanked 191, https://doi.org/10.1007/BF00028450, 1983.
for their comments, which helped to improve this paper. Cole, J. J., Prairie, Y. T., Caraco, N. F., McDowell, W. H., Tranvik,
L. J., Striegl, R. G., Duarte, C. M., Kortelainen, P., Downing, J.
A., Middelburg, J. J., and Melack, J.: Plumbing the global carbon
Financial support. This research has been supported by the NWO cycle: Integrating inland waters into the terrestrial carbon bud-
(Veni grant no. 863.13.016 and Vidi grant no. 192.074). get, Ecosystems, 10, 171–184, https://doi.org/10.1007/s10021-
006-9013-8, 2007.
Dang, X., Yang, H., Naafs, B. D. A., Pancost, R. D., and
Review statement. This paper was edited by Anja Engel and re- Xie, S.: Evidence of moisture control on the methylation
viewed by Robert Sparkes and two anonymous referees. of branched glycerol dialkyl glycerol tetraethers in semi-
arid and arid soils, Geochim. Cosmochim. Ac., 189, 24–36,
https://doi.org/10.1016/j.gca.2016.06.004, 2016.
Davidson, E. A. and Janssens, I. A.: Temperature sensitivity of soil
carbon decomposition and feedbacks to climate change, Nature,
References 440, 165–173, https://doi.org/10.1038/nature04514, 2006.
Dearing Crampton-Flood, E., Peterse, F., Munsterman, D., and Sin-
Aufdenkampe, A. K., Mayorga, E., Raymond, P. A., Melack, ninghe Damsté, J. S.: Using tetraether lipids archived in North
J. M., Doney, S. C., Alin, S. R., Aalto, R. E., and Yoo, Sea Basin sediments to extract North Western European Pliocene
K.: Riverine coupling of biogeochemical cycles between land, continental air temperatures, Earth Planet. Sc. Lett., 490, 193–
oceans, and atmosphere, Front. Ecol. Environ., 9, 53–60, 205, https://doi.org/10.1016/j.epsl.2018.03.030, 2018.
https://doi.org/10.1890/100014, 2011. De Jonge, C., Hopmans, E. C., Stadnitskaia, A., Rijpstra, W. I.
Battin, T. J., Luyssaert, S., Kaplan, L. A., Aufdenkampe, A. K., C., Hofland, R., Tegelaar, E., and Sinninghe Damsté, J. S.:
Richter, A., and Tranvik, L. J.: The boundless carbon cycle, Nat. Identification of novel penta- and hexamethylated branched
Geosci., 2, 598–600, https://doi.org/10.1038/ngeo618, 2009. glycerol dialkyl glycerol tetraethers in peat using HPLC–
Baxter, A. J., Hopmans, E. C., and Russell, J. M.: ScienceDirect MS2, GC–MS and GC–SMB-MS, Org. Geochem., 54, 78–82,
Bacterial GMGTs in East African lake sediments?: Their poten- https://doi.org/10.1016/j.orggeochem.2012.10.004, 2013.
tial as palaeotemperature indicators, Geochim. Cosmochim. Ac., De Jonge, C., Stadnitskaia, A., Hopmans, E. C., Cherkashov,
259, 155–169, https://doi.org/10.1016/j.gca.2019.05.039, 2019. G., Fedotov, A., and Sinninghe Damsté, J. S.: In situ pro-
Bianchi, T. S.: The role of terrestrially derived organic car- duced branched glycerol dialkyl glycerol tetraethers in sus-
bon in the coastal ocean: A changing paradigm and the pended particulate matter from the Yenisei River, East-
priming effect, P. Natl. Acad. Sci. USA, 108, 19473–19481, ern Siberia, Geochim. Cosmochim. Ac., 125, 476–491,
https://doi.org/10.1073/pnas.1017982108, 2011. https://doi.org/10.1016/j.gca.2013.10.031, 2014a.
Bianchi, T. S., Filley, T., Dria, K., and Hatcher, P. G.: Tempo- De Jonge, C., Hopmans, E. C., Zell, C. I., Kim, J.-H., Schouten,
ral variability in sources of dissolved organic carbon in the S., and Sinninghe Damsté, J. S.: Occurrence and abun-
lower Mississippi River, Geochim. Cosmochim. Ac., 68, 959– dance of 6-methyl branched glycerol dialkyl glycerol
967, https://doi.org/10.1016/j.gca.2003.07.011, 2004. tetraethers in soils: Implications for palaeoclimate re-
Blaga, C. I., Reichart, G. J., Heiri, O., and Sinninghe Damsté, J. construction, Geochim. Cosmochim. Ac., 141, 97–112,
S.: Tetraether membrane lipid distributions in water-column par- https://doi.org/10.1016/j.gca.2014.06.013, 2014b.
ticulate matter and sediments: A study of 47 European lakes
https://doi.org/10.5194/bg-17-3183-2020 Biogeosciences, 17, 3183–3201, 2020You can also read


