879 Vertical wind shear and convective storms - ECMWF
←
→
Page content transcription
If your browser does not render page correctly, please read the page content below
Technical
 Memo

 879
 al Memo Technical Memo Technical Memo Technical Memo Tech
 Vertical
 ical Memo wind Memo
 Technical shearTechnical
 and Memo Technical Memo Te
 hnicalconvective
 Memo Technical storms Memo Technical Memo Technical Memo T
 chnical Memo Technical Memo Technical Memo Technical Memo
Technical Memo Technical Memo Technical Memo Technical Mem
 Technical Memo Technical Memo Technical Memo Technical Me
mo Technical Memo Technical Memo Technical Memo Technical M
 mo Technical Memo Technical Memo Technical Memo Technical
MemoTomáš Technical Memo
 Púčik1, Pieter Technical
 Groenemeijer 1 Memo Technical Memo Technic
 2
 Memo Technical Memo Technical Memo Technical Memo Techn
 Ivan Tsonevsky
 1 European Severe Storms Laboratory (ESSL)

 al Memo
 2 ECMWF,Technical Memo Technical Memo Technical Memo Tech
 Forecast Department

 ical Memo Technical Memo Technical Memo Technical Memo Tec
 January 2021
hnical Memo Technical Memo Technical Memo Technical Memo T
 chnical Memo Technical Memo Technical Memo Technical Memo
 echnical Memo Technical Memo Technical Memo Technical Mem
 Technical Memo Technical Memo Technical Memo Technical Me
 o Technical Memo Technical Memo Technical Memo Technical M
 mo Technical Memo Technical Memo Technical Memo Technical
Memo Technical Memo Technical Memo Technical Memo Technica
 Memo Technical Memo Technical Memo Technical Memo Techni
 al Memo Technical Memo Technical Memo Technical Memo Tech
 cal Memo Technical Memo Technical Memo Technical Memo Tec
 nical Memo Technical Memo Technical Memo Technical Memo T
 chnical Memo Technical Memo Technical Memo Technical Memo
Series: ECMWF Technical Memoranda

A full list of ECMWF Publications can be found on our website under:
http://www.ecmwf.int/en/publications

Contact: library@ecmwf.int

© Copyright 2021

European Centre for Medium-Range Weather Forecasts, Shinfield Park, Reading, RG2 9AX, UK

Literary and scientific copyrights belong to ECMWF and are reserved in all countries. This publication
is not to be reprinted or translated in whole or in part without the written permission of the Director-
General. Appropriate non-commercial use will normally be granted under the condition that reference
is made to ECMWF.

The information within this publication is given in good faith and considered to be true, but ECMWF
accepts no liability for error or omission or for loss or damage arising from its use.
Vertical wind shear and convective storms

Abstract

 Convective storms develop in both strong and weak vertical wind shear but long-lived,
 well-organised convection requires strong vertical wind shear. Studies have shown that the
 relative frequency of occurrence of convective hazards such as large hail, severe wind gusts
 and tornadoes increases with increasing vertical wind shear. A particularly strong
 connection exists between shear and large hail, most pronounced for very large hailstones
 (≥ 5 cm), which form exclusively in supercells. Likewise, severe wind gusts become more
 likely with increasing vertical wind shear and with stronger mean flow in the lower
 troposphere. Tornadoes become more probable with increasing streamwise vorticity and
 storm-relative helicity near the ground. Excessive rainfall shows the weakest connection to
 the vertical wind shear. Deep-layer shear, typically measured over a 0–6 km layer, is often
 used to forecast the most likely convective archetypes (single cells, multicells, linear
 convection or supercells) in a given situation. Wind shear measured from the surface up to
 3 and 1 km AGL are useful for forecasting convective wind and tornado threats,
 respectively. For tornadoes, 0–1 km storm-relative helicity, which depends not only on
 speed shear but also on directional shear, is a better predictor for tornadoes than the 0–1
 km bulk shear. Numerous composite parameters that incorporate measures of vertical wind
 shear have been developed. The most robust of those is the product of CAPE (or its square
 root) and shear, that discriminates well between severe and non-severe convective storms
 and is one of the ECMWF’s Extreme Forecast Index parameters. Hodographs are an
 important tool for assessing vertical wind shear in different layers. Long, curved
 hodographs in the lower troposphere represent environments with high values of storm
 relative helicity conducive to supercells. Recent and ongoing research use environmental
 parameters, including measures of wind shear, as predictors in statistical models and neural
 networks to provide probabilistic forecasts of convective hazards. Interestingly, severe
 weather often happens along the edges of areas with favourable conditions. Another topic
 of research is the effect of wind shear on the dynamics and physics of storms, including
 hail growth and the development of damaging gusts, which is being studied intensively
 using convection-allowing models. Furthermore, recent studies into the predictability of
 convective storms as a function of wind shear conclude that the evolution and intensity of
 storms are least predictable when wind shear is weak.

1 Introduction
A convective storm requires three basic ingredients to form: 1) low-level moisture, 2) conditional
instability, and 3) lift (Johns and Doswell, 1992; Doswell et al. 1996). The combination of low-level
moisture and conditional instability renders an air-parcel buoyant during its ascent. Before the parcel is
able to accelerate freely upward from the Level of Free Convection (LFC) where it first becomes
positively buoyant, the third ingredient – a lifting mechanism – is required to ensure that the parcel
ascends to LFC.

Vertical wind shear, or the change of the horizontal wind vector with height, is not a requirement for a
convective storm. In fact, strong vertical wind shear can be a negative factor during storm initiation
(Markowski and Richardson, 2010). Wind shear enhances the entrainment of environmental air into an
initiating updraught, which reduces its buoyancy and coherence. Increasing updraught tilt also increases

Technical Memorandum No. 879 3
Vertical wind shear and convective storms

the vertical pressure perturbation gradient force that acts against the buoyancy force. Thus, all other
factors being equal, convective initiation is less likely with stronger shear than with weaker shear.
However, once a storm has initiated, vertical wind shear plays a different role and can increase its
severity and longevity.

The first speculations of the relevance of wind shear on severe weather can arguably be credited to
Wegener (1928) who noted that the formation of tornadoes would likely involve tilting of vortices
(Antonescu, 2016), corroborated by observations like those of Van Everdingen (1925) who noted
exceptionally strong winds measured by a kite at approximately 1500 m on the same day that a violent
tornado struck the eastern Netherlands.

Several studies in the 1950s, 1960s and 1970s recognized the influence of shear on the behaviour of
convective storms (Newton, 1960; Browning 1964) and the association of strong vertical wind shear
with severe weather, such as tornadoes, large hail, and severe wind gusts (Maddox, 1976). Chisholm
and Renick (1972) presented composite vertical wind profiles associated with three main thunderstorm
archetypes: single cells, multicells and supercells (Figure 1). Multicell storms are storms regenerated by
new updraught pulses, or storm cells, that are triggered on the flanks of older cells. Supercells are
persistent storms that exhibit updraught rotation, i.e. a mesocyclone, and very often produce severe
weather. Their understanding was that single cells form in weak vertical wind shear, whereas stronger
shear was associated with multi- and supercells. The difference between the latter two was that the shear
was unidirectional for multicells, while it changed in a clockwise direction with height for supercells.

 Figure 1. Composite hodographs associated with a) single cells b) multicells and c) supercells
 according to Chisholm and Renick (1972). Figure modified by Sills and Joe (2019). See Chapter 3.3
 for more information about hodographs. Figure licensed under a CC BY-NC-ND 4.0 license.

During the 1970s and 80s, numerical modelling studies using idealised cloud models have greatly
advanced our understanding of how wind shear influences the morphology of convective storms.
Pioneering research in this direction was done by Klemp and Wilhelmson (1978), Wilhelmson and
Klemp (1978), and Weisman and Klemp (1984). These studies provided the physical explanation for
the deviant storm motion of supercells, for storm-splitting, and for updraughts being both longer-lived
and stronger in environments with strong wind shear. Davies-Jones (1984) provided a mathematical
description of how updraught rotation arises in supercells and related this to the helicity of the flow.
Helicity is the extent to which a corkscrew-like motion occurs and has become a frequently used quantity
in forecasting severe convective storms (Davies-Jones et al. 1990).

4 Technical Memorandum No. 879
Vertical wind shear and convective storms

While these studies mostly concentrated on the dynamics of supercell convection, an important study
on multicells was done by Rotunno et al. (1988), who, using a set of numerical simulations, found that
long-lived squall lines require a state of balance between perturbation pressure gradient forces induced
by cold pool and the ambient vertical wind shear. This is commonly referred to as “RKW-theory”, after
the initials of the article’s authors. While some of the presented conclusions have been disputed in the
literature (e.g., Coniglio et al. 2006), it has upheld its relevance in explaining how shear at the depth of
the gust front contributes to deeper lift of the parcels ahead of it, and thus to the regeneration of
convective system (Bryan et al. 2006).

2 The impact of wind shear on convective storms and hazard type
2.1 The effect of wind shear on convective storms
The most important effect that wind shear exerts on convective storms is the prolongation of their life
span beyond the typical life of a single cell in the absence of wind shear. Single cells usually last 45 –
60 minutes, while their mature stage typically lasts only 15-20 minutes. The lifespan of a single cell is
limited by the collapse of its precipitation core, that is filled with heavy hydrometeors, onto its
updraught, and by undercutting of the updraught from its source of potentially buoyant air by cold
outflow driven by the evaporation of precipitation. Vertical wind shear increases a storm’s longevity by
counteracting these two detrimental processes (Markowski and Richardson, 2010).

2.1.1 Separation of updraught and downdraught and storm-relative winds
Stronger vertical wind shear implies that strong storm-relative winds may occur, in particular at higher
altitudes. Mid- and upper-level winds can advect the precipitation away from the updraught tower, such
that the outflow produced by evaporational cooling of this precipitation does not undercut the inflow
into the storm. At the same time, the lower tropospheric storm-relative wind (inflow) can limit the
motion of cool outflow air away from the updraught, which prevents it from being undercut early. In
addition, stronger inflow into a storm is also associated with wider and stronger updraughts (Peters et
al., 2019).

2.1.2 Perturbation pressure forces
Vertical wind shear results in the development of an upward vertical pressure perturbation gradient force
within the storm or at the flank of the storm. Such forces lift new air to its Level of Free Convection,
thereby regenerating and potentially enhancing the updraught. The pressure perturbation gradients may
either force the initiation of new cells along the gust front of a storm (Figure 2) – specific for multicells
and squall lines – or underneath a low pressure perturbation that develops within or next to the updraught
core – this occurs in supercells. An upward pointing pressure perturbation gradient forces air to its LFC
and thus ensures the persistence of the storm. The often visually stunning appearance of some supercells
with smooth, laminar-looking cloud bases actually results from this forced ascent of parcels while they
are still denser than the surrounding air (Figure 4).

Technical Memorandum No. 879 5
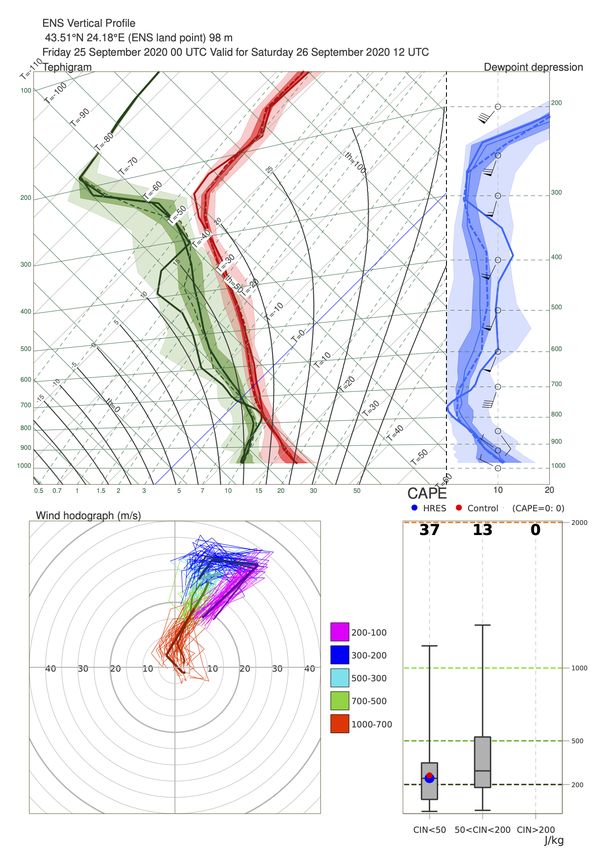
Vertical wind shear and convective storms

 Figure 2. An idealized simulation of a cold-pool relative flow in the absence of shear (left) and in
 the case that cold pool and shear are balanced (right). Deeper lift along the edge of the cold pool is
 generated in the balanced state on the right.

 Thus pressure perturbation gradients may accelerate
 updraughts beyond the speeds that would result from
 buoyancy alone (Weisman and Klemp, 1984). The
 strongest updraughts and downdraughts in convective
 storms occur with strong vertical wind shear and
 substantial CAPE (Kirkpatrick et al., 2009). Besides
 the longevity and strength of updraughts, their width is
 also increased by shear, as found in the recent studies
 by Dennis and Kumjian (2017), Trapp et al. (2017),
 Marion and Trapp (2019) and Peters et al. (2019). The
 cores of wider updraughts are more protected from
 entrainment and thus tend to be stronger than narrow
 updraughts (Peters et al. 2019). Furthermore, wider
 Figure 4. Supercell cloud base with updraughts are typically more continuous or plume-
 laminar – rather than buoyant – look like, in contrast to narrower updraughts that are more
 and a tail cloud. Photographed by
 intermittent, consisting of a series of subsequent
 Pieter Groenemeijer.
 buoyant bubbles.

 Because vertical wind shear increases the lifetime of
 convective storms as well as the speed and width of up-
 and downdraughts, the severity of severe convective
 storms increases with increasing shear. Indeed, a strong
 correspondence between the relative frequency of
 severe convective storms and vertical wind shear has
 been confirmed over the U.S.A., Europe and Australia
 (Craven and Brooks 2004; Brooks 2009, Allen and
 Karoly 2014, Púčik et al. 2015, Taszarek et al. 2017).
 Figure 3 shows the increasing probability of severe
 Figure 3. Relative frequency of weather over Central Europe. The link between vertical
 severe convective storms in the wind shear and individual hazards of severe convective
 CAPE and 0–6 km bulk shear storms, such as large hail, severe wind gusts, tornadoes
 parameter space. Adapted from: and excessive rainfall, is more complicated.
 Púčik et al. (2015).

6 Technical Memorandum No. 879
Vertical wind shear and convective storms

2.2 Wind shear and convective hazards

2.2.1 Large hail
Brooks (2013) and Púčik et al. (2015) found that of all severe weather threats, large hail depends most
strongly on high CAPE and strong shear between the surface and the mid-troposphere, e.g. between 0
and 6 km above ground level. This is because large hail requires strong, wide, and persistent updraughts
(Nelson 1987) all of which are favoured by high CAPE and strong shear. In fact, very large hail
exceeding 5 cm in diameter is almost exclusively produced by supercells (Smith et al. 2012; Blair et al.
2017). Supercells are convective storms with a persistent, deep mesocyclone, i.e. a circulation with a
depth of typically 2 – 10 km, that can be detected by Doppler radar. Some studies have found that vertical
wind shear is a better hail size discriminator than CAPE (Berthet et al. 2013, Johnson and Sugden 2014)
or that CAPE alone is a poor discriminator of hail size (Edwards and Thompson 1998). For smaller hail
sizes (< 2 cm), strong vertical wind shear is not required, and buoyancy-related parameters may work
better as hail predictors (Manzato 2012). While very large hail requires strong vertical wind shear, small
variations in the vertical wind profile can strongly influence hail embryo trajectories through a storm’s
updraught (Dennis and Kumjian, 2017). As a result, seemingly similar environments may produce a
wide range of hail sizes.

2.2.2 Severe wind gusts
The relation between severe wind gusts and vertical wind shear is more complicated than for large hail.
Isolated strong downdraughts leading to severe winds near the surface, i.e. downbursts, depend primarily
on water loading within the storm, the environmental lapse rate (i.e. the vertical temperature gradient),
and lower tropospheric relative humidity (Srivastava 1985) and not as much on wind shear. As a
consequence, downbursts may also occur with weak vertical wind shear.

Longer-lived and more widespread convective windstorms are often tied to the deep cold pools and
mesoscale circulations created by linear mesoscale convective systems, i.e. squall lines. Bow echoes, a
subset of squall lines named after their appearance on weather radar, have been associated with the most
damaging convective windstorms (Przybylinski 1995; Gatzen 2013, Taszarek et al., 2019). Numerical
simulations of bow echoes by Weisman (1993) showed that strong vertical wind shear in the lower
troposphere is required for their formation. Although Evans and Doswell (2001) have shown that bow
echoes have also occurred with a “lower-than-ideal” amount of wind shear, more recently it was
confirmed that the most intense convective windstorms were associated with the strongest wind shear
(Cohen et al. 2007).

Besides the strength of the shear, the orientation of mean flow with respect to the convective system, or
the air-mass boundary along which it initiated – typically a zone with convergent wind near the surface
– is important (Kuchera and Parker 2006, Corfidi 2003): fast-moving convective windstorms are more
likely when the mean tropospheric flow is perpendicular to the orientation of the squall line.

2.2.3 Tornadoes
Tornadoes can be divided into two groups: mesocyclonic and non-mesocyclonic. Non-mesocyclonic
tornadoes form by stretching pre-existing vertical vorticity by the updraught of a convective storm
(Wakimoto and Wilson 1989; Brady and Szoke 1989; Davies 2006; Markowski and Richardson 2010),
which typically happens along a boundary across which the low-level wind changes direction. This

Technical Memorandum No. 879 7
Vertical wind shear and convective storms

process does not require strong vertical wind shear. Because this type of tornado depends on the presence
of small-scale boundaries, non-mesocyclonic tornadoes are comparatively hard to forecast.

In mesocyclonic tornadoes, vorticity is stretched by a parent mesocyclone. Thus, the first step in
forecasting mesocyclonic tornadoes is to identify whether a supercell can form. However, most
supercells never produce a tornado (Trapp et al. 2005). A myriad of field experiments, observational
and numerical modelling studies (e.g., Markowski and Richardson 2014) were devoted to the
discrimination between non-tornadic and tornadic supercells. It was found that the height of the cloud
base and the magnitude of the vertical wind shear across the lowest 1 km were skilful discriminators
(Thompson et al. 2003, Craven and Brooks, 2004, Grams et al. 2012). The probability of tornadoes
increases both with lower cloud bases and with stronger low-level wind shear.

Recent studies show that the characteristics of the wind profile in the lowest hundreds of meters may be
the most important for determining whether vortex stretching from the parent mesocyclone will be
sufficient for forming a tornado (Coffer and Parker 2017). Coffer et al. (2019) recently showed that the
shear in the lowest 500 m was an even more skilful predictor of tornadoes than shear in the lowest 1000
m. While the shear in the lowest hundreds of meters may be the best discriminator, it is also very
sensitive to very local variations of flow in the boundary layer that may not be resolved by radiosondes
or be confidently predicted in a deterministic sense by numerical weather prediction models. Studies
using radiosonde-based observations over Europe (Púčik et al. 2015, Taszarek et al. 2017) showed little
added value in using 0-1 km shear rather than 0-3 km shear when discriminating between non-tornadic
and significantly tornadic (F2+) environments.

2.2.4 Excessive rainfall
Of all severe weather hazards, excessive rainfall is the one that is least linked to the presence of strong
vertical wind shear. An important factor for excessive rainfall occurrence is precipitation efficiency,
defined as the ratio of the mass of water falling as precipitation to the influx of water vapor mass into
the storm cloud (Doswell et al. 1996). The other important factors are the influx of water vapor and the
duration of the precipitation.
Marwitz (1972a), showed that precipitation efficiency was negatively correlated with wind shear in
storms across the United States High Plains, possibly due to increased entrainment into the updraught
and subsequent evaporation of hydrometeors, but a number of subsequent studies have not been able to
corroborate this (Trudeau and Zawadzki, 1983; Fankhauser 1988). Another reason why shear may be
considered detrimental for excessive rainfall accumulations is that storms often travel faster in
environments of stronger shear. However, convective storms may remain quasi-stationary even in strong
flow if new cells keep forming at the upwind flank of the system, a process called back-building (Corfidi
et al. 1996). Storms that develop in strong wind shear tend to have stronger updraughts and wider
updraughts with a stronger moisture influx. Hitchens and Brooks (2013) found that supercells typically
produce more intense precipitation than non-supercells. Idealized numerical model simulations showed
that in a moist environment with high relative humidity throughout the troposphere, the dynamical
contribution to the updraught from a mesocyclone increased precipitation rates (Nielsen and
Schumacher 2018). The net effect of wind shear on heavy precipitation is ambiguous and is likely not
the same for all geographical regions and all meteorological situations.

8 Technical Memorandum No. 879
Vertical wind shear and convective storms

3 Vertical wind shear parameters
There are numerous different measures of vertical wind shear in use by forecasters and researchers.
Most straightforward is the literal calculation of vertical shear of the horizontal wind, i.e. a velocity
difference divided by depth, which yields a unit of s-1. More commonly the magnitude of the vector
wind difference between two fixed levels is used, in particular by the forecasting community, and this
is called “bulk shear”, “bulk wind shear” or “bulk wind difference”. Ordinarily, computations of such a
parameter do not involve division by the depth of the layer across which the shear is considered.

3.1 Bulk wind shear
A common layer over which the bulk shear is calculated is that from 0 to 6 km above the ground, where
the 0 km is usually meant to mean the wind at 10 m, the standard WMO measuring height, or,
occasionally in some studies, an average over the lowest 500 m. This wind difference is often simply
referred to as deep-layer shear, abbreviated in technical forecast discussions by DLS. The 0–6 km layer
has been found to discriminate well between non-supercell and supercell convection (Rasmussen and
Blanchard 1998, Thompson et al. 2003) and has been used in many proximity sounding studies of severe
convective storms (e.g., Púčik et al. 2015; Taszarek et al. 2017). The choice of 0–6 km is arbitrary and
was likely chosen as a surrogate to the standard pressure level of 500 hPa. Houston et al. (2008)
investigated the skill of different bulk shear depths in discriminating non-supercell from supercell
environments: they found little variation in skill for layers extending from 0 up to 4, 5, or 6 km.

Supercells become more likely as the 0–6 km bulk shear approaches and exceeds 20 m/s (Table 1).
There is, however, no absolute threshold value. Single cells are typical for values below 10 m/s, while
increasingly well-organized multicell storms tend to occur when DLS rises from 10 to 20 m/s. Doswell
and Evans (2003) found that derechoes, large-scale convective windstorms that are usually associated
with well-organized linear convective systems, typically occur with strong vertical wind shear, similar
to supercells. A strongly sheared environment favours both supercell convection and derechoes. In fact,
derechoes frequently evolve from one or more isolated supercells (e.g. Taszarek et al. 2019). The process
responsible for this is not a result of changing wind shear, but the clustering of convective cells along a
common outflow boundary. This happens most frequently when widespread initiation has occurred
along a common initiating boundary. In that case, the downdraughts of individual storms that result from
hydrometeor evaporation will often merge into one common pool of cold air (Dial et al. 2010). The edge
of the resulting large and deep cold pool then often becomes the focus for new cell initiation, thereby
enhancing the multicellular, rather than supercellular, character of the convective developments.

Technical Memorandum No. 879 9
Vertical wind shear and convective storms

 0–6 km shear: < 10 m/s 8 – 20 m/s > 18 m/s

 convective mode: single cells multicells supercells

 system gust front unable to gust front initiates new updraughts may be
 propagation: initiate new cells, at cells repeatedly quasi-steady;
 least in any organized (downshear flank propagation governed
 way; preferred in a by vertical pressure
 homogeneous gradients extending
 convection is short- environment); system over a deep layer rather
 lived propagation is driven than by gust front
 by gust front lifting lifting

 Table 1. Main convective archetypes, their basic dynamic traits and link to the magnitude of 0–6 km
 bulk shear, according to Markowski and Richardson (2010).

While the nature of the lifting process is an important factor determining whether multicellular and
supercellular convection develops in strongly sheared environments, there are some traits of the wind
profile that are more typical for supercells, and some that are more typical for linear convective systems.
Most importantly, supercells tend to have shear distributed over a deeper layer (Weisman and Klemp,
1986; Doswell and Evans 2003; Bunkers et al. 2006). Meanwhile linear systems thrive when strong
shear is confined to the bottom kilometres of the troposphere, which results in weak mid- to upper
tropospheric winds, precipitation fall-out to the rear part of the storm and thus deepening of the cold
pool (Markowski and Richardson 2010). Three layers of the bulk shear are most commonly considered
for forecasting severe convective storms.

10 Technical Memorandum No. 879
Vertical wind shear and convective storms

 Figure 5. Box plot of distribution of 0–6 km bulk wind shear values in different types and severities
 of convective storm hazards. From Púčik et al. (2015).

0 – 6 km layer

 • used for convective type forecasting, especially non-supercells vs supercells
 • discriminates well between environments of hail of 2–5 cm and ≥ 5 cm (supercells required for
 hail ≥ 5 cm)
 • discriminates well between environments of non-severe, severe (25–32 m/s) and extremely
 severe (≥ 32 m/s) wind gusts
 • the relative frequency of large hail, severe wind gusts and tornadoes increases with an increased
 product of CAPE and 0–6 km bulk shear

Across Europe, almost all events with hail ≥ 5 cm, wind gusts ≥ 32 m/s and F2+ tornadoes occur with
0–6 km bulk shear > 15 m/s (Figure 5, from Púčik et al. 2015).

0–3 km layer

 • used for mesoscale convective system and convective windstorm forecasting
 • in cases of strong shear > 15 m/s that is confined to the lower troposphere, expect storms to
 favour transitioning into line segments, rather than staying as isolated supercells.

Technical Memorandum No. 879 11
Vertical wind shear and convective storms

 • discriminates well between environments of non-severe, severe (25 - 32 m/s) and extremely
 severe (≥ 32 m/s) wind gusts
also discriminates well between environments in which significant tornadoes (≥ F2) occur vs. those that
lead to weak (< F2) or no tornadoes.

0–1 km layer

 • used for tornado forecasting given that supercells occur; values above 10 m/s are supportive of
 mesocyclonic tornadoes
None of these bulk shear parameters discriminate well between convective storms with and without
subsequent flash flooding.

3.2 Storm-relative winds
Storm-relative winds are the winds relative to the motion of the convective storm. Ground- and storm-
relative winds may differ substantially. In order to calculate storm-relative winds, a storm motion vector
needs to be calculated. Typically, ordinary cells move with the mean wind in the lower to mid-
troposphere (e.g. 0–6 km). More information on the storm motion vector calculation is provided in the
next section on hodographs.

Larger vertical wind shear usually implies stronger storm-relative winds. While storm-relative winds
are not very commonly used in severe convective storm forecasting, several studies have pointed out
that stronger inflow to storm in the lower troposphere (up to 3 km above the surface) is associated with
more severe storms (Kerr and Darkow, 1996; Thompson 1998). Recently, numerical modelling studies
found that stronger inflow leads to wider and stronger updraughts and more latent heat release within
the convective storms (Alfaro 2017; Peters et al. 2019a, 2019b).

Tornadic supercells have stronger mid-tropospheric storm-relative winds (calculated over the height
interval of 4–6 km) than non-tornadic supercells (Thompson 1998). Brooks et al. (1994) associated
weaker mid-tropospheric storm-relative winds with higher precipitation in the rear-flank downdraught
of the storm and with a stronger outflow that eventually undercuts the updraught. In fact, a study on
supercells producing extreme wind gusts at the surface, but no tornadoes, found out that such storms
featured very weak mid-tropospheric storm-relative flow (Brooks and Doswell 1993).

Upper tropospheric storm-relative winds are typically calculated for altitudes above 8 or 9 km. There
are some indications that stronger upper tropospheric storm-relative winds are associated with storms
that have a lower precipitation efficiency and with longer lasting supercells (Rasmussen and Straka
1998, Bunkers et al. 2006).

3.3 The hodograph, storm relative wind and helicity

3.3.1 Hodograph
Vertical wind shear can be assessed using the vertical wind profile that is often plotted next to and
aligned with a thermodynamic diagram. This is often done simply by displaying a number of wind barbs
or wind vectors at various altitudes. Forecasters often use them to extract whether the shear is mostly
speed shear, directional shear, or both, and subsequently determine the most likely convective type. This

12 Technical Memorandum No. 879
Vertical wind shear and convective storms

process is not very straightforward, as it is difficult to visually derive bulk shear numbers from barbs,
let alone more complicated metrics such as storm-relative helicity, discussed below. Storm-relative
helicity is often thought to be associated with winds veering with height, something that can easily be
derived from a number of barbs, but this is not always the case.

A hodograph (Figure 6) is a helpful tool to assess the change of the wind and the wind shear vector with
height. It is obtained by drawing multiple wind vectors from the origin of a coordinate system along the
direction into which the wind blows while the arrow length represents the wind speed: the hodograph is
then the line that connects the tips of the wind vectors, for sequentially increasing altitudes. The wind
shear vector (i.e. the vertical derivative of the horizontal wind vectors) aligns along the tangent to this
curve whilst the length of the hodograph between two altitudes represents the magnitude of the wind
shear. Along a curved hodograph, the wind direction changes with height, but – and this is important for
the dynamics of storm systems – the shear vector changes with height as well.

 Figure 6. A hodograph with the colours of the hodograph line representing different vertical layers.
 Wind vectors are plotted for surface (SFC), 0.5, 1, 3 and 6 km AGL wind. Storm motion is plotted
 for ordinary cells (mean), left-moving (LM) and right-moving (RM) supercells. Further details about
 LM and RM supercells and wind shear can be found in section 3.3.3.

3.3.2 Storm-relative wind
Storm-relative winds can be easily read from the hodograph, once the storm motion is known. The
motion of ordinary cells can be estimated using a pressure weighted mean wind in the lower to mid-
troposphere (typically from surface up to 6 km). Storm-relative winds at a given altitude are then found
by vectors from the point representing the storm motion to the hodograph at that altitude.
The curvature of the hodograph throughout the lower troposphere, typically the bottom 3 km, is of
interest as it represents the layer from which air flows into to the storm’s updraught(s). The rotation in
a supercell arises as horizontally oriented vorticity, that exists because of the vertical wind shear, is tilted
and stretched by the updraught of a convective storm. Figure 7 gives two examples where the shear in

Technical Memorandum No. 879 13
Vertical wind shear and convective storms

the lowest 0.5 km, i.e. the stretch of the hodograph between 0 and 0.5 km (brown) is approximately
parallel (left) or perpendicular (right) to the storm-relative wind. Here, the storm is assumed to behave
and move as a “right-moving” (RM) storm. The vorticity vectors (purple) that are perpendicular to the
low-level shear are perpendicular (left) and parallel (right) to the storm-relative wind. The vorticity in
that layer of air is said to be crosswise (left) or streamwise (right), respectively.

 Figure 7. Hodographs showing the storm-relative inflow winds for 0–0.5 km above ground level
 (black) and the vorticity vector (violet) in the same layer. In case of the left hodograph, the vorticity
 is almost purely crosswise in this layer, whereas it is almost purely streamwise in the example on
 the right.

In the case of purely crosswise vorticity, the updraught tilts the vorticity in a way that results in maxima
on the updraught’s flanks but no net rotation arises within the updraught. In the streamwise vorticity
case, the maximum of vorticity after tilting would be collocated with the updraught maximum implying
that the updraught as a whole will rotate.

3.3.3 Storm-relative helicity
Thus, the orientation of the vorticity vector with respect to the storm-relative inflow vectors is important
for anticipating the degree of rotation in the convective storms, i.e. the potential for supercell convection.
In order to achieve updraught rotation, the storm motion must not lie on the hodograph. The greatest
degree of streamwise vorticity can be expected when the hodograph is both long (allowing for strong
storm-relative inflow) and strongly curved (allowing for streamwise vorticity) as in Figure 7 (right).
Storm-relative helicity is a measure that expresses this quantitatively (Davies-Jones, 1984). Helicity is
the extent to which a fluid follows a corkscrew-like motion. This is the case when the vorticity is aligned
with the velocity in the fluid, in other words, helicity is the dot product of the wind vector and vorticity
vector.
The helicity relevant to the generation of rotation in a convective storm must be calculated using a storm-
relative wind profile, where any vertical wind components are ignored, this is called storm-relative
helicity (SRH):
 &
 ⃗
 = − & ( ⋅ ( ⃗ − ⃗!"#$% ) ×

 '

14 Technical Memorandum No. 879
Vertical wind shear and convective storms

where ⃗ − ⃗!"#$% is the storm relative wind, ⃗⁄ is the vertical wind shear and ( is the unit vector
in the upward direction.
The helicity is integrated over the depth (h) of the inflow to the storm, which is conventionally
approximated over the depth of the bottom 3 km (Davies-Jones et al. 1990) or 1 km (Thompson et al.
2003). For tornado forecasting, a layer as shallow as 500 m has been proposed (Coffer et al. 2019). On
the hodograph, storm-relative helicity is proportional to twice the area swept out by the storm-relative
wind vectors at the ground, at the 3 km above the ground and the hodograph line (Figure 8). This area
increases with increasing hodograph length, with increasing curvature and also with the storm motion
vector lying further away from the hodograph.

 Figure 8. A curved hodograph with the storm-relative wind at the surface and at 3 km AGL for
 ordinary cell motion (mean, dashed arrows) and right-moving supercell (RM, full arrows). The
 storm-relative helicity (SRH) corresponding to ordinary cell motion is proportional to the size of
 the dark violet area, whereas SRH corresponding to the right moving supercell is proportional to
 the sum of the dark and light violet areas.

Forecasters often require high values of SRH or curved hodographs to call an environment conducive
to supercells. However, as Weisman and Rotunno (2000) note, the basic process through which a storm
attains supercellular characteristics (tilting and stretching of vorticity) can occur both with linear and
curved hodographs. In case of a linear hodograph, vorticity centres that form on the flanks of the
updraught will force new updraughts on the sides of the storm. This will result in a storm splitting into
a left-moving (LM) and right-moving (RM) storm that both propagate away from the original storm
motion vector. After this split, the storm motion vector will lie outside of the hodograph even if it is
straight (Figure 9).

Because storms in strongly sheared environments tend to have a significant component of motion
because of a preferred development on one side of the storm, SRH is typically calculated taking this
deviant motion into account. The SRH that forecasters often see displayed is usually the helicity

Technical Memorandum No. 879 15
Vertical wind shear and convective storms

available to the storm once it already evolved into a (super)cell with such a deviant motion. For this
reason, deep-layer shear discriminates better between supercells and non-supercells than the SRH
(McCaul and Weisman 2001, Nowotarski and Jensen 2013, Peters et al. 2020). Typically, SRH will be
calculated for the right-moving supercells in the Northern Hemisphere. This is because the vertical wind
profile usually favours right-moving over left-moving supercells as a result of the typical veering of
winds with height in the boundary layer in the Northern Hemisphere. This veering with height is a
characteristic of the Ekman spiral, the wind profile that results from the assumption that within the
boundary layer a balance exists between the pressure gradient force, the Coriolis force and turbulent
friction. For the Southern Hemisphere, SRH is usually calculated for left-moving supercells, since the
wind usually backs with height as a result of the opposite direction of the Coriolis force.

 Figure 9. A straight hodograph with areas of storm-relative helicity for left-moving (blue, LM) and
 right-moving (red, RM) supercells.

SRH calculation requires a correct anticipation of the storm motion vector. The empirical Internal
Dynamics method, or simply ID-method, was proposed by Bunkers et al. (2000) and uses the mean wind
in the lowest 6 km and the shear vector between the average winds at 0-0.5 km AGL and 5.5-6 km AGL
(Figure 10). First, the mean wind is used to estimate the motion of an ordinary cell and the deviant
propagation of supercells is set to be 7.5 m/s to the left and right of the mean wind along the line
perpendicular to the shear vector. This technique is empirical and does not account for the effects of
cold pool, orography or boundaries on storm propagation (Bunkers et al. 2000). It was shown to produce
largest errors in environments of fast storm motion, very high SRH, low relative humidity in the low to
mid-troposphere or high CIN (Bunkers 2018). The Internal Dynamics method cannot be applied to the
movement of mesoscale convective systems, where propagation is usually predominantly driven by the
effects of the cold pool (Corfidi 2003).

SRH best applies to supercell convection and thus should not be used to forecast the intensity of
multicellular convection, including squall lines and bow-echoes. Once the deep-layer shear is strong
enough for supercells, SRH can be used to anticipate the strength of low-level rotation within the

16 Technical Memorandum No. 879
Vertical wind shear and convective storms

supercell. Other storm characteristics, such as the updraught strength or updraught width are better
characterised by bulk wind shear (Peters et al. 2020). The strength of low-level rotation seems to be
important especially for tornadoes (Thompson et al. 2003, Grams et al. 2012). For tornado forecasting,
calculating SRH over the shallower layers (0–500 m or 0–1000 m) may yield better results than using
the layer of 0–3 km (Nowotarski and Jensen 2013, Coffer et al. 2019). Over the U.S.A., SRH values
over 250 m2/s2 in the 0–3 km layer and over 100 m2/s2 in the 0–1 km layer were associated with
tornadoes, increasing with increasing tornado intensity (Anderson-Frey et al. 2016). Over Europe,
tornadoes were observed with lower values of SRH (Púčik et al. 2015; Taszarek et al. 2017).

 Figure 10. Construction of storm motion vectors using the Bunker’s ID-method (Bunkers, 2000).
 Image courtesy of Matthew Bunkers.

The correlation between other convective hazards and SRH is low. While supercells are prolific large
hail producers, Dennis and Kumjian (2017) even found decrease in the hail production in simulated
supercells when increasing the SRH in the environment. Thus, SRH should be used predominantly for
tornado forecasting. The shape of the hodograph can be then used to infer the characteristics of
supercells. Straight, long hodographs will produce mirror-image splitting supercells while curved
hodograph will favour either left or right-split of the pair. Curved hodograph with wind veering with
height will favour right-moving supercells, whereas curved hodograph with wind backing will favour
the left-movers.

Technical Memorandum No. 879 17
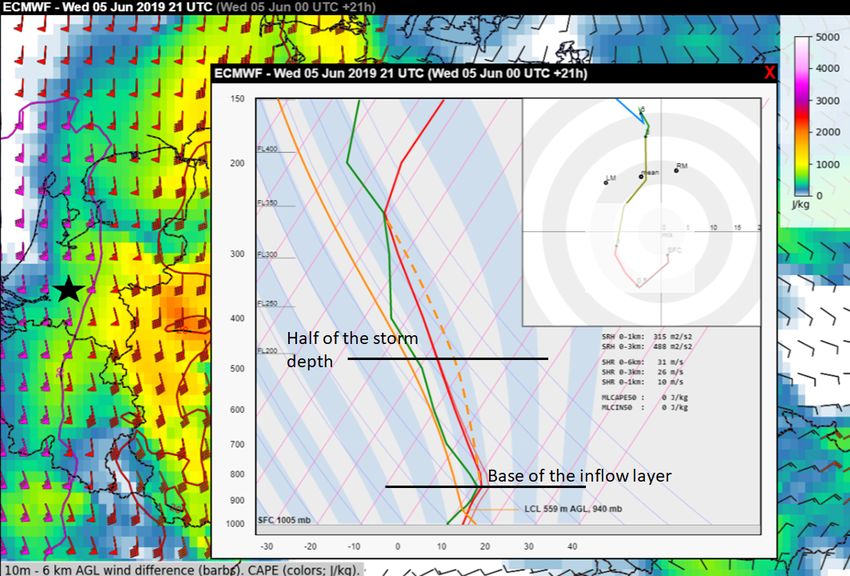
Vertical wind shear and convective storms

4 Composite parameters including measures of vertical wind shear
4.1 Effective shear and effective storm-relative helicity
Effective bulk shear and effective SRH are measures of vertical wind shear that take the
thermodynamic profile of the troposphere into consideration. Conventional measures of bulk shear and
SRH are typically calculated over a constant depth, e.g. 0–6 km for bulk shear and 0–3 km for SRH.
Here, 0–6 km is approximately a half of the height of a typical convective storm and the 0–3 km can be
thought of the layer of air from which rising parcels in the updraught originate. In practice, of course,
low topped convection in winter may not even be 6 km tall, while the storms near the equator can reach
as high as 18 km. Furthermore, it is assumed that the base of the inflow layer to the storm is near the
ground, which is not true for elevated storms, i.e. storms with an inflow layer substantially above the
ground. To account for the varying heights of the inflow layer and storm heights found in various
situations, Thompson et al. (2007) defined effective shear and effective storm-relative helicity by
computing them for an inflow layer in which parcels have CAPE of at least 100 J/kg and CIN less than
250 J/kg: effective SRH is calculated by integration over the layer satisfying these conditions, while
effective bulk shear is calculated as the difference between the wind at the bottom of the inflow layer
and that halfway between the distance from the inflow layer to the equilibrium level. They found that
these varieties of SRH and bulk shear discriminated better between non-supercells and supercells than
their conventional fixed-layer equivalents.

Figure 11 illustrates a situation where effective SRH and effective bulk shear are very different from
their conventional fixed-layer equivalents. The model predicted very high values of bulk shear
(exceeding 30 m/s in the 0–6 km layer) and SRH (over 400 m2/s2) over the Netherlands. However, the
boundary layer was stable and parcels originating from the surface would have zero CAPE. The inflow
layer to the storms was situated above the boundary layer, at around 850 hPa in the shown profile. The
strong vertical wind shear below this altitude would be ineffective in the sense that it does not affect the
organization of the convection because these parcels would not participate in the convective overturning.
Calculating the effective bulk shear for the given profile would yield approximately 13 m/s, much less
than the 0–6 km value of 30 m/s.

It is important to note that, while effective forms of bulk shear and SRH may be superior to their ordinary
forms, they only work well provided that the temperature and humidity profiles are simulated correctly.
Potential inaccuracies of these profiles will negatively impact the accuracy of the shear parameter.
Whenever – perhaps incorrectly – no CAPE is diagnosed, both the effective bulk shear and the effective
SRH will be zero, even if vertical wind shear is strong.

18 Technical Memorandum No. 879
Vertical wind shear and convective storms

 Figure 11. ECMWF 5 June 2019 00 UTC forecast of 21 UTC CAPE (shaded) and 0–6 km bulk
 vertical wind shear (barbs and contours). The forecast profile and hodograph are plotted for the
 location marked by a star. The inflow layer and half of the storm depth are indicated. The
 “ineffective” lower portion of the hodograph has been blurred.

4.2 Combinations of CAPE and bulk shear
The product and ratio of CAPE and bulk shear are sometimes used as diagnostic parameters. The ratio
of CAPE and bulk shear is known as the Bulk Richardson Number (BRN) and was proposed by
Moncrief and Green (1972) and adapted by Weisman and Klemp (1982) in their pioneering modelling
study for anticipating the type of convective storm. It is a dimensionless number and is normally
calculated as:

 =
 1
 ‖∆ (
 2 >⃗‖
where ∆ >⃗ is the difference between the 0–6 km mean wind and the 0–500 m mean wind. In the
simulations of Weisman and Klemp (1982) supercells developed in environments with BRN values
generally between 10 and 50, while less organised convection typically formed when BRN exceeded
50. In operational forecasting practice, the BRN is not used very often: the use of the wind shear
magnitude (such as the 0–6 km bulk shear) to forecast convective type is often preferred over BRN. The
type of organisation of convection is not very sensitive to the magnitude of CAPE, and almost
exclusively depends on the denominator of the BRN, i.e. the shear.

Because storm severity depends both on the convective mode that can be anticipated by the magnitude
of shear, and on CAPE which modulates it too, because higher CAPE promotes a higher convective

Technical Memorandum No. 879 19
Vertical wind shear and convective storms

updraught intensity, the product of these two parameters CAPE and bulk shear, i.e. ∙ ‖∆ >⃗‖( , is a
good predictor of potential storm severity. Craven and Brooks (2004) demonstrated that it discriminated
better between non-severe and severe thunderstorms than CAPE or bulk shear alone. Brooks et al.
(2013), Púčik et al. (2015) and Taszarek et al. (2017) have shown that the relative frequency of severe
convective storms increases strongly with increasing CAPE and bulk shear. The product of the square
root of twice CAPE1 and 0–6 km bulk shear, i.e. √2 . ‖∆ >⃗‖, has been shown to discriminate well
between non-severe and severe convective storms (Taszarek et al. 2017) using a threshold value of 400
m2/s2. Over the United States, most of the events with hail ≥ 5 cm, wind gusts ≥ 32+ m/s and F2 or
stronger tornadoes were associated with the product of CAPE and 0–6 km bulk shear exceeding 20000
m3/s3 (Craven and Brooks 2004).

One of the first composite parameters developed was the Energy-Helicity Index (EHI), calculated as
the product of CAPE and storm-relative helicity in the 0–3 km layer divided by 160,000 (Davies 1993):
Rasmussen and Blanchard (1998) and Thompson et al. (2003) found median values of 0.64 and 0.8,
respectively, for non-tornadic supercells, and 1.5 and 2.1, respectively, for supercells with significant
tornadoes. Across Europe, EHI values are lower because significant tornadoes typically occur with
lower CAPE and SRH than across the Midwest of the United States. Taszarek et al. (2020) found that
strong tornadoes (F2–F3) across Europe occur with a median value of 470 J/kg of MLCAPE, compared
to 900 J/kg across the United States, whilst the median storm-relative helicity is 150 m2 s-2 across Europe
vs. 280 m2 s-2 in the United States. Although higher values of EHI are more supportive of tornadoes in
both regions, very high values of EHI are less frequent over Europe than over the U.S. Midwest. This
means that the tornadoes in Europe in spite of these more modest EHI values – but with other factors
apparently favourable enough to ensure their development – occur with lower values of EHI than over
the U.S. Midwest.

Other parameters that have been developed based on the cases over the United States Midwest include
the Supercell Composite Parameter (SCP) and the Significant Tornado Parameter (STP). Both
parameters were introduced by Thompson et al. (2003) and are calculated as a product of a number of
factors. Each of these factors is a parameter that represents a favourable condition for supercells and
tornadoes, respectively, and was subjectively calibrated to be 1 for a typical value found with a supercell
or significant tornado.

SCP originally included CAPE, 0–6 km bulk shear and 0–3 km SRH in its calculation, and STP included
CAPE, 0–6 km bulk shear, 0–1 km SRH and the Lifted condensation level (LCL). The formulations of
the SCP and STP currently in use at NOAA’s Storm Prediction Center include “effective” versions of
these parameters:

 −40 )*
 = ∙ ∙ ∙
 1000 )* 50 ( )( 20 )*

1
 The factor 2 is not necessary for this statement to be true but is included because the theoretical maximum
updraught speed resulting from the conversion of a given amount of CAPE to kinetic energy equals √2 .

20 Technical Memorandum No. 879
Vertical wind shear and convective storms

 with these notes2

 2000 − 200 +
 = )*
 ∙ )*
 ∙ ( )(
 ∙ ∙
 1500 20 150 1500 150 )*

 with these notes3.

Here, the “effective” versions of the parameters are used. MUCAPE is the most unstable CAPE of any
parcel in the profile, ESRH is storm-relative helicity over the effective inflow layer, EBWD is the
effective bulk shear. MLCAPE, MLLCL and MLCIN refer to the CAPE, Lifted Condensation Level
and Convective Inhibition for a 100 hPa mixed-layer parcel. ESSHR equals EBWD, except that it always
uses the wind at 10 m above ground level as the lower layer.

Kaltenböck et al. (2009) reported smaller values of SCP and STP associated with significant tornadoes
over Europe compared to the values found by Thompson et al. (2003) over the United States. Probably,
the reason is that CAPE, which in both SCP and STP is divided by a value of 1000 J/kg, is lower in
European severe weather situations: 1000 J/kg is actually higher than the average CAPE observed with
tornadoes over Europe (Groenemeijer and van Delden 2007; Púčik et al. 2015; Taszarek et al. 2017).
Because of this, SCP and STP should only be used to highlight areas with the best collocation of
ingredients and they should not be required to exceed any particular threshold for supercells or tornadoes
to occur. And there are additional caveats in using these composite parameters; for instance, users should
realize that a doubling of the SCP (STP) does not mean that the probability of a supercell (significant
tornado) doubles as well (Doswell and Schultz 2006). Moreover, the risk of supercells or tornadoes
occurring is still contingent on the formation of a convective storm within the potentially favourable
environment that these parameters can identify, despite the inclusion of a CIN-based factor in the SCP
and STP. Furthermore, composite parameters which include CAPE, such as the EHI, SCP or STP, have
been shown to have a low forecasting skill in situations of high shear and low CAPE (Sherburn and
Parker 2014). In such environments, CAPE is often rapidly built-up and then released by deep
convection (Sherburn and Parker 2016; Gatzen 2020). Recognizing that advection of warm, moist air is
of importance for this rapid creation of CAPE, Sherburn et al. (2016) created an empirical composite
parameter (MOSH) that uses the 0–3 km lapse rate (LLLR) and advection of equivalent potential
temperature qe (MAXTEVV) instead of CAPE. It also uses wind shear in the lowest 1.5 km instead of
the more traditionally used 0–6 km bulk-shear:

2
 EBWD is divided by 20 m s-1 in the range of 10–20 m s-1. EBWD less than 10 m s-1 is set to zero, and EBWD
greater than 20 m s-1 is set to one. The MUCIN term is based on work by Gropp and Davenport (2018), August
issue of Weather and Forecasting, and it is set to 1.0 when muCIN is greater than -40 kg-1.
3
 The MLLCL term is set to 1.0 when MLLCL < 1000 m, and set to 0.0 when MLLCL > 2000 m; the MLCIN
term is set to 1.0 when MLCIN > -50 J kg-1, and set to 0.0 when MLCIN < -200; the EBWD term is capped at a
value of 1.5 for EBWD > 30 m s-1, and set to 0.0 when EBWD < 12.5 m s-1. Lastly, the entire index is set to 0.0
when the effective inflow base is above the ground.

Technical Memorandum No. 879 21
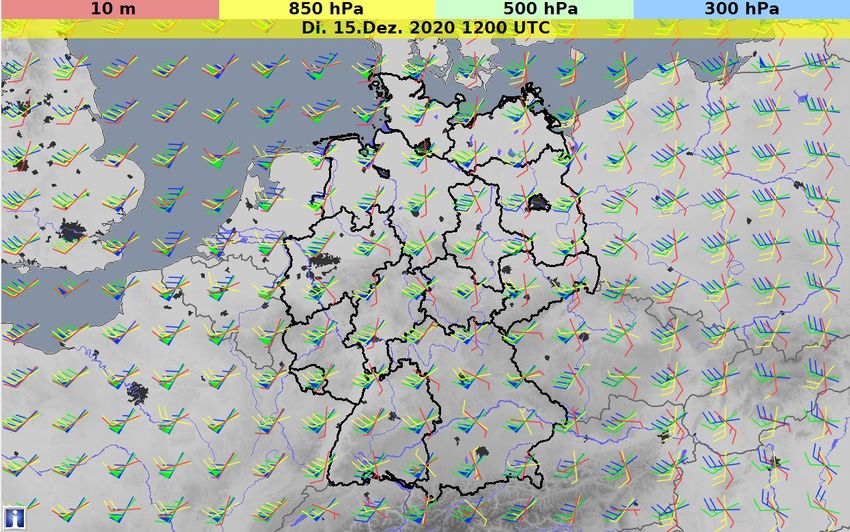
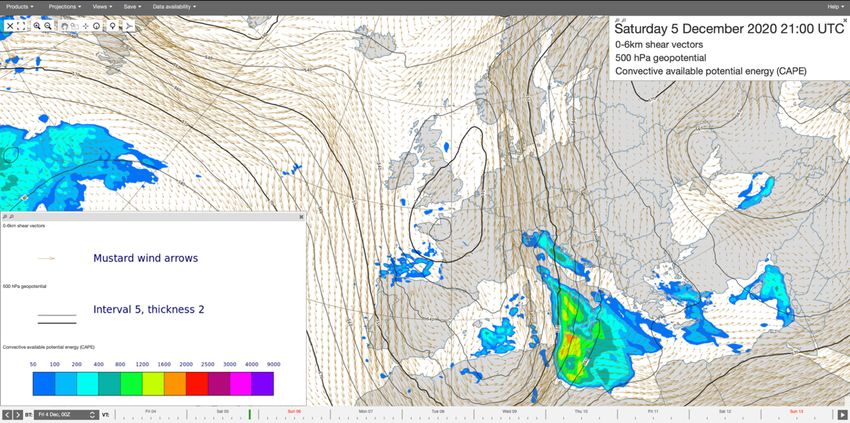
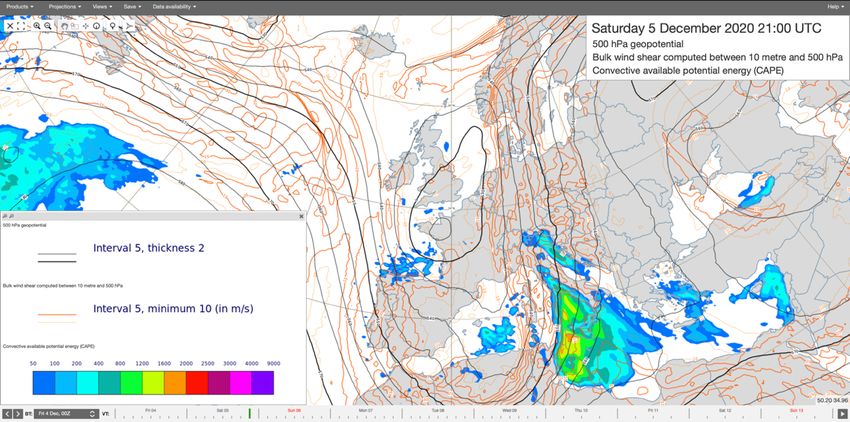
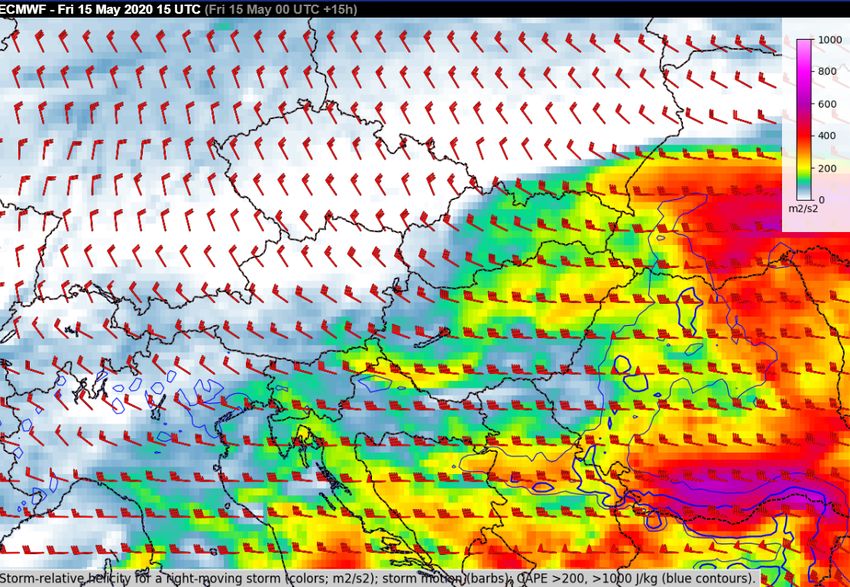
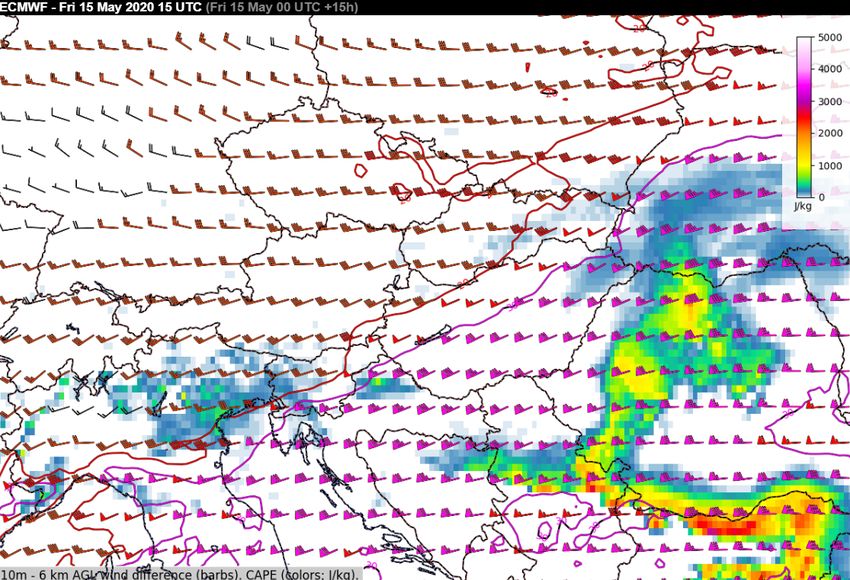
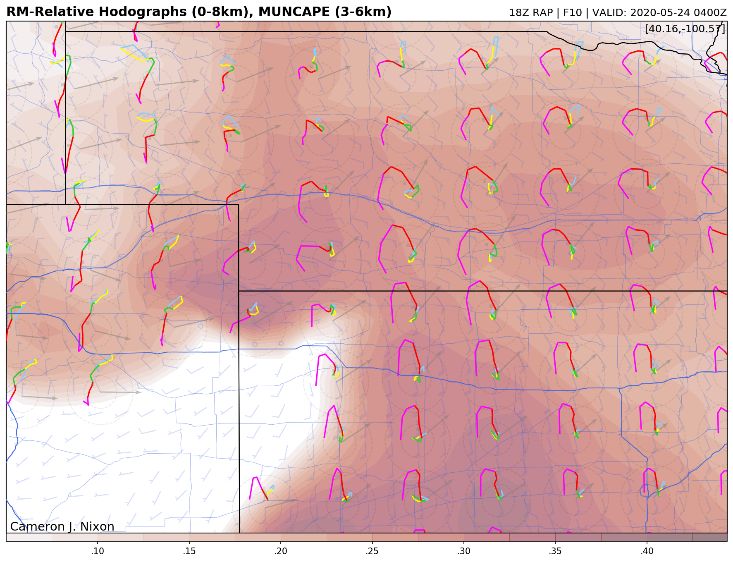
Vertical wind shear and convective storms

This parameter has been shown to have considerable skill in predicting severe wind and tornado events.

There are many other composite parameters that incorporate measures of vertical wind shear and were
developed to address specific forecasting problems. Many of them are calculated as a forecasting
guidance by the Storm Prediction Center in the United States. Such parameters include “large hail
parameter”, which uses several metrics of wind shear, including the bulk shear between the ground and
the Equilibrium level (Johnson and Sugden 2014). In addition, two such composite parameters were
developed for forecasting wind-gust producing convective systems based on the works of Evans and
Doswell (2001) and Cohen et al. (2007). Both parameters include measures of the mean wind and the
deep-layer bulk shear.

Applying these composite indices and the associated threshold values stated in the literature may be
problematic outside the regions for which they were originally developed. Many of the mentioned
parameters have not been evaluated outside of the regions where they have been developed and this
should be taken into consideration when using them in operational practice. Because of this, looking for
the exceedance of a particular threshold is not recommended, but composite parameters can be used to
identify where the best overlap of ingredients occurs.

5 Visualisations of vertical wind shear
Bulk shear is usually either plotted as the contours or wind barbs on a map. In some cases, barbs and
contours are combined. Bulk-shear can be displayed together with CAPE, where CAPE is shaded, and
bulk shear is displayed using wind barbs (Figure 12). Such a combination provides a quick diagnosis of
where the most severe storms are possible in case they develop.

SRH, being a scalar quantity, cannot be plotted as vectors or wind barbs, so contours or shaded areas
are typically used instead. A combination of a shaded SRH field and contours of CAPE is often used by
ESSL, complemented with barbs representing storm motion calculated for a right-moving supercell
(Figure 13).

Instead of shear vectors, wind vectors at different levels may be displayed, giving a crude idea about the
length and shape of the hodograph (Figure 14). Wind barbs at different levels may be plotted as well,
but in such a case it is more difficult to infer the hodograph shape (wind barbs are drawn in the direction
from which blows, opposite to the wind vectors used to create the hodograph). Cameron J. Nixon has
recently developed a visualization whereby miniature storm-relative hodographs are displayed directly.
With each of these visualisations, plotting multiple vectors or barbs for each grid point can easily render
the image too crowded. To mitigate this, the horizontal resolution of the displayed wind shear data has
to be reduced, which can be problematic over areas with strong local variations.

22 Technical Memorandum No. 879
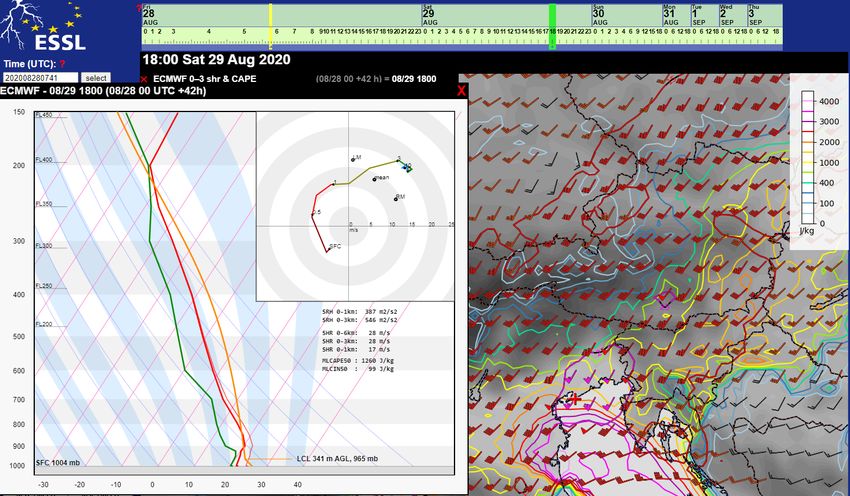
Vertical wind shear and convective storms

The visualization platform used at ESSL for its courses and the ESSL Testbed (Groenemeijer et al,
2017), incorporates a roaming sounding feature, whereby soundings and wind shear profiles are
interactively displayed when a user moves the mouse pointer across an NWP forecast map (Figure 15).
This is rendered possible by bilinear interpolation of the NWP data to the location of the mouse pointer.
The resulting quickly adjusting profile includes updated diagnostic parameters and mitigates the
problem of the static maps in Figure 14, that features not resolved by the widely spaced vectors, barbs
or hodographs, are invisible.

 Figure 12. Visualisation of 0–6 km bulk shear (contours and wind-barbs) and CAPE (colour scale).

Technical Memorandum No. 879 23
You can also read