Asymmetric random walks reveal that the chemotaxis network modulates flagellar rotational bias in Helicobacter pylori - eLife
←
→
Page content transcription
If your browser does not render page correctly, please read the page content below
RESEARCH ARTICLE

                                    Asymmetric random walks reveal that the
                                    chemotaxis network modulates flagellar
                                    rotational bias in Helicobacter pylori
                                    Jyot D Antani1, Anita X Sumali1, Tanmay P. Lele2,3, Pushkar P. Lele1*
                                    1
                                     Artie McFerrin Department of Chemical Engineering, Texas A&M University, 3122
                                    TAMU, College Station, Texas, 77843, USA; 2Department of Biomedical
                                    Engineering, Texas A&M University, College Station, TX, 77840, USA; 3Department
                                    of Translational Medical Sciences, Texas A&M University, Houston, Texas, 77030,
                                    USA

                                    Abstract The canonical chemotaxis network modulates the bias for a particular direction of
                                    rotation in the bacterial flagellar motor to help the cell migrate toward favorable chemical
                                    environments. How the chemotaxis network in Helicobacter pylori modulates flagellar functions is
                                    unknown, which limits our understanding of chemotaxis in this species. Here, we determined that
                                    H. pylori swim faster (slower) whenever their flagella rotate counterclockwise (clockwise) by
                                    analyzing their hydrodynamic interactions with bounding surfaces. This asymmetry in swimming
                                    helped quantify the rotational bias. Upon exposure to a chemo-attractant, the bias decreased and
                                    the cells tended to swim exclusively in the faster mode. In the absence of a key chemotaxis protein,
                                    CheY, the bias was zero. The relationship between the reversal frequency and the rotational bias
                                    was unimodal. Thus, H. pylori’s chemotaxis network appears to modulate the probability of
                                    clockwise rotation in otherwise counterclockwise-rotating flagella, similar to the canonical network.

                                    Introduction
*For correspondence:                Over half of the human population is colonized by the motile gram-negative bacteria, Helicobacter
plele@tamu.edu                      pylori. H. pylori infections have been implicated in peptic ulcers as well as non-cardia gastric cancer
                                    (Peek and Blaser, 2002). Infections are promoted by the ability of the bacterium to swim with the
Competing interests: The
                                    aid of helical appendages called flagella (Aihara et al., 2014; Ottemann and Lowenthal, 2002).
authors declare that no
                                    The flagellar filaments are rotated by transmembrane flagellar motors that repeatedly switch their
competing interests exist.
                                    direction of rotation. Owing to the unipolar location of the left-handed flagellar filaments
Funding: See page 15                (Constantino et al., 2016), counterclockwise (CCW) rotation of the motors causes the cell to run
Received: 11 October 2020           with the flagella lagging behind the body – a mode of motility termed as the pusher mode. The cell
Accepted: 12 January 2021           reverses with the body lagging the flagella when the motors switch the direction of rotation to clock-
                                    wise (CW). This mode of motility is termed as the puller mode (Lauga and Powers, 2009). Modula-
Reviewing editor: Agnese
Seminara, Université Côte
                                    tion of the reversals between the two modes enables the cell to undergo chemotaxis — migration
d’Azur, France                      toward favorable chemical habitats (Lertsethtakarn et al., 2011; Howitt et al., 2011; Johnson and
                                    Ottemann, 2018). The core chemotaxis network is similar to that in E. coli (Lertsethtakarn et al.,
   Copyright Antani et al. This
                                    2011; Abedrabbo et al., 2017; Lertsethtakarn et al., 2015; Lowenthal et al., 2009b;
article is distributed under the
                                    Pittman et al., 2001). Several components that form the flagellar motor are also similar to those in
terms of the Creative Commons
Attribution License, which          E. coli (Lertsethtakarn et al., 2011). How the chemotaxis network modulates flagellar functions in
permits unrestricted use and        H. pylori remains unknown (Lertsethtakarn et al., 2011; Lertsethtakarn et al., 2015; Jiménez-
redistribution provided that the    Pearson et al., 2005).
original author and source are         Switching in the direction of flagellar rotation is promoted by the binding of a phosphorylated
credited.                           response regulator, CheY-P, to the flagellar switch. In the canonical chemotaxis network,

Antani et al. eLife 2021;10:e63936. DOI: https://doi.org/10.7554/eLife.63936                                                        1 of 29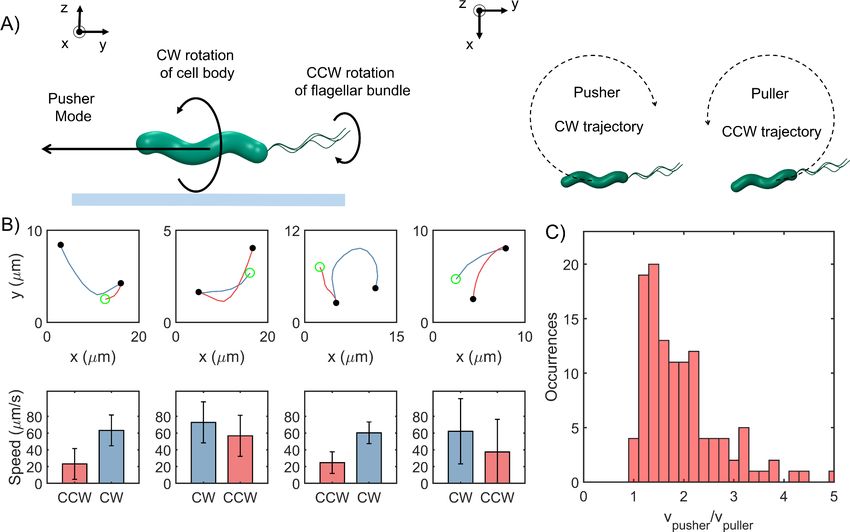
Research article                                                                                         Physics of Living Systems

                                    chemoreceptors sense extracellular ligands and modulate the activity of the chemotaxis kinase,
                                    which in turn modulates CheY-P levels. Increased CheY-P binding to the motor promotes CW rota-
                                    tion in an otherwise CCW rotating motor (Sourjik and Wingreen, 2012). The output of the flagellar
                                    switch is quantified by the fraction of the time that the motor rotates CW, termed CWbias
                                    (Block et al., 1983; Yuan et al., 2012; Yang et al., 2020). A decrease (increase) in CheY-P levels
                                    causes corresponding decrease (increase) in CWbias (Cluzel et al., 2000; Scharf et al., 1998). Thus,
                                    dynamic variations in the CWbias sensitively report changes in the kinase activity due to external stim-
                                    uli as well as due to the internal noise in the network (Cluzel et al., 2000; Korobkova et al., 2004).
                                    In contrast, the frequency at which motors switch their direction does not accurately represent
                                    changes in the chemotaxis output as the frequency decreases when CheY-P levels increase as well as
                                    when CheY-P levels decrease (Cluzel et al., 2000). Prior work has focused on the effects of extracel-
                                    lular ligands on the frequency of cell reversals (Collins et al., 2016; Machuca et al., 2017;
                                    Goers Sweeney et al., 2012; Rader et al., 2011; Sanders et al., 2013; Schweinitzer et al., 2008)
                                    rather than the motor bias. It is unknown whether the chemotaxis network in H. pylori modulates the
                                    rotational bias.
                                        In run-reversing bacteria, reversal frequencies can be readily quantified based on the number of
                                    reversals made by the swimming cell per unit time. To quantify the CWbias, the duration for which
                                    the cell swims in each mode needs to be determined by distinguishing between the two modes.
                                    However, discriminating between the swimming modes of single H. pylori cells is difficult owing to
                                    the technical challenges in visualizing flagellar filaments in swimmers (Constantino et al., 2016;
                                    Lowenthal et al., 2009a). A popular method to quantify the CWbias is by monitoring the rotation of
                                    tethered cells, where a single flagellar filament is attached to a glass surface while the cell freely
                                    rotates (Block et al., 1983). Alternatively, the bias is determined by sticking the cell to the surface
                                    and monitoring the rotation of a probe bead attached to a single flagellar filament (Ford et al.,
                                    2017; Yuan et al., 2010). Such single motor assays have been employed successfully in E. coli
                                    because the filaments are spaced apart on the cell body. In H. pylori, however, the flagella are dis-
                                    tributed in close proximity to one another at a single pole (Qin et al., 2017), increasing the likeli-
                                    hood of tethering more than one filament. Tethering of multiple flagella on the same cell eliminates
                                    rotational degrees of freedom, inhibiting motor function. Because of the limited measurements of
                                    the CWbias, crucial features of the signaling network, such as the dynamic range of signal detection,
                                    adaptation mechanisms, and the roles of key chemotaxis-related proteins, remain unknown in H.
                                    pylori.
                                        Here, we report a novel approach to measure the CWbias based on differences in the swimming
                                    speeds in the pusher and puller modes of H. pylori. We successfully employed this method to deter-
                                    mine the effect of a known chemoattractant and varying temperatures on the CWbias. Our observa-
                                    tions suggest that the CWbias decreases upon stimulation with an attractant, similar to the canonical
                                    model. The default direction of flagellar rotation is CCW and the presence of CheY increases the
                                    CWbias. The relationship between reversal frequencies and rotational bias is unimodal. These results
                                    are consistent with the notion that the chemotaxis network modulates the flagellar rotational bias (as
                                    well as the reversal frequencies) under environmental stimulus. Our quantitative model and simula-
                                    tions suggest that the basal chemotaxis output is likely tuned in H. pylori and other run-reversing
                                    bacteria to enhance diffuse spread. The approach discussed in this work provides a solid framework
                                    to study chemotaxis signaling and the behavior of the flagellar switch in H. pylori.

                                    Results
                                    Swimming speeds are asymmetric
                                    To determine the behavior of flagellar motors in H. pylori, we tracked cell motility in the bulk fluid
                                    with a phase contrast microscope. The positions of single cells were quantitatively determined from
                                    digital videos with the aid of particle tracking (see Materials and methods). Owing to the use of low
                                    magnification microscopy, we were able to observe several cells exhibiting reversals in the field of
                                    view. A representative cell trajectory at 37˚C is shown in Figure 1A (see another example in Video 1).
                                    With each reversal, the cell appeared to change from one mode of swimming to the other, although
                                    the modes could not be identified (as puller or pusher) because the flagella were not visible.
                                    Changes in the swimming modes were distinguished from rotational turns of the cell body – where

Antani et al. eLife 2021;10:e63936. DOI: https://doi.org/10.7554/eLife.63936                                                          2 of 29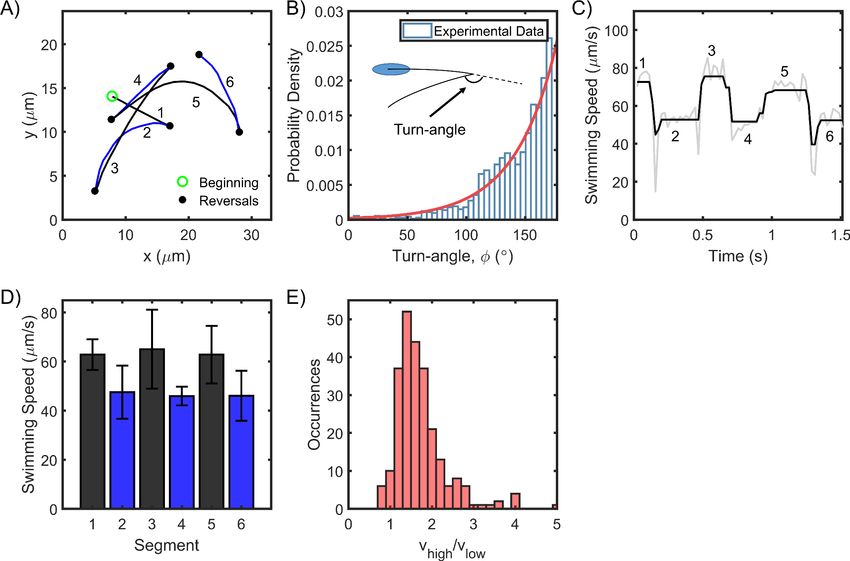
Research article Physics of Living Systems
Figure 1. H. pylori swim forward and backward at different speeds. (A) Representative swimming trace of a single bacterium. Each reversal is
represented by a filled circle. The beginning of the trajectory is denoted by an open circle. Uninterrupted swimming between two reversals was labeled
as a segment and the segments were numbered chronologically. (B) The turn angles were exponentially distributed (n = 1653 samples); reversals mostly
caused the cells to retrace their movements. (C) The swimming speed for a single cell over 1.5 s is indicated. The speeds alternated between high and
low values with each reversal. Raw data is indicated in gray; filtered data is indicated in black. (D) The mean speed for each segment is indicated
chronologically. Standard deviations are indicated. (E) The mean speed for the high (low) mode for each cell was calculated by averaging over all its
high- (low-) speed segments. The distribution of the ratios of the high and low mean speeds for each cell is indicated. The mean ratio was 1.5 ± 0.4
(n = 250 cells).
The online version of this article includes the following source data for figure 1:
Source data 1.
the swimming mode remains unchanged – by visually inspecting each reversal for each cell. The turn
angle between the original direction just before and the new direction just after a reversal (
) fol-
lowed an exponential distribution with a peak
~180˚ (Figure 1B), indicating that cells simply
retraced their paths for brief durations following
each reversal. The flick of the flagellum that
causes turn angles to be distributed ~90˚ in
another run-reversing species Vibrio alginolyticus
(Stocker, 2011), is unlikely to occur in H. pylori.
The distance traveled between any two reversals
was identified as a segment and numbered
Video 1. A representative cell exhibits reversals within (Figure 1A). The swimming speeds over six con-
the field of view (movie has been slowed 3X).
secutive segments are indicated in Figure 1C.
https://elifesciences.org/articles/63936#video1
Antani et al. eLife 2021;10:e63936. DOI: https://doi.org/10.7554/eLife.63936 3 of 29
Research article                                                                                         Physics of Living Systems

                                    The speeds were binned as per the segments, yielding n+1 bins for n reversals. The mean speed
                                    from each bin was plotted for all the n+1 bins (Figure 1D). Mean speeds in alternate bins were anti-
                                    correlated: each reversal either decreased or increased the speed. This suggested that the speeds in
                                    the two modes were unequal. Such anti-correlation was consistently observed in a large population
                                    of cells (n = 250). The distribution of the ratio of their mean speeds in the fast and slow modes is
                                    shown in Figure 1E. The speed in the fast mode was ~1.5 times the speed in the slow mode.

                                    Cell swims faster in the pusher mode
                                    A recent study attempted to visualize the flagella in H. pylori with high-magnification microscopy,
                                    and suggested that the cells swim faster in the pusher mode. However, the sample sizes were
                                    severely limited by the difficulties in visualizing flagella on the swimmers (Constantino et al., 2016).
                                    To conclusively determine the faster mode in H. pylori, we exploited the hydrodynamic coupling
                                    between swimmers and glass boundaries. Cells that swim very close to an underlying solid boundary
                                    exhibit circular trajectories owing to the increased viscous drag on the bottom of the cell and the fla-
                                    gellar filaments. CCW rotation of the left-handed helical filament causes the pusher to experience a
                                    lateral force that promotes CW circular tracks (Figure 2A, DiLuzio et al., 2005; Lauga et al., 2006).
                                    The situation is reversed when the filaments rotate CW. Thus, it is possible to discriminate between
                                    the two modes when a bacterium swims near a surface. We analyzed each cell that swam in circular
                                    trajectories near the surface and determined the mean speeds for the two directions. The cells were
                                    viewed from the bulk fluid, as indicated in Figure 2A (right panel). Four sample trajectories are
                                    shown in Figure 2B. For each cell, the CW trajectories were always faster relative to the CCW trajec-
                                    tories, indicating that the pusher mode was the faster mode (Figure 2C). This was confirmed over
                                    n = 116 cells; the mean ratio of the speeds of the CW trajectories to that of the respective CCW tra-
                                    jectories was ~1.6 ± 0.5 (Figure 2D).

                                    Partitioning of swimming speeds enables estimation of chemotaxis
                                    response to attractants
                                    As H. pylori rotate their flagella CW in the puller mode, the CWbias could be calculated from the frac-
                                    tion of the time that the cells swam slower (see Materials and methods). This method worked for all
                                    the cells that reversed at least once in the field of view: the faster and slower modes could be dis-
                                    criminated from each other based on comparisons between the mean speeds before and after a
                                    reversal (as shown in Figure 1D). These cells consisted ~81% of the total data. The remaining cells
                                    did not reverse under observation; they persisted in a particular direction before exiting the field of
                                    view. Hence, these cells were termed as single-mode swimmers. As the mode of swimming could
                                    not be readily determined for these cells, those data were grouped into cells that swam near the sur-
                                    face for at least some time and those that did not. In the former group of cells, the majority was
                                    identified as pushers based on the direction of their circular trajectories near surfaces, as discussed
                                    in Figure 2. About 8% of the cells could not be identified and were excluded from the analysis. The
                                    distribution of the bias is shown in Figure 3A. The bias was similar to that observed in E. coli
                                    (Block et al., 1983; Segall et al., 1986; Ford et al., 2018; Sagawa et al., 2014; Block et al., 1982;
                                    Stock et al., 1985), suggesting that the basal chemotactic output in the two species is similar. As
                                    evident, most cells tended to rotate their motors CCW for a higher fraction of time.
                                       Next, we imaged swimmers belonging to a cheY-deleted strain and observed that the trajectories
                                    of cells near a surface were exclusively CW circles. More than 150 cells were observed near surfaces
                                    and they exhibited CW trajectories. A fraction of the data is shown in Figure 3B and in Appendix 1—
                                    figure 1. This suggested that the default direction of flagellar rotation is CCW, similar to E. coli
                                    (Ford et al., 2018; Liu et al., 2020). Considering that the bias is zero in the absence and ~0.35 in
                                    the presence of CheY, CheY-P binding likely promotes CW rotation in an otherwise CCW rotating
                                    motor in H. pylori.
                                       To test the idea that the chemotaxis network modulates the rotational bias, we employed our
                                    technique to quantify changes in the CWbias in swimmers when stimulated by a chemical attractant.
                                    We stimulated cells by adding them to a bath of urea (20 mM in motility buffer-MB, see Materials
                                    and methods), which is a potent chemoattractant for H. pylori (Huang et al., 2015). Following expo-
                                    sure to the attractant, the majority of the cells swam exclusively in the pusher mode – their post-
                                    stimulus CWbias was ~0 (Figure 3C). The reversal frequency also decreased in response to the

Antani et al. eLife 2021;10:e63936. DOI: https://doi.org/10.7554/eLife.63936                                                          4 of 29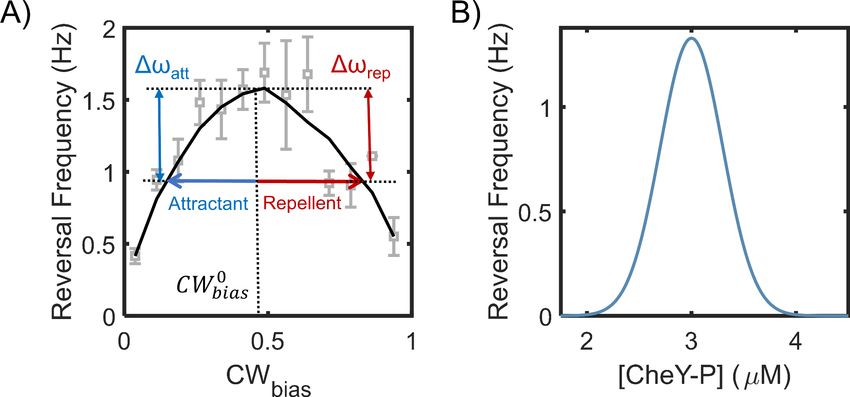
Research article                                                                                                     Physics of Living Systems

Figure 2. Cells swim faster in the pusher mode. (A) The viscous drag on the bottom of the cell body and the flagellar filament is higher near an
underlying surface (indicated by the blue line in the left panel). The drag is lower on the top half of the body and filament. This difference in drag
causes a lateral thrust on the cell, giving rise to circular trajectories: CW trajectory in the pusher mode and CCW trajectory in the puller mode (right
panel). (B) Top row: Blue segments indicate CW trajectories; red segments indicate CCW trajectories. Filled circles indicate reversals; open circle
indicates the beginning of the trajectory. Bottom row: The corresponding mean speeds and standard deviations are indicated for the two trajectories:
CW tracks were always faster than CCW tracks. (C) The distribution of the ratio of the speeds along the pusher and puller modes is indicated (n = 116
cells). The mean ratio = 1.6 ± 0.5.
The online version of this article includes the following source data for figure 2:
Source data 1.

                                     chemo-attractant (Figure 3D), which is in agreement with previous reports (Machuca et al., 2017;
                                     Perkins et al., 2019). In comparison, the post-stimulus CWbias in swimmers exposed to MB-only
                                     (control case) did not change significantly and continued to exhibit both modes of motility
                                     (Figure 3C,D). These observations are consistent with the notion that a reduction in the kinase activ-
                                     ity upon the sensing of chemo-attractants inhibits the rotational bias of flagellar motors, similar to
                                     how the chemotaxis network modulates the response of E. coli to attractants (Block et al., 1983).

                                     Effect of thermal stimuli on chemotactic output
                                     Several studies have characterized motility and chemotaxis in H. pylori at room temperatures
                                     (Constantino et al., 2016; Howitt et al., 2011; Martı́nez et al., 2016). Here, we explored how
                                     changes in the surrounding temperatures modulated the flagellar output in H. pylori. We recorded
                                     cell motility at different temperatures. The recording began ~5–10 min after each temperature
                                     change to provide adequate time for transient processes to stabilize (see Materials and methods for
                                     additional information). The mean pusher and puller speeds trended upwards with the temperature
                                     (Figure 4A, left panel), presumably through modulation of proton translocation kinetics that power

Antani et al. eLife 2021;10:e63936. DOI: https://doi.org/10.7554/eLife.63936                                                                      5 of 29
Research article Physics of Living Systems Figure 3. Asymmetric swimming speeds enable quantification of chemotaxis output. (A) CWbias was determined at 37˚C in the absence of chemical stimulants. Cell trajectories with durations of 1 s or more were considered for calculation. The distribution was obtained from n = 240 cells. A Gaussian fit to the switching population (n = 212 cells) yielded CWbias = 0.35 ± 0.23 (mean ± standard deviation). (B) Single-cell trajectories of a DcheY mutant are indicated. Cells swam in CW-only trajectories, which indicate CCW flagellar rotation. Open green circles denote the start of a trajectory; filled red circles denote the end. The trajectories were spatially displaced to group them for the purpose of illustration and truncated to show the direction of rotation. Full trajectories and additional cells are included in Appendix 1—figure 1. (C) The post-stimulus CWbias was monitored for ~30–60 s immediately following exposure to 20 mM urea (n = 20 cells); 14 cells swam exclusively in the pusher mode during the period of observation and displayed CW-only trajectories near surfaces. In the control case, cells were exposed to the buffer-only. The average post-stimulus CWbias was 0.31 ± 0.04 (mean ± standard error, n = 20 cells). The difference in the mean bias for the attractant and the control cases was significant (p-value
Research article                                                                                                   Physics of Living Systems

Figure 3 continued
The online version of this article includes the following source data for figure 3:
Source data 1.

                                       the motor (Yuan and Berg, 2010). The ratio of the speeds in the two modes appeared to be inde-
                                       pendent of the temperature (Figure 4A, right panel). These responses are consistent with experi-
                                       ments in E. coli that show a strong influence of temperatures on the rotational speeds of the
                                       flagellar motor (Yuan and Berg, 2010; Turner et al., 1996; Turner et al., 1999).

Figure 4. Steady-state chemotactic output is independent of temperature. (A) Left: Swimming speeds for each mode are plotted (mean ± standard
deviation) for different temperatures. The speeds increased with temperature till 37˚C, after which they plateaued. The shaded regions indicate
standard deviation. Right: The ratios of the pusher and puller speeds are independent of the temperatures, as indicated. A red horizontal line indicates
the median ratio at each temperature, and the bottom and top borders of the encompassing box indicate the 25th and 75th percentiles. The extended
lines span 99.3% of the data and the dots indicate outliers. (B) Mean CWbias (open squares) and mean reversal frequencies (filled circles) are plotted
over a range of temperatures. The switching frequency was at a maximum at the physiological temperature (37˚C) and decreased at higher and lower
temperatures. The CWbias increased with the temperature and plateaued above 30˚C. The mean values are indicated with standard error. Each data-
point was averaged over n  80 cells. (C) The relationship between reversal frequency and CWbias is indicated. The values were obtained from the
combined datasets over the entire range of temperatures that we studied (n = 972 cells). The CWbias was binned (bin size = 0.05), and the mean
reversal frequency for each bin was estimated. The mean and standard errors are indicated in grey. The black curve is a guide to the eye. (D) The
estimated ratio of the CheY-P dissociation constant (K) and the intracellular CheY-P concentrations (C) is indicated as a function of the temperature.
The ratios were calculated from the data in (B) following a previous approach (Turner et al., 1999). The number of binding sites for CheY-P in H. pylori
~ 43 was estimated from the relative sizes of the flagellar C-ring (see Appendix 2 and Qin et al., 2017). The ratio of the dissociation constants for the
CCW and the CW motor conformations was assumed to be similar to that in E. coli (~ 4.7 from Fukuoka et al., 2014).
The online version of this article includes the following source data for figure 4:
Source data 1.

Antani et al. eLife 2021;10:e63936. DOI: https://doi.org/10.7554/eLife.63936                                                                      7 of 29
Research article Physics of Living Systems
The frequency of reversals increased steadily with temperature up to 37˚C, whereas the steady-
state CWbias varied weakly with temperature (Figure 4B). At room temperatures, the CWbias was the
lowest, indicating that the cells mostly prefer to swim in the pusher mode. Next, we combined our
data over the entire range of temperatures (25–43˚C) and for each cell, plotted the reversal fre-
quency against its CWbias. The reversal frequency was maximum at ~0.4 CWbias and decreased on
either side (Figure 4C); also see Appendix 3—figure 1. As our results suggest that CheY-P binding
increases the CWbias (Figure 3B,C), this also means that the reversal frequency has a similar unimo-
dal dependence on CheY-P levels. Hence, we propose that changes in the reversal frequency in H.
pylori cannot provide accurate information about the effect of stimulants on the kinase activity (i.e.
whether a stimulant increases or decreases the activity). On the other hand, the rotational bias is
likely a better measure of the kinase activity, similar to that in E. coli.
In E. coli, flagellar switching has been well described by a two-state model, where the binding of
phosphorylated CheY (CheY-P) to the flagellar switch stabilizes the CW conformation (Turner et al.,
1999). In the absence of CheY-P, the probability of observing CW rotation in an otherwise CCW-
rotating motor decreases with increasing temperatures (Turner et al., 1996). The chemotaxis net-
work itself adapts such that the steady-state levels of CheY-P are independent of the temperatures
(Paulick et al., 2017). Assuming that CheY-P levels are also independent of the temperature in H.
pylori, the relative insensitivity of the rotational bias in Figure 4B suggested that the dissociation
constant for CheY-P/switch interactions likely decreased with rising temperatures. Following the
thermodynamic analysis of Turner and co-workers for a two-state flagellar switch (Turner et al.,
1999), we calculated the dissociation constant normalized by CheY-P levels, as shown in Figure 4D
(see Appendix 2 for details). Assuming that the CheY-P levels are ~3 mM (Cluzel et al., 2000), we
estimate the dissociation constant to be ~9 mM at 37˚C.
Speed asymmetry promotes diffusion
Even without chemotaxis, motility enhances the spread of bacteria, lending a significant advantage
over immotile bacteria in exploring three-dimensional spaces (Josenhans and Suerbaum, 2002).
Bacterial motion becomes uncorrelated over long times and large length-scales in the absence of a
signal. Several previous works have modeled the diffusion of motile bacteria by assuming that the
reversal wait-times are exponentially distributed (Berg, 1993; Lovely and Dahlquist, 1975;
Lauga, 2016; Theves et al., 2013). The wait-time refers to the time between two consecutive rever-
sals. In some bacterial species that exhibit runs and reversals, the wait-time is Gamma distributed
(Theves et al., 2013; Morse et al., 2016; Xie et al., 2011). The assumption of exponentially distrib-
uted wait-times leads to inaccurate predictions in such species (Theves et al., 2013).
Our cell-tracking analysis revealed that the reversal wait-times were Gamma distributed in H.
pylori (Figure 5A, also see separate distributions for the two swimming modes in Appendix 3—fig-
ure 2). When calculating the wait-times, we excluded the beginning of each cell-trajectory just
before the first reversal and the end of each cell-trajectory just after the final reversal. To derive an
explicit expression for the diffusivity of asymmetric run-reversers that exhibit Gamma distributed
reversal intervals, we preferred to modify a previous approach developed for symmetric run-revers-
ers (Großmann et al., 2016) rather than a more general model (Detcheverry, 2017) – see Appendix
4 for details. Briefly, the velocities of a bacterium that swims at v0 mm/s in its slower mode was
expressed as: vðtÞ ¼ v0 hðt Þ ½1 þ aH ðhÞeðt Þ. The direction of swimming was described by the function
hðtÞ, which alternated between +1 and 1 with each reversal (Figure 5B). A Heaviside function, H ðhÞ
and the asymmetry parameter, a, characterized the magnitudes of the speeds in the two directions:
v0 and a. The CWbias was assumed to be constant (= 0.5) for simplicity.
The deviation of the cell from a straight line during a run (or reversal) occurred due to rotational
pffiffiffiffiffiffiffiffi
diffusion, described by d dt ¼ 2D ðt Þ. White noise characteristics were hðt Þi ¼ 0, and
hðt Þðt þ t Þi ¼ dðt Þ, where D is the rotational diffusion coefficient. Another randomizer of the bac-
terial walk is the turn angle,
, which is the angle between the original direction just before and the
new direction just after a reversal. The turn angle is likely influenced by kinematic properties: cell
shape, filament bundling dynamics, and the flexibility of the flagellar hook. After taking into account
the specific form of the reversal wait-time distribution for H. pylori (Figure 5A), we obtained the fol-
lowing expression for the asymptotic diffusion coefficient from the velocity correlation over long-
times:
Antani et al. eLife 2021;10:e63936. DOI: https://doi.org/10.7554/eLife.63936 8 of 29Research article Physics of Living Systems
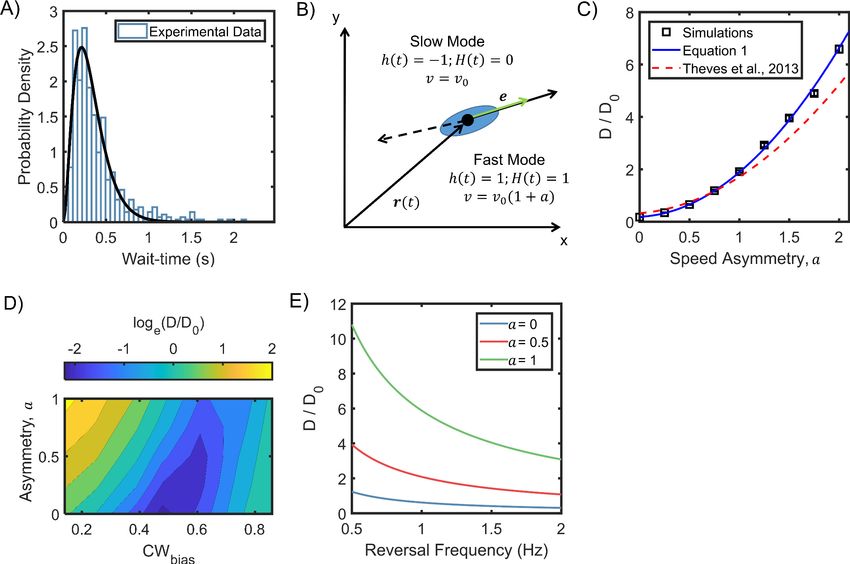
Figure 5. Asymmetric random walks in a run-reversing bacterium. (A) Experimentally observed wait-time intervals for runs and reversals obey a Gamma
distribution (n = 515 samples): the shape and scale parameters were k = 2.92 ± 0.06 and = 0.11 ± 0.00, respectively. (B) Cell swims at v0 mm/s in the
puller (slower) mode, and at v0 ð1 þ aÞ mm/s in the pusher (faster) mode. The symmetric case is described by a = 0, where the run and reverse speeds
are equal. Cell alignment is described by the unit vector e. (C) The diffusion coefficients predicted from equation 1 are indicated as a function of the
asymmetry in speeds (blue curve). An alternate model that assumes exponentially distributed wait-time intervals in asymmetric swimmers under
predicted the diffusivity, as shown by the dotted curve (Theves et al., 2013). Symbols indicate coefficients calculated from simulation runs (see
Appendix 5). The parameters were based on experimental measurements: mean wait-time = 0.3 s, a = 0.86, and v0 ¼ 25 mm/s. D = 0.02 s 1 from
(Großmann et al., 2016). Diffusion coefficients have been non-dimensionalized with D0 ¼ v20 =3!p ( Lovely and Dahlquist, 1975), where !p is the mean
reversal frequency at the physiological temperature (Figure 4B). (D) Diffusion coefficients were calculated from simulations of cell motility in the
absence of a stimulus over a range of a and CWbias values (see Appendix 5 for details). The diffusion coefficients were normalized with D0 . The sum of
the mean wait-times (CW and CCW) was fixed at 0.35 s. (E) Predicted diffusivity is indicated over a range of typical reversal frequencies. Here, a = 0.86
and D = 0.02 s 1.
The online version of this article includes the following source data for figure 5:
Source data 1.
2 ! 93
ð3!Þ3
8
> ! >
>
> 1 1 3
>
>
D ð þ Þ
6 7
3! D
> >
2 >
>
6 ð1 þ aÞ þ1
6 < =7
7
6 2 7
6 2 > 2 3 ð 3! þ D Þ 3
ð 3!Þ 3 > 7
2 6
v 6
>
> j h cos
ij ! ð 3! Þ >
> 7
D¼ 0 6 :þ
> >
(1)
> > 7
D 3 6 2 6 ;
2D 6 ð3! þ D Þ ð3! þ D Þ jhcos
ij ð3!Þ
7
7
6 8 2
9 7
6 3 3 7
6 >
= 7
4 ð1 þ a Þ
6 7
6 2 6
5
>
: D ð3! þ D Þ jhcos
ij ð3!Þ ; >
Antani et al. eLife 2021;10:e63936. DOI: https://doi.org/10.7554/eLife.63936 9 of 29Research article Physics of Living Systems
The reversal frequency is indicated by w. The expression correctly reduces to that for the symmet-
ric swimmer (Großmann et al., 2016), for a (¼ jhcos
ij) = 1, and a = 0.
As shown in Figure 5C, the diffusion coefficients increased with the asymmetry-parameter, a. As
per the predictions, asymmetric run-reversers (a 6¼ 0) spread faster than symmetric run-reversers
(a = 0). Next, we carried out stochastic simulations of 1000 cells that underwent asymmetric run-
reversals with Gamma distributed intervals (see Appendix 5). The diffusion coefficients from the sim-
ulations matched predictions from our model that incorporated Gamma distributed wait-times. Hav-
ing validated our simulations, we estimated the diffusion coefficients for arbitrary CWbias values over
varying a. As shown in Figure 5D, the simulated diffuse spread was low when cells covered similar
distances in the forward and backward directions, thereby minimizing net displacement. This tended
to occur for swimmers with low a values that swam for equal durations in the two directions
(CWbias ~ 0.5). For any given a, the diffuse spread increased with the net displacement during a run-
reversal, for example, when the swimmer preferred the slower mode much more than the faster
mode. The net displacement, and hence, the spread tended to be the highest when the cells spent
a greater fraction of the time swimming in the faster mode compared to the slower mode. Thus, in
H. pylori, the tendency to spend more time in the faster pusher mode (basal CWbias ~ 0.35,
Figure 3A) is advantageous (Figure 5D). This advantage is amplified by increasing pusher speeds
relative to the puller speeds. However, a very low basal value of the CWbias is disadvantageous from
a chemotaxis perspective. H. pylori appear to respond to attractants by reducing their CWbias
(Figure 3C). They would lose their ability to respond to attractants if the pre-stimulus (basal) bias
was close to its minimum value (=0). It is possible, therefore, that the basal activity of the chemotaxis
network is optimized in asymmetrically run-reversing bacteria to promote higher diffusive spread
while retaining the ability to respond to chemical stimuli.
Finally, longer durations of runs and reversals helped cells cover larger distances. Thus, the diffu-
sion coefficient was inversely dependent on the run-reversal frequency (Figure 5E). As the reversal
frequencies reach a maximum at 37˚C (Figure 4B), it is possible that cells at physiological tempera-
tures spread slower in a niche over long times, providing more time for cells to adhere to surfaces.
Discussion
H. pylori experience physiological temperatures (~37˚C) in their human hosts. Here, we characterized
flagellar functions at physiologically relevant temperatures. Our experiments with a mutant lacking
cheY showed that the flagellar motors in H. pylori rotate CCW by default (Figure 3B). At native
CheY-P levels, motors in wild-type cells spent about 35% of the time rotating CW (Figure 3A) –
thus, the probability of CW rotation increases with CheY. Our experiments further showed that treat-
ment of wild-type cells with a potent attractant (urea) decreased the rotational bias (CWbias). These
results are consistent with a model in which the chemotaxis network controls the levels of CheY-P to
modulate the probability of CW rotation in an otherwise CCW rotating flagellar motor. If so, then
the chemotaxis networks in the two species, E. coli and H. pylori, modulate flagellar functions in a
similar manner.
Earlier works focused exclusively on the effect of chemoeffectors on steady-state reversal fre-
quencies in H. pylori to characterize chemotaxis responses (Collins et al., 2016; Machuca et al.,
2017; Goers Sweeney et al., 2012; Rader et al., 2011; Sanders et al., 2013; Schweinitzer et al.,
2008). Because diffusion scales inversely with the reversal frequency (Figure 5E), increases in fre-
quency might help a cell linger in a niche. However, mere variations of the steady-state reversal fre-
quencies with the local stimulant concentrations (or temperatures) does not enable chemotaxis
(Berg, 1993). By combining data collected over a range of temperatures, we showed that the
dependence of the reversal frequency on the rotational bias is unimodal (Figure 4C). This means
that the reversal frequency does not have a unique value with respect to the rotational bias (other
than at maximal frequency), similar to that in E. coli (Figure 6A). Hence, the reversal frequency value
is also unlikely to be unique with respect to the kinase activity (the corresponding relationship in E.
coli is depicted in Figure 6B). Therefore, changes in the reversal frequencies by themselves are
unlikely to accurately report changes in the chemotaxis output in H. pylori. Our results suggest that
the rotational bias must be quantified to accurately determine the chemotaxis output in H. pylori.
Our model for diffusive spread of motile bacteria indicated that run-reversing bacteria that
undergo asymmetric random walks diffuse faster than symmetric run-reversers (Figure 5C). This is
Antani et al. eLife 2021;10:e63936. DOI: https://doi.org/10.7554/eLife.63936 10 of 29Research article Physics of Living Systems
Figure 6. Motor reversal (switching) frequencies versus CWbias and CheY-P. (A) The dependence of motor reversal frequencies in E. coli on the CWbias
is unimodal (Montrone et al., 1998), similar to H. pylori (Figure 4B). The symbols indicate experimental data from Montrone et al., 1998. The black
curve is a guide to eye. The blue and red arrows indicate the effect of attractants and repellents on the CWbias, respectively. The corresponding
changes in the reversal frequency are similar (Dwatt ~ Dwrep). (B) The dependence of switching frequency on CheY-P levels is also unimodal in E. coli
(Cluzel et al., 2000). Thus, an attractant as well as a repellent can induce a drop in the frequency.
expected, as symmetric run-reversals tend to minimize net displacements. Simulations of bacterial
diffusion in the absence of stimulants indicated that the diffusive spread is higher in asymmetric run-
reversers when the cells spend a greater fraction of the time swimming in the faster mode compared
to the slower mode. Thus, the preference for the faster pusher mode (lower CWbias) in H. pylori is
advantageous as it helps them spread faster (Figure 5D). However, H. pylori appear to respond to
attractants by reducing their CWbias (Figure 3C). A very low value of the basal bias would inhibit the
ability to respond to attractants entirely. Hence, we propose that the basal activity of the chemotaxis
network is probably tuned to promote higher diffusive spread while optimizing chemotaxis perfor-
mance. In general, asymmetry in swimming – differences in swimming speeds or differences in the
amount of time spent in any one mode or both – may provide evolutionary benefits to run-reversing
bacteria by enhancing their spread.
The response of the chemotaxis network to external stimuli is conventionally measured by deter-
mining the rotational bias (Block et al., 1983; Yang et al., 2020; Lele et al., 2015; Jasuja et al.,
1999). Tethering cells to glass surfaces is the preferred method of determining the rotational bias.
This approach is only useful when one can ascertain that the filament has adhered to the surface, for
example with the use of antiflagellin antibodies that irreversibly link the filament to the surface. How-
ever, some studies may forego the use of antibodies when determining the bias. This is problematic
as the cell can appear to be tethered but instead it pivots about its non-flagellated pole on a surface
while the free rotation of the invisible filament causes the cell to rotate. This can lead to the mischar-
acterization of the direction of flagellar rotation, and therefore the rotational bias (Dominick and
Wu, 2018; Lele et al., 2016; Chawla et al., 2020). Alternately, the signaling output has been deter-
mined via Förster resonance energy transfer-based measurements of in vivo enzymatic reactions
(Sourjik et al., 2007). But, neither of these approaches has been realized in H. pylori. Here, we char-
acterized the rotational bias based on the asymmetry in the swimming speeds. Our use of low-mag-
nification microscopy allowed us to collect large sample sizes to characterize flagellar functions,
considerably improving on earlier efforts (Constantino et al., 2016).
Antani et al. eLife 2021;10:e63936. DOI: https://doi.org/10.7554/eLife.63936 11 of 29Research article Physics of Living Systems
To prevent the cell from tumbling during a reversal, all the flagellar motors in a single cell of H.
pylori must switch synchronously from one direction to the other. Indeed, tumbles were rarely
observed. The most frequent turn angles were ~180˚, which confirmed that the cells retraced their
paths following a reversal – this would not have been the case if only a fraction of the motors
switched to the opposite direction. This makes our approach feasible for determining the CWbias for
an individual cell from its swimming speeds – which reflects the collective action of all the motors –
rather than sampling individual motors. How are such multiple stochastic switchers coupled in H.
pylori? One possibility is that the flagellar switch in H. pylori is ultrasensitive to small fluctuations in
CheY-P levels, similar to the switch in E. coli (Cluzel et al., 2000). The close proximity of the multiple
motors at a single pole in H. pylori also means that the local concentration of CheY-P in the vicinity
of each flagellar switch is similar. This increases the probability of concerted switching in all the
motors.
In V. alginolyticus, asymmetry in swimming speeds has been observed only near bounding surfa-
ces but not in the bulk fluid (Magariyama et al., 2005). A limitation of our method is that it is unsuit-
able for tracking chemotaxis response dynamics in such species, as the asymmetry is lost whenever
the cells migrate away from surfaces. In H. pylori, although, we observed asymmetric speeds in
some cells even at a separation of ~200 mm from any bounding surfaces (see Appendix 6), similar to
Pseudomonas putida (Theves et al., 2013). Therefore, the asymmetry is unlikely to be a surface-
effect in H. pylori. The effect could be due to differences in the flagellar shape and forms
(Kinosita et al., 2018) or the swimming gait in the pusher and puller modes (Lele et al., 2016;
Liu et al., 2014). It is more likely that the asymmetry in speeds arises due to the differences in the
CW and CCW flagellar rotational speeds, as is the case with E. coli – which run and tumble – and
Caulobacter cresecentus (Yuan et al., 2010; Lele et al., 2016) – which exhibit symmetric swimming
speeds in the pusher and puller modes (Table 1). Such differences in the speeds at which motors
rotate CW and CCW depend on the external viscous loads (Yuan et al., 2010; Lele et al., 2016). It
is possible therefore, that the asymmetry in H. pylori is also load-dependent; vanishing for longer fil-
ament lengths in highly viscous microenvironments or for very short filaments. The asymmetry is fur-
ther expected to depend sensitively on the expression of the flagellar genes, which is modulated by
environmental conditions (Spohn and Scarlato, 1999). The asymmetry was prominently observable
in our work with a careful control of experimental conditions (Materials and methods).
The flagellar motors in H. pylori and E. coli share structural similarities and have several ortholo-
gous components. The core chemotaxis network in the two species is also similar with the exception
of a few enzymes (Lertsethtakarn et al., 2011; Howitt et al., 2011; Lertsethtakarn et al., 2015;
Jiménez-Pearson et al., 2005). CheY, in its phosphorylated form, modulates flagellar functions in
both species by interacting with components of the flagellar switch (Lertsethtakarn et al., 2011;
Lowenthal et al., 2009a; Qin et al., 2017; Lam et al., 2010). Our results suggest that the regulatory
function of CheY-P is also similar in the two species, that is, CheY-P binding to the motor increases
the probability of CW rotation. If so, then the implications of this finding are significant. Because H.
pylori can retrace their paths upon a reversal unlike E. coli, modulation of the rotational bias is
bound to undermine chemotaxis when the cell enters the puller mode. Then, the cell would likely
need a mechanism to rectify its movements with respect to the source or some type of feedback
between the motors and the receptors to successfully migrate in response to chemical gradients.
We anticipate that the approaches described in this work will help uncover these mechanisms and
Table 1. Speed asymmetry across different bacterial species.
Species Swimming Speed Ratio Motor Speed Ratio Reference
H. pylori 1.5 - This work
P. putida 2 - Theves et al., 2013
V. alginolyticus 1.5 - Magariyama et al., 2005
Burkholderia spp. 3.9 - Kinosita et al., 2018
Vibrio fischeri 3.4 - Kinosita et al., 2018
C. crescentus 1 ~2 Lele et al., 2016; Liu et al., 2014
E. coli ~1.3 1.3 Yuan et al., 2010; Lele and Berg, 2015
Antani et al. eLife 2021;10:e63936. DOI: https://doi.org/10.7554/eLife.63936 12 of 29Research article Physics of Living Systems
identify unknown protein functions. Our approach is extensible to any run-reversing species that
exhibit asymmetric swimming speeds, paving the way to study signaling dynamics in other run-
reversing bacterial species.
Materials and methods
Key resources table
Reagent type (species)
or resource Designation Source or reference Identifiers Additional information
Cell line (H. pylori) PMSS1 Ottemann Lab Arnold et al., 2011
Chemical compound, drug Brucella Broth Millipore Sigma B3051
Chemical compound, drug Columbia agar Thermo Scientific Oxoid CM0331
Chemical compound, drug Defibrinated Horse Blood Hemostat Laboratories DHB100
Chemical compound, drug Fetal Bovine Serum Gibco 10438
Chemical compound, drug Polymixin-B sulfate Alfa Aesar J6307403
Chemical compound, drug Vancomycin hydrochloride Sigma Aldrich V1130
Chemical compound, drug b-Cyclodextrin Sigma Aldrich C4767
Chemical compound, drug Urea Fisher Scientific BP169
Strains and cell culturing
All the work were done with H. pylori PMSS1. Cultures of microaerophilic H. pylori were grown in an
incubator with controlled temperature and CO2 environment (Benchmark Incu-Shaker Mini CO2).
The incubator was maintained at 10% CO2, 37˚C. Fresh colonies were streaked out before each
experiment on Columbia agar plates supplemented with 2.5 units/mL Polymixin-B, 10 mg/mL Vanco-
mycin, 2 mg/mL b-cyclodextrin, and 5% v/v defibrinated horse blood. Colonies appeared on the
horse-blood agar plates within 3–4 days and were picked with the aid of sterilized cotton-tipped
applicators. The cells were then inoculated in 5 mL of BB10 (90% Brucella Broth + 10% Fetal Bovine
Serum) to grow overnight cultures. No antibiotics were added to the liquid cultures as per previous
protocols (Machuca et al., 2017; Huang et al., 2017). Overnight cultures were grown for ~16 hr to
an OD600~0.25–0.5 and diluted to OD600~0.1 in fresh BB10. The day cultures were grown to an
OD600~0.125–0.15 in the shaker incubator set at 170 rpm under 10% CO2 and at 37˚C. Prior to imag-
ing, the cells were diluted in a motility buffer (MB- 0.01 M phosphate buffer, 0.067 M NaCl, and 0.1
mM EDTA, pH~7.0) at ~6–7% v/v (BB10/MB).
Motility assays
Cells were imaged in a culture-dish (Delta T system, Bioptechs Inc) on a phase-contrast microscope
(Nikon Optiphot) equipped with a 10X phase objective. The dish was kept covered with a lid that
was not airtight and that allowed a part of the top liquid surface to be exposed to air. Videos were
recorded with a CCD camera (IDS model UI-3240LE) at 45 frames per second. Unless otherwise
specified, the objective was focused ~5–20 mm away from the bottom surface of the culture-dish. All
experiments were performed at 37˚C unless otherwise noted.
Temperature control
The microscope was housed inside a temperature control chamber (ETS Model 5472, Electro-Tech
Systems, Inc), which enabled precise control over the temperature during the experiments. The
grown cultures were stored in flasks within the chamber. Prior to each measurement, ~50 mL of cells
were diluted in ~1.3–1.5 mL of MB. The entire mixture was then transferred to the culture dish and
covered with the lid. As the cell density was low (~4 106 cells/mL) and as the liquid surface was
exposed to air, oxygen gradients were minimized; the cells remained motile in MB for over an hour.
In the case of the temperature variation experiments, the cells were visualized in the dish ~5–10
min after each change in the temperature. Once recording was completed, the contents of the cul-
ture dish were emptied. The dish was then flushed with ethanol followed by copious amounts of DI
Antani et al. eLife 2021;10:e63936. DOI: https://doi.org/10.7554/eLife.63936 13 of 29Research article Physics of Living Systems
water outside the chamber. The dish was then reused for further experiments. The whole cycle was
repeated each time the temperature was changed.
Chemoattractant response
We filled the culture dish with 20 mM urea (Fisher Chemical) in MB at 37˚C, which served as an
attractant. In the control case, no urea was added to the MB in the dish. We pipetted 50 mL of the
cell culture into the dish prior to imaging. Videos were recorded and analysis was performed on the
videos once the hydrodynamic flows visually subsided (~30 s).
Data analysis
The low cell density enabled us to employ particle-tracking methods to record the swimming trajec-
tory of each cell (Ford et al., 2017). All the videos were analyzed with custom-written MATLAB
codes based on centroid-detection-based particle-tracking routines (Crocker and Grier, 1996). The
experimental data shown in Figure 3C,D and Figure 4 were obtained from two biological and multi-
ple technical replicates. All other data were collected from five or more biological and multiple tech-
nical replicates.
CWbias calculations
Recorded videos were visually scanned with ImageJ (NIH) to confirm the number of reversals for
each cell. The distance traveled between any two reversals was identified as a segment and num-
bered (see Figure 1A). The speeds were binned as per the segments, yielding n+1 bins for n rever-
sals. A reversal changes the mode of motility between the pusher and the puller mode. On the other
hand, a 180˚ turn by the cell maintains the same mode. Each reversal was therefore confirmed visu-
ally to distinguish between reversals; 180˚ turns were rarely observed. In cells that swam near surfa-
ces, the pusher and puller modes were readily determined as described in Figure 2. In cells that did
not swim near surfaces, we compared the mean speeds, which alternated as shown in Figure 1D. All
the alternating fast speed-bins were labeled as pushers; alternating low speed-bins were labeled as
pullers. The video frames corresponding to the puller bins were labeled as puller frames.
To determine the CWbias, cells that were observed for at least 0.5 s were retained for analysis.
CWbias was calculated as the fraction of the time that a cell swam in the puller (slower) mode, which
corresponds to CW rotation of the filament. To do this, the number of frames in which the ith cell
swam in the puller mode (i.e. puller frames), NiCW , was divided by the total frames over which the cell
was observed, Ni , to yield:
NiCW
CWbias;i ¼
Ni
The error associated with the calculation of CWbias;i values decreases with increasing Ni . But, dif-
ferent cells were observed for different durations; hence the CWbias;i values were allocated weights
_
that corresponded to their respective durations: W i ¼ PNiN . Mean bias was determined as:
i
X _
CWbias ¼ W i CWbias;i
Reversal frequency was determined in a similar manner.
Acknowledgements
We thank Professor Karen Ottemann for the PMSS1 strains, and Professor Michael Manson and
Rachit Gupta for comments.
Antani et al. eLife 2021;10:e63936. DOI: https://doi.org/10.7554/eLife.63936 14 of 29Research article Physics of Living Systems
Additional information
Funding
Funder Grant reference number Author
Cancer Prevention and Re- RP170805 Pushkar P Lele
search Institute of Texas
National Institute of General R01-GM123085 Pushkar P Lele
Medical Sciences
Cancer Prevention and Re- RR200043 Tanmay, P. Lele
search Institute of Texas
The funders had no role in study design, data collection and interpretation, or the
decision to submit the work for publication.
Author contributions
Jyot D Antani, Data curation, Software, Formal analysis, Validation, Investigation, Visualization,
Methodology, Writing - original draft, Writing - review and editing; Anita X Sumali, Formal analysis;
Tanmay P. Lele, Conceptualization, Formal analysis, Writing - original draft; Pushkar P. Lele, Concep-
tualization, Resources, Data curation, Software, Formal analysis, Supervision, Funding acquisition,
Validation, Visualization, Methodology, Writing - original draft, Project administration, Writing -
review and editing
Author ORCIDs
Jyot D Antani https://orcid.org/0000-0002-7402-983X
Pushkar P. Lele https://orcid.org/0000-0002-2894-3487
Decision letter and Author response
Decision letter https://doi.org/10.7554/eLife.63936.sa1
Author response https://doi.org/10.7554/eLife.63936.sa2
Additional files
Supplementary files
. Transparent reporting form
Data availability
All data generated or analysed during this study are included in the manuscript and supporting files.
Source data files have been provided for Figures 1-5 as Excel spreadsheets. References for the data
in Figure 6 have been included in the caption.
References
Abedrabbo S, Castellon J, Collins KD, Johnson KS, Ottemann KM. 2017. Cooperation of two distinct coupling
proteins creates chemosensory network connections. PNAS 114:2970–2975. DOI: https://doi.org/10.1073/
pnas.1618227114, PMID: 28242706
Aihara E, Closson C, Matthis AL, Schumacher MA, Engevik AC, Zavros Y, Ottemann KM, Montrose MH. 2014.
Motility and chemotaxis mediate the preferential colonization of gastric injury sites by Helicobacter pylori.
PLOS Pathogens 10:e1004275. DOI: https://doi.org/10.1371/journal.ppat.1004275, PMID: 25033386
Arnold IC, Lee JY, Amieva MR, Roers A, Flavell RA, Sparwasser T, Müller A. 2011. Tolerance rather than
immunity protects from Helicobacter pylori-induced gastric preneoplasia. Gastroenterology 140:199–209.
DOI: https://doi.org/10.1053/j.gastro.2010.06.047, PMID: 20600031
Berg HC. 1993. Random Walks in Biology. Princeton University Press.
Block SM, Segall JE, Berg HC. 1982. Impulse responses in bacterial chemotaxis. Cell 31:215–226. DOI: https://
doi.org/10.1016/0092-8674(82)90421-4, PMID: 6760985
Block SM, Segall JE, Berg HC. 1983. Adaptation kinetics in bacterial chemotaxis. Journal of Bacteriology 154:
312–323. DOI: https://doi.org/10.1128/JB.154.1.312-323.1983, PMID: 6339475
Antani et al. eLife 2021;10:e63936. DOI: https://doi.org/10.7554/eLife.63936 15 of 29Research article Physics of Living Systems
Chawla R, Gupta R, Lele TP, Lele PP. 2020. A skeptic’s Guide to Bacterial Mechanosensing. Journal of Molecular
Biology 432:523–533. DOI: https://doi.org/10.1016/j.jmb.2019.09.004, PMID: 31629771
Cluzel P, Surette M, Leibler S. 2000. An ultrasensitive bacterial motor revealed by monitoring signaling proteins
in single cells. Science 287:1652–1655. DOI: https://doi.org/10.1126/science.287.5458.1652, PMID: 10698740
Collins KD, Andermann TM, Draper J, Sanders L, Williams SM, Araghi C, Ottemann KM. 2016. The Helicobacter
pylori CZB cytoplasmic chemoreceptor TlpD forms an autonomous polar chemotaxis signaling complex that
mediates a tactic response to oxidative stress. Journal of Bacteriology 198:1563–1575. DOI: https://doi.org/10.
1128/JB.00071-16, PMID: 27002127
Constantino MA, Jabbarzadeh M, Fu HC, Bansil R. 2016. Helical and rod-shaped Bacteria swim in helical
trajectories with little additional propulsion from helical shape. Science Advances 2:e1601661. DOI: https://doi.
org/10.1126/sciadv.1601661, PMID: 28138539
Crocker JC, Grier DG. 1996. Methods of digital video microscopy for colloidal studies. Journal of Colloid and
Interface Science 179:298–310. DOI: https://doi.org/10.1006/jcis.1996.0217
Detcheverry F. 2017. Generalized run-and-turn motions: from Bacteria to lévy walks. Physical Review E 96:
012415. DOI: https://doi.org/10.1103/PhysRevE.96.012415, PMID: 29347147
DiLuzio WR, Turner L, Mayer M, Garstecki P, Weibel DB, Berg HC, Whitesides GM. 2005. Escherichia coli swim
on the right-hand side. Nature 435:1271–1274. DOI: https://doi.org/10.1038/nature03660, PMID: 15988531
Dominick CN, Wu XL. 2018. Rotating Bacteria on solid surfaces without tethering. Biophysical Journal 115:588–
594. DOI: https://doi.org/10.1016/j.bpj.2018.06.020, PMID: 30041887
Ford KM, Chawla R, Lele PP. 2017. Biophysical characterization of flagellar motor functions. Journal of Visualized
Experiments 1:55240. DOI: https://doi.org/10.3791/55240
Ford KM, Antani JD, Nagarajan A, Johnson MM, Lele PP. 2018. Switching and torque generation in swarming E.
coli. Frontiers in Microbiology 9:2197. DOI: https://doi.org/10.3389/fmicb.2018.02197, PMID: 30279682
Fukuoka H, Sagawa T, Inoue Y, Takahashi H, Ishijima A. 2014. Direct imaging of intracellular signaling
components that regulate bacterial chemotaxis. Science Signaling 7:ra32. DOI: https://doi.org/10.1126/
scisignal.2004963, PMID: 24692593
Goers Sweeney E, Henderson JN, Goers J, Wreden C, Hicks KG, Foster JK, Parthasarathy R, Remington SJ,
Guillemin K. 2012. Structure and proposed mechanism for the pH-sensing Helicobacter pylori chemoreceptor
TlpB. Structure 20:1177–1188. DOI: https://doi.org/10.1016/j.str.2012.04.021, PMID: 22705207
Großmann R, Peruani F, Bär M. 2016. Diffusion properties of active particles with directional reversal. New
Journal of Physics 18:043009. DOI: https://doi.org/10.1088/1367-2630/18/4/043009
Howitt MR, Lee JY, Lertsethtakarn P, Vogelmann R, Joubert LM, Ottemann KM, Amieva MR. 2011. ChePep
controls Helicobacter pylori infection of the gastric glands and chemotaxis in the epsilonproteobacteria. mBio
2:e00098–11. DOI: https://doi.org/10.1128/mBio.00098-11, PMID: 21791582
Huang JY, Sweeney EG, Sigal M, Zhang HC, Remington SJ, Cantrell MA, Kuo CJ, Guillemin K, Amieva MR. 2015.
Chemodetection and destruction of host urea allows Helicobacter pylori to Locate the Epithelium. Cell Host &
Microbe 18:147–156. DOI: https://doi.org/10.1016/j.chom.2015.07.002, PMID: 26269952
Huang JY, Goers Sweeney E, Guillemin K, Amieva MR. 2017. Multiple acid sensors control Helicobacter pylori
Colonization of the Stomach. PLOS Pathogens 13:e1006118. DOI: https://doi.org/10.1371/journal.ppat.
1006118, PMID: 28103315
Jasuja R, Keyoung J, Reid GP, Trentham DR, Khan S. 1999. Chemotactic responses of Escherichia coli to small
jumps of photoreleased L-aspartate. Biophysical Journal 76:1706–1719. DOI: https://doi.org/10.1016/S0006-
3495(99)77329-7, PMID: 10049350
Jiménez-Pearson MA, Delany I, Scarlato V, Beier D. 2005. Phosphate flow in the chemotactic response system of
Helicobacter pylori. Microbiology 151:3299–3311. DOI: https://doi.org/10.1099/mic.0.28217-0, PMID: 16207
913
Johnson KS, Ottemann KM. 2018. Colonization, localization, and inflammation: the roles of H. pylori chemotaxis
in vivo. Current Opinion in Microbiology 41:51–57. DOI: https://doi.org/10.1016/j.mib.2017.11.019, PMID: 2
9202336
Josenhans C, Suerbaum S. 2002. The role of motility as a virulence factor in Bacteria. International Journal of
Medical Microbiology 291:605–614. DOI: https://doi.org/10.1078/1438-4221-00173, PMID: 12008914
Kinosita Y, Kikuchi Y, Mikami N, Nakane D, Nishizaka T. 2018. Unforeseen swimming and gliding mode of an
insect gut symbiont, Burkholderia sp. RPE64, with wrapping of the flagella around its cell body. The ISME
Journal 12:838–848. DOI: https://doi.org/10.1038/s41396-017-0010-z, PMID: 29269839
Korobkova E, Emonet T, Vilar JM, Shimizu TS, Cluzel P. 2004. From molecular noise to behavioural variability in
a single bacterium. Nature 428:574–578. DOI: https://doi.org/10.1038/nature02404, PMID: 15058306
Lam KH, Ling TK, Au SW. 2010. Crystal structure of activated CheY1 from Helicobacter pylori. Journal of
Bacteriology 192:2324–2334. DOI: https://doi.org/10.1128/JB.00603-09, PMID: 20207758
Lauga E, DiLuzio WR, Whitesides GM, Stone HA. 2006. Swimming in circles: motion of Bacteria near solid
boundaries. Biophysical Journal 90:400–412. DOI: https://doi.org/10.1529/biophysj.105.069401, PMID: 1623
9332
Lauga E. 2016. Bacterial hydrodynamics. Annual Review of Fluid Mechanics 48:105–130. DOI: https://doi.org/10.
1146/annurev-fluid-122414-034606
Lauga E, Powers TR. 2009. The hydrodynamics of swimming microorganisms. Reports on Progress in Physics 72:
096601. DOI: https://doi.org/10.1088/0034-4885/72/9/096601
Lele PP, Branch RW, Nathan VS, Berg HC. 2012. Mechanism for adaptive remodeling of the bacterial flagellar
switch. PNAS 109:20018–20022. DOI: https://doi.org/10.1073/pnas.1212327109, PMID: 23169659
Antani et al. eLife 2021;10:e63936. DOI: https://doi.org/10.7554/eLife.63936 16 of 29You can also read