Statistically Validated Indices for COVID-19 Public Health Policies - OSF
←
→
Page content transcription
If your browser does not render page correctly, please read the page content below
Statistically Validated Indices for COVID-19 Public Health Policies
   Robert Kubinec∗1 , Joan Barceló1 , Rafael Goldszmidt5 , Vanja Grujic2 ,
  Timothy Model3 , Caress Schenk4 , Cindy Cheng6 , Thomas Hale7 , Allison
Spencer Hartnett8 , Luca Messerschmidt6 , Anna Petherick7 , and Svanhildur
                             Thorvaldsdottir6
                     1
                 Division of Social Sciences, New York University Abu Dhabi
                                      2
                                        University of Brasilia
                                        3
                                          Fors Marsh Group
                                     4
                                       Nazarbayev University
                                   5
                                     Fundação Getulio Vargas
6
  Hochschule für Politik at the Technical University of Munich (TUM) and the TUM School
                                           of Governance
                                        7
                                          Oxford University
                               8
                                 University of Southern California

                                                 May 31, 2021

                                                     Abstract
         In this paper, we present new indices for government responses to COVID-19 within six policy areas
     crucial for understanding the drivers and effects of the pandemic: social distancing, schools, businesses,
     health monitoring, health resources and mask wearing. We create these measures from combining two
     of the most comprehensive COVID-19 datasets, the CoronaNet COVID-19 Government Response Event
     Dataset and the Oxford COVID-19 Government Response Tracker, using a Bayesian time-varying mea-
     surement model. Our daily indices track government responses for each of these policy areas from January
     1st, 2020 to January 15th, 2021, for over 180 countries. By using a statistical model to generate these
     indices, we are able to estimate uncertainty within the index and provide external validation for these two
     COVID-19 policy datasets, showing that though they represent distinct data sources, they show strong
     convergent validity. We further explore the correlation between these indices and a range of social, public
     health, political and economic covariates. Our results show that while business restrictions and social
     distancing restrictions are strongly associated with reduced general anxiety, school restrictions are not.
     School restrictions are, however, associated with higher rates of personal contact with people outside the
     home, higher levels of income inequality and bureaucratic corruption. Additionally, we find that female
     heads of state are more likely to implement a broad array of pandemic-related restrictions than male
     leaders.

  ∗ Corresponding   author: rmk7@nyu.edu

                                                         1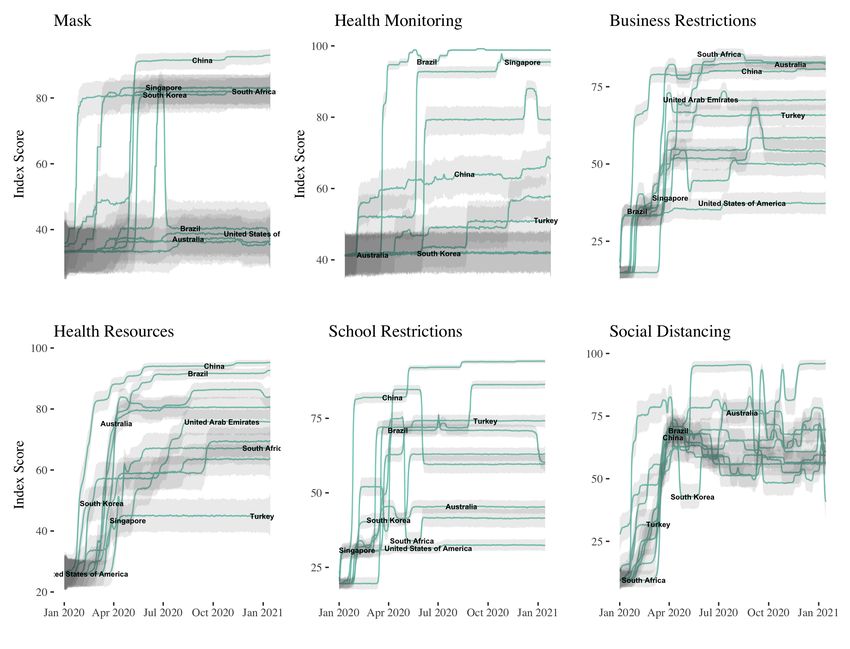
Note: To access both the raw policy indicators and the created indices, please see this link https:

//www.robertkubinec.com/post/err in vars/ for more information.

Introduction

   Since the outbreak of the COVID-19 pandemic, considerable work has been done to collect data on

government policies aimed at preventing transmission of the virus (Desvars-Larrive et al. 2020; Haug et

al. 2020; Hale et al. 2021; Cheng et al. 2020). However, the scale of the pandemic and the diversity of

government responses makes it quite difficult to aggregate the increasingly complex available datasets into

quantities which are valid measurements of diverse sources of information. As a result, our knowledge of

which specific policies or even entire policy domains have been the most effective at countering COVID-19

remains limited by our ability to navigate the maze of overlapping policy actions across counties and over time

(Perra 2021). To help address this problem, in this paper we present six new statistically-validated indices

which aggregate disparate sources of information for the following COVID-19 policy areas: general social

distancing, business restrictions, school restrictions, mask usage, health monitoring and health resources

management.

   Instead of relying on a single existing dataset to create our indcies, we pool indicators from two widely-

used data sources, the CoronaNet Research Project (Cheng et al. 2020) and the Oxford COVID-19 Govern-

ment Response Tracker (OxCGRT) (Hale et al. 2021). To produce estimates that combine information from

both sources, we employ time-varying statistical measurement models that allow us to incorporate different

variable types (continuous, binary, ordinal) and derive time-varying indices for over 180 countries (Kubinec

2019).

   Employing statistical measurement models from different data sources provides at least three unique

benefits. First, it allows us to create indices which contains more information than either data source could

provide on its own. The value of combining the CoronaNet and OxCGRT datasets is particularly high given

that they rely on disparate taxonomies which otherwise could not be easily combined. Second, this strategy

further allows us to validate each datasets against each other. In general we find high validity for each index

in terms of how the CoronaNet and OxCGRT dataset measure public health policies, suggesting that the

coding strategies of these two repositories both similar in substance and accurate in their documentation of

COVID-19 public health policies. Finally, by employing statistical methods, our indices are further able to

incorporate measurement uncertainty, a crucial feature insofar as it ensures that any analyses conducted with

these indices are robust to arbitrary coding errors and data limitations. That is, by making the assumption

that each index should be measuring a single-dimensional latent trait, we gain uncertainty intervals that

                                                      2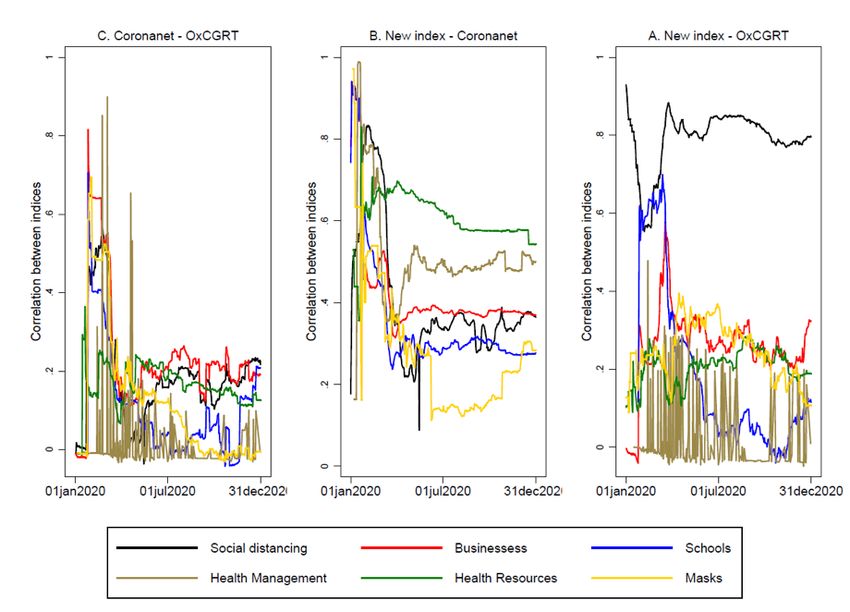
describe how certain we can be about the true level of policy activity in a given country. Given that data

collection and cleaning is ongoing for both the CoronaNet and OxCGRT datasets, this feature is especially

useful for current and ongoing research on the pandemic’s drivers and effects.

   To examine what we can learn from these indices, we further explore how publich health, economic,

political and social factors may affect each of these indices. We do so by investigating how both time-

invariant and time-varying factors which have been hypothesized to matter for COVID-19 policies affect

the particular policy areas measured by these indices. Our results, which are also robust to measurement

uncertainty, show that policy restrictions vary substantially by country. In particular our results suggest that

social distancing policies and business restrictions are the most strongly associated with reducing mobility

in workplaces and retail establishments. However, only social distancing policies are also associated with

reducing personal contact, i.e. personal contact with people outside the home appears to rise when business

restrictions and school restrictions are in place. Furthermore, school restrictions are associated with rising

mobility in retail and other establishments.

   We also find that the quality and nature of state institutions are strongly related to the type of policies

different governments impose even when accounting for reported COVID-19 cases and deaths. Democracies

are less likely to impose business restrictions and social distancing policies, while countries with higher levels

of bureaucratic corruption are more likely to impose school restrictions and less likely to impose restrictions

on businesses. In addition, we show that countries with female leaders are more likely to impose business

restrictions, school restrictions and social distancing policies than countries with male leaders even when

accounting for the level of democracy.

Background

   Since the outbreak of the pandemic, a growing number of research projects have tried to capture the

diverse ways that governments have implemented policies to slow the spread of COVID-19. Some of these

projects focus on a single type of policy (UNDP and UN Women COVID-19 Global Gender Response Tracker

2021; Elgin, Basbug, and Yalaman 2020) or a particular region of the world (Naqvi 2021; Adolph et al. 2021),

whereas others aim at collecting data at world-wide scale across a range of indicators (COVID-19 Gov-

ernment Measures Dataset 2020; Porcher 2020; Grundy, Quinn, and Todowede 2021; Suryanarayanan et

al. 2021). Of this latter set, the datasets with the widest coverage and most detailed indicators include

CoronaNet, OxCGRT, the Complexity Science Hub COVID-19 Control Strategies List (CCCSL) (Haug et

al. 2020; Desvars-Larrive et al. 2020) and Health Intervention Tracking for COVID-19 (HIT-COVID) (Zheng

et al. 2020). The CCCSL and HIT-COVID datasets are similar in approach to the CoronaNet dataset in that

                                                        3
they try to measure as many discrete attributes of policies as possible. The OxCGRT dataset, on the other
hand, releases qualitative summary ordinal indices instead of disaggregated indicators that place country
responses to COVID-19 on ordinal scales.
All of these data coding projects aim to solve what is a conceptually simple but operationally difficult
problem: on day t in country c, what were the set of policies governments put in place to combat COVID-19?
While the popular media tends to focus on lockdowns and other politically costly actions that have roused
public sentiment, lockdowns can in fact incorporate a variety of restrictions on gatherings, businesses, schools
and travel. Furthermore, governments simultaneously engaged in a broad array of policies that did not place
restrictions on individuals or organizations, but rather increased the capacity of its health care infrastructure
to respond to the pandemic, including building testing capabilities and personal protective equipment (PPE)
distribution, managing hospital networks and isolating and tracking the contacts of COVID-19 patients, to
name only a few. In short, while much of the policy evaluation literature so far focuses on lockdowns as
discrete policies (Flaxman et al. 2020; Dave, Friedson, Matsuzawa, and Sabia 2020; Courtemanche et al. 2020;
Abouk and Heydari 2021; Islam et al. 2020; Brauner et al. 2020; Bo et al. 2021; Li et al. 2021), lockdowns
are a bundle of different policy options that happen concurrently with efforts to increase the capacity of the
healthcare system and test and trace infected patients (Perra 2021). Examining the association between
lockdowns and infections, even assuming away the difficult measurement problem of identifying the actual
infection rate (Sharma et al. 2020), likely subsumes effects of other policies that are implemented at the
same time and vary from country to country.
For these reasons, we believe it is crucial for the academic community to have access to comprehensive
and accurate data on the full range of policies undertaken by governments across the world in response
to the COVID-19 pandemic. Doing so is necessary to be able to answer questions about the effect of
different policies, not only in terms of combating COVID-19 infections, but also on a diverse array of socio-
economic outcomes, including mental health (Fetzer et al. 2020; Varga et al. 2021; Yamada et al. 2021;
Zettler et al. 2021), economic hardship (Demirgüç-Kunt, Lokshin, and Torre 2020; Maloney and Taskin
2020; Kubinec, Lee, and Tomashevskiy 2020; Brodeur et al. 2020; Bonaccorsi et al. 2020; Ashraf 2020;
Adams-Prassl et al. 2020), political partisanship (Adida, Dionne, and Platas 2020; Woolhandler et al. 2021;
Pulejo and Querubı́n 2020; Painter and Qiu 2020; Hart, Chinn, and Soroka 2020; Gadarian, Goodman, and
Pepinsky 2020; Dave, Friedson, Matsuzawa, Sabia, and Safford 2020; Bol et al. 2021), and the reasons why
some countries were better positioned to implement higher levels of restrictions to control the pandemic
(Bargain and Aminjonov 2020; Borgonovi and Andrieu 2020; Fan, Orhun, and Turjeman 2020; Barceló and
Sheen 2020). Given the scale and complexity of this measurement problem, we believe it is necessary to
leverage multiple datasets to be able to validate the underlying indicators given how complex the coding
4process of these policies is.
In this paper, we focus on the CoronaNet and OxCGRT datasets for validation and data pooling because
of the complementary data coding strategies. The breadth and scope of the CoronaNet data results in a large
number of indicators while any particular indicator does not contain as much information about a given policy
compared to the OxCGRT dataset. By contrast, the OxCGRT dataset contains relatively fewer indicators
compared to CoronaNet, but each indicator represents a rich source of qualitative information about the
extent of policy coverage. As such, pooling information from the two datasets allows for independent sources
of information about policies to be combined. By contrast, it is much more difficult conceptually to pool
information across datasets that adopt conceptually similar coding strategies because full taxonomies of all
categories in the data must be manually mapped, assuming that such an exact mapping is possible.
Data
To produce our indices, we included 154 indicators from the CoronaNet dataset and 10 from OxCGRT.
We use more indicators from CoronaNet because of differences in how these two projects code public health
policies, which we further explore in the supplemental information. In general, the CoronaNet project takes
the approach of separately coding all aspects of COVID-19 related policies, while the OxCGRT produces
ordinal scores for each policy type. As such, the OxCGRT dataset has far fewer indicators overall, but as
we show in our results, its indicators contain a great deal of information. We are able to employ at least one
OxCGRT indicator in each index.
One complication is that the CoronaNet dataset contains provincial and even municipal information
about policies for all countries in the dataset, though coverage varies. As such, we needed a way to include
this information to produce national-level estimates. We employed a simple algorithm in which we assigned
a value of +1 for each policy in force at the national level and 0 otherwise.1 For over-lapping policy coverage
at lower levels of government we then add to this baseline score. For each province and city with the same
policy in force, we add the proportion of the country’s population in the province or city to this baseline
score. The resulting score could reach a max of 3 if a binary-coded policy was implemented at the national
level, among all policies and among all cities in a country. Of course, we do not observe this maximum level
of policy enforcement in our index, but we believe the additive nature of combining lower levels of policy
enforcement helps communicate the multiple levels of policy while still maintaining parsimony in how we
aggregate the information. The resulting score is then a continuous variable and is modeled as such.
1. As a few of our indicators for CoronaNet are ordinal or continuous in nature, such as the length of curfews, we use the
same technique except that we weight the variable values for each level by population.
5In total we have 189 countries in both datasets with coverage from January 1st, 2020 to January 15th,
2021 for a total of 76,380 country-day observations of each of the 164 pooled indicators. As policy coding
remains an ongoing task, we intend to release further periodic updates to our indices as more data is available.
A complete codebook of all of the indicators is available in the supplemental information.
Our list of covariates for which we look at associations with the estimated indices includes nine time-
varying and ten time-constant predictors. Tables 3 and 4 in the supplementary information provide summary
statistics for the time-varying and time-constant predictors, respectively. In our set of time-varying predic-
tors, we include raw COVID-19 cases and deaths to account for how governments enact reactive policies
in response to rising case and death numbers, though we note that this is for the purposes of statistical
adjustment, not to conclusively determine the effectiveness of the policies (Sebhatu et al. 2020). We also
include aggregated response data from Facebook surveys (using the percent who answer yes) about personal
contact, financial anxiety, and general anxiety to explore how behavior and attitudes factor into policymak-
ing (Brenner and Bhugra 2020). Likewise, we include Google data on retail, workplace, grocery, and parks
mobility to investigate how governments use COVID-19 policies in response to changes in mobility (Maloney
and Taskin 2020). Google Mobility data are measured as the percent change in mobility from baseline, where
the baseline was captured during the pre-pandemic months of 2020.
In line with existing research on correlates of COVID-19 policy diffusion, we also include a series of time-
constant social, economic, and political predictors. These time-constant predictors first include the following
economic covariates: World Bank measures of foreign direct investment (FDI, net inflows in USD), Trade
(as a share of GDP), and GDP Per Capita. We also include a Gini Index from the Standardized World
Income Inequality Database, measured on a scale of 0 - 1 where values closer to 1 indicates greater income
inequality. Our political covariates include the Varieties of Democracy measure of Bureaucratic Corruption,
the Fund for Peace’s measure of State Fragility, the Global Health Security Index’s measure of Pandemic
Preparedness, Polity Score, and a Female Leadership indicator (Coppedge et al. 2017). We additionally
include Population Density.
Methods
Combining this data into relevant latent constructs is a difficult challenge given the scope of the data and
the diversity in variable types, including binary, continuous, ordinal variables, and the need to incorporate
over-time variation. To accomplish this, we employ a Bayesian version of item-response models known as
ideal point models (Kubinec 2019) that are estimated with the Hamiltonian Markov Chain Monte Carlo
(MCMC) sampler Stan (Carpenter et al. 2017). The ideal point approach can be understood as a simple
6formal model in which an actor i must decide between two policy alternatives j and j 0 (Clinton, Jackman,
and Rivers 2004). If we assume that there is a one-dimensional utility score U (·) assigned by actor i to j
and j 0 , then actor i will always choose j over j 0 if U (j) > U (j 0 ). In our context, this implies that countries
will choose those policies j which have the smallest Euclidean distance to their position in the latent index
score. If we index countries α by i and our policy factor scores δ by j, we can estimate country ideal point
scores for each day t using the following parametric equation for each indicator value Yitj :
P r(Yijt ) ∼ g(αit δj − βj ) (1)
where the function g(·) represents a statistical distribution appropriate for the particular indicator j,
such as an ordered logit for an ordered indicator, a logistic regression for a binary indicator, and a Gaussian
distribution for a continuous indicator. In this formula, the country index scores are represented by the αit
and the policy discrimination (factor) scores by the δj . Conditional on the model’s assumptions, we can
then interpret our uncertainty in the index scores αit as uncertainty derived from data measurement error
while still being able to estimate the most plausible value for αit .
The sign of the policy discrimination scores δj reflects which way the policy loads on the latent scale,
i.e., whether it positively or negatively predicts higher or lower values of the index. The absolute value of
the discrimination score indicates how much information about the index is contained within this particular
indicator. In other words, policies that have high discrimination contain more information about the latent
scale (i.e., social distancing, etc.) than those with low discrimination.
We refer interested readers to Kubinec (2019) for a more thorough presentation of the joint Bayesian
posterior that we estimate to obtain these parameter values. In essence, statistical models appropriate for
different variable types are jointly estimated with shared parameters for the country index scores and the
policy discriminations. We allow the country index scores to vary via a simple random-walk process in
which each country’s score in time t is equal to its score in t − 1 plus Gaussian-distributed noise σi . This
time process permits some smoothing of the resulting scores. We put a boundary-avoiding prior on the σi
parameters, σi ∼ InvGamma(2, 5), to improve sampling as policy indicators for some indices do not change
very often over time.
One important area we have to consider when employing this model is that the likelihood is not globally
identified without further information added to the model. In particular, we have to prevent scale rotations
of the index, and assigning a very strong prior of Normal(1, 0.001) on the value of one policy discrimination
for each index to ensure a single rotation. However, we let all the other policy discrimination parameters
float so that we can see if they all map on to the same latent trait, which is a strong test of the validity of
7the underlying index.
To fit the models, we run four independent MCMC chains with Stan for 250 warmup iterations and 300
sampling iterations. To test convergence, we report split-R̂ diagnostic plots in the supplementary information
for each index model, which show clear convergence of the chains given these sampling parameters.
To convert the latent scores to the same scale, we first standardize each score and then employ the
inverse logit function to convert the score to a bounded number between 0 and 1. We then multiply by 100
to produce scales with a maximum and minimum observed range of 0 and 100 respectively.
To look at associations between time-varying and time-constant predictors and these indices, we predict
the posterior median values of each index assuming Gaussian measurement error with estimated standard
deviation σˆit from the posterior standard deviation of each index estimate for country i and day t. To do so,
we employ the R package brms (Bürkner 2017). Because there is missing data in the predictor variables, we
create five imputed datasets non-parametrically with random forests (Tang and Ishwaran 2017; Stekhoven
and Bühlmann 2012). We estimate independent Markov chains for each imputed dataset and then combine
the resulting posterior estimates to increase the variance of the posterior distribution to reasonable levels
(Zhou and Reiter 2010).
Results
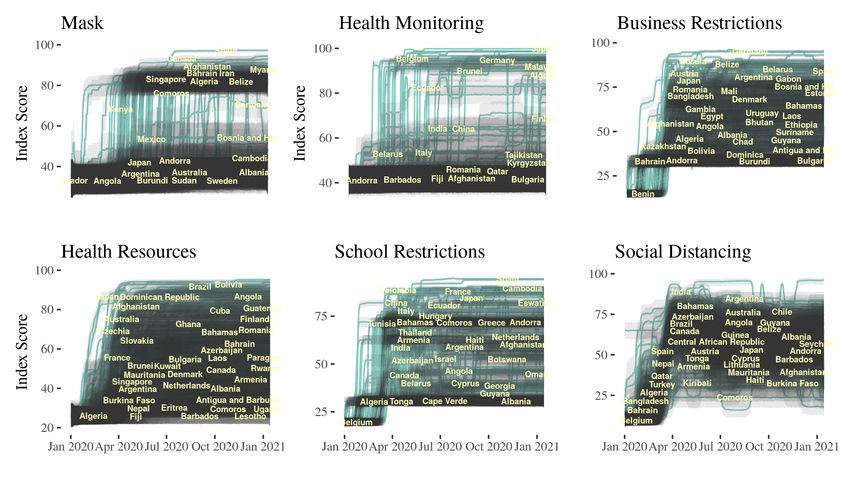
We report the full distributions of each index for all countries in Figure 1. As the number of countries in
the indices are too many to be able to distinguish them in a single plot, we select ten countries from diverse
areas of the world and show the index scores for each in Figure 2. As each of these figures shows, there
are broad similarities across the indices with policy activity increasing in the early months of the pandemic,
followed by more country-specific trends as the pandemic ebbed and flowed within borders. In general, the
indices with the highest amount of over-time variation include our school index, business index, and social-
distancing index. The latter is particularly bolstered by the fact that OxCGRT has several indicators for
this index, which increases significantly the amount of information about distancing policies.
To better understand the underlying components of the index, Figures 3 and 4 show the distribution of
discrimination parameters for each index separately. As can be seen, the discrimination parameters almost
exclusively line up on the right hand-side of the plot, with some parameters estimated at close to zero.
This behavior indicates that the model only found a one-sided latent dimension given the set of policy
indicators. In other words, there is reason to believe that our policy indicators are all measuring a process
of varying degrees of policy intensity rather than quite distinct policy areas that have no real relationship
to each other. As such, it represents an important validity test for the index. Furthermore, we find that the
8Figure 1: Index Scores for All Countries
Figure 2: Index Scores for 10 Countries
9Figure 3: Discrimination Parameters I
OxCGRT indicators are always in the same direction as the CoronaNet indicators. This trend also provides
validation of both indices as it shows that the indicators are tracking the same latent dimension despite
different coders and coding schema.
Analysis of Aggregation
In order to analyze the relation between the aggregate index and its two component sources, we calculated
simple summary measures of the indicators for each dataset by summing over all the indicators for a given
day and standardizing. We evaluated correlations between the estimated indices and the aggregated raw data
a) over time, considering country-mean centered values, and b) across countries, considering cross-sectional
correlations for each day of 2020. The correlations over time between the index and the aggregated raw
10Figure 4: Discrimination Parameters II
data were, in general, quite large for CoronaNet and OxCGRT, respectively: Business (.52 and .58), Schools
(.32 and .57), Social distancing (.54 and .91), Health Monitoring (.51 and -.01), Health Resources (.66 and
.62) and Masks (.27 and .59). Figure 5 shows that the average correlations in the cross-sections are strongly
reduced after the initial policy ramp-up period, and were on average lower than the correlations over time,
particularly for the OxCGRT indicators: Business (.42 and .26), Schools (.35 and .18), Social Distancing (.40
and .79), Health Monitoring (.51 and .04), Health Resources (.61 and .20) and Masks (.27 and .26)—again,
for CoronaNet and OxCGRT, respectively.
While the limited magnitude of most correlations between the raw data of Coronanet and OxCGRT and
the indices may be explained by the reduction in measurement error of the combined index, it also suggests
that these two sources provide unique and non-redundant information. The latter perspective is supported
when we compare the associations of the underlying indicators and the index with mobility measures. As
an illustration, we estimate fixed-effects models with two different measures of mobility as the dependent
variables (retail and recreation visits and workplace mobility) and two different policy dimensions, which are
expected to be directly associated with mobility (social distancing and business). The magnitude of the R2
varies from 1% to 44% across models, and it is not always the case that the R2 is higher for the indices (see
Supplementary Tables 1 and 2).
Exploratory Analysis
To look at empirical predictors of these indices, we employ our multivariate model of the indices that
we specified previously along with the full range of time-varying and time-constant covariates. We show the
results of these models in Table 1. Given that these are Bayesian regression models, we report the posterior
11Figure 5: Daily Cross-sectional Correlations between the Aggregated Raw Data and Estimated Indices
median values as coefficients with the 5% - 95% posterior uncertainty intervals in parentheses.2 Most of the
predictors have clear associations with the different outcomes, though the sign and substantive effect varies.
First, we note that the social distancing and schools policies are associated with lower case counts but higher
reported COVID-19 deaths, while the opposite holds true for business restrictions. Given that COVID-19
deaths lag COVID-19 cases considerably, this may be seen as a general statement of policy efficacy, i.e., that
these policies tend to be imposed when case levels are quite high, leading to subsequent high death rates but
falling case counts as policies come in to force. In the same vein, we see that business restrictions and social
distancing policies are associated with reduced mobility in workplaces, and for social distancing policies
reduced mobility in retail stores as shops close due to so-called lockdowns. However, school restrictions are
associated with more rather than less mobility, suggesting that school closures encourage parents to spend
more time in stores and even, counter-intuitively, workplaces. School restrictions are also associated with
less time spent in parks, which is the opposite of business and social distancing restrictions.
2. We note that the idea of a p-value does not have a clear analogue in Bayesian modeling.
12Table 1: Results of Regression of Social, Political and Economic Covariates on Index Scores
Business Social Distancing Schools
Time-varying
COVID-19 Cases 4.306 -1.229 -1.490
(4.000, 4.597) (-1.400, -1.056) (-1.827, -1.133)
COVID-19 Deaths -4.076 1.448 2.764
(-4.376, -3.772) (1.280, 1.619) (2.379, 3.124)
Facebook Personal Contact 17.508 -2.373 23.853
(15.804, 19.360) (-3.337, -1.358) (21.666, 26.049)
Facebook Financial Anxiety 26.277 24.553 -0.173
(24.579, 27.954) (23.631, 25.466) (-1.991, 1.681)
Facebook General Anxiety -12.967 -20.247 -2.760
(-18.748, -7.412) (-23.692, -16.744) (-9.679, 4.126)
Retail Mobility 0.043 -0.279 0.125
(0.027, 0.059) (-0.288, -0.270) (0.105, 0.143)
Workplace Mobility -0.042 -0.021 0.048
(-0.055, -0.030) (-0.028, -0.014) (0.034, 0.062)
Grocery Mobility -0.055 0.106 0.004
(-0.068, -0.041) (0.099, 0.114) (-0.012, 0.020)
Parks Mobility 0.007 0.013 -0.030
(0.002, 0.011) (0.010, 0.015) (-0.035, -0.024)
Cross-sectional
Population Density -2.325 1.342 2.313
(-2.539, -2.108) (1.219, 1.458) (2.065, 2.563)
GDP Per Capita 2.676 1.645 7.845
(2.352, 2.995) (1.462, 1.817) (7.477, 8.221)
FDI 0.677 1.555 -4.120
(0.498, 0.844) (1.467, 1.650) (-4.311, -3.923)
Trade -3.118 -4.725 -8.649
(-3.411, -2.811) (-4.890, -4.545) (-9.009, -8.291)
State Fragility -6.065 0.179 -1.219
(-6.419, -5.726) (-0.023, 0.381) (-1.623, -0.813)
Bureaucracy Corrupt -5.741 2.670 7.909
(-6.054, -5.414) (2.477, 2.865) (7.541, 8.282)
Pandemic Preparedness 2.105 3.151 1.263
(1.764, 2.454) (2.948, 3.363) (0.849, 1.699)
Woman Leader 8.840 2.771 7.106
(8.228, 9.437) (2.418, 3.117) (6.387, 7.821)
Polity Score -8.014 -0.845 -0.671
(-8.263, -7.753) (-0.985, -0.706) (-0.945, -0.382)
Gini Index 4.108 -1.750 1.965
(3.796, 4.428) (-1.926, -1.581) (1.575, 2.346)
R2 0.34 0.41 0.29
LOO-IC 290077 250895 301517
Note:
Coefficients are the posterior median values and the uncertainty intervals are the 5%
to 95% posterior density intervals. Results marginalize across 5 imputed datasets.
In addition, we note that the policies’ association with the reduction of contacts with other people is
decidedly mixed. Higher levels of the social distancing index are associated with fewer reported contacts,
while business restrictions and school restrictions are strongly associated with increased contact. As such,
while this analysis cannot be taken as a definitive study of the suppressive effect of the policies, the observed
13Figure 6: Model Predictions for Facebook Polling Data and Indices
Figure 7: Model Predictions for Cross-sectional Factors and Indices
14associations suggest that social distancing policies are most strongly associated with reduced contacts and
reduced mobility, while business restrictions solely with reduced mobility but increased contact, and school
restrictions with both increased mobility and increased contact.
In terms of mental health, business restrictions and social distancing policies, and to a much lesser extent
school restrictions, are associated with fewer people reporting feeling anxious within the past seven days per
our Facebook survey data. This finding supports recent studies showing that, contrary to expectations, the
rate of suicide in fact decreased during the pandemic (Pirkis et al. 2021). It could be that increased social
distancing reduced people’s fears of the disease and its effects on society, while more libertarian approaches
counter-intuitively increased anxiety. However, we note that this association is much weaker for school
restrictions, suggesting that any reductions in general anxiety due to the disease were compensated for by
increases in anxiety from other sources, such as anxiety over childrens’ education.
In terms of economic covariates, we find that business restrictions and social distancing policies are
associated with increased anxiety over finances. By contrast, school restrictions show no relationship with
financial anxiety. In terms of cross-sectional associations, wealthier countries as measured by GDP per capita
are much more likely to have school restrictions and modestly more likely to have business restrictions and
social distancing policies. Increased foreign direct investment (FDI) as a proportion of GDP, though, has
quite different association: similar or slightly more business restrictions and social distancing, but fewer
school closures. In terms of income inequality as measured by the Gini coefficient, more unequal countries
tend to have more business and school restrictions but fewer social distancing policies.
Finally for our political covariates, we find that more democratic countries as measured by the Polity IV
index are much less likely to implement business restrictions and somewhat less likely to implement social
distancing policies and school restrictions. More fragile states and states with more corrupt bureaucracies
are less likely to implement business restrictions, while they are much more likely to implement school
restrictions. Another very strong pattern is that woman leaders tend to be more likely to adopt COVID-19
restrictions across the board: business restrictions, school restrictions and social distancing policies.
To illustrate the magnitude of these relationships, Figures 6 and 7 report predicted values for Facebook
polling covariates and bureaucratic corruption, democracy (Polity IV) scores and income inequality (Gini)
from the cross-sectional data. In these figures the values of other covariates are held at their sample means.
A school index value of 50, or the middle of the range, is associated with only 20% of survey respondents
reporting a direct contact with a non-household member, while a school index value of 70 is associated
with as many as 80% of respondents reported contact with a non-household member. For cross-sectional
relationships, we see that countries that are two standard deviations below the mean of the corruption scale
have an average school restriction policy of approximately 50, while countries two standard deviations above
15the mean have an average school restriction index of nearly 80. These plots show that these relationships
are not only statistically significant but substantively significant as well.
Discussion
While we cannot interpret these associations causally, they do offer compelling initial evidence about
how different types of countries responded to the pandemic. These associations hold promise for helping
us to better understand how the pandemic is unfolding and its complex interaction with people’s beliefs,
country economic conditions and political institutions. Of the associations that we uncovered in this paper,
we think that the most important are those regarding mental health, the quality of state institutions, the
type of regime and differences between school restrictions and other types of policies.
First, it would seem straightforward that increased restrictions on personal mobility and businesses would
result in increased anxiety among residents of countries, and that re-opening would reduce anxiety (Varga
et al. 2021). While business restrictions and social distancing policies are associated with increased anxiety
over finances, we did not find this to be the case for more general anxiety with business restrictions and social
distancing policies. While business restrictions had negative macro-economic ramifications, the cost of these
policies appears to be at least in part offset by reduced anxiety about the spread of disease. However, we do
not see as strong offsetting relationships between anxiety and school restrictions, which are not associated
with financial anxiety and only weakly with reduced general anxiety.
Second, the associations relating to quality and type of state institutions are important because they
indicate that certain countries were predisposed to adopt certain policies apart from the reported levels
of COVID-19 cases and deaths. Countries with weaker state institutions and more corrupt bureaucracies
were less likely to impose restrictions on businesses, which may suggest that powerful economic actors were
able to resist pressures to shut down in the face of the pandemic (Kubinec, Lee, and Tomashevskiy 2020;
Gallego, Prem, and Vargas 2020; Crosson and Parinandi 2021). Following a similar logic, the association that
democracies on average imposed fewer business restrictions may suggest that the increased accountability of
leaders made it harder for them to impose harsher types of policies on citizens, as some prior research has
shown leaders reduced restrictions during elections (Pulejo and Querubı́n 2020).
Given this pattern, we find it all the more remarkable that women leaders are associated with much
higher levels of restrictions across all three policy types given that democracies tend to have higher levels
of representation of women at the highest levels of government. One possible explanation for these strong
associations is the role of rising right-wing populism (Pevehouse 2020), which has often been led by male
leaders who view pandemic restrictions as a form of anti-masculine cowardice (Lasco 2020; Harsin 2020).
16We note that prior research on the gender of leadership and COVID-19 restrictions is mixed, with earlier
findings showing that countries with women leaders fare better at controlling the pandemic (Johnson and
Williams 2020; Coscieme et al. 2020) and others that there is no clear relationship between gender and
COVID-19 restrictions (Aldrich and Lotito 2020; Windsor et al. 2020). Based on the results reported in
this paper, we believe there is clear evidence that women leaders presided over countries with higher overall
levels of COVID-19 restrictions, though of course the overall effectiveness of those restrictions at preventing
infections is a separate empirical question. It is important to note that we only document the association;
we cannot make a definitive statement that the gender of a leader caused the higher level of restrictions.
For example, it could be that some countries are predisposed due to some institutional or social factor to
have both female leaders and better COVID-19 responses; while we tried to account for some of these biases
by including institutional and country demographic factors, it is still quite possible there are unmeasured
variables that could explain why countries with female leaders have more COVID-19 policies.
We also note that school restrictions show strikingly different dynamics vis-a-vis social distancing policies
or business restrictions. As we mentioned earlier, reported contacts and mobility in retail establishments
increase significantly when school restrictions are in place. School restrictions are more likely in states with
more corrupt bureaucrats and higher levels of income inequality. As a result, we think that these worrying
associations provide partial evidence that these types of restrictions may not be as effective as general social
distancing policies and may also have harmful consequences in terms of shifting the burden of COVID-19
suppression to more vulnerable members of society.
Conclusion
In this paper we present six new indices that provide the first comprehensive and statistically-validated
information about how countries implemented policies opposing the COVID-19 pandemic. These indices
are not a replacement for either of the two data sources (OxCGRT and CoronaNet), which are found to be
non-redundant, yet they complement these datasets by providing time-varying, robust comparisons at a level
of aggregation which can fruitfully be employed in additional policy evaluation analyses. We perform some
such analyses in this article, finding compelling associations between school restrictions, business restrictions
and social distancing policies with an array of social, political and economic covariates.
It is our hope that this data will be used to increase understanding about the environment within which
these policies were implemented as the pandemic has disrupted billions of people’s lives. We believe that
this type of precise measurement is necessary to answer questions about the effectiveness of policies at
combating COVID-19 and thus future pandemics. Without a thorough accounting of what happened during
17the pandemic and the ability to aggregate information in empirically sound ways, we may not be able to
reach valid conclusions about how best to prepare for the next world-wide transmissible disease.
181 Supplementary Information
Our supplementary information can be downloaded as a PDF from the following link: https://drive.
google.com/uc?export=download&id=1SPKiNwkMiVO-O-7rldCyCN9JmBgOQ6JR.
2 Data Availability
For the full code and data to reproduce all results, we refer the reader to our Github repository: https:
//github.com/saudiwin/corona index. We refer the reader as well to a blog post describing the data and how
to incorporate measurement uncertainty into analyses using the R software package, which can be accessed
from http://www.robertkubinec.com/post/err in vars/.
To download the underlying data and estimated indexes directly, the following two links contain CSV
files:
1. Estimated indices in day-country-index-index type form: https://drive.google.com/uc?export=download&
id=1dMCTVPrf-tJyhv uxr0yAQO-Elx0QOCG
2. Underlying policy data indicators from CoronaNet and OxCGRT: https://drive.google.com/uc?id=
1lorcowHNnF0Vl6pxBjMdjTC4yPhHBLJI&export=download
We refer the reader to our supplementary information (see link above) for a full code book describing
each of the underlying policy indicators.
Acknowledgments
A full list of the hundreds of research assistants involved in compiling the CoronaNet data are in the sup-
plemental information and we gratefully acknowledge each one for their role in this project. We acknowledge
funding from New York University Abu Dhabi (Covid-19 Facilitator Research Fund), The National Council
for Eurasian and East European Research (No. 832-06g), the European Union’s Horizon 2020 Research and
Innovation Programme (No. 101016233), the Hochschule fur Politik at the Technical University of Munich
(TUM) and the TUM Chair of International Relations, and the Leibniz Research Alliance Group (Crises in a
Globalised World). Technical infrastructure support has been generously provided by Overton, Slack Tech-
nologies and RStudio. The funders had no role in study design, data collection, analysis, or interpretation,
nor in the decision to publish or in the preparation of the manuscript.
19Author Contributions
Please see the contribution matrix below showing the contributions for each author. Authors affiliated
with the CoronaNet project are marked with one asterisk and authors affiliated with the OxGCRT project
are marked with two asterisks.
Competing Interests
The authors have no competing interests to declare.
References
Abouk, Rahi, and Babak Heydari. 2021. “The Immediate Effect of COVID-19 Policies on Social-Distancing
Behavior in the United States” [in en]. Publisher: SAGE Publications Inc, Public Health Reports (Jan-
20uary): 0033354920976575. issn: 0033-3549, accessed February 11, 2021. https : / / doi . org / 10 . 1177 /
0033354920976575. https://doi.org/10.1177/0033354920976575.
Adams-Prassl, Abi, Teodora Boneva, Marta Golin, and Christopher Rauh. 2020. “Inequality in the impact
of the coronavirus shock: Evidence from real time surveys” [in en]. Journal of Public Economics 189
(September): 104245. issn: 0047-2727, accessed November 11, 2020. https://doi.org/10.1016/j.jpubeco.
2020.104245. http://www.sciencedirect.com/science/article/pii/S0047272720301092.
Adida, Claire L., Kim Yi Dionne, and Melina R. Platas. 2020. “Ebola, elections, and immigration: how politi-
cizing an epidemic can shape public attitudes.” Publisher: Routledge eprint: https://doi.org/10.1080/21565503.2018.1484
Politics, Groups, and Identities 8, no. 3 (May): 488–514. issn: 2156-5503, accessed April 28, 2021. https:
//doi.org/10.1080/21565503.2018.1484376. https://doi.org/10.1080/21565503.2018.1484376.
Adolph, Christopher, Kenya Amano, Bree Bang-Jensen, Nancy Fullman, and John Wilkerson. 2021. “Pan-
demic Politics: Timing State-Level Social Distancing Responses to COVID-19.” Journal of Health Pol-
itics, Policy and Law 46, no. 2 (April): 211–233. issn: 0361-6878, accessed April 19, 2021. https://doi.
org/10.1215/03616878-8802162. https://doi.org/10.1215/03616878-8802162.
Aldrich, Andrea S., and Nicholas J. Lotito. 2020. “Pandemic Performance: Women Leaders in the COVID-19
Crisis” [in en]. Publisher: Cambridge University Press, Politics & Gender 16, no. 4 (December): 960–
967. issn: 1743-923X, 1743-9248, accessed April 19, 2021. https://doi.org/10.1017/S1743923X20000549.
https://www.cambridge.org/core/journals/politics-and-gender/article/pandemic-performance-women-
leaders-in-the-covid19-crisis/579B3EA9BE0CD8215EE2E74257252FED.
Ashraf, Badar Nadeem. 2020. “Economic impact of government interventions during the COVID-19 pan-
demic: International evidence from financial markets” [in en]. Journal of Behavioral and Experimental
Finance 27 (September): 100371. issn: 2214-6350, accessed April 19, 2021. https://doi.org/10.1016/j.
jbef.2020.100371. https://www.sciencedirect.com/science/article/pii/S2214635020302422.
Barceló, Joan, and Greg Chih-Hsin Sheen. 2020. “Voluntary adoption of social welfare-enhancing behav-
ior: Mask-wearing in Spain during the COVID-19 outbreak.” Publisher: Public Library of Science San
Francisco, CA USA, PloS one 15 (12): e0242764.
Bargain, Olivier, and Ulugbek Aminjonov. 2020. “Trust and compliance to public health policies in times
of COVID-19” [in en]. Journal of Public Economics 192 (December): 104316. issn: 0047-2727, accessed
April 19, 2021. https: // doi .org /10 .1016 / j. jpubeco. 2020 .104316. https: // www . sciencedirect.com /
science/article/pii/S0047272720301808.
21Bo, Yacong, Cui Guo, Changqing Lin, Yiqian Zeng, Hao Bi Li, Yumiao Zhang, Md Shakhaoat Hossain, et al.
2021. “Effectiveness of non-pharmaceutical interventions on COVID-19 transmission in 190 countries
from 23 January to 13 April 2020” [in en]. International Journal of Infectious Diseases 102 (January):
247–253. issn: 1201-9712, accessed April 19, 2021. https : / / doi . org / 10 . 1016 / j . ijid . 2020 . 10 . 066.
https://www.sciencedirect.com/science/article/pii/S1201971220322700.
Bol, Damien, Marco Giani, Andre Blais, and Peter John Loewen. 2021. “The effect of COVID-19 lockdowns
on political support: Some good news for democracy?” Publisher: John Wiley & Sons, Ltd, European
Journal of Political Research 60, no. 2 (May): 497–505. issn: 0304-4130, accessed April 19, 2021. https:
//doi.org/10.1111/1475-6765.12401. https://doi.org/10.1111/1475-6765.12401.
Bonaccorsi, Giovanni, Francesco Pierri, Matteo Cinelli, Andrea Flori, Alessandro Galeazzi, Francesco Porcelli,
Ana Lucia Schmidt, et al. 2020. “Economic and social consequences of human mobility restrictions under
COVID-19” [in en]. Publisher: National Academy of Sciences Section: Social Sciences, Proceedings of
the National Academy of Sciences 117, no. 27 (July): 15530–15535. issn: 0027-8424, 1091-6490, accessed
November 11, 2020. https://doi.org/10.1073/pnas.2007658117. https://www.pnas.org/content/117/
27/15530.
Borgonovi, Francesca, and Elodie Andrieu. 2020. “Bowling together by bowling alone: Social capital and
COVID-19” [in en]. Social Science & Medicine 265 (November): 113501. issn: 0277-9536, accessed
April 19, 2021. https://doi.org/10.1016/j.socscimed.2020.113501. https://www.sciencedirect.com/
science/article/pii/S0277953620307206.
Brauner, Jan M., Sören Mindermann, Mrinank Sharma, David Johnston, John Salvatier, Tomáš Gavenčiak,
Anna B. Stephenson, et al. 2020. “Inferring the effectiveness of government interventions against COVID-
19” [in en]. Publisher: American Association for the Advancement of Science Section: Research Article,
Science (December). issn: 0036-8075, 1095-9203, accessed January 29, 2021. https://doi.org/10.1126/
science.abd9338. https://science.sciencemag.org/content/early/2020/12/15/science.abd9338.
Brenner, M. Harvey, and Dinesh Bhugra. 2020. “Acceleration of Anxiety, Depression, and Suicide: Secondary
Effects of Economic Disruption Related to COVID-19” [in English]. Publisher: Frontiers, Frontiers in
Psychiatry 11. issn: 1664-0640, accessed April 28, 2021. https://doi.org/10.3389/fpsyt.2020.592467.
https://www.frontiersin.org/articles/10.3389/fpsyt.2020.592467/full.
Brodeur, Abel, David Gray, Anik Islam, and Suraiya Jabeen Bhuiyan. 2020. “A literature review of the
economics of COVID-19.” IZA Institute of Labor Economics Discussion Paper Series, https://papers.
ssrn.com/sol3/papers.cfm?abstract id=3636640.
22Bürkner, Paul-Christian. 2017. “brms: An R package for Bayesian multilevel models using Stan.” Tex.encoding:
UTF-8, Journal of Statistical Software 80 (1): 1–28. https://doi.org/10.18637/jss.v080.i01.
Carpenter, Bob, Andrew Gelman, Matthew D. Hoffman, Daniel Lee, Ben Goodrich, Michael Betancourt,
Marcus Brubaker, Jiqiang Guo, Peter Li, and Allen Riddell. 2017. “Stan: A probabilistic programming
language.” Journal of Statistical Software 76.
Cheng, Cindy, Joan Barcelo, Allison Spencer Hartnett, Robert Kubinec, and Luca Messerschmidt. 2020.
“COVID-19 government response event dataset (CoronaNet v.1.0).” Nature Human Behavior, https:
//doi.org/https://doi.org/10.1038/s41562-020-0909-7.
Clinton, Joshua, Simon Jackman, and Douglas Rivers. 2004. “The statistical analysis of rollcall data.”
Tex.owner: saudiwin tex.timestamp: 2017.04.03, American Political Science Review 98 (2): 355–370.
Coppedge, Michael, John Gerring, Staffan I. Lindberg, Svend-Erik Skaaning, Jan Teorell, David Altman,
Michael Bernhard, et al. 2017. V-dem dataset v7. Working paper. Url: https://papers.ssrn.com/sol3/papers.cfm?abstract i
Social Science Research Network, May. https://papers.ssrn.com/sol3/papers.cfm?abstract%3Csub%
3Ei%3C/sub%3Ed=2968289.
Coscieme, Luca, Lorenzo Fioramonti, Lars F. Mortensen, Kate E. Pickett, Ida Kubiszewski, Hunter Lovins,
Jacqueline Mcglade, et al. 2020. “Women in power: Female leadership and public health outcomes
during the COVID-19 pandemic” [in en]. Publisher: Cold Spring Harbor Laboratory Press, medRxiv
(July): 2020.07.13.20152397. Accessed April 19, 2021. https://doi.org/10.1101/2020.07.13.20152397.
https://www.medrxiv.org/content/10.1101/2020.07.13.20152397v1.
Courtemanche, Charles, Joseph Garuccio, Anh Le, Joshua Pinkston, and Aaron Yelowitz. 2020. “Strong
Social Distancing Measures In The United States Reduced The COVID-19 Growth Rate.” Publisher:
Health Affairs, Health Affairs 39, no. 7 (May): 1237–1246. issn: 0278-2715, accessed February 11, 2021.
https://doi.org/10.1377/hlthaff.2020.00608. https://www.healthaffairs.org/doi/full/10.1377/hlthaff.
2020.00608.
COVID-19 Government Measures Dataset [in en]. 2020. Technical report. ACAPS, March. Accessed April 19,
2021. https://www.acaps.org/covid-19-government-measures-dataset.
Crosson, Jesse M., and Srinivas C. Parinandi. 2021. “Essential or Expedient? COVID-19 and Business Clo-
sures in the U.S. States” [in English]. Publisher: Now Publishers, Inc. Journal of Political Institutions
and Political Economy 2, no. 1 (March): 81–102. issn: 2689-4823, 2689-4815, accessed April 25, 2021.
https://doi.org/10.1561/113.00000031. https://www.nowpublishers.com/article/Details/PIP-0031.
23Dave, Dhaval M., Andrew I. Friedson, Kyutaro Matsuzawa, and Joseph J. Sabia. 2020. When Do Shelter-
in-Place Orders Fight COVID-19 Best? Policy Heterogeneity Across States and Adoption Time [in en].
Technical report w27091. National Bureau of Economic Research, May. Accessed January 29, 2021.
https://doi.org/10.3386/w27091. https://www.nber.org/papers/w27091.
Dave, Dhaval M., Andrew I. Friedson, Kyutaro Matsuzawa, Joseph J. Sabia, and Samuel Safford. 2020.
“Black lives matter protests, social distancing, and COVID-19.” NBER.
Demirgüç-Kunt, Asli, Michael Lokshin, and Iván Torre. 2020. The Sooner, the Better: The Early Economic
Impact of Non-Pharmaceutical Interventions During the COVID-19 Pandemic [in en]. SSRN Scholarly
Paper ID 3611386. Rochester, NY: Social Science Research Network, May. Accessed April 19, 2021.
https://papers.ssrn.com/abstract=3611386.
Desvars-Larrive, Amélie, Elma Dervic, Nils Haug, Thomas Niederkrotenthaler, Jiaying Chen, Anna Di Na-
tale, Jana Lasser, et al. 2020. “A structured open dataset of government interventions in response
to COVID-19” [in en]. Number: 1 Publisher: Nature Publishing Group, Scientific Data 7, no. 1 (Au-
gust): 285. issn: 2052-4463, accessed March 31, 2021. https://doi.org/10.1038/s41597- 020- 00609- 9.
https://www.nature.com/articles/s41597-020-00609-9.
Elgin, Ceyhun, Gokce Basbug, and Abdullah Yalaman. 2020. “Economic policy responses to a pandemic:
Developing the COVID-19 economic stimulus index.” Covid Economics 1 (3): 40–53.
Fan, Ying, A. Yesim Orhun, and Dana Turjeman. 2020. “Heterogeneous actions, beliefs, constraints and risk
tolerance during the COVID-19 pandemic.” NBER.
Fetzer, Thiemo R., Marc Witte, Lukas Hensel, Jon Jachimowicz, Johannes Haushofer, Andriy Ivchenko,
Stefano Caria, et al. 2020. Global Behaviors and Perceptions at the Onset of the COVID-19 Pandemic
[in en]. Technical report w27082. National Bureau of Economic Research, May. Accessed April 19, 2021.
https://doi.org/10.3386/w27082. https://www.nber.org/papers/w27082.
Flaxman, Seth, Swapnil Mishra, Axel Gandy, H. Juliette T. Unwin, Thomas A. Mellan, Helen Coupland,
Charles Whittaker, et al. 2020. “Estimating the effects of non-pharmaceutical interventions on COVID-
19 in Europe.” Nature 584, no. 7820 (August): 257–261. issn: 1476-4687. https://doi.org/10.1038/
s41586-020-2405-7. https://doi.org/10.1038/s41586-020-2405-7.
Gadarian, Shana Kushner, Sara Wallace Goodman, and Thomas B. Pepinsky. 2020. “Partisanship, health
behavior and policy attitudes in the early stages of the COVID-19 pandemic.” SSRN.
24Gallego, Jorge A., Mounu Prem, and Juan F. Vargas. 2020. Corruption in the Times of Pandemia [in en].
SSRN Scholarly Paper ID 3600572. Rochester, NY: Social Science Research Network, July. Accessed
November 11, 2020. https://doi.org/10.2139/ssrn.3600572. https://papers.ssrn.com/abstract=3600572.
Grundy, Chris, Orlagh Quinn, and Sewedo Todowede. 2021. Global Dataset of Public Health and Social
Measures [in en]. Technical report. World Health Organization. Accessed April 19, 2021. https://www.
who.int/emergencies/diseases/novel-coronavirus-2019/phsm.
Hale, Thomas, Noam Angrist, Rafael Goldszmidt, Beatriz Kira, Anna Petherick, Toby Phillips, Samuel
Webster, et al. 2021. “A global panel database of pandemic policies (Oxford COVID-19 Government
Response Tracker)” [in en]. Publisher: Nature Publishing Group, Nature Human Behaviour (March):
1–10. issn: 2397-3374, accessed March 31, 2021. https : / / doi . org / 10 . 1038 / s41562 - 021 - 01079 - 8.
https://www.nature.com/articles/s41562-021-01079-8.
Harsin, Jayson. 2020. “Toxic White masculinity, post-truth politics and the COVID-19 infodemic” [in en].
Publisher: SAGE Publications Ltd, European Journal of Cultural Studies 23, no. 6 (December): 1060–
1068. issn: 1367-5494, accessed April 19, 2021. https : / / doi . org / 10 . 1177 / 1367549420944934. https :
//doi.org/10.1177/1367549420944934.
Hart, P. Sol, Sedona Chinn, and Stuart Soroka. 2020. “Politicization and polarization in COVID-19 news
coverage.” Science Communication.
Haug, Nils, Lukas Geyrhofer, Alessandro Londei, Elma Dervic, Amélie Desvars-Larrive, Vittorio Loreto,
Beate Pinior, Stefan Thurner, and Peter Klimek. 2020. “Ranking the effectiveness of worldwide COVID-
19 government interventions” [in en]. Number: 12 Publisher: Nature Publishing Group, Nature Human
Behaviour 4, no. 12 (December): 1303–1312. issn: 2397-3374, accessed January 29, 2021. https://doi.
org/10.1038/s41562-020-01009-0. https://www.nature.com/articles/s41562-020-01009-0.
Islam, Nazrul, Stephen J. Sharp, Gerardo Chowell, Sharmin Shabnam, Ichiro Kawachi, Ben Lacey, Joseph
M. Massaro, Ralph B. D’Agostino, and Martin White. 2020. “Physical distancing interventions and
incidence of coronavirus disease 2019: natural experiment in 149 countries” [in en]. Publisher: British
Medical Journal Publishing Group Section: Research, BMJ 370 (July): m2743. issn: 1756-1833, accessed
April 19, 2021. https://doi.org/10.1136/bmj.m2743. https://www.bmj.com/content/370/bmj.m2743.
25You can also read