Soil Moisture and Air Humidity Dependence of the Above-Ground Cosmic-Ray Neutron Intensity
←
→
Page content transcription
If your browser does not render page correctly, please read the page content below
ORIGINAL RESEARCH
                                                                                                                                           published: 28 January 2021
                                                                                                                                      doi: 10.3389/frwa.2020.544847

                                            Soil Moisture and Air Humidity
                                            Dependence of the Above-Ground
                                            Cosmic-Ray Neutron Intensity
                                            Markus Köhli 1,2*, Jannis Weimar 1 , Martin Schrön 3 , Roland Baatz 4† and Ulrich Schmidt 1
                                            1
                                             Physikalisches Institut, Heidelberg University, Heidelberg, Germany, 2 Physikalisches Institut, University of Bonn, Bonn,
                                            Germany, 3 Helmholtz Centre for Environmental Research-UFZ, Leipzig, Germany, 4 Agrosphere (IBG-3), Forschungszentrum
                                            Jülich GmbH, Jülich, Germany

                                            Investigations of neutron transport through air and soil by Monte Carlo simulations
                                            led to major advancements toward a precise interpretation of measurements; they
                                            particularly improved the understanding of the cosmic-ray neutron footprint. Up to now,
                            Edited by:
                         Jianzhi Dong,      the conversion of soil moisture to a detectable neutron count rate has relied mainly on
          United States Department of       the equation presented by Desilets and Zreda in 2010. While in general a hyperbolic
            Agriculture, United States
                                            expression can be derived from theoretical considerations, their empiric parameterization
                        Reviewed by:
                    Andreas Güntner,
                                            needs to be revised for two reasons. Firstly, a rigorous mathematical treatment reveals
 Helmholtz Centre Potsdam, Germany          that the values of the four parameters are ambiguous because their values are not
                       Tyson Ochsner,
                                            independent. We found a three-parameter equation with unambiguous values of the
           Oklahoma State University,
                         United States      parameters that is equivalent in any other respect to the four-parameter equation.
                   Nolwenn Lesparre,        Secondly, high-resolution Monte-Carlo simulations revealed a systematic deviation of the
     Université de Strasbourg, France
                        Trenton Franz,
                                            count rate to soil moisture relation especially for extremely dry conditions as well as very
      University of Nebraska-Lincoln,       humid conditions. That is a hint that a smaller contribution to the intensity was forgotten
                         United States
                                            or not adequately treated by the conventional approach. Investigating the above-ground
                 *Correspondence:
                                            neutron flux through a broadly based Monte-Carlo simulation campaign revealed a more
                         Markus Köhli
       koehli@physi.uni-heidelberg.de       detailed understanding of different contributions to this signal, especially targeting air
                           † ORCID:
                                            humidity corrections. The packages MCNP and URANOS were used to derive a function
                       Roland Baatz         able to describe the respective dependencies, including the effect of different hydrogen
     orcid.org/0000-0001-5481-0904          pools and the detector-specific response function. The new relationship has been tested
                                            at two exemplary measurement sites, and its remarkable performance allows for a
                    Specialty section:
          This article was submitted to     promising prospect of more comprehensive data quality in the future.
          Water and Hydrocomplexity,
                                            Keywords: Monte Carlo, neutron, soil moisture, air humidity, cosmic-ray neutron sensing, MCNP, URANOS
                a section of the journal
                       Frontiers in Water

          Received: 22 March 2020
       Accepted: 30 November 2020
                                            1. INTRODUCTION
        Published: 28 January 2021
                                            Techniques for determining the environmental water content are mostly bound to local
                               Citation:    instrumentation or remote sensing products, neither of which meet the typical correlation
Köhli M, Weimar J, Schrön M, Baatz R
                                            lengths for soil moisture. This lack of spatial coverage makes the interpretation of available data
  and Schmidt U (2021) Soil Moisture
 and Air Humidity Dependence of the
                                            difficult (Vereecken et al., 2008), and it is called the intermediate scale gap (Robinson et al.,
 Above-Ground Cosmic-Ray Neutron            2008). The method of Cosmic-Ray Neutron Sensing (CRNS) (Kodama et al., 1985; Zreda et al.,
      Intensity. Front. Water 2:544847.     2008; Desilets, 2012) is a promising tool for hydrological and environmental applications, such
       doi: 10.3389/frwa.2020.544847        as irrigation (Li et al., 2019), water resource management (Franz et al., 2016), and predictions

Frontiers in Water | www.frontiersin.org                                          1                                          January 2021 | Volume 2 | Article 544847
Köhli et al.                                                                                              CRNS Moisture and Humidity Dependence

of hydrological extremes like floods, droughts, and snow height               The CRNS probe is usually mounted 1–2 m above the ground
measurements (Schattan et al., 2017, 2019). Its non-invasive              surface and equipped with two detection units—one bare counter
nature in combination with a horizontal footprint radius in               for determining the thermal neutron flux and one counter
the order of 200 m (Köhli et al., 2015; Schrön et al., 2017)              enclosed by a moderator of 25 mm polyethylene. This makes
extending down to 75 cm (Desilets and Zreda, 2013) makes it               the system most suited for rate changes in the epithermal-to-
attractive for hydrological modeling (Shuttleworth et al., 2013)          fast energy range. The energy sensitivity of the detector, the so-
and a large variety of hydrological applications. Moreover, the           called response function, extends, however, into the thermal as
CRNS technique is increasingly applied in arid to semi-arid               well as the fast neutron regime (Köhli et al., 2018). Therefore, the
climates to support farming, irrigation, and hydro- and meteo             moderated detector is partly sensitive to high energy neutrons,
services. CRNS is based on the principle that neutrons in the             which partly accounts for the “road effect” (Schrön et al., 2018).
epithermal-to-fast energy range (1–105 eV) are highly sensitive           It also suffers from the thermal neutron contamination that
to hydrogen, which turns neutron detectors into efficient proxies         constitutes up to 20% of its signal. Both categories exhibit a
for changes of the environmental water content. It follows                different and much smaller dependence on the environmental
an inverse relationship between the above-ground epithermal-              hydrogen content than epithermal-to-fast neutrons. Desilets et al.
to-fast cosmic-ray neutron intensity N and the surrounding                (2010) and Andreasen et al. (2016), therefore, already suggested
amount of hydrogen atoms, i.e., predominantly the volumetric              to disentangle the signals to provide a higher contrast. Although
water content θ (cm3 /cm3 ). The originally proposed N0 method            recent studies tried to make use of spectral information (Baatz
by Desilets et al. (2010)                                                 et al., 2015; Tian et al., 2016) by comparing the two signals,
                                                                          the correlation between both signals and different environmental
                                                                          conditions is yet to be investigated in detail.
                                       a0                                     To assess the complex nature of neutron interactions, Monte-
                         θ (N) =              − a2             (1)
                                    N/N0 − a1                             Carlo-based n-body simulations have proven to be the only
                                                                          efficient tool to support and interpret neutron observations in
included the fitting parameters ai . Bogena et al. (2013) further         hydrology (Desilets et al., 2006; McKinney et al., 2006; Desilets
suggested to multiply it with the dry soil bulk density ̺bd in            and Zreda, 2013; Franz et al., 2013a; Shuttleworth et al., 2013).
order to convert gravimetric to volumetric moisture. N has to             The first calculations for typical environmental conditions have
be corrected for air pressure and incoming cosmic-ray variation,          been carried out by Zreda et al. (2008) in simplified domains
leading to the quantity Npi . A third correction factor Ch = 1 +          using the MCNPX code (Waters et al., 2007). More precise
0.00054 h is used to account for the water vapor in the air column        calculations regarding the CRNS footprint for various scenarios
above the sensor (Rosolem et al., 2013). One free calibration             with homogeneous domains have shown the complex neutron
parameter N0 represents the intensity over dry soil at a reference        transport conditions (Köhli et al., 2015; Schrön et al., 2017).
location (Zreda et al., 2012). This transfer function from neutrons           Since the previously recognized approach is often based
to soil moisture, however, has been developed for homogeneous             on site-specific parameters and shows weaknesses under dry
soil and under idealized conditions, while its parameters were            conditions, we will fundamentally revisit the search for the
validated empirically from only a few measurements.                       relationship between water content and neutron count rate. The
   To date, many studies were carried out for finding a                   aim is to find a function that is as generally valid as possible,
sensor calibration routine and to compare the performance                 which combines all physically relevant processes, and which,
to conventional instruments (Rivera Villarreyes et al., 2011;             generally formulated, gets by with as few free parameters as
Franz et al., 2012a; Almeida et al., 2014; Coopersmith et al.,            possible. In this context, we look at the relationship between
2014; Hawdon et al., 2014). The authors found a good                      neutrons and soil moisture as well as air humidity.
agreement between measured neutron flux and soil moisture
determinations. However, it was reported that unexplained
features in the CRNS data could not be described by the                   2. METHODS
Desilets equation (Desilets et al., 2010). Some authors explained
the deviations by additional hydrogen pools or hydrological               The scope of the paper is to develop an analytical intensity
uncertainties (Franz et al., 2013a; Baatz et al., 2014; Baroni            relation for various environmental conditions. The general shape
and Oswald, 2015). Others tried to fit the parameters of the              of such a function is motivated theoretically and parameterized.
hyperbola according to their data (Rivera Villarreyes et al., 2011;       With the help of neutron transport simulations, this model
Lv et al., 2014; Heidbüchel et al., 2016; Sigouin and Si, 2016),          is fitted to the synthetic data sets and finally evaluated using
which achieved a better correlation at the cost of site-specific          timeseries from field sites.
calibrations. In their overview, Iwema et al. (2015) provided a               The simulation toolkits used in this study are MCNP
comparison between existing N(θ ) methods, especially at the              6.2 (Werner et al., 2018) and URANOS (Köhli et al.,
Santa Rita site used in this work as well, finding that there             2015). MCNP (Monte Carlo N-Particle) is a general-purpose
is no conclusive solution for soil moisture retrieval. As shown           software that can simulate the propagation and interaction
in Rosolem et al. (2013), the Desilets equation remains not               of neutrons, electrons, protons, pions, and others. Versions
steep enough to consequently follow the change in intensity,              until MCNP4 (Briesmeister, 2000) were capable of simulating
particularly for dry conditions with soil moisture below 10%Vol .         neutrons up to 20 MeV. Since the release of MCNPX (Waters

Frontiers in Water | www.frontiersin.org                              2                                    January 2021 | Volume 2 | Article 544847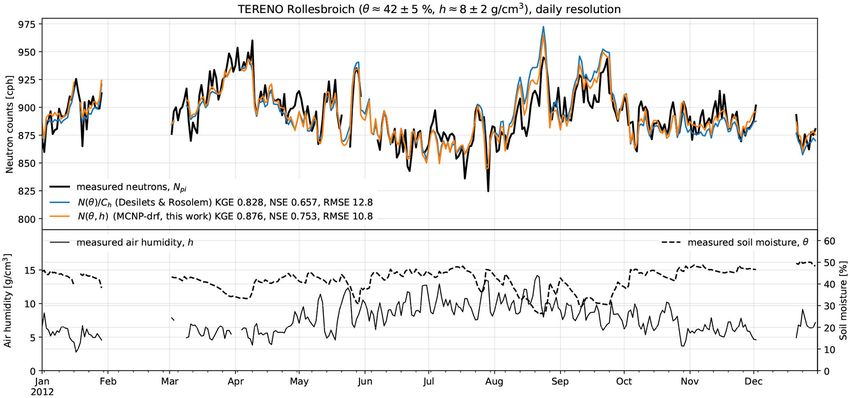
Köhli et al.                                                                                                       CRNS Moisture and Humidity Dependence

et al., 2007), it is capable to simulate the propagation of particles       subdomains, either to create an in-depth density profile or to
in the Earth’s atmosphere by extension of the energy range for              add specific entities like water or a detector. The soil consists of
many isotopes up to 150 MeV and some to GeV by using the                    50%Vol solids and a scalable amount of H2 O. The solid domain
continuously improved Cascade-Exciton Model (CEM) (Gudima                   is comprised of 75%Vol SiO2 and 25%Vol Al2 O3 at a compound
et al., 1983) and the Los Alamos Quark-Gluon String Model                   density of 2.86 g/cm3 . Thus, the total densities vary from 1.43
(LAQGSM) (Gudima et al., 2001). MCNPX in particular was                     to 1.93 g/cm3 for 0%Vol and 50%Vol soil moisture, respectively.
used in several studies to understand the CRNS signal (Desilets,            Chemical constituents regarding rock types are not relevant for
2012; Rosolem et al., 2013; Andreasen et al., 2016). With version           the characteristics in the epithermal regime (Franz et al., 2012a;
6 (Werner et al., 2018), the MCNPX branch was merged into                   Zreda et al., 2012); however, the amount of chemically bound
the main development line featuring an optional cosmic-ray                  water in rocks lies in the order of a few percent. Cutoff rigidity
source (McKinney, 2013). The Monte Carlo code URANOS                        and air pressure variations have not been studied and require an
(Ultra Rapid Neutron-Only Simulation) was developed at the                  independent treatment, the latter being also analyzed in Köhli
Physikalisches Institut, Heidelberg University, in collaboration            et al. (2015).
with the UFZ Leipzig. This code has been specifically tailored                  The input spectrum used in this work relies on the cosmic-
to the needs of the CRNS method. It is based on a voxel engine              ray propagation models by Sato and Niita (2006) and Sato
and excludes any particles other than neutrons replacing them               et al. (2008), which are based on PHITS (Iwase et al., 2002)
with effective models. Thereby, URANOS is a computationally                 and PARMA (Sato et al., 2008). The latest version (Sato, 2015)
efficient code that allows us to simulate the large environmental           provides an energy- and angle-dependent spectrum of cosmic-
setups typically found in the context of CRNS on standard                   ray neutrons for a variety of altitudes, cutoff-rigidities, solar
desktop computers. It uses the validated near-ground cosmic-ray             modulation potentials, and surface conditions. These simulations
neutron spectrum by Sato (2016). The code was employed for                  have been validated with various independent measurements,
CRNS footprint revision by Köhli et al. (2015) and Schrön et al.            i.e., Goldhagen et al. (2004) and Gordon et al. (2004), at different
(2017), in roving (Schrön et al., 2018) and irrigation studies (Li          altitudes and locations on Earth. Moreover, the analytical
et al., 2019) as well as understanding the signal for snow height           formulations of the spectra turned out to be effective in use for
measurements (Schattan et al., 2019).                                       subsequent calculations. The presented energy-dependent flux
    MCNP allows us to exchange the standard physics interaction             φ(E) is described by a mean basic spectrum φB and a modifier
cross-sections and also the use of different high-energy models.            fG for the geometry of the interface, which is defined by the
In this study, the standard databases ENDF/B-VII.1 (Chadwick                ratio in comparison to a hypothetical spectrum of a semi-infinite
et al., 2011) and ENDF/B-VIII.0 (Brown et al., 2018) were                   atmosphere. In order to take into account air humidity effects,
employed as well as JEFF 3.2 (Koning et al., 2011) and                      spectra were released at a height of usually 450 and 650 m for the
JENDL-4/HE (High Energy) (Shibata et al., 2011). URANOS                     simulations with atmospheric gradients.
couples to a combination of the ENDF/B-VII.1 and JENDL/HE
2007 (Watanabe et al., 2011) database. This JENDL/High Energy
database includes cross-sections up to 3 GeV, but the data above            3. THEORETICAL UNDERSTANDING
150 MeV were simply evaluated by JAM (Niita, 2002), an intra-
                                                                            In order to support the analytical relationship derived later in this
nuclear cascade model. As this model leads to larger deviations
                                                                            work (15), we discuss and merge the basic theoretical concepts
for highest energies, in the JENDL-4.0/High Energy release the
                                                                            behind neutron transport and interaction.
limit was set back to 200 MeV. This database was evaluated by
CCONE (Iwamoto et al., 2016), which is a more sophisticated
model compared to INCL (Boudard et al., 2013) and JAM but                   3.1. Spatial Transport
with many adjustable parameters based on experimental data.                 It is important to realize that the diffusive spatial transport of
    The use of both toolkits enables the simulation of a wide range         epithermal neutrons in air follows an exponential law, which
of typical environmental conditions, which have different effects           mainly determines the influence of air on neutrons. Considering
at different stages of neutron transport. In MCNP we included               a point source in an infinite medium, the integral version of
the most relevant particles participating in the generation of              the transport equation (Beckurts and Wirtz, 1964) reduces to a
hadrons, that is neutrons, protons, pions, and muons. We also               description of the radial flux 8(r):
implemented their typical energy spectra in order to achieve a
                                                                                                                                              ′
representative spectrum. Protons are much less abundant at sea                                  e−6t r
                                                                                                                   Z
                                                                                                                                    e−6t |r−r |
level, but they produce on average three neutrons. Muons are                       8(r) =     Q     2
                                                                                                               +       6s 8(r′ )                dV ′ ,     (2)
                                                                                              | 4πr                                4π(r − r′ )2
responsible for only a few percent of the neutron production;                                    {z }              |                {z            }
                                                                                            transient := 8tr            diffusive transport := 8dt
however, their attenuation length is twice as long.
    The air medium consists of 78%Vol nitrogen, 21%Vol oxygen,
and 1%Vol argon usually at a pressure of 1,020 mbar. The soil               with 6t being the total cross section and 6s the scattering cross
extends to a depth of 1.6 m and the air to 1,000 m. The vertical            section for changes from E −→ E′ in the volume dV ′ . The
dimensions are chosen to cover the tracks for the relevant above-           first term describes the direct “geometric” transport without any
ground flux to at least 99.9%. Both soil and air are typically              collision from a source of strength Q to a surface proportional to
represented by planes of infinite extension, which can have                 r2 . At larger distances the integration of the second term leads to

Frontiers in Water | www.frontiersin.org                                3                                              January 2021 | Volume 2 | Article 544847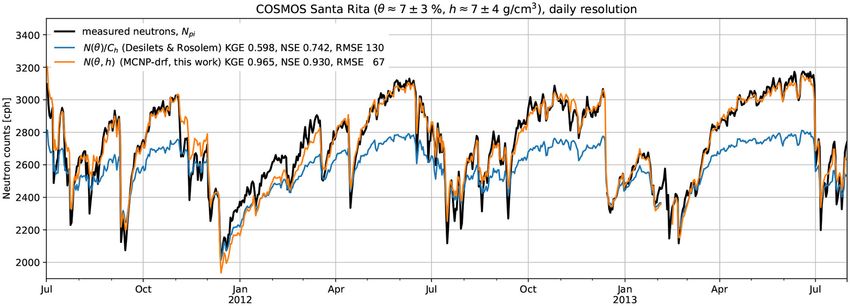
Köhli et al.                                                                                                            CRNS Moisture and Humidity Dependence

the asymptotic solution of                                                  TABLE 1 | Slowing down of neutrons by interaction with different isotopes from
                                                                            2 MeV to thermal and to an exemplary energy relevant for CRNS.
                                                e−κr                                                                                       Avg. no. collisions ncol
                                8dt (r) ≈            ,           (3)
                                                 r
                                                                            Element     Mass (u)    Log. energy decrement ξ               to thermal    To 100 eV
with κ being a function of the ratio of the cross sections. The
derivation can be found in Glasstone and Edlund (1952). In                  H              1                     1                            18             10

systems of weak absorption the absorption cross section 6a is               H2 O           –                     0.92                         20             11

much smaller than 6s . In other words the total cross section 6t            N              14                    0.134                       135             73

is approximately the scattering cross section 6s and κ can be               O              16                    0.12                        153             82
written as                                                                  Al             27                    0.0723                      255           137
                                                                            Si             28                    0.0698                      264           142
                                 κ 2 = 36a 6t .                  (4)        Fe             56                    0.0353                      522           280
                                                                            SiO2           –                     0.11                        166             90
In general such terms have to fulfill the diffusion equation, which
                                                                            Air (dry)      –                     0.135                       135             73
can be described by a transport equation for the neutron balance
in a specific volume:

                              div 8 + 6a 8 = S.                  (5)        an absolute quantity but always a fraction of the kinetic energy
                                                                            is lost. This formulation can be directly linked to the number of
Hence, in order to describe a plane or a volume source, 8 has               collisions, ncol , necessary to slow a neutron of energy E0 down
to be described by terms for which the integration over the                 to E1 :
total volume in spherical coordinates dV = r2 sin ϑdϑdφdr                                                  u                               E0
converges. Therefore, terms in 8 involving exp(−r)/rn fulfill the                                 ncol =     ,       where      u = ln        .                   (8)
                                                                                                           ξ                               E1
norm k · kL1 for n ≤ 2. In the case of (2) with 8 ∝ exp(−r)/r2
and 8 ∝ exp(−r)/r this is satisfied. In general, solutions in the           The variable u is called lethargy and ξ represents the average
form of                                                                     change in lethargy per collision. Following these relationships,
                                                          (i)               it can be estimated that fast neutrons (≈ 106 eV) need ≈ 18
                                     X           e−r/L1                     collisions with hydrogen to get thermalized below 10−5 eV,
                          8(r) =           Si              (i)
                                                                 (6)
                                                       −r/a2                whereas collisions with large nuclei like iron take more than
                                       i        r1+e
                                                                            500 collisions. This is the reason why the effect of metallic cases
can also be allowed within individual parameters describing                 around the moderator of the detector is negligible. According to
a diffusion length L(i)
                     1 and absorption-to-scattering ratios a1
                                                                 (i)
                                                                            Equation (7), the lethargy is a property of a material and decreases
and overall source contributions Si , for example, for different            with increasing nuclide mass. An overview of different atoms is
energies. For a simple diffusion approach the resulting transport           provided in Table 1.
equation can characterize 8 by a sum of exponential functions.                  For an inhomogeneous medium, the effective ξ is an average
Such has been found in Köhli et al. (2015) and Schrön et al. (2017)         of material-specific ξi weighted by their elastic cross sections σi :
with two terms, one describing a long-range transport from high                                                                          −1
energy neutrons mainly over the air and a second describing                                                                    6i σi ξi
                                                                                                   ncol = u/ξ = u                                                 (9)
the transient near-field contribution. For a more complex                                                                       6i σi
configuration with a two-medium interface, a spectral range
                                                                            In a macroscopic medium with the material density ̺ we can
for the source emission energies and the detector acceptance
                                                                            consider the macroscopic cross section, 6 = ̺ · σ . Hence, a
energy and an exponentially described volume source there is
                                                                            typical ground medium can be described with the macroscopic
no simple general solution using Fermi Age transport theory;
                                                                            cross sections of 6 soil plus a fraction w of added water 6 water :
nevertheless, the exponential range dependency of the footprint
can be motivated by the approach presented here.
                                                                                               ground               6 soil + w 6 water
3.2. Intensity Relation                                                                    ncol         =u
                                                                                                             6 soil ξ soil + w 6 water ξ water
                                                                                                                                                               (10)
The mean logarithmic reduction of the neutron energy E per
collision, ξ , is an important quantity in slowing-down theory              Since the neutron flux 8el, epith in the relevant energy range of
that describes the rate of energy loss per interaction in the elastic       0.5 eV to 0.5 MeV is proportional to the number of scatterings
scattering regime (Dobrzynski and Blinowski, 1994):                         required for thermalization (ncol ), we can conclude that the
                                                                            above-ground neutron intensity is inversely proportional to the

                    E0     (A − 1)2      A−1      2                         water fraction w:
         ξ : = ln      =1+          ln         ≈     ,           (7)
                    E         2A         A+1     A+1
                                                                                                                                                         −1
                                                                                                             ground
where A is the atomic mass number of the considered element.                I(θ ) ∝ 8epith (H2 O) ∝ ncol              ∝ 6 soil ξ soil + w 6 water ξ water
The logarithm represents the fact that, by elastic collisions, not                                                                                       (11)

Frontiers in Water | www.frontiersin.org                                4                                                January 2021 | Volume 2 | Article 544847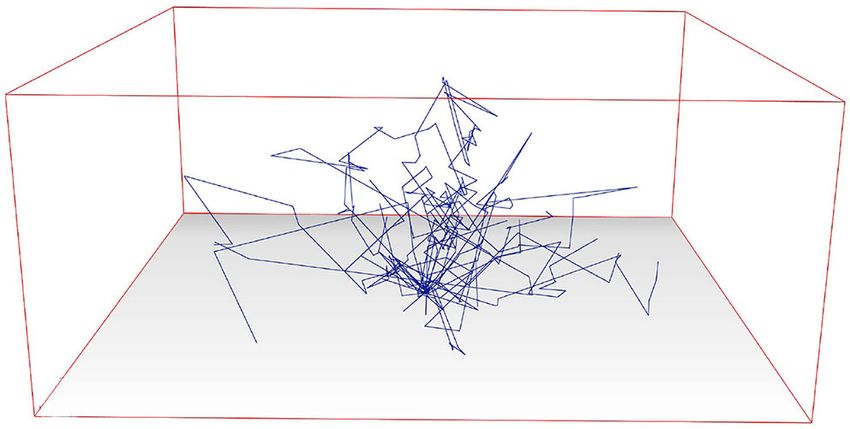
Köhli et al.                                                                                                 CRNS Moisture and Humidity Dependence

As a consequence, the relationship between above-ground                       (1957), accounts for these energy losses in a diffusive system, but
neutron intensity and soil water content is hyperbolic and scales             analytical solutions exist only for mono-energetic particles and
with the combined lethargy of soil and water. This concept is                 are not feasible for the cosmic-ray neutron spectrum exposed to
already expressed in the conventional N0 method (1) and will                  a wide range of environmental conditions with different cross-
be also used for a revised approach in this work. The statements              sections. The cosmic-ray spectrum is partly also made up of
here are to be regarded as basic analytical approaches. They only             neutrons slowed down in the air, which have a higher probability
apply to homogeneous transport problems. For the combination                  of being emitted back into the air. For thermalized neutrons, the
of different media interface effects have to be taken into account.           soil can be regarded as a source. It can be explained by the fact
                                                                              that the moderation due to the presence of hydrogen is effective
                                                                              and no isotope with a large capture cross-section is present,
3.3. Cosmic-Ray Neutron Transport on the                                      unlike the case of air in which argon and especially nitrogen are
Ground                                                                        comparably strong absorbers.
The cosmic-ray neutron spectrum (see Figure 1) exhibits a
triple peak structure. The rightmost peak at ∼100 MeV makes
up neutrons generated in atmospheric cascades from mainly                     4. CALCULATION MODEL
extrasolar particles or spallation reactions induced by protons in
the upper atmosphere. The flux of these particles directed toward
                                                                              4.1. Above-Ground Neutron Flux
                                                                              In order to analyze the above-ground neutron intensity relation
the ground is attenuated by several orders of magnitude. On
                                                                              to the environmental variables soil moisture θ and absolute air
their path, high-energy protons and neutrons also excite nuclei,
                                                                              humidity h, simulations were carried out for a set of 11 × 11
which evaporate neutrons at energies around 1 MeV. Resonant
                                                                              values from θ = 1 to 50% and h = 1 to 35 g/m3 with 106 –107
nuclear excitations are responsible for the comb-like structure of
                                                                              initial neutrons each. A detector layer was placed at a height of
this peak. Toward lower energies, elastic scattering becomes the
                                                                              1.3–1.5 m, and it records the tracks of neutrons passing through.
dominant interaction as long as neutrons are epithermal. Due to
                                                                              The energy sensitivity of this layer can be adjusted. In this
the mass of hydrogen being nearly equal to that of the neutron,
                                                                              study the following two settings have been used: a fixed energy
this following energy band is most sensitive to water and organic
                                                                              window (THL) scores neutrons from 1 eV to 10 keV and a more
molecules and thus most relevant for the method of cosmic-
                                                                              realistic approach, which employs the detector response function
ray neutron sensing. Below 1 eV the kinetic energy of the target,
                                                                              (drf) from Köhli et al. (2018). The discussion does not explicitly
which is usually in thermal equilibrium (25 meV), significantly
                                                                              distinguish between incoming and albedo flux; however, in order
contributes to the neutron’s energy during a collision. As a
                                                                              to interpret the signal changes as a function of environmental
consequence, neutrons finally become thermalized and perform
                                                                              variables, it is necessary to understand the transport paths
a random walk until they are absorbed.
                                                                              of neutrons to the detector. Besides the fraction of incoming
    In the air, the mean free path for neutrons is ∼1,000 times
                                                                              radiation, which acts as a background, there are three main types
greater than in the soil. In an artificial scenario aiming to visualize
                                                                              of transport processes: so-called geometric transport from the soil
the transport at the interface, a flux column is released onto
                                                                              surface directly to the detector and typical mid-range transport
the ground. By focusing such a “neutron beam” onto one spot,
                                                                              of neutrons which cross the air-ground interface several times.
on the surface, the three-dimensional spatial distribution can
                                                                              The far-field transport can be understood as neutrons originating
be seen more directly, as the flux of the cosmic-ray neutron
                                                                              from a remote ground location and being transported mainly
spectrum of Figure 1 is otherwise mostly omnidirectional. A
                                                                              over the air with long path lengths. A set of such tracks is
rather dry condition is chosen in order to show a more
                                                                              exemplarily visualized in the simulated detector of Figure 3.
spatially extended distribution. Figure 2 shows the tracks of
all neutrons in the domain in three different energy regimes.
Most high-energy neutrons entering the soil are scattered in a                4.2. Calculation of Particle Fluxes
forward direction, and the possibility of leaving the ground is               4.2.1. The Effect of the Cross Section Database
therefore considerably low; the exception is those originating                Neutron simulation toolkits provide very similar results for the
from evaporation processes, which emit secondary particles                    well-understood physics below 20 MeV. Yet, there are differences
nearly isotropically. However, only neutrons within the top few               with respect to the cross-section database and the high energy
dozen centimeters below the interface border exhibit a significant            transport models. Most resources agree with each other and
probability of leaving. In general, this also leads to slant soil             exhibit differences on the level of a few percent on the low
emission angles being suppressed. Epithermal neutrons below                   energy cross-section. By far the best-known isotope is 1 H with an
1 MeV behave rather diffusively until they are moderated to                   uncertainty of 0.3%. In a first study, we compared different cross-
thermal energies. As a first-order approach, one can expect                   section databases, which extend into the range above 20 MeV.
neutrons to behave as a diffusive gas, as it was formulated                   However, as described in section 2, most of the necessary high-
by Glasstone and Edlund (1952), and applied to a footprint                    energy interactions are calculated by specific models. Therefore,
estimate by Desilets and Zreda (2013). But since every collision              the exchange of cross-section databases does not exclusively
results in an energy loss for the neutrons, their mean free                   determine the result of a cosmic-ray neutron transport study.
path between collisions changes and pure diffusion theory loses               A broader overview of available toolkits can be found in Köhli
validity. The Fermi Age theory, e.g., applied in Barkov et al.                (2019).

Frontiers in Water | www.frontiersin.org                                  5                                    January 2021 | Volume 2 | Article 544847
Köhli et al. CRNS Moisture and Humidity Dependence
F lux E · dΦ/d E [c m /s , a rb. s c a le ]
water-sensitive domain incoming + albedo
thermal albedo
slowing down
-2
direct soil emission
1 eV 1 keV 1 MeV 1 GeV
Energy
FIGURE 1 | Cosmic-ray neutron spectrum above dry ground. Three distinct peaks can be observed, which correspond to three physical processes. High-energy
neutrons are generated in cascades in the upper atmosphere with energies up to several GeV. By interaction with atoms in the air or ground evaporation, neutrons are
emitted with energies around 1 MeV. Finally, by elastic scattering, neutrons are slowed down until they are in thermal equilibrium with their environment. The total
spectrum (black outline) can be separated into one part comprising albedo neutrons that have been in the soil (blue) and therefore carry soil moisture information and
the incoming fraction (light blue), which can be considered a background. The spectrum which is emitted from the soil (“direct soil emission,” dark blue), mainly due to
neutrons which have been generated in the ground, shows that the overall intensity is the result of several oscillations around the air-ground interface.
FIGURE 2 | Flux calculation of an air-ground interface in which neutrons are artificially released centered straight down but with a CR spectrum according to Figure 1.
The simulated neutron tracks from evaporation (MeV) to absorption (thermal) of 80·104 histories are displayed in a domain of 3 × 3 × 3 m with a track density scaling
from dark blue to white (Köhli, 2019).
The ensemble of different cross-section databases with the λair = 150–160 g/cm2 , similar to MCNP6. Yet, the attenuation
same high-energy model (Table 2) leads to a relative variation of length in water is λwater ≈ 135 g/cm2 . In MCNP6 for a neutron-
the predicted flux by 3% for a range of dry and wet conditions. only transport scenario one finds λwater ≈ 110 g/cm2 , and if
The deviation of URANOS and MCNP6 is found to be ∼2%, protons, pions, and muons are included, λwater ≈ 120 g/cm2 .
which amounts to a relative difference of 10%. There is a clear Cosmogenic nuclide studies, however, suggest values rather in the
difference for both toolkits between the predicted flux for air order of 130 g/cm2 (Nesterenok and Naidenov, 2012). As a result
humidity and soil moisture changes. URANOS produces an in MCNP6 high-energy neutrons are attenuated faster and the
attenuation length in air, depending on the cutoff rigidity, of relative production of evaporation neutrons in the top soil layers
Frontiers in Water | www.frontiersin.org 6 January 2021 | Volume 2 | Article 544847Köhli et al. CRNS Moisture and Humidity Dependence
TABLE 2 | Comparison of the scaling of I(θ, h) for different simulation toolkits.
MCNP6 URANOS
ENDF8 JEFF3.2 JENDL4 ENDF7/JENDL-HE
Simulation setting from condition → to condition THL drf THL drf THL drf THL drf
1% → 50%, 1 g/m3 0.218 0.309 0.224 0.315 0.213 0.301 0.248 0.342
1 g/m3 → 35 g/m3 , 1% 0.831 0.847 0.828 0.845 0.821 0.842 0.794 0.810
1%, 1 g/m3 → 50%, 35 g/m3 0.185 0.267 0.190 0.271 0.184 0.263 0.197 0.285
MCNP6 was additionally coupled to different cross-section databases. The change from dry to moist conditions has been analyzed for fixed upper and lower detection limits 1 eV to
10 keV (THL) and a detector response function (Köhli et al., 2018) for a standard sensor (drf). Each run provided enough statistics that all digits are significant. The provided ratios
cover a range of soil moisture values at a fixed air humidity and a range of air humidity at a fixed soil moisture value, while both quantities have been increased from the lower to the
upper bound.
FIGURE 3 | Transport of cosmic-ray neutrons within a domain of 600 × 600 ×
250 m. A detector is placed in the center at a height of 1.5 m. The tracks that
are shown in blue correspond to 35 neutrons that probed the soil at some
point on the plane and ended up in the detector volume. These exemplary
tracks show typical paths neutrons travel until detection. Besides the
importance of air as a transport medium it is noteworthy that most last
scatterings occur in the direct vicinity of the sensor.
FIGURE 4 | Above-ground neutron intensity as a function of air humidity and
soil moisture simulated by URANOS applying a simulated detector response
is higher. This could lead to a larger difference in the flux between function. The contour lines show the extrapolated intensity change in steps of
5%. For dry soils air humidity has a stronger effect as neutrons travel over
dry and moist conditions.
longer distances. The effect of water vapor is non-linear.
4.2.2. The Effect of the Detector Response Function
Taking into account the actual detector response function
significantly reduces the predicted flux change, whereas the
length of 2.3 km was assumed according to Rosolem et al.
energy window method leads to a factor of ∼4.5 for a soil
(2013). The results are shown in Table 3. One finds, that using
moisture change from 1 to 50%, including the response function
a vertically inhomogeneous atmosphere especially has an effect
reduces this by 40% to a factor of about 3. This can be
on the soil moisture scaling and less on air humidity variations.
attributed to the fact, that the energy bands above and below
In that scenario, MCNP and URANOS agree well with each
the water-sensitive domain are less affected by environmental
other for the predicted flux changes. However, it does not
hydrogen changes (see Figure 1). The detector is susceptible to
agree with the results of Rosolem et al. (2013), especially it is
contamination by thermal neutrons, which scale differently with
interesting to note that even with ten times larger statistics the
environmental water, and on the other hand, the evaporation
MCNP6 runs still have larger uncertainties than shown in the
peak includes more neutrons, which have never probed the
referenced publication.
soil (Köhli et al., 2018). A more comprehensive analysis of the
detector response function can furthermore be found in Weimar
et al. (2020). 5. RESULTS AND DISCUSSION
4.2.3. The Effect of Air Humidity Profiles 5.1. Global Intensity Scaling
As air humidity can be distributed vertically inhomogeneous The relative reduction in neutron intensity at the surface for
in a second simulation set, a humidity profile with an e-fold different soil moisture conditions when humid atmosphere layers
Frontiers in Water | www.frontiersin.org 7 January 2021 | Volume 2 | Article 544847Köhli et al. CRNS Moisture and Humidity Dependence
TABLE 3 | Comparison of the scaling of I(θ, h) for different simulation toolkits.
MCNP6 URANOS
Profile Th. shield Profile Th. shield
Simulation setting THL drf drf THL drf drf
from condition → to condition
1% → 50%, 1 g/m3 0.264 0.350 0.266 0.254 0.350 0.290
1 g/m3 → 35 g/m3 , 1% 0.825 0.827 0.833 0.794 0.818 0.800
1%, 1 g/m3 → 50%, 35 g/m3 0.207 0.292 0.226 0.203 0.291 0.231
The change from dry to moist conditions has been analyzed for fixed upper and lower detection limits 1 eV to 10 keV (THL) and a detector response function (Köhli et al., 2018) for a
standard sensor (drf) and a sensor with thermal neutron shield (shielded). For the setting “Profile,” the air humidity was scaled like in Rosolem et al. (2013). The provided ratios cover a
range of soil moisture values at a fixed air humidity and a range of air humidity at a fixed soil moisture value, while both quantities have been increased from the lower to the upper bound.
are added is shown in Figure 4. The plots do not qualitatively the parameters of this equation led to site-specific solutions.
change for simulations using the energy window settings or If the neutron intensity at a specific station does not change
the detector response function and likewise not for URANOS significantly, a locally adapted hyperbola like (1) can lead to an
or MCNP6. For humid compared to dry air the maximum acceptable fit quality given the fact that there are most often
achievable count rate is reduced by 20% in case of dry soil unknown systematic errors. In different studies, including the
conditions. This quantitatively agrees with Rosolem et al. (2013) literature cited here, typical calibration plots indicate a more
who studied the change from dry to 22 g/m3 . However, a steep I(θ ) relation than can be achieved by (1). Especially when
strictly linear relationship for water vapor cannot be verified. calibrated to rather moist conditions, the gradient from the
The presented reduction rate of 0.0054 per gram air humidity Desilets equation is able to follow the simulations over a broad
in Rosolem et al. (2013) seems to hold only for dry conditions. range of the variable space (see Figure 5 left). The reason is
The scaling to moist soils is non-linear, as seen by the contour that the solution (15) for the above-ground neutron flux can
lines in Figure 4. Within the parameter space of this study, require an additional exponential term (6), which leverages the
the relative intensity change for scaling water vapor lies in all intensity changes especially for dry conditions (see section 3).
cases in the order of 20% for 1 g/m3 → 35 g/m3 (see Table 2). The possibility of such a description had already been indicated
This observation can be attributed to the fact that, for dry by Köhli (2019). COSMIC (Shuttleworth et al., 2013) relies on an
conditions, neutrons travel much longer paths and start with exponential description for I(θ ) and is able to better reproduce
higher energies, both of which increase the transport through the intensity changes as can be seen for an exemplary evaluation
air, which, in case of a decreasing vertical humidity profile, is in Figure 5. Yet, one can likewise ascertain a limited steepness for
even amplified. The results presented in Figure 5 also show dry conditions. In conclusion, the findings here underline that
that using fixed upper and lower boundaries for scoring the for CRNS two important factors have to be taken into account.
neutron flux (energy window), the intensity scaling as a function First, air humidity corrections are non-linear, yet the relative
of soil moisture is significantly higher. While the latter reduces changes can be linearized, and second, the intensity scaling is
the intensity by ∼75% from dry to wet soils, using a detector much steeper than until now assumed based on the N0 method.
response function reduces the measured flux by 65%. In Franz
et al. (2013b) the authors already experimentally found a scaling
factor of 2.5–3 between wet and dry conditions by comparing the
5.2. Revision of the Intensity Relation
We have shown in section 3 that a hyperbolic formulation is
data of ∼ 40 COSMOS stations. This disparity could imply that
reasonable to express the relationship between neutron intensity
further studies with fixed lower and upper energy boundaries
and soil moisture (see relation 11). The Desilets equation (1)
would overstate intensity changes regarding soil moisture. Yet,
satisfies this condition; however, it is mathematically overdefined.
applying the response function of a neutron detector using a
The four parameters (a0 , a1 , a2 , and N0 ) are correlated, i.e., one of
shield, which absorbs more than 90% of the thermal neutron
them is redundant. Any attempt to optimize or fit the parameters
spectrum, yields a scaling between both cases. This study finds,
will lead to multiple, non-unique solutions as a hyperbola is
based on Table 3, that the performance of CRNS detectors with
defined by only three parameters. We believe that this is one of
regard to the measured intensity differences can be improved
the reasons why different researchers found different parameter
by at least 20% using such a thermal neutron shield. Although
sets for their sites.
it reduces the overall measured flux, the improvement in the
For a rigorous treatment, and to allow for unique fitting
steepness of the I(θ ) relation can be beneficial especially for
solutions, it is necessary to reduce the hyperbolic part to three
moist conditions.
parameters. We start from the Desilets Equation (1):
The major outcome of this study is that the N0 method (1)
is not steep enough to describe measurements, especially in
dry regions. The hyperbolic characteristics reflect well local a0 1 − N/Nmax
θ (N) = − a2 = ã0 , (12)
gradients, which is the reason why different adaptations of N/N0 − a1 ã1 − N/Nmax
Frontiers in Water | www.frontiersin.org 8 January 2021 | Volume 2 | Article 544847Köhli et al. CRNS Moisture and Humidity Dependence
1.1 1.1
relative intensity
relative intensity
1.0 MCNP6 full + Detector Response 1.0
MCNP6 full + Energy Window
0.9 0.9
URANOS + Detector Response
0.8 N0method 2010 0.8 MCNP6 full 1 %
COSMIC 2013 MCNP6 full 50 %
0.7 0.7
MCNP6 50 %
URANOS 1 %
0.6 0.6
URANOS 50 %
0.5 0.5 URANOS UTS Fit
Rosolem 2013
0.4 3 3
0.4
1 g/m - 35 g/m
0.3 0.3
0.2 0.2
0 10 20 30 40 50 0 5 10 15 20 25 30 35
soil moisture [%] air humidity [g/m3]
FIGURE 5 | CRN intensity scaling for a simulation set with MCNP and URANOS in comparison with MCNP6, indicating a neutron-only simulation and MCNP6 full
including all particle species. (Left) The intensity scaling with the shaded area indicating the variation from minimum to maximum air humidity shows the N0 method (1),
the COSMIC forward operator and different simulations with flux recording set to fixed lower and upper bounds (energy window), or using a typical detector response
function. (Right) The water vapor correction is compared to simulations of 1 and 50% soil moisture, which all use the detector response function. The UTS fit for
URANOS is shown exemplarily.
where the new parameters ã0 , ã1 , and Nmax can be expressed in be expressed by a correction factor Ch , which is, in a first-
terms of the classic parameters: order approximation, linear in h and especially accounts for the
increased density. We found that the linear relationship is not
a1 a2 a0 + a1 a2 enough to account for the changes in the very dry air regime,
ã0 = −a2 , ã1 = , .
Nmax = N0
a0 + a1 a2 a2 attributed to the long-range neutrons which probed the soil at
(13) distances of 100 m and beyond. Those neutrons are exceptionally
Here, Nmax is slightly larger than N0 and represents the absolute exposed to air humidity above the surface and also interact with
upper bound of the above-ground neutron flux. With these the soil 2–3 times on their way to the detector (Köhli et al., 2015).
three, instead of four, parameters, this function is now uniquely Therefore, we propose a non-linear correction factor using at
defined and should be much better suited for calibration and least a 2nd order Taylor expansion.
optimization methods. The equation in the final form becomes
The inverse relation can be expressed as
p1 + p2 θ
ã0 + ã1 θ I θ , h = ND p0 + p6 h + p7 h2
I θ , h ≡ N θ , h = Nmax · ∼ (ã0 + θ )−1 (14) p1 + θ
ã0 + θ
+ e−p3 θ p4 + p5 h . (15)
As explained in section 3, there are reasons to assume a strong
link between above-ground neutron flux and soil moisture as
well as air humidity. For this reason, we propose to extend This universal transport solution (UTS) is a general description of
this function with physically reasonable terms that express this I(θ , h). The parameters pi are derived from a two-dimensional fit
complex relationship. The intensity scaling in the water-sensitive on simulated data sets (see also Table A1). The scaling constant
domain can be very well-described by a hyperbolic expression ND accounts for the average specific detector count rate and
like (14), which originates from the stopping power of the can be determined with any combination of I, θ , and h. For soil
medium slowing down the neutrons as described in (11). An moisture retrieval θ (I, h) has to be inverted numerically (e.g.,
offset can be added that amounts for the ’incoming’ part of the using the Newton-Raphson method), which is beyond the scope
neutron spectrum. The diffusive spatial transport of neutrons of this work. UTS can be used with volumetric or gravimetric soil
in an absorbing medium however can be described by an moisture by rescaling θ .
exponential law like (6). These are the main effects that contribute
to the above-ground neutron flux. As a rigorous analytical 5.3. Experimental Evidence
solution would be too complex, we use these findings as a Every parameter set from different simulation settings for the
mathematical structure and evaluate their different contributions presented function has its own justification depending on a
by fitting this generalized approach to a simulation data set. specific site and detector conditions. It is beyond the scope
As Rosolem et al. (2013) have shown that the influence of this work to conclusively clarify which function would be
of water vapor, h, in the air column above the sensor can generally best suited for CRNS applications, as it would require
Frontiers in Water | www.frontiersin.org 9 January 2021 | Volume 2 | Article 544847Köhli et al. CRNS Moisture and Humidity Dependence
a statistically sound study with a large set of data from various For each of the settings described in section 4.2, Equation (15)
stations around the world. was fitted to the full set of simulation data with an
We exemplarily pick two distinct sites to illustrate the general atmospheric profile of water vapor in height h according to
performance of the proposed UTS approach compared to the exp(−h/(2,300 m)). The resulting parameter sets are provided
conventional relationship. The first site is the COSMOS station in the Table A1. UTS provides an excellent agreement with the
at the Santa Rita Experimental Range (SRER) in Arizona, US, data outperforming by far the hitherto used approach of the
which is exposed to a very dry climate with rapidly changing air Desilets equation (1) with the water vapor correction (Rosolem
humidity (Zreda et al., 2008; Franz et al., 2012b). For example, et al., 2013) (see Figures 6, 7). It is especially interesting to
SRER provided the data basis of the works by Franz et al. (2013b) notice that the short-term variation in the data seems to be
and Rosolem et al. (2013). SRER has also been used by Iwema entirely due to air humidity changes. This can also be concluded
et al. (2015) for a study concerning a new N(θ ) approach since from the statistical analysis of hourly and daily accumulation
the N0 method was known to not perform well enough at this intervals (see Table A1), in which the latter show much better
site. We would expect to see a stronger dependency of the agreement. In another parameter set (not shown) in which we
neutron intensity on soil moisture and air humidity in very doubled the air humidity scaling, we could achieve a better
dry periods. statistical significance. We therefore deduce that the water vapor
The second data set is from the Rollesbroich grassland changes at this site are much higher than actually measured by
test site in Central Europe, part of the TERENO Rur ground-based instruments. It could also mean that atmospheric
Observatory (Bogena et al., 2018) and with contrasting profiles, at least under such extreme conditions, can play a role
climatic conditions compared to SRES. Annual precipitation in precise soil moisture retrieval. An underestimation of the
of 1,037 mm (2012) is distributed throughout the year, while surface moisture dynamics might also be the reason why the
evapotranspiration focusses on the months April to September energy window functions show a slightly better agreement to the
and sums to 480 mm in 2012 (Gebler et al., 2015). Dry measured neutron intensity. As the uppermost TDT probe depth
aboveground biomass is negligible with 0.2 kg/m2 (Baatz et al., is located 10 cm below the surface, the near-ground variations
2015). The Rollesbroich test site features a network of 84 may enforce larger intensity fluctuations than is actually reflected
nodes with each three TDT (Time Domain Transmissometry) by the data set. As URANOS and MCNP6 provide comparable
sensors installed in 5, 20, and 50 cm depth (Qu et al., 2016). results in order to analyze the best detector representation
The grassland is structured into several smaller fields which further sites will be necessary for testing.
are in part and irregularly subject to management activities The UTS approach proposed here shows significantly higher
(mowing, manuring). Both soil moisture intensity conversions skill in soil moisture representation for all three measures,
well represent soil moisture dynamics. The TDT data of both sites KGE, RMSE, NSE (Figure 8) compared to the traditional four-
were weighted horizontally and vertically according to Schrön parameter approach. Several periods show varying performance
et al. (2017). In the rather wet and humid climate, we would but the “MCNP drf ” approach is consistently closer to the
expect no substantial difference to the performance of the observed reference neutron flux throughout most of the year.
conventional N0 approach, except for a slightly stronger influence Short-term offsets, such as those in May and August, could
of air humidity according to Figure 4. be explained by unmonitored management. Considering high
The SRER data set, however, incorporates systematic humidity and rather wet soils, the here proposed method based
uncertainties, which are significant at the level of the on “MCNP drf ” is a promising advance to previous soil moisture
achieved precision. The supplement data provided by T. neutron intensity conversions.
Franz compensates for the partial lack of environmental data
by the sensor itself. However, there are small differences to the
level 0 website data in relative air humidity and temperature 6. CONCLUSIONS
as well as a noticeable pressure offset in 2011 by 2 mbar. With
none of the in situ probes being closer to the sensor, the large In this study, we investigated the relationship between near-
contribution from the near-field remains unknown. As the surface epithermal neutron intensity and water content in
uppermost TDT data is retrieved from a depth of 10 cm, the the soil and atmosphere. The analytical form has been
weighted soil moisture is dominated by this layer. Given that derived from physical principles while the parameter sets were
in deserts the largest dynamics can be observed at the surface, determined from neutron transport simulations for various
especially great signal deviations are therefore expected for types of model setups. We demonstrated the performance of
hourly data. For the periods of extremely dry conditions the our approach exemplarily at a dry and a wet instrument site
uncertainty on the lattice water, which can constitute half of using data from cosmic-ray neutron sensors and soil moisture
the measured moisture, also becomes a relevant quantity. As monitoring networks.
there is no neutron monitor close to the experimental site or A variety of modeling concepts have been evaluated using
worldwide at the same cutoff rigidity we analyzed several stations MCNP6 vs. URANOS, different cross-section databases, and
statistically for their correction significance. We found that data different detector energy response functions (Tables 2, 3). MCNP
from the NEWK station (Newark) slightly outperformed the data simulations greatly benefited from the inclusion of protons and
from the conventional JUNG station (Jungfraujoch), especially muons while they showed good agreement to URANOS on the
during Forbush decreases (Cane, 2000). level of 2–10%. The discrepancy might be attributed to the
Frontiers in Water | www.frontiersin.org 10 January 2021 | Volume 2 | Article 544847Köhli et al. CRNS Moisture and Humidity Dependence FIGURE 6 | The COSMOS site “Santa Rita” exhibits periods of extremely dry soil and air. The measured neutron flux Npi (black) was corrected for air pressure and incoming radiation. Daily aggregation is applied on all data. Soil moisture θ from the surrounding TDT network has been converted to neutron intensity using two approaches: (blue) the equation from Desilets et al. (2010) with the inverse water vapor correction from Rosolem et al. (2013), and (orange) the formula (15) presented in this work, using the parameter set “MCNP drf.” Kling-Gupta Efficiency (KGE), Nash-Sutcliffe Efficiency (NSE), and root mean square error (RMSE) are reported with respect to Npi . Note that the Desilets fit (blue) has been shifted by −200 cph to better illustrate the poor performance toward dry conditions (i.e., high neutron counts). FIGURE 7 | Cutout section of the data sequence in Figure 6 with a temporal aggregation of 3 h for the summer period of 2013, where soil moisture is almost constant and the diurnal variations of air humidity are predominantly influencing the count rate. Note that the Desilets fit (blue) has been shifted by −200 cph to better illustrate the poor performance toward dry conditions (i.e., high neutron counts). missing consensus about the effective attenuation length in water, The neutron response to air humidity has been investigated which will be investigated in future research. The choice of the using homogeneous, exponential, and heterogeneous right detector response is crucial to the relationship between atmospheric profiles. Similar to Rosolem et al. (2013) we neutrons and soil moisture. For example, the dynamic range found that only the lowest 600 m are relevant for CRNS of N(θ ) would be reduced by up to 40% using the detector- modeling. Our experimental results also suggest that complex specific response function compared to the conventional energy- atmospheric profiles could have previously undiscovered effects window approach. Additional shielding material would be on CRNS measurements under dry conditions. Our simulations able to exclude thermal neutrons and to partly restore this also suggest that the neutron response to water vapor depends dynamic range. on soil moisture itself. Hence, we recommend a non-linear Frontiers in Water | www.frontiersin.org 11 January 2021 | Volume 2 | Article 544847
Köhli et al.                                                                                                                   CRNS Moisture and Humidity Dependence

  FIGURE 8 | The TERENO site “Rollesbroich” features a humid climate with wet grassland soils. The measured neutron flux Npi (black) was corrected for air pressure
  and incoming radiation with data aggregated in daily intervals. Soil moisture θ from the surrounding TDT network has been converted to neutron intensity using two
  approaches: (blue) the equation from Desilets et al. (2010) with the inverse water vapor correction from Rosolem et al. (2013) and (orange) the formula (15) presented
  in this work using the parameter set “MCNP drf.”

correction approach as an alternative to the conventional                                AUTHOR CONTRIBUTIONS
method from Rosolem et al. (2013).
    The hitherto accepted N(θ , N0 ) approach was found to be                            MK and US wrote the manuscript. JW provided the MCNP
overdefined by one redundant parameter. This might be one                                simulations. MS and RB provided the experimental verification
of the reasons for the growing number of studies proposing                               data. MS conducted the analysis on the field data. All authors
site-specific parameter calibrations. Furthermore, our revised                           contributed to the article and approved the submitted version.
simulations with MCNP and URANOS showed a significantly
steeper neutron response to soil moisture at the dry end.
Based only on our simulations, we deduced a new universal                                FUNDING
transport solution (UTS, Equation (15)) that implicitly includes
the correction for air humidity. The parameters only depend                              URANOS was developed within the project Neutron Detectors
on the physical model used, except for the detector-specific                             for the MIEZE method and Forschung und Entwicklung
scaling parameter ND . A reversed formulation, θ (I, h), could                           hochauflösender Neutronendetektoren, funded by the
be performed numerically. We hope that this solution could                               German Federal Ministry for Research and Education
contribute to a more general and unique sensor calibration.                              (BMBF), grant identifier: 05K10VHA and 05K16PD1. The
    Our new approach has been evaluated at dry and a wet site                            project Large-scale and high-resolution mapping of soil
in Arizona (US) and Germany, respectively, which cover a wide                            moisture on field and catchment scales boosted by cosmic-
range of soil moisture (1–50%Vol ) and air humidity (1–25 g/m3 ).                        ray neutrons was funded within the DFG research group
At both sites, the UTS led to significantly improved CRNS                                Cosmic Sense FOR 2694. The TERrestrial Environmental
performance compared to the conventional Desilet’s equation                              Observatory (TERENO) was funded by the Helmholtz
(e.g., KGE 0.60 → 0.97). Future studies are encouraged to                                Association and the Federal Ministry of Education and
investigate the performance of this approach on a larger number                          Research. We acknowledge financial support by the Baden-
of locations. The UTS function can serve as a base description                           Württemberg Ministry of Science, Research and Arts and by
for further CRNS related studies, such as biomass effects or                             Ruprecht-Karls-Universität Heidelberg.
hydrological profiles, which look for rather small deviations from
the overall signal.
                                                                                         ACKNOWLEDGMENTS
DATA AVAILABILITY STATEMENT
                                                                                         MK and MS acknowledge Trenton Franz for providing the
The raw data supporting the conclusions of this article will be                          extended Santa Rita data set and Lena Scheiffele for the weighting
made available by the authors, without undue reservation.                                of the in situ soil moisture data.

Frontiers in Water | www.frontiersin.org                                            12                                           January 2021 | Volume 2 | Article 544847
You can also read