Whole genome analysis of water buffalo and global cattle breeds highlights convergent signatures of domestication
←
→
Page content transcription
If your browser does not render page correctly, please read the page content below
ARTICLE
                  https://doi.org/10.1038/s41467-020-18550-1                 OPEN

                  Whole genome analysis of water buffalo and global
                  cattle breeds highlights convergent signatures of
                  domestication
                  Prasun Dutta1,2,13, Andrea Talenti 1,13, Rachel Young 1, Siddharth Jayaraman 1, Rebecca Callaby 1,3,
                  Santosh Kumar Jadhav4, Velu Dhanikachalam4, Mayakannan Manikandan 5, Bhim B. Biswa 5,
                  Wai Y. Low 6, John L. Williams 6,7, Elizabeth Cook 8,9, Phil Toye8,9, Eileen Wall10, Appolinaire Djikeng3,9,
                  Karen Marshall8,9, Alan L. Archibald 1, Suresh Gokhale4, Satish Kumar5,11, David A. Hume12 ✉ &
1234567890():,;

                  James G. D. Prendergast1,3 ✉

                  More people globally depend on the water buffalo than any other domesticated species, and
                  as the most closely related domesticated species to cattle they can provide important insights
                  into the shared evolutionary basis of domestication. Here, we sequence the genomes of 79
                  water buffalo across seven breeds and compare patterns of between breed selective sweeps
                  with those seen for 294 cattle genomes representing 13 global breeds. The genomic regions
                  under selection between cattle breeds significantly overlap regions linked to stature in human
                  genetic studies, with a disproportionate number of these loci also shown to be under
                  selection between water buffalo breeds. Investigation of potential functional variants in the
                  water buffalo genome identifies a rare example of convergent domestication down to the
                  same mutation having independently occurred and been selected for across domesticated
                  species. Cross-species comparisons of recent selective sweeps can consequently help
                  identify and refine important loci linked to domestication.

                  1 The Roslin Institute, University of Edinburgh, Easter Bush, Midlothian EH25 9RG, UK. 2 Centre for Genomic and Experimental Medicine, MRC Institute of

                  Genetics & Molecular Medicine, University of Edinburgh, Crewe Road, Edinburgh EH4 2XU, UK. 3 Centre for Tropical Livestock Genetics and Health, Easter
                  Bush, Midlothian EH25 9RG, UK. 4 BAIF Development Research Foundation, Central Research Station, Uruli Kanchan, Pune, Maharashtra 412202, India.
                  5 Centre for Cellular and Molecular Biology, Habsiguda, Uppal Road, Hyderabad, Telangana 500007, India. 6 Davies Research Centre, School of Animal and

                  Veterinary Sciences, University of Adelaide, Roseworthy, SA 5371, Australia. 7 Dipartimento di Scienze Animali, della Nutrizione e degli Alimenti, Catholic
                  University of the Sacred Heart, Piacenza, Italy. 8 International Livestock Research Institute (ILRI), Nairobi 30709-00100, Kenya. 9 Centre for Tropical
                  Livestock Genetics and Health, ILRI Kenya, Nairobi 30709-00100, Kenya. 10 Scotland’s Rural College (SRUC), Easter Bush, Midlothian, Edinburgh EH25 9RG,
                  UK. 11 Department of Biotechnology, School of Life Science, Central University of Haryana, Mahendergargh, Haryana 123031, India. 12 Mater Research
                  Institute-University of Queensland, Translational Research Institute, Woolloongabba QLD 4102, Australia. 13These authors contributed equally: Prasun Dutta,
                  Andrea Talenti. ✉email: david.hume@uq.edu.au; james.prendergast@roslin.ed.ac.uk

                  NATURE COMMUNICATIONS | (2020)11:4739 | https://doi.org/10.1038/s41467-020-18550-1 | www.nature.com/naturecommunications                                 1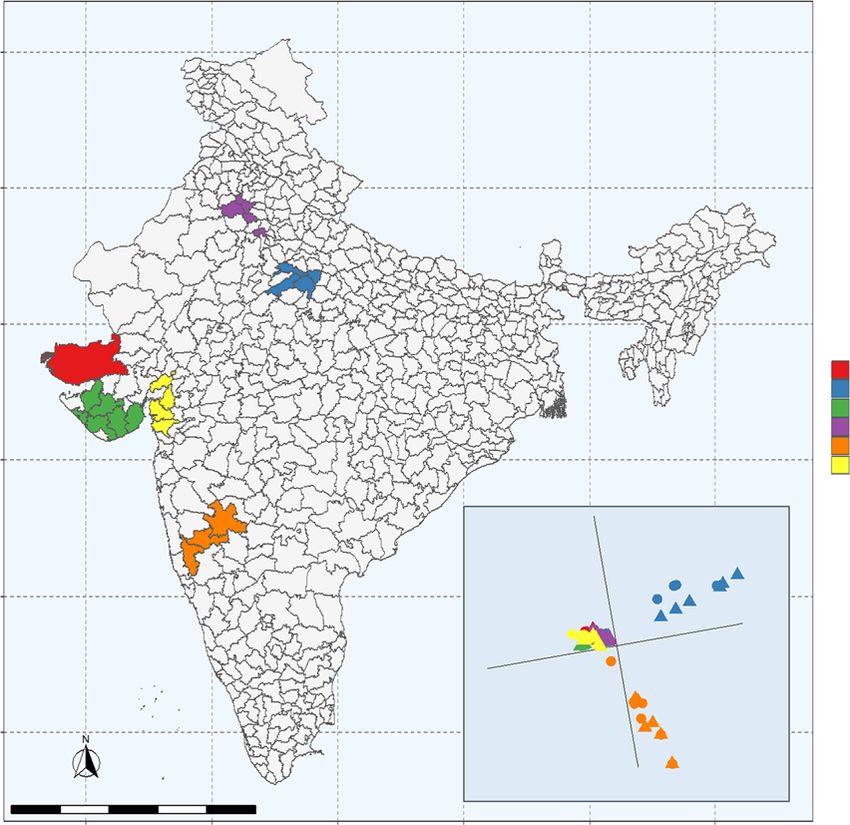
ARTICLE                                                                  NATURE COMMUNICATIONS | https://doi.org/10.1038/s41467-020-18550-1

T
        he domestic riverine water buffalo (Bubalus bubalis) is an            Results
        important source of milk, meat and draft power in the                 Water buffalo genome sequencing. To characterise the genetic
        Indian subcontinent1. Of the world population of ~200                 diversity of Indian water buffalo we sequenced the genomes of 73
million water buffalo, the majority are found in South Asia                   animals from six distinct Indian breeds: Banni, Bhadawari, Jaf-
(FAOSTAT 2017 data2), where they provide more milk than                       farabadi, Murrah, Pandharpuri and Surti. These breeds cover a
cattle. The majority of these animals are owned by smallholder                range of geographical regions across India and display phenotypic
farmers in Asia, meaning more people depend on the water                      diversity in terms of their physical features, milk production and
buffalo than any other domesticated species3. Two distinct groups             environmental adaptation (see Supplementary Fig. 1). For each of
of water buffalo exist, the river buffalo, which is found primarily           these breeds half of the animals were sequenced at an average
in India and the swamp buffalo of East Asia4. Within the Indian               coverage of 37× with the remainder sequenced at a mean of 8×.
subcontinent, phenotypic selection over many centuries has                    To enable comparisons with a distinct outgroup, six Mediterra-
produced a number of well-defined regional breeds of river buf-                nean buffalo were also sequenced at a mean depth of 36×, leading
falo, displaying a diverse range of morphological and production              to a final cohort of 79 animals (Supplementary Table 1). All
phenotypes. Analysis of the maternal lineages of eight distinct               sampling was done in accordance with the regulations of the
breeds based upon mitochondrial D-loop region sequences5                      relevant local research institutes (BAIF and ILRI) and ethics
indicated that breed differentiation and population expansion was             approval was obtained from The Roslin Institute’s and the Uni-
relatively ancient, following domestication around 6300 years ago.            versity of Edinburgh’s Protocols and Ethics Committees. All
Through migration and importation, water buffalo spread world-                animal work was carried out in accordance with the regulations of
wide over the past 200 years, and have become an important                    the Animals (Scientific Procedures) Act 1986.
commercial source of milk production in the Middle East and                      The resulting DNA sequences were aligned to the high quality,
Mediterranean countries6. Analysis of 31 water buffalo popula-                chromosome-level reference assembly of the water buffalo
tions across the world using a 90 K SNP Chip, which was                       (UOA_WB_1 assembly)10 and 37,682,631 single nucleotide
designed on the basis of river buffalo sequence data7 aligned to              variants (SNVs) and 5,897,230 short insertions/deletions (InDels)
the cattle genome, supported the view that the westward spread of             were detected. Following removal of low-quality variants (see
river buffalo from India occurred in multiple independent waves8.             ‘Methods’) we identified a final set of 26,247,559 biallelic SNVs of
The rapid decrease in the cost of genomic DNA sequencing has                  which 25,513,085 were autosomal.
facilitated a revolution in the analysis of genotype–phenotype
relationships in livestock and the identification of selective sweeps
                                                                              Water buffalo population structure. Principal component ana-
associated with performance traits and adaptation. For example, a
                                                                              lysis (PCA) of autosomal genotypes showed that the genetic
recent analysis of tropically adapted African cattle breeds com-
                                                                              relationship between the Indian breeds largely mirrors their
pared to commercial taurine breeds revealed signatures of selec-
                                                                              geographic distribution (Fig. 1a). As expected, due to their
tion for several aspects of tropical adaptation9, an important trait
                                                                              comparative isolation, the Mediterranean animals are genetically
shared with water buffalo. The recently released chromosome-
                                                                              distinct to the Indian animals (Supplementary Fig. 2). The Banni,
level assembly of the genome of a female Mediterranean water
                                                                              Jaffarabadi and Surti breeds, which all originate from nearby
buffalo10 now provides the framework to address the fine detail of
                                                                              areas of Western India, cluster together in the PCA. The relative
the genetic diversity of Indian water buffalo breeds and to identify
                                                                              geographic separation of the Pandharpuri and Bhadawari breeds
candidate functional variation.
                                                                              is mirrored in their genomes, with these breeds being compara-
   River buffalo have been selected for many similar traits as other
                                                                              tively genetically distinct to the other breeds, as well as from each
domesticated species, for example size, coat colour and produc-
                                                                              other. The exception to this relationship between geographic
tion phenotypes11–13. Consequently, understanding how selection
                                                                              location and genetics is the Murrah breed, which although from
for these traits has affected a particular species’ genome will likely
                                                                              Northern India was observed to be genetically similar to the West
not only provide insights into its phenotypic adaptation, but also
                                                                              Indian breeds.
that of other domesticated species. The extent to which domes-
                                                                                 The extent of potential historical migration events between the
tication has driven convergent evolution across different species
                                                                              populations is illustrated in Fig. 1b. Modelling the relationship
remains a relatively open question. Comparison of domesticated
                                                                              between the populations using TreeMix16, the resulting tree could
sheep and goats to their wild ancestors identified overlapping
                                                                              explain 99.26% of the variance between breeds. Apart from the
genomic locations of selective sweeps14, though the precise pat-
                                                                              separation from the Mediterranean animals, no deep splits were
terns of selection often varied. By extension, more recent selective
                                                                              observed. There was strong support (P value < 1 × 10⁻¹⁰) for a
sweeps between domesticated breeds of related species, selected
                                                                              mixture event between the Banni and Murrah populations,
for similar traits and resistance to shared pathogens, could also
                                                                              potentially providing an explanation for the observed closer
overlap, even though the underlying functional variants may be
                                                                              genomic relationship between these breeds than expected given
different. Characterizing functional variants associated with
                                                                              their geographic distribution.
desired traits in one species may provide potential candidates for
introduction into other species.
   In this study, we sequence the genomes of 79 Indian water                  Mapping signatures of selection in the water buffalo genome.
buffalo from 7 breeds from different locations in India and                   To understand how genetic adaptation has contributed to the
Europe and compare the selective sweeps identified to those                    phenotypic diversity among buffalo breeds we characterized
found in specific breeds of other domesticated species, notably                differences between populations using the cross-population
294 animals of the related bovids, domestic cattle (Bos taurus                extended haplotype homozygosity statistic17 (XP-EHH) and the
taurus, Bos taurus indicus). The results highlight extensive genetic          cross-population composite likelihood ratio test18 (XP-CLR).
diversity within Indian river buffalo populations that provide the            These complementary statistics are widely used to determine the
basis for future genomic selection15 for improvements in traits               location of putative selective sweeps between populations of a
such as fertility, productivity and disease-resistance. We illustrate         species. XP-EHH is based on the fact that an allele under strong
that many of the selective sweep intervals overlap those in other             selection is expected to be swept to a high frequency faster than
species, including individual candidate functional variants, pro-             recombination can break down the haplotype upon which it
viding evidence of convergent domestication across species.                   resides. Consequently, elevated haplotype homozygosity in one

2                 NATURE COMMUNICATIONS | (2020)11:4739 | https://doi.org/10.1038/s41467-020-18550-1 | www.nature.com/naturecommunications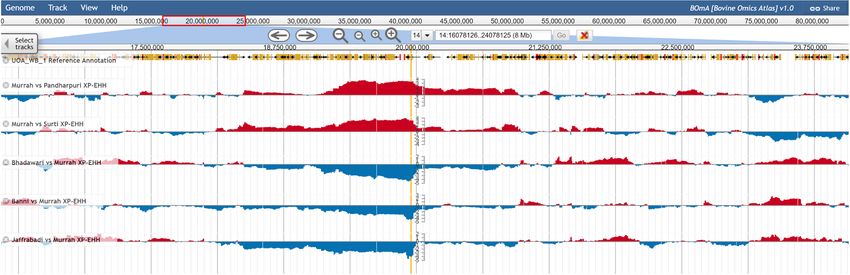
NATURE COMMUNICATIONS | https://doi.org/10.1038/s41467-020-18550-1                                                                                                            ARTICLE

            a                                                                                                       b
                       35°N                                                                                                                      Mediterranean

                                                                                                                                                    Banni
                       30°N

                                                                                                                                                                  Bhadawari
                       25°N
                                                                                                  Breed
                                                                                                    Banni
            Latitude

                                                                                                    Bhadawari       Migration
                                                                                                    Jaffarabadi                                   Murrah
                                                                                                    Murrah          weight
                                                                                                    Pandharpuri        0.5
                       20°N                                                                         Surti

                                                                                                                                                          Surti

                       15°N
                                                                                           PC2                            0
                                                                                                                                                                      Pandharpuri

                       10°N
                                                                                                                    10 s.e.                            Jaffarabadi

                                                                              PC1
                                            1000 km

                              70°E   75°E             80°E      85°E   90°E         95°E                          0.000         0.010            0.020               0.030
                                                         Longitude                                                                      Drift parameter

Fig. 1 The relationship between genetics and geography among the Indian samples. a The main breeding tracts for each breed are indicated alongside an
inset showing a principal component analysis of the genotype data. The genetic relationships largely mirror the geographic locations of the populations
with the exception of the Murrah (purple) breed. b TreeMix analysis of the water buffalo breeds with the potential migration event indicated by an arrow
(dark red indicates an event with stronger support).

population versus another is suggestive of differential selective                                allele at the synonymous variant was not observed in the Murrah,
pressures between the breeds17 providing a powerful approach to                                  Surti or Mediterranean breeds and the highest frequency of 18%
compare selection across the breeds of a domesticated species.                                   was observed in the Pandharpuri population. The frequency of
The XP-CLR statistic is based on identifying where the change in                                 this variant was therefore not correlated with the patterns of
allele frequency of variants in a region between populations has                                 haplotype homozygosity at this region. In contrast, the alternative
occurred more quickly than expected under random drift. XP-                                      allele frequency of the non-synonymous variant was substantially
EHH and XP-CLR scores obtained from the 21 breed compar-                                         higher (62.5%) among the Murrah animals compared to other
isons can be viewed along the water buffalo genome alongside the                                 breeds (from 4.5% in Surti to 20.8% in Banni). This variant leads
variant calls for each breed at a custom genome browser we have                                  to an arginine to cysteine amino acid change in the C-terminal
implemented at www.bomabrowser.com (Fig. 2a). In total there                                     agouti domain of the protein that is linked to melanocortin
were 118 and 924 loci that showed elevated XP-EHH and XP-                                        receptor binding activity in vitro26. This domain contains ten
CLR scores, respectively in one or more breed comparison (see                                    cysteine residues that form a network of five disulphide bonds
‘Methods’, Supplementary Data 1–2). There was a substantial,                                     shaping the active domain27 (Fig. 2c). The creation of an extra
significant overlap (permutation P = 1.3 × 10⁻¹⁶) in the loci                                     cysteine residue within this region consequently has the potential
detected by each method, with 62% of the XP-EHH loci at least                                    to disrupt the looping of this domain and its active site. Despite
partially overlapped by one of the XP-CLR peaks. This is                                         the arginine at this position being conserved across mammalian
approximately twice as many as expected by chance given the size                                 reference genomes (Supplementary Fig. 3), this arginine to
and number of observed peaks. As shown in Supplementary                                          cysteine change is exactly the same and at the orthologous
Data 3, this enriched overlap was not specific to the chosen peak-                                position as a polymorphism in the dog ASIP protein that has been
calling parameters. Several of these loci contain genes that are                                 associated with the recessive inheritance of a uniform black coat
putatively under selection or linked to key traits in other species.                             among German Shepherds28. This suggests the same mutation
These include the fat-mass and obesity (FTO) gene which is                                       has occurred independently in these two divergent domesticated
strongly linked to body-weight traits in humans and cattle19, two                                species.
genes (KITLG and ASIP) commonly linked to pigmentation/coat                                         Variation at the KITLG gene, which controls melanocyte
colour (see below), GHR, which has been linked to various phe-                                   differentiation and migration, has also been associated with coat/
notypes including milk composition in cattle20 and birth weight                                  skin colour in cattle29 and other species11,30 and both elevated
in humans21, and HMGA2, which has been associated with sta-                                      XP-EHH and XP-CLR scores were observed upstream of KITLG
ture in both cattle22 and humans23.                                                              in various comparisons of water buffalo breeds (Supplementary
                                                                                                 Fig. 4A). There are at least two distinct patterns of haplotype
                                                                                                 homozygosity in the vicinity of KITLG (Supplementary Fig. 4B).
Convergent domestication at the ASIP pigmentation gene.                                          Comparison between the Banni and Jaffarabadi breeds indicated
Evidence for a putative strong selective sweep was observed at the                               elevated XP-EHH in a region immediately upstream of the
ASIP (agouti signalling protein) locus on chromosome 14 (Sup-                                    KITLG transcriptional start site, whereas the Pandharpuri breed
plementary Data 1). This gene has been linked to skin pigmen-                                    shows a more extended region of elevated XP-EHH upstream of
tation in both humans24 and mice25 and was primarily associated                                  the gene. Variation in the receptor for KITLG (KIT) is associated
with unusually high levels of haplotype homozygosity in the                                      with the proportion of black in Holstein cattle31 and a missense
Murrah breed (Fig. 2b). Only two coding variants were detected                                   mutation in KITLG is associated with the roan cattle phenotype29.
in the ASIP gene, a synonymous variant at chr14:19,947,421 and a                                 However, only one non-synonymous variant was identified in the
non-synonymous variant at chr14:19,947,429. The alternative                                      water buffalo KITLG gene -chr4:101,938,991 found in only two

NATURE COMMUNICATIONS | (2020)11:4739 | https://doi.org/10.1038/s41467-020-18550-1 | www.nature.com/naturecommunications                                                            3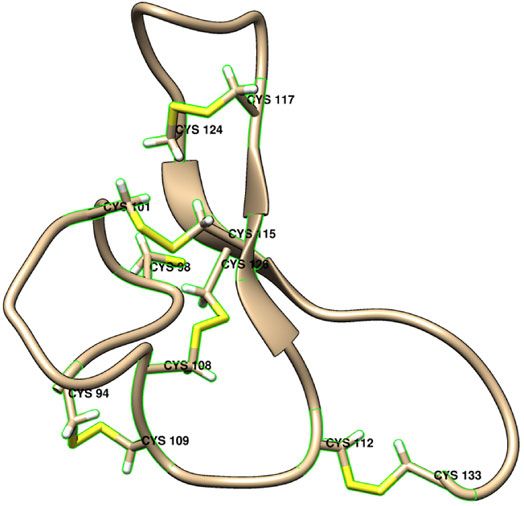
ARTICLE                                                                             NATURE COMMUNICATIONS | https://doi.org/10.1038/s41467-020-18550-1

     a

     b                                                                                        c
                                                      Jaffarabadi vs Murrah
                                                      Murrah vs Surti
                                                      Bhadawari vs Murrah
                                                      Murrah vs Banni
                                                      Murrah vs Pandharpuri
                                                      Murrah vs Med
                                                      Jaffarabadi vs Pandharpuri
                                                      Banni vs Pandharpuri
                                                      Surti vs Pandharpuri
                                                      Bhadawari vs Pandharpuri     XPEHH
                                                                                     4
                                                      Banni vs Med                   3
                                                                                     2
                                                      Jaffarabadi vs Med             1
                                                      Surti vs Med                   0

                                                      Bhadawari vs Med
                                                      Surti vs Banni
                                                      Bhadawari vs Banni
                                                      Jaffarabadi vs Surti
                                                      Jaffarabadi vs Bhadawari
                                                      Pandharpuri vs Med
                                                      Bhadawari vs Surti
                                                      Jaffarabadi vs Banni
                                     0

                                          2

                                                  4

                                                                                              68                                                      133
      18.5 Mb        ASIP         21 Mb   XPEHH

Fig. 2 Patterns of selection at the ASIP locus. a XP-EHH scores across the ASIP locus as viewed in the BOmA browser (https://tinyurl.com/boma-asip).
The location of the non-synonymous ASIP variant is indicated by a vertical orange line spanning all tracks. The elevated XP-EHH scores at this locus in
comparisons involving the Murrah breed is shown. Low absolute XP-EHH scores are shown in blue with high scores in red. b Patterns of XP-EHH across all
breed comparisons. Each column in the heatmap represents a different variant in the region, ordered according to their location in the genome. The
intensity of colour indicates the variant’s XP-EHH score and the location of the ASIP gene is indicated by the dashed vertical lines. The distribution of
absolute XP-EHH scores in each breed comparison across the region are indicated by the violin plots. c The location of the arginine to cysteine change in
the cysteine rich agouti domain of ASIP. The location of the five disulphide bonds are indicated in both the predicted 3D structure and sequence below. The
blue, orange and green boxes below the sequence indicate the locations of the N-terminal loop, active loop and C-terminal loop, respectively. The source
data for panels (a) and (b) can be downloaded from the BOmA website.

Jaffarabadi animals. Accordingly, the putative selective sweep at                          candidate in this region due to its role in cholesterol biosynthesis,
this gene in water buffalo is potentially associated with                                  with the peak of selection falling in an intergenic region upstream
transcriptional regulation.                                                                of this gene (Fig. 3c).
                                                                                              A number of further loci were nominally associated with a trait
                                                                                           and may point towards potential candidate traits for further
Selective sweeps linked to production phenotypes. To provide                               investigation. For example, the second strongest association was
an indication of which phenotypes may potentially underlie other                           at a region on chromosome 11 upstream of the THBS1 gene
selective sweeps, we correlated the median XP-EHH score across                             where the XP-EHH scores were correlated with the differences in
each locus for each breed comparison to the difference in mean                             mean parturition intervals between breeds (uncorrected P =
breed value for nine different traits (wither height and birth                             0.0012). THBS1 has previously been linked to ovarian cell
weight in both males and females, lactation length, milk yield per                         development and function in cattle via the regulation of
lactation, milk fat content, age at first parturition and parturition                       angiogenesis32. The GHR locus was most strongly associated
interval). The strength of putative selection at one locus remained                        with male and female birth weights (uncorrected P values of 0.016
significantly associated with a trait after correcting for multiple                         and 0.019, respectively) and a common polymorphism affecting
testing (uncorrected Permutation P < 2 × 10⁻⁴, Bonferroni-                                 alternative splicing of the human GHR gene has previously been
corrected P < 0.024. Supplementary Data 4). This locus mapped                              associated with differences in foetal growth and birth weight21.
to a 391Kb region on chromosome 15 and was significantly
associated with milk fat percentage (Fig. 3a). It was also detected
in the XP-CLR analysis (Fig. 3b) and contains five genes: MTSS1,                            Cattle selective sweeps are preferentially linked to stature. To
LOC112579209, ZNF572, SQLE and WASHC5. SQLE is a strong                                    investigate the extent to which the genomic regions under

4                  NATURE COMMUNICATIONS | (2020)11:4739 | https://doi.org/10.1038/s41467-020-18550-1 | www.nature.com/naturecommunications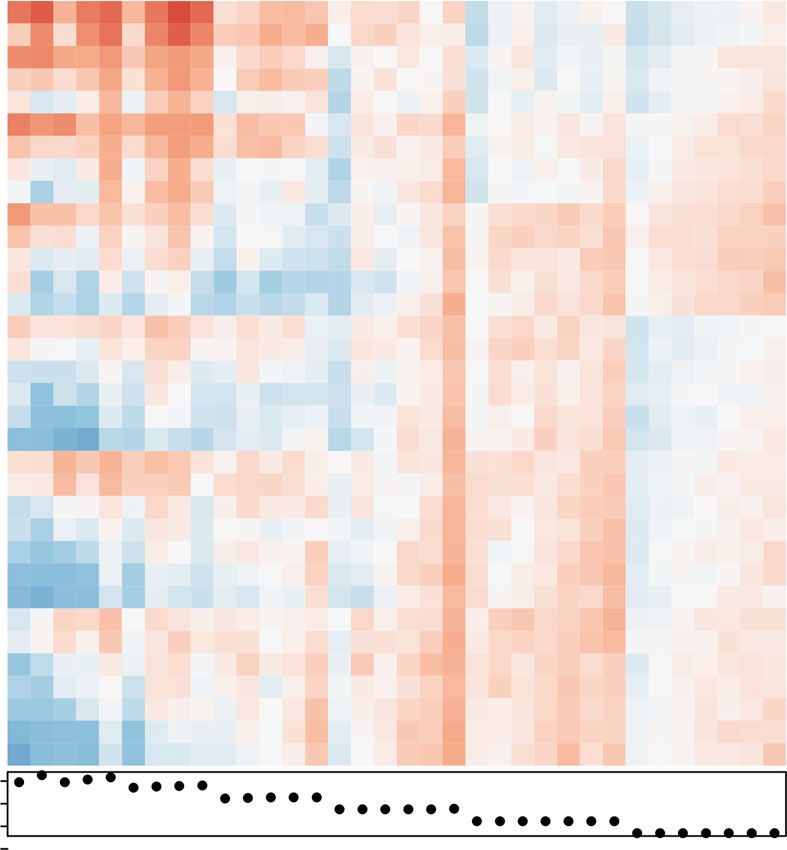
NATURE COMMUNICATIONS | https://doi.org/10.1038/s41467-020-18550-1 ARTICLE
a b Jaffarabadi Jaffarabadi Jaffarabadi
vs Surti vs Murrah vs Banni
3 TRMT12
RNF139
Jaf vs Ban LOC112579210
Sur vs Ban NDUFB9
Difference in mean of milk fat percentage between breeds
TATDN1
2 67,000,000
MTSS1
Bha vs Ban Jaf vs Pan LOC112579209
Jaf vs Mur
Position on chr15
Jaf vs Bha
1 Mur vs Ban
67,250,000 ZNF572
Sur vs Pan
SQLE
Bha vs Pan
Jaf vs Sur WASHC5
Bha vs Mur NSMCE2
TRNAC−GCA
0 Mur vs Pan
Bha vs Sur 67,500,000
R = 0.95 , p = 4.4e–08
Mur vs Sur
TRIB1
−1
Ban vs Pan
−1 0 1 2 3 0 5 10 15 20 25 0 5 10 15 20 25 0 5 10 15 20 25
Median XP−EHH at SQLE locus XPCLR
Haplotypes
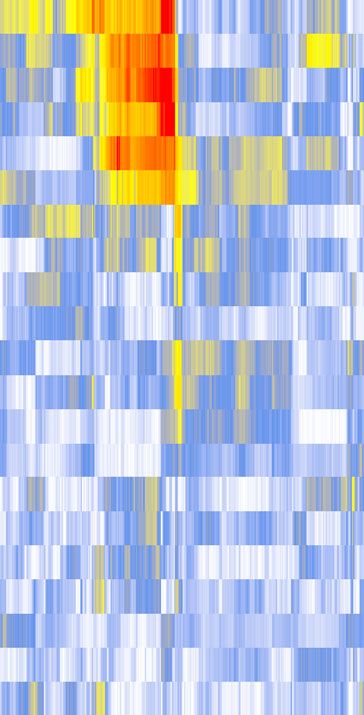
c
Banni (6%) Pandharpuri (7%) Murrah (7.2%) Bhadawari (7.5%) Surti (7.9%) Jaffarabadi (8.5%)
MTSS1 TES
MTSS1 TSS
Variants
ZNF572 TSS
ZNF572 TES
SQLE TSS
SQLE TES
−0.8
−0.6
−0.4
−0.2
0
0.2
0.4
AF corr with
fat content
selection between water buffalo breeds may overlap those in very deep split between the East Asian and other indicine cattle.
another closely related domesticated species, we gathered whole- Following quality control and the removal of related samples (see
genome sequencing data for 427 cattle. This included a novel ‘Methods’) 294 distinct samples and 11,215,339 million variants
dataset of 82 African samples to increase the coverage of this were retained.
continent that is comparatively under-represented in previous To investigate between-breed signatures of selection we
studies. These samples span a diverse range of breeds and geo- calculated XP-EHH and XP-CLR scores between each pair of
graphic locations (Fig. 4 and Supplementary Fig. 5). Of note is the cattle breeds with at least six unrelated samples (Ankole,
NATURE COMMUNICATIONS | (2020)11:4739 | https://doi.org/10.1038/s41467-020-18550-1 | www.nature.com/naturecommunications 5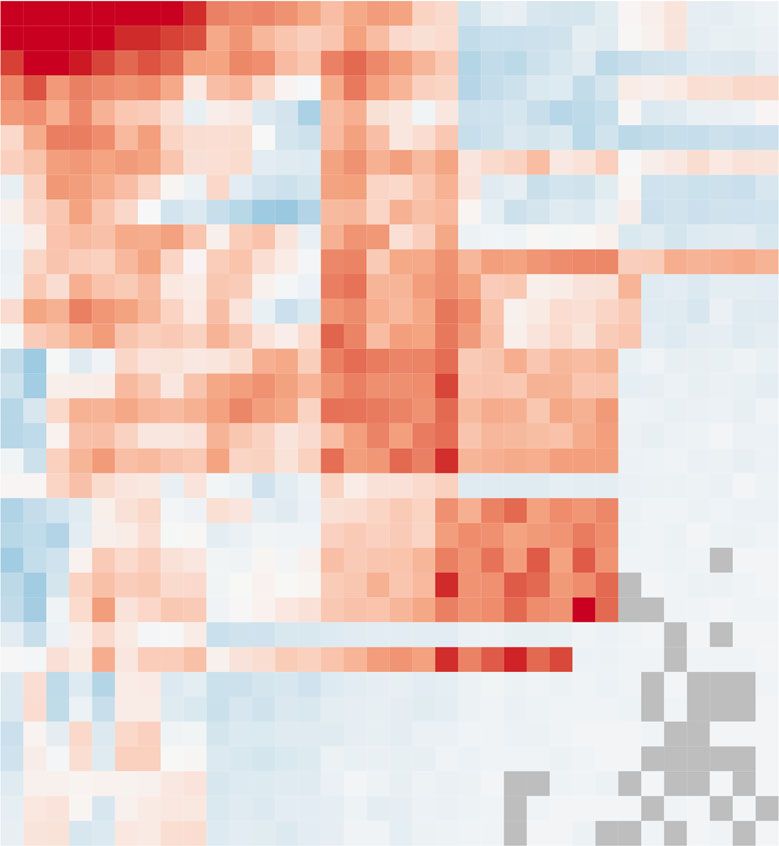
ARTICLE                                                                     NATURE COMMUNICATIONS | https://doi.org/10.1038/s41467-020-18550-1

Fig. 3 Patterns of selection at the SQLE locus. a The correlation between the median XP-EHH scores at the SQLE locus and the corresponding differences
in milk fat percentages between each pair of breeds. The correlation and associated P value are indicated. The grey shaded area corresponds to the 95%
confidence interval. b The XP-CLR scores at this locus in selected breed comparisons. The locations of genes in this region are indicated on the right with
their TSS marked by red dots. c Haplotype homozygosity in each breed at this locus. Each column in the heatmaps represent a different haplotype with
alleles colour coded according to their frequency in the Jaffarabadi breed (major allele in Jaffarabadi: blue, minor allele: yellow). The milk fat percentage is
shown next to each breed name. The Jaffarabadi breed has a distinct elevated pattern of extended haplotype homozygosity at this locus. The horizontal
dotted lines indicate the region spanned by the XP-CLR peak. The line graph to the right of the plot indicates the correlation between each variant’s
frequency and milk fat percentage. Elevated correlations are observed specifically at the core region of this locus upstream of SQLE. The source data for
these plots is available from the BOmA browser and Supplementary Table 2.

Fig. 4 Identity by state phylogenetic tree of the set of 294 cattle whole genomes used in this analysis. The tree represents the IBS-based distance
between samples when restricting to the 8,339,626 biallelic variants with a minor allele frequency >5%. Nodes are colour coded by the geographic origin of
the animals (red: African indicine, purple: subcontinent indicine, pink: East-Asian indicine, blue: East-Asian taurine, green: European taurine, brown: African
taurine, yellow: Central Asian taurine) and the marker shape represents the confidence in that node (Hexagon: confidence of 90–100%, star: 75–90%,
square: 50–75%, circle:
NATURE COMMUNICATIONS | https://doi.org/10.1038/s41467-020-18550-1                                                                                      ARTICLE

                                                                                                  Colocalisation of selective sweeps across bovids. Using these
                                                                                    Body height
                    3         Red blood cell distribution width                                   cattle and water buffalo data we examined whether the locations
                                                                  Waist−hip ratio                 of between-breed selective sweeps are shared across these
                                                                                                  domesticated bovid species. To do this, we lifted the water buffalo
                                                             Balding measurement                  regions over to their orthologous locations in the cattle genome.
                                                                         Leukocyte count          We then examined whether the regions overlapped between the
                    2
                                                                                                  four combinations of species and metrics (XP-EHH or XP-CLR)
                                                                                                  more often than expected by chance. This was determined by
  XP−CLR Z score

                                                                                                  repeatedly randomly sampling the same number and size of
                                                                                                  genomic regions from the cattle genome. To ensure this overlap
                    1                                                                             was not just dependent on the chosen peak-calling parameters, we
                                                                                                  ran this overlap analysis across a wide range of peak-calling
                                                                                                  thresholds. As shown in Fig. 6, there is a significant enrichment of
                                                                                                  overlapping loci between species across most reasonable thresh-
                                                                                                  olds and metric comparisons, though with the lowest overlap
                    0                                                                             observed between the XP-EHH cattle regions and XP-CLR water
                                                                                                  buffalo peaks. We can conclude that the location of between-
                              R = 0.41                                                            breed selective sweeps within the two different species pre-
                             p = 0.0089                                                           ferentially effect overlapping genomic regions.
                   −1                                                                                To enable researchers to view and compare scores across these
                                                                                                  species, all cattle XP-EHH and XP-CLR scores lifted over to the
                        −2                     0                           2
                                                                                                  water buffalo genome have also been uploaded to our browser at
                                                XP−EHH Z score
                                                                                                  www.bomabrowser.com/waterbuffalo.
Fig. 5 Cattle selective sweep enrichment analyses. Testing for an                                    Using the random sampling data we were able to estimate how
enrichment of the number of cattle selective sweep loci that overlap loci                         many regions are expected to overlap by chance in each
previously linked to phenotypes in human GWAS studies. The Z score                                comparison, and consequently how many of the overlapping
represents the relative enrichment (or depletion if negative) of the number                       regions are potentially false positives. Using these data, we
of the putative selective sweep intervals overlapping loci linked to the                          identified thresholds for these comparisons that minimised the
corresponding trait relative to randomly selected genomic regions of the                          number of expected false positives (see ‘Methods’). At these
same length. Each dot represents a different trait and the red dashed and                         thresholds, 4 out of 25 genomic loci identified in the water buffalo
solid lines represent the Z score thresholds that correspond to uncorrected                       XP-EHH analysis that were successfully lifted over to the cattle
and Bonferroni-corrected two-tailed P values of 0.05, respectively. The                           genome overlapped regions identified in the cattle XP-EHH
source data and results for all traits are shown in Supplementary Table 3.                        analysis (permutation P = 3.9 × 10⁻⁶), with less than one overlap
                                                                                                  expected by chance between these regions (Supplementary
                                                                                                  Data 7). A total of 22 of these same 25 regions identified in the
                                                                                                  water buffalo XP-EHH analysis overlapped a cattle XP-CLR peak
Baoule, Boran, Brahman, Holstein, Iranian, Kazakh, Kenana,                                        (permutation P = 2.5 × 10⁻⁴, 13 regions expected to overlap by
Lingan, Muturu, NDama, Ogaden and Tibetan Yellow) as for                                          chance), including all of the four overlapping the cattle XP-
the water buffalo data. At the same cut-offs as used in the water                                 EHH peaks.
buffalo analysis, 184 sites of elevated XP-EHH and 1867 sites of                                     Two of these four regions were detected in all four analyses, i.e.
elevated XP-CLR (Supplementary Data 5–6) were observed                                            in both species and using both metrics. The first region was on
between at least one breed pair (see ‘Methods’), covering a total                                 cattle chromosome 5 (5:47374250–48270364) with the orthologous
of 149 and 418 Mb, respectively. As with the water buffalo data                                   buffalo region on chromosome 4 (4:71990206–72881832) (Fig. 7).
there was a significant overlap among the regions identified by                                     This locus contains two candidate genes underlying the selective
each statistic with 139 (76%) of the XP-EHH regions over-                                         sweeps; HMGA2 that was one of the leading loci associated with
lapped by an XP-CLR peak (permutation P = 8.8 × 10⁻¹⁴, 93                                         stature in a recent meta-analysis of over 58,000 cattle22, and IRAK3
expected to be overlapped by chance given the number and size                                     that regulates toll-like receptor signalling and innate immune
of windows (standard deviation of mean = 6.13)). These                                            response33. As discussed above, selection for stature is likely one of
regions spanned genes including KIT, which has been                                               the key drivers of differentiation between cattle breeds. However,
associated with coat colour, and myostatin (MSTN), linked to                                      the breeds linked to elevated XP-EHH scores at this locus are not
muscle development, but to test whether certain phenotypes are                                    consistently unusual in their stature (Supplementary Table 2). This
preferentially associated with these sites we first determined                                     suggests responses to pathogens, which will affect livestock across
whether they preferentially overlapped genomic regions asso-                                      geographic regions, may be the stronger candidate for having
ciated with phenotypes in human genome-wide association                                           driven selection at this locus. The second locus detected in all four
studies (GWAS). The cattle selective sweep peaks of both                                          analyses (i.e. in both species with both metrics) was on buffalo
metrics were found to overlap regions that have been linked to                                    chromosome 16 (16:37,462,261–39,835,982), cattle chromosome
body height in humans more often than expected by chance                                          15 (15:45,078,520–47,503,196). This locus contains a large number
(Fig. 5, Supplementary Table 3). We observed that these peaks                                     of genes though only three with an orthologue in both species that
also overlapped genetic variants previously linked to stature                                     was overlapped by the peaks called in all four analyses. These were
specifically in cattle22 more often than expected (permutation-                                    NLRP14, RBMXL2 and SYT9. A third region had overlapping
derived Z score P value for XP-EHH peaks: 0.05; for XP-CLR                                        peaks in three out of four comparisons, the exception being the
peaks: 0.002). The GWAS loci for four further traits showed at                                    cattle versus water buffalo XP-CLR analyses. This region, mapping
least a nominally significant overlap with putative selective                                      to chromosome 5 (5:119,150,450–119,690,905) of the water buffalo
sweep peaks (Fig. 5, Supplementary Table 3), with balding                                         genome (29:42,512,413–43,051,989 on the cow), contains 8 genes
measurements and leucocyte count nominally significant in                                          with orthologues in both water buffalo and cattle (GPR137,
both the XP-EHH and XP-CLR analyses.                                                              KCNK4, CATSPERZ, ESRRA, TRMT112, PRDX5, CCDC88B and

NATURE COMMUNICATIONS | (2020)11:4739 | https://doi.org/10.1038/s41467-020-18550-1 | www.nature.com/naturecommunications                                              7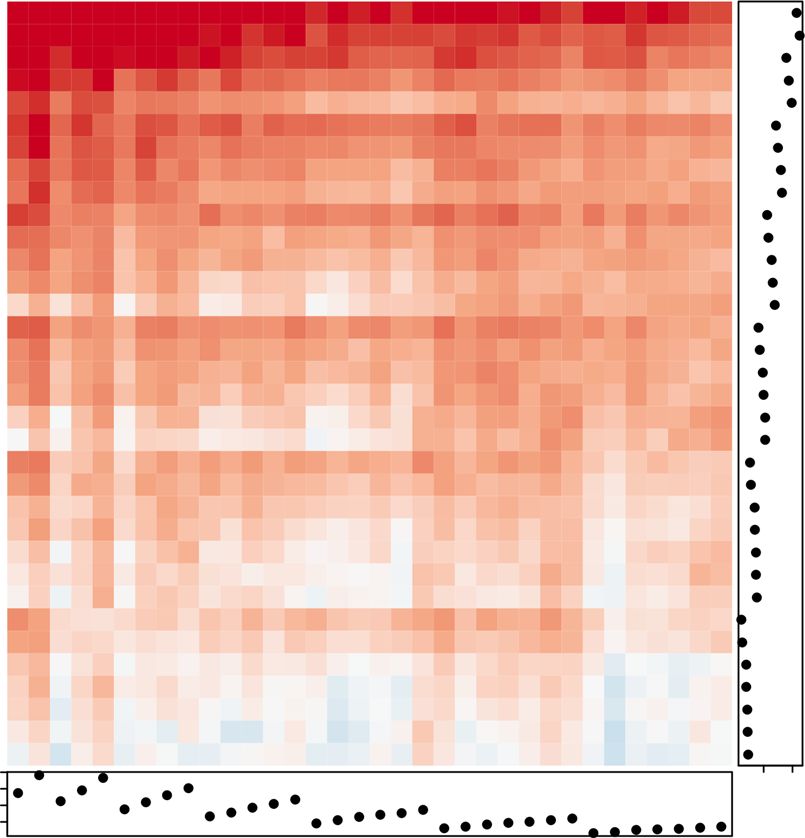
ARTICLE NATURE COMMUNICATIONS | https://doi.org/10.1038/s41467-020-18550-1
Cattle XP–EHH thresholds Cattle XP–CLR thresholds
21
2 1.5
2.5 1
2.5 1.5
2.5 2
31
3 1.5
32
3 2.5
Water buffalo XP–EHH thresholds
3.5 1
3.5 1.5
3.5 2
3.5 2.5
3.5 3
41
4 1.5
42
4 2.5
43
4 3.5
4.5 1
4.5 1.5
4.5 2
4.5 2.5
4.5 3
4.5 3.5
4.5 4
51
5 1.5 Enrichment
52 Z score
5 2.5
53 10
5 3.5 5
54 2
1
10
100
1000
0
–2
21 –5
2 1.5 –10
2.5 1
2.5 1.5
2.5 2
31
3 1.5
32
Water buffalo XP–CLR thresholds
3 2.5
3.5 1
3.5 1.5
3.5 2
3.5 2.5
3.5 3
41
4 1.5
42
4 2.5
43
4 3.5
4.5 1
4.5 1.5
4.5 2
4.5 2.5
4.5 3
4.5 3.5
4.5 4
51
5 1.5
52
5 2.5
53
5 3.5
54
1000 5000
1000
4000 2000
100 3000
10 2000
1
21
2 1.5
2.5 1
2.5 1.5
2.5 2
31
3 1.5
32
3 2.5
3.5 1
3.5 1.5
3.5 2
3.5 2.5
3.5 3
41
4 1.5
42
4 2.5
43
4 3.5
4.5 1
4.5 1.5
4.5 2
4.5 2.5
4.5 3
4.5 3.5
4.5 4
51
5 1.5
52
5 2.5
53
5 3.5
54
21
2 1.5
2.5 1
2.5 1.5
2.5 2
31
3 1.5
32
3 2.5
3.5 1
3.5 1.5
3.5 2
3.5 2.5
3.5 3
41
4 1.5
42
4 2.5
43
4 3.5
4.5 1
4.5 1.5
4.5 2
4.5 2.5
4.5 3
4.5 3.5
4.5 4
51
5 1.5
52
5 2.5
53
5 3.5
54
Fig. 6 Overlap of peaks between species and metrics. Each heatmap shows a combination of metrics and the permutation-derived Z score of the
enrichment (red) or depletion (blue) of overlapping peaks between species. Each row and column is labelled with the peak-calling parameters, the first
number in the labels corresponds to the threshold that needed to be exceeded to call a peak and the second number the threshold that the metric needed
to fall below to define the ends of the peak. The dot plots indicate the number of peaks called at each threshold. A Z score of 2 (or −2) corresponds to a
nominal, uncorrected two-sided P value of ~0.05. The source data and associated P values are provided in Supplementary Data 7.
RPS6KA4) and has been associated with body mass index in between breeds in both species. This core set of loci likely
humans34. The final locus with overlapping peaks in two out extends beyond just the bovinae, e.g. the HMGA2 and GHR loci,
of four comparisons (water buffalo XP-EHH peaks versus that are both under apparent selection between cattle and water
both cattle XP-EHH and XP-CLR peaks at water buffalo: buffalo breeds, were also detected in a recent analysis of the
22:11,073,687–11,463,868; cow: 24:50,745,532–51,131,347) con- genetic loci underlying differences in height between dog
tained no annotated protein-coding genes but overlaps a lncRNA breeds37. Previous studies have suggested an overlap in the
of unknown function and is directly upstream of MEX3C that has genomic regions targeted by selection over the comparatively
been linked to growth hormone regulation35. long time-scales between wild and domesticated animals14. Here
we show how signatures of selection between domesticated
Discussion breeds within a species are also shared across species genome-
Water buffalo and cattle are estimated to have last had a com- wide. Consequently, ongoing selective pressures are likely still
mon ancestor over 5.8 million years ago36. However, since targeting overlapping loci across species. Identifying the causa-
domestication humans have exerted strong artificial selection on tive variations underlying selective sweeps is difficult due to the
both species for similar traits. In this study, we have shown that large regions identified but overlapping analyses across species
there is a core set of loci under apparent differential selection may help to narrow the intervals. Although the precise genetic
8 NATURE COMMUNICATIONS | (2020)11:4739 | https://doi.org/10.1038/s41467-020-18550-1 | www.nature.com/naturecommunications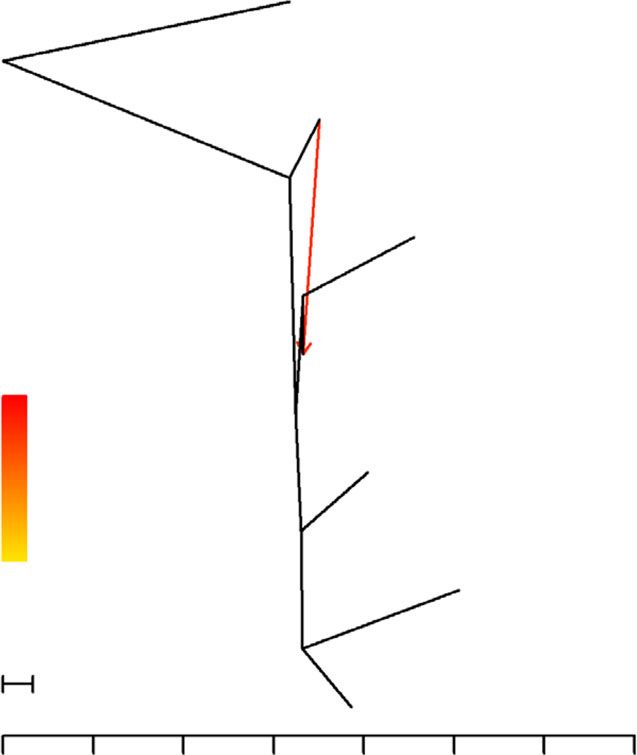
NATURE COMMUNICATIONS | https://doi.org/10.1038/s41467-020-18550-1 ARTICLE
Selective sweep
between cattle breeds
Selective sweep
between buffalo breeds
Jaffarabadi vs
Med (
XP-E
HH)
Jaffarabad
i vs M
urra
h (X
P-C
LR
)
Kenana
vs K
aza
kh
(XP
-E
HH
)
Ankole
vs
rah
h
Murra
r
le
Bo
vs Mu
n
nko
nia
ran
Lra
Jaffarabadi vs
Holstein vs A
(XP
i
Jaffarabad
vs
-CL
NDama
R)
Holste
tu r u
Pandha
Mu
Banni vs
in vs
vs
Br
rpur
n
ah ra
Bra
ma Bo
i vs
Pand
hm
nv
s Ken
Mu
ana
an
har
rra
pur
h
i
ian
ran
in vs I
Holste
ni
Ban
di vs
Jaffaraba
rah
Mur
adi vs
Jaffarab
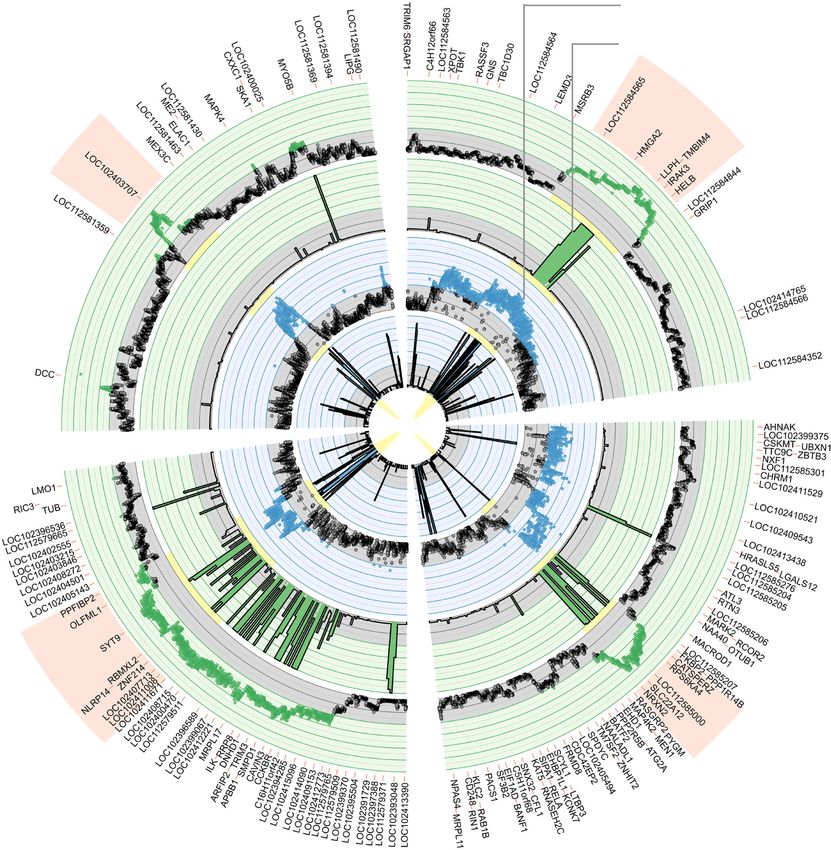
Fig. 7 Colocalisation of between-breed selective sweeps in the water buffalo (green) and cow (blue) genomes at three genomic locations. The four
discussed regions displaying overlapping putative selective sweep peaks between both water buffalo and cattle breeds are shown. An XP-EHH (outer) and
XP-CLR (inner) track is shown for each species illustrating the overlap across metrics where applicable. XP-CLR scores were truncated at 6. For the two loci
where only a subset of the four metrics produced overlapping peaks a random breed comparison is shown in the remaining tracks. The cattle scores were
lifted over to their orthologous positions on the water buffalo genome to enable their direct comparison. The source data can be downloaded from the
BOmA website.
variants at these loci that are under selection are expected to With the advent of whole-genome sequencing, studying sig-
most often differ between species, we have identified that at least natures of selection within a species genome-wide is now rela-
in some instances (e.g. ASIP) the exact same change appears to tively routine. However, understanding which trait is driving the
be under selection. This provides a rare example of apparent patterns of selection at a locus remains challenging. Especially as
convergent domestication in mammals at the level of the indi- many genes and loci can be associated with a variety of potential
vidual base pair and amino acid change. Where the same loci, traits, with the GHR locus, observed to be under selection in this
but different underlying variants, are under selection across study, linked to a range of fertility38, milk20 and meat39 pro-
species, there may be the potential to introduce the genetic duction phenotypes in cattle. We show though that the strength
change from one species to the other, using modern gene editing of selection at these loci can be strongly correlated to the differ-
techniques, to accelerate selection for the trait. ences between breeds of certain traits, providing potential clues as
NATURE COMMUNICATIONS | (2020)11:4739 | https://doi.org/10.1038/s41467-020-18550-1 | www.nature.com/naturecommunications 9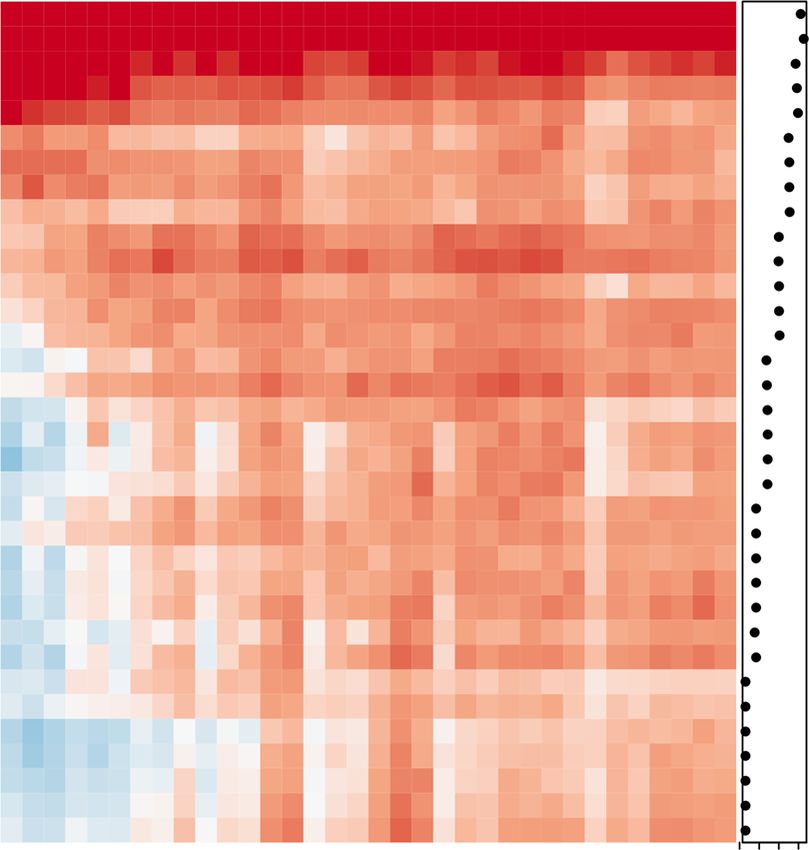
ARTICLE                                                                           NATURE COMMUNICATIONS | https://doi.org/10.1038/s41467-020-18550-1

to the driving forces behind the selective sweeps. For example,                        TreeMix algorithm was run for 7 migration events using the –m parameter. The
XP-EHH scores between buffalo breeds at the SQLE locus are                             maximum likelihood tree was constructed using blocks of 1000 SNVs to account
                                                                                       for variants that are non-independent because they lie close to each other using the
strongly correlated to differences in the breeds’ milk fat percen-                     parameter -k 1000. The root was defined using the –root parameter considering the
tages. A number of loci also overlap regions linked to various                         Mediterranean breed as an ‘outgroup’. The outputs were plotted using the R
relevant traits in human GWAS studies providing further indi-                          function ‘plot_tree’, which is included with the TreeMix software.
cations of the putative traits linked to a region. As well as the
links to stature observed among cattle peaks, a number of peaks                        Water buffalo selection signature analysis. Filtered biallelic SNVs from
common to both bovid species are linked to other traits and                            79 samples were processed through PLINK53 v1.90b4 64-bit with a genotyping rate
disorders. These include peaks spanning PTPN22, PRDX5 and                              of at least 80%, a MAF ≥ 5%, and minimum phred scaled genotype quality of 20 to
IRF4 linked to vitiligo40 and alopecia and ALB linked to obesity41.                    produce a VCF file consisting of 18,358,331 SNPs. This set of SNPs was then used
                                                                                       with SNeP56 v1.1 with its default settings to estimate the effective population size
   We present an analysis of a whole-genome sequence dataset of                        (Ne) of the samples. The tool removed loci with missing values (used loci with
water buffalo breeds, an accompanying browser to visualise                             100% genotyping rate) and finally utilized 74,007 SNPs for Ne calculation. The Ne
selective sweeps across the water buffalo genome and a genome-                         value for the most recent generation (13) was 358. The VCF consisting of
wide comparison with selective sweeps across thirteen breeds of                        18,358,331 SNPs was further processed where missing genotypes were self-imputed
                                                                                       using Beagle57 v5.0 with default parameters and all samples were utilised for
cattle. These data have the potential, to not only inform future                       imputation. Phasing was done using Beagle v5.0 with the Ne set to the estimated
improvement of water buffalo breeds but show that some selec-                          value of 358. In the absence of a good quality recombination map, the recombi-
tive sweeps are relevant across diverse domesticated species.                          nation rate was assumed to be 1 cM (centiMorgan) per Mbp for the water buffalo
                                                                                       genome. Seven breed-wise VCF files (each VCF file contained individuals from
                                                                                       only one breed) were produced from the phased and imputed VCF file using
Methods                                                                                BCFtools47 v1.6, which were then converted to IMPUTE hap format (suitable for
Water buffalo read alignment, variant calling and filtering. Paired-end                 hapbin58) using VCFtools v0.1.13. Twenty-one pairwise XP-EHH tests were per-
sequencing of 81 animals was done across two sequencing centres: Edinburgh             formed between all pairs of breeds (7 breeds in total, 21 unique combinations)
Genomics in the UK and SciGenom Labs in India. Edinburgh Genomics (UK)                 using hapbin’s58 xpehh program v1.3.0. XP-EHH scores were smoothed by aver-
prepared the sequencing libraries using the Illumina TruSeq Nano DNA Library           aging across 1000 SNP windows and putative selective sweep regions were those
Prep Kit and sequencing was done using the Illumina HiSeq X platform (read             with an absolute XP-EHH >3.5, the start and end coordinates defined where the
length: 150 bp). SciGenom Labs (India) used the NEBNext Ultra DNA Library Prep         XP-EHH scores fell back below 1.5. We repeated key analyses across a wide range
Kit for library preparation and the Illumina HiSeq 2500 platform (read length: 250     of thresholds to ensure they were not specific to these cut-offs (Supplementary
bp) for sequencing. Eighty-one paired-end Illumina water buffalo DNA-seq sam-          Data 3–4). The resulting Browser Extensible Data (BED) format files were then
ples were aligned to the water buffalo reference genome (UOA_WB_1 assembly)10          intersected with another bed file containing all the gene coordinates from the water
using BWA-MEM42 v0.7.17. For each sample, the BWA-MEM software generated               buffalo gene annotation file in GTF (Gene transfer format) using BedTools59
sequence alignment map43 (SAM) output which was converted to binary alignment          ‘intersect’ v2.27.1 to get a list of candidate genes that may be under selection.
map43 (BAM) output using SAMtools43 ‘view’ v1.6 and then coordinate sorted                 XP-CLR was calculated using the xpclr software v1.1.2 (https://github.com/
using SAMtools ‘sort’ v1.6 with default parameters. Duplicate reads were marked        hardingnj/xpclr) on the variant dataset prior to imputation, allowing only
using Picard (http://broadinstitute.github.io/picard) ‘MarkDuplicates’ v2.14.0. Read   polymorphic sites with a minor allele frequency >5%. The window size was set to
groups were added to each BAM file using Picard ‘AddOrReplaceReadGroups’                50 Kb9 (--size 50,000) allowing up to 600 SNPs per windows (--maxsnps 600). To
v2.14.0. GATK44 (The Genome Analysis Toolkit) HaplotypeCaller45 v4.0.4.0 was           remove individual outliers XP-CLR values were averaged across the three flanking
run per sample in GVCF (Genomic Variant Call Format file) mode using the                windows either side and putative selective sweep regions defined as those with
parameter -ERC GVCF on the pre-processed BAM files. GATK’s Geno-                        values exceeding 4.5 with the start and end locations being where the values fell
micsDBImport v4.0.4.0 was then used to aggregate all 81 GVCF files per scaffold.        back below 2.5. Again, key analyses were repeated across a range of thresholds.
Then, GATK’s GenotypeGVCFs v4.0.4.0 with -new-qual parameter was used to                   For both XP-EHH and XP-CLR analyses overlapping peaks were merged across
perform joint genotyping and output the final multi-sample variant call format46        breed comparisons. The BOmA browser for visualizing the XP-EHH and XP-CLR
(VCF) file per chromosome/scaffold. Finally, Picard ‘GatherVcfs’ v2.14.0 was used       scores was implemented using JBrowse60.
to concatenate variants called per scaffold to get the final multi-sample VCF file
containing SNVs and InDels. Only biallelic SNVs were retained using BCFtools47
‘filter’ v1.6 with -v snps and -m2-M2 parameters.                                       Association of selective sweeps with buffalo traits. Mean wither height and
    Only those biallelic SNVs were kept which had a quality by depth (QD) ≥ 15,        birth weight in both males and females, lactation length, milk yield per lactation,
fisher strand bias (FS) ≤ 60, strand odds ratio (SOR) ≤ 2, root mean square             milk fat content, age at first parturition and parturition interval for each available
mapping quality (MQ) ≥ 50, mapping quality rank sum test ≥ −2.5 and a read             water buffalo breed were downloaded from the FAO website (http://www.fao.org/
position rank sum test ≥ −2.5. These metrics were chosen to maximise the Ti/Tv         dad-is/dataexport/en/). These metrics are provided in Supplementary Table 2. The
(transitions vs. transversions) ratio whilst minimising the number of variants         Pearson’s correlation coefficient was then calculated between the difference of these
removed. After applying the filters on raw biallelic SNVs, the global Ti/Tv ratio       values between all pairs of breeds and the corresponding median XP-EHH scores at
increased from 2.01 to 2.29. The Ti/Tv ratio is often used as a quality indicator of   each peak. To characterise the probability of getting as strong a correlation by
variation data produced from next-generation sequencing (NGS) experiments. A           chance 5000 permutations were run, where for each real peak random regions of
higher Ti/Tv ratio is usually an indicator of good quality SNVs48 as sequencing        the genome of the same size were randomly sampled and the correlations to their
errors and false positive variant calls have a Ti/Tv closer to one. The global or      median XP-EHH scores calculated. The percentile at which the real correlation
genome-wide estimate of Ti/Tv ratio for humans has been reported to be between         value fell within this distribution of permutation values was then calculated using
2.0 and 2.249. The Ti/Tv ratio for WGS data of Bos taurus (cattle) has previously      the ecdf (empirical cumulative distribution function) function in R55 to determine
been found to be in a similar range as in this study50. The variant calling and        the two-tailed P value. A Bonferroni correction was applied to these P values to
filtration process resulted in a total of 26,247,559 high quality biallelic SNVs        account for the number of peaks tested. The final results are listed in Supple-
discovered across the water buffalo genome out of which 25,513,085 were                mentary Data 4.
autosomal. The final set of SNVs were annotated using SnpEff51 v4.3e.
                                                                                       Cattle sequence data analysis. Illumina sequencing data for 427 cattle genomes
Water buffalo relatedness analysis. A relatedness analysis was undertaken using        representing a wide diversity of global cattle breeds were aligned to the cattle
VCFtools46 v0.1.13 with the --relatedness2 parameter52 in order to infer sample        reference ARS-UCD1.261, extended with the Y chromosome from the Btau_5.0.1
relationships and as a quality control procedure to check if any samples were          assembly62, using BWA-MEM42 v0.7.17. This included 82 novel datasets from
sequenced twice. Two duplicates were identified and among these, the samples with       samples of African cattle breeds. The remaining cattle sequencing datasets can be
higher depth were retained, leaving 79 individuals. The duplicate samples are          found in online databases with the accession numbers listed in Supplementary
graded in yellow and green in Supplementary Table 1.                                   Data 8. Aligned reads were then labelled with GATK44 PrintReads v4.0.11.0,
                                                                                       multiple libraries for a single sample were merged with BamTools63 v2.4.2. Reads
                                                                                       were sorted with SAMtools43 ‘sort’ v1.9, duplicates were marked (MarkDuplicates)
Water buffalo population structure analysis. For the PCA (principal component          with GATK v4.0.11.0 and base-quality score recalibration or BQSR (Base-
analysis), PLINK53 v1.90b4 64-bit was used to generate the principal components        Recalibrator and ApplyBQSR) was performed using the dataset provided by the
(PCs) from the filtered autosomal biallelic SNVs which were then plotted using the      1000 bulls genome consortium at their website64 and the variants in the Illumina
ggplot254 package in R55. Only those sites were kept which were genotyped in every     BovineHD BeadChip. Autosomal variants for each sample were called using
sample, had a minor allele frequency (MAF) ≥ 5% and a phred scaled genotype            GATK’s HaplotypeCaller45, and samples combined using the GenomicDBImport
quality of ≥20. The software TreeMix16 v1.13 was used to determine population          and GenotypeGVCFs functions in GATK v4.0.11.0. The whole pipeline can be
splits and migration events amongst the populations involved in this study. The        recreated using BAGPIPE (https://bitbucket.org/renzo_tale/bagpipe/).

10                   NATURE COMMUNICATIONS | (2020)11:4739 | https://doi.org/10.1038/s41467-020-18550-1 | www.nature.com/naturecommunications
NATURE COMMUNICATIONS | https://doi.org/10.1038/s41467-020-18550-1 ARTICLE
After defining the variants, GATK’s variant quality score recalibration (VQSR) buffalo XP-EHH, 4.5 and 2 for buffalo XP-CLR, 4 and 3.5 for cattle XP-EHH and 5
approach was performed using multiple sources, including the BQSR file from the and 2.5 for cattle XP-CLR).
1000 Bulls genome project64, 24 SNP chip datasets and variants from Ensembl65
v95 (ftp://ftp.ensembl.org/pub/release-95/variation/vcf/bos_taurus/). The Reporting summary. Further information on research design is available in the Nature
parameters considered were mapping quality rank sum test (MQRankSum), Strand
Research Reporting Summary linked to this article.
odd ratio (SOR), Fisher strand bias (FS), quality by depth (QD), the read position
rank sum test (ReadPosRankSum) and the Inbreeding Coefficient
(InbreedingCoeff). Further details on the VQSR stage are reported in Data availability
Supplementary Note. InDels were filtered using the same hard filtering specified at All XP-EHH and XP-CLR scores used in this analysis are viewable and downloadable at
the GATK web page (https://gatk.broadinstitute.org/hc/en-us/articles/ our BOmA browser (https://www.bomabrowser.com/waterbuffalo/). The raw sequencing
360035531112--How-to-Filter-variants-either-with-VQSR-or-by-hard-filtering), data for the novel water buffalo and cattle samples have been deposited at the European
i.e. QD > 2.0, FS ≤ 200.0, ReadPosRankSum ≥−20.0, SOR ≤ 10.0. After filtering Nucleotide Archive (ENA) with study IDs PRJEB39591, PRJEB39330 and PRJEB39924.
variants in the 99% tranche, SNPs with QUAL > 100 and biallelic, a total of The accessions for the previously published datasets can be found in Supplementary
64,447,506 variants were retained and annotated using both SnpEff51 v4.3t and the Data 8. Additional source data for Figs. 1b and 4 and Supplementary Fig. 2 are provided
Ensembl Variant Effect Prediction66 (VEP) tool configured to define the deleterious in the Source data and code file.
variants by SIFT67. Read based phase produced by GATK were retained, where
possible. Individuals with low call rate were removed from downstream analyses
(individual call rate 0.0625) and those with a high proportion (>25%) of
missing genotypes were excluded. The identity by state (IBS) phylogenetic tree was
generated using PLINK53 1.90b4 64-bit, considering biallelic markers (both SNPs
References
and InDels) with MAF ≥ 5%. 1. Hoffpauir, R. The water buffalo: India’s other bovine. Anthropos 77, 215–238
(1982).
2. Food and Agriculture Organization of the United Nations (FAO). FAOSTAT
Cattle selection signatures analysis. After identifying those breeds with at least Statistical Database, http://faostat.fao.org/ (2017).
six animals, and after filtering by relatedness, XP-EHH and XP-CLR were calcu- 3. Food and Agriculture Organization of the United Nations. World Watch List
lated between all combinations of the remaining breeds. Only SNPs were con- for Domestic Animal Diversity. 3rd edn. (Food and Agriculture Organization
sidered for the selection signatures discovery. XP-EHH was calculated using of the United Nations, Rome, 2000).
hapbin58 in its default settings as for the water buffalo data, with the exception that 4. Kumar, S. et al. Mitochondrial DNA analyses of Indian water buffalo support
Ne was set to 1000 during the phasing with Beagle57 v5.0. a distinct genetic origin of river and swamp buffalo. Anim. Genet. 38, 227–232
XP-CLR was calculated using the xpclr software v1.1.2 (https://github.com/ (2007).
hardingnj/xpclr) on the dataset prior to imputation, allowing only polymorphic 5. Kumar, S., Nagarajan, M., Sandhu, J. S., Kumar, N. & Behl, V. Phylogeography
sites (minor allele frequency >1%), 50Kb windows (--size 50,000) and allowing up and domestication of Indian river buffalo. BMC Evol. Biol. 7, 186 (2007).
to 600 SNPs per windows (--maxsnps 600). Peaks were called using the same 6. Cockrill, W. R. The water buffalo: a review. Br. Vet. J. 137, 8–16 (1981).
approach and parameters as for the water buffalo data. 7. Iamartino, D. et al. Design and validation of a 90K SNP genotyping assay for
the water buffalo (Bubalus bubalis). PLoS ONE 12, e0185220 (2017).
GWAS enrichment analyses. The locations of single nucleotide polymorphisms 8. Colli, L. et al. New insights on water buffalo genomic diversity and post-
linked to phenotypes in human GWAS68 were mapped onto the cattle genome domestication migration routes from medium density SNP chip data. Front.
using LiftOver69. For each phenotype with at least 300 variants the number of XP- Genet. 9, 53 (2018).
EHH or XP-CLR peaks overlapping at least one GWAS variant was calculated. To 9. Kim, J. et al. The genome landscape of indigenous African cattle. Genome Biol.
determine if this was more or less than expected, the same number of regions of the 18, 34 (2017).
same sizes were resampled from the cattle genome 1000 times. This therefore 10. Low, W. Y. et al. Chromosome-level assembly of the water buffalo genome
accounted for the number and distribution of GWAS variants along the genome, as surpasses human and goat genomes in sequence contiguity. Nat. Commun. 10,
these were kept unchanged across the permutations. The mean number of these 260 (2019).
randomized peaks overlapping the same GWAS variants across permutations was 11. Wilkinson, S. et al. Signatures of diversifying selection in European pig breeds.
then used to calculate a Z (standard) score and associated P value. PLoS Genet. 9, e1003453 (2013).
To test for an association between the cattle peaks and stature GWAS variants 12. Rodriguez-Valera, Y. et al. Genetic diversity and selection signatures of the
identified specifically in cattle, we used the results from a 2018 study22. Enrichment beef ‘Charolais de Cuba’ breed. Sci. Rep. 8, 11005 (2018).
of the peaks overlapping these GWAS variants was estimated in the same way as 13. Taye, M. et al. Exploring evidence of positive selection signatures in cattle
for the human GWAS variants above. breeds selected for different traits. Mamm. Genome 28, 528–541 (2017).
14. Alberto, F. J. et al. Convergent genomic signatures of domestication in sheep
and goats. Nat. Commun. 9, 813 (2018).
Liftover from the water buffalo to the cow genome. To determine orthologous
15. Meuwissen, T., Hayes, B. & Goddard, M. Accelerating improvement of
positions between the water buffalo and cattle genomes, we performed a liftover of
livestock with genomic selection. Annu. Rev. Anim. Biosci. 1, 221–237 (2013).
the genomic positions using FLO70 (https://github.com/wurmlab/flo), which is a
pipeline that uses the UCSC tools71, with the settings “-fastMap -tileSize=1 16. Pickrell, J. K. & Pritchard, J. K. Inference of population splits and mixtures
-minIdentity=90”. The minimum identity percentage was chosen to be similar to from genome-wide allele frequency data. PLoS Genet. 8, e1002967 (2012).
that used by Mintoo and colleagues for their LASTZ alignments36. Genomic 17. Sabeti, P. C. et al. Genome-wide detection and characterization of positive
positions were lifted from one genome to the other using the LiftOver69 software. selection in human populations. Nature 449, 913–918 (2007).
18. Chen, H., Patterson, N. & Reich, D. Population differentiation as a test for
selective sweeps. Genome Res. 20, 393–402 (2010).
Testing overlap between water buffalo and cattle. To test whether regions of 19. Jevsinek Skok, D. et al. FTO gene variants are associated with growth and
elevated XP-EHH or XP-CLR in one species overlapped peaks in the other species carcass traits in cattle. Anim. Genet. 47, 219–222 (2016).
more often than expected by random, we first lifted all water buffalo peaks over to 20. Viitala, S. et al. The role of the bovine growth hormone receptor and prolactin
the cow genome. After determining the real number of overlapping peaks, regions receptor genes in milk, fat and protein production in Finnish Ayrshire dairy
of the same number and sizes were sampled from the cow genome 100 times and cattle. Genetics 173, 2151–2164 (2006).
the number of overlapping peaks recalculated. Using these permutation results we 21. Padidela, R. et al. The growth hormone receptor gene deleted for exon three
calculated a Z score for each comparison representing how many standard (GHRd3) polymorphism is associated with birth and placental weight. Clin.
deviations the real number of overlaps was above the mean of the permutation Endocrinol. 76, 236–240 (2012).
results. These Z scores were then converted to P values and the results across peak- 22. Bouwman, A. C. et al. Meta-analysis of genome-wide association studies for
calling thresholds are shown in Supplementary Data 7. Using these results we cattle stature identifies common genes that regulate body size in mammals.
identified new peak-calling thresholds that balanced the estimated false positive Nat. Genet. 50, 362–367 (2018).
rates across analyses (maximum and minimum metric values of 4 and 1.5 for
NATURE COMMUNICATIONS | (2020)11:4739 | https://doi.org/10.1038/s41467-020-18550-1 | www.nature.com/naturecommunications 11You can also read


