Towards global flood mapping onboard low cost satellites with machine learning
←
→
Page content transcription
If your browser does not render page correctly, please read the page content below
www.nature.com/scientificreports
OPEN Towards global flood mapping
onboard low cost satellites
with machine learning
Gonzalo Mateo‑Garcia1,9*, Joshua Veitch‑Michaelis2,9, Lewis Smith3,9, Silviu Vlad Oprea4,
Guy Schumann5,6, Yarin Gal3, Atılım Güneş Baydin3 & Dietmar Backes7,8
Spaceborne Earth observation is a key technology for flood response, offering valuable information
to decision makers on the ground. Very large constellations of small, nano satellites— ’CubeSats’
are a promising solution to reduce revisit time in disaster areas from days to hours. However, data
transmission to ground receivers is limited by constraints on power and bandwidth of CubeSats.
Onboard processing offers a solution to decrease the amount of data to transmit by reducing large
sensor images to smaller data products. The ESA’s recent PhiSat-1 mission aims to facilitate the
demonstration of this concept, providing the hardware capability to perform onboard processing
by including a power-constrained machine learning accelerator and the software to run custom
applications. This work demonstrates a flood segmentation algorithm that produces flood masks
to be transmitted instead of the raw images, while running efficiently on the accelerator aboard the
PhiSat-1. Our models are trained on WorldFloods: a newly compiled dataset of 119 globally verified
flooding events from disaster response organizations, which we make available in a common format.
We test the system on independent locations, demonstrating that it produces fast and accurate
segmentation masks on the hardware accelerator, acting as a proof of concept for this approach.
Floods are among the most destructive extreme weather events—between 1995 and 2015, over 2.2 billion people
were affected by floods comprising 53% of the total of people affected by all weather-related disasters1,2. Situ-
ational awareness on the ground is crucial for effective disaster response, and, today, satellite imagery is one of
the most important sources of this information3. Both passive optical (multi-spectral) and synthetic-aperture
radar (SAR) imagery are routinely used to determine flood extent and further derived p roducts4 (Fig. 1).
Some regions, like the USA, Europe and Japan have access to high-quality imaging resources from defence
organisations and commercial satellite operators through domestic space agencies (i.e., NASA, ESA, JAXA). How-
ever, several of the worst flood-affected regions are in developing countries: of the top 20 countries by disaster
mortality in proportion to their population for the years 1990–2017, the top five are low or lower-middle-income
countries, and only five are upper-middle income5.
Many of these countries have almost no means of getting access to higher quality imaging resources via
domestic channels. To address this, organisations such as the International Charter “Space and Major Disasters”7,
initiated by the European Space Agency (ESA), liaise with space agencies and associated commercial organisa-
tions to produce free high resolution maps for end-users in the field. Despite best efforts it can take many days to
provide actionable information, mainly due to image down-linking and subsequent image a nalysis8. Commercial
organisations are able to provide the highest-frequency (daily) and highest-resolution (sub-metre) images, but
their satellites must also be tasked and their images may only be freely available for a limited period of time
during disasters via the International Charter Space and Major Disasters. ESA’s Copernicus program9 provides
open data globally at 10 m resolution, but the optical component, Sentinel-2 (S2)10, has a revisit time of five days
at the equator and two to three days at mid-latitudes. This leads to wait periods much longer than two days in
areas such as central Africa where alternatives for rapid data capture can be limited.
In this work we investigate how a constellation of small, inexpensive, nano satellites assembled from commer-
cial off-the-shelf (COTS) hardware, also known as C ubeSats11, could be used for disaster response, using flooding
as a case study. The main advantage of using CubeSats is an improved revisit time through larger constellations
1
Universidad de Valencia, Valencia, Spain. 2Liverpool John Moores University, Liverpool, UK. 3University of
Oxford, Oxford, UK. 4University of Edinburgh, Edinburgh, UK. 5University of Bristol, Bristol, UK. 6RSS-Hydro, RED,
Dudelange, Luxembourg. 7University of Luxembourg, Luxembourg, Luxembourg. 8University College London,
London, UK. 9These authors contributed equally: Gonzalo Mateo-Garcia, Joshua Veitch-Michaelis and Lewis
Smith. *email: Gonzalo.Mateo-Garcia@uv.es
Scientific Reports | (2021) 11:7249 | https://doi.org/10.1038/s41598-021-86650-z 1
Vol.:(0123456789)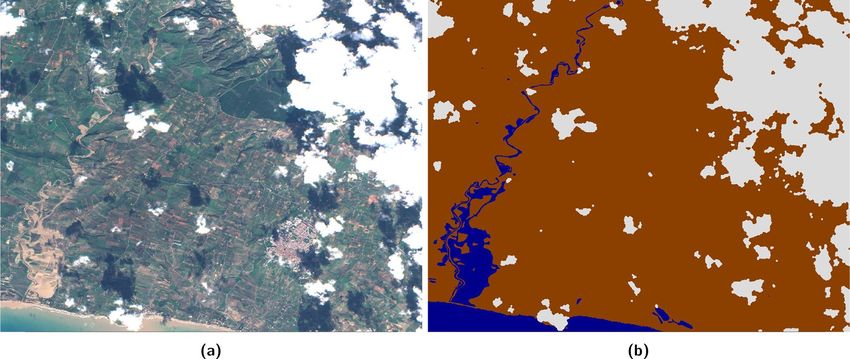
www.nature.com/scientificreports/
Figure 1. An example of a data product from the Copernicus EMS catalogue (activation EMSR312), in this
case a map showing flood extent over the city of Vigan in the North West of Luzon island in the Philippines in
September 2018. A blue water mask (here generated using an automatic method from a RADARSAT-2 image) is
overlaid on top of a Sentinel-2 image, showing the extent of flooding. Sentinel 2 imagery and Copernicus EMS
mapping products are provided as public domain. Base image and reference labels mask are included in the
WorldFloods database and code for plotting this images may be found in our r epository6.
of satellites. Commercial organisations like Planet Labs, Inc. (California, USA) have demonstrated the potential
for large fleets of low-cost satellites for Earth observation (EO), though their data are only freely available in
small quantities. Tens of CubeSats similar to ESA’s FSSCat m ission12 could be launched for the cost of a single
conventional Earth observation satellite, with 30 CubeSats reducing the nominal revisit time from five days to
around eight hours for a similar cost. However, CubeSats can have very limited downlink bandwidth, on the
order of 1–10 Mbps13, compared to around 0.5 Gbps for S210 (Downlink is communication from the satellite
back to a ground station on Earth. It is very constrained for CubeSats because the satellite itself must act as a
transmitter). In addition to this, there is a cost associated with downlinking data which is proportional to the
transfer size, desired frequency and availability of ground stations.
Constrained downlink budgets are a common problem in space science and can be addressed using on-board
processing for both targeted data acquisition and filtering. Examples include autonomously identifying science
targets on Mars14,15 and discarding cloud-obscured imagery on NASA’s EO-1 satellite with the Autonomous Sci-
encecraft Experiment (ASE)16,17. On-board flood detection and mapping (an image segmentation task) has also
been proven with A SE18 using Hyperion, a 220-band hyperpsectral camera with a 30 m ground sample distance.
The output was limited by the computational capability of the satellite and only a small 7.7 × 30 km region in the
centre of the field of view could be processed using 12 of 220 bands. Flood detection was based on simple band
thresholds, and an event was triggered based on the number of water pixels in a region compared to a baseline;
the combination of three on-board classifiers achieved accuracies of 70–85.6%.
We propose to take this approach further leveraging modern deep l earning19 algorithms, to perform multiclass
segmentation with high accuracy, on-board of very cheap satellite hardware. In order to demonstrate feasibility,
we optimise our application for ESA’s Sat-1, part of F SSCat20—a technology demonstrator mission— launched
at 2nd of September 2020. Among other sensors, FSSCat carries a Cosine HyperScout 2 49-band hyperspectral
camera (70 m ground sample distance at 500 km) which integrates an Intel Movidius Myriad2 vision process-
ing unit (VPU) as a co-processor for performing on-board computer vision and neural network inference12,21.
FSSCat is a 3 × 2U CubeSat, with HyperScout taking up 1U (10 × 10 × 11 cm) of space. The first machine
learning application deployed on the satellite is a cloud detection model22 similar to the system used on EO-1.
Using the on-board VPU to perform segmentation, an output two-bit flood map (up to four classes) would
reduce the amount of data being down-linked by a factor of 100 (assuming 49 12-bit channels). Since segmented
regions tend to be quite large and continuous, there could likely be further savings via simple compression
methods like run-length encoding23. Our models are trained on a new extensive dataset of human-annotated
flood maps covering more than 100 flood events and tested on five independent events from different locations
around the globe. We made this dataset available at https://tinyurl.com/worldfloods. While we address flooding
in this paper, satellites with on-board capability are attractive as they can potentially be re-targeted for multiple
diverse missions, and on-board models can be improved over time if their weights are small enough.
The contributions of this paper are as follows:
1. We introduce a new dataset—WorldFloods—that combines, in “machine-learning ready form”, several exist-
ing databases of satellite imagery of historical flood events. The dataset contains pairs of Sentinel-2 images
and flood extent maps covering 119 global flood events.
2. Using this dataset, we train several convolutional neural network (CNN) architectures for flood segmentation
and compare their performance against standard baselines: linear models and a per-image optimal threshold
on the normalised difference water index (NDWI)24.
Scientific Reports | (2021) 11:7249 | https://doi.org/10.1038/s41598-021-86650-z 2
Vol:.(1234567890)
www.nature.com/scientificreports/
Figure 2. Spatial resolution and spectral response of Sentinel-2 and HyperScout-2 sensors.
3. We show that our models can process large volumes of hyperspectral data, yet fit the constraints of hardware
deployed on the satellite. Specifically we report results on the on-board co-processor Intel Movidius Myriad2,
which we found was able to process a 12 MP image in less than a minute.
Background
Flood mapping. Water mapping, of which flood mapping is a special case, is a semantic segmentation task
(also called land cover classification in remote sensing) that has been studied for decades. A simple approach
to water mapping is to compute indices like the normalised difference water index (NDWI)24 which exploits
the difference in absorption of light by water bodies between the green and the near infrared part of the elec-
tromagnetic spectrum. However, this method can perform poorly because the spectral profile of flood water
varies widely due to the presence of debris, pollutants and suspended s ediments25. As a result, the main chal-
lenge with using indices at a global scale is that the threshold for water retrieval must be tuned per environment.
SAR images (e.g., Sentinel-1) are commonly used for water retrieval as they are not affected by cloud cover26,27,
severe weather and lighting conditions. Since calm water strongly reflects radar wavelengths away from the
receiving antenna (specular reflection), image thresholding is a straightforward way to identify water regions
by their very low backscatter intensity. However, the presence of waves or wind causes significant backscatter,
which can make inland water harder to identify. In addition, flooding in urban a reas28 is difficult to map due to
multiple reflections by buildings and taller vegetation which produces an increase in backscatter. Additionally,
as SAR is an active sensing technique with a high power requirement (e.g. Capella constellation, 600 Watts for
transmission29), deployment on a small satellite is challenging; we therefore limit the scope of this paper to pas-
sive optical sensors, but we do use some training data derived from Sentinel 1 imagery.
More sophisticated segmentation techniques include rule-based c lassifiers18,25 which use a fixed or tuned
threshold on indices or individual bands; classical supervised machine learning3; and recently deep learning30–33.
Among deep learning methods, fully convolutional neural networks (FCNNs)34 produce state-of-the-art results
in image segmentation tasks with fast inference time; they are thus the model proposed for this application.
Hyperspectral image processing. One of the inherent difficulties of targeting a satellite that has yet to
be launched is that no real-world orbital data are available. This problem is usually addressed by using data from
a similar satellite and accounting for known differences in spectral sensitivity35. However, in the case of Sat-1,
the problem is exacerbated as there are very few satellites with hyperspectral sensors and archival data are simi-
larly limited36,37. Notably HyperScout-1 has been flown in space, on the GOMX-4B mission, but data from this
mission are not publicly available38. Other aerial missions like AVIRIS (a NASA-modified U2 aircraft)36,39 have a
larger public archive, but these images are mostly limited geographically to the USA. Since we need labelled data,
we have the additional constraint that we rely on serendipitous image acquisition coinciding with flood events.
The images that HyperScout-2 produces are relatively large—45 visible channels and four thermal infrared
channels with a dynamic range of 12-bits per pixel. The output image has a spectral resolution of 15 nm over a
range of 400–1000 nm. HyperScout-2 is a push-broom sensor; a nominal 2D frame represents approximately
a 200 km by 300 km swath at a nominal orbital height of 500 k m38. The ground sample distance (GSD) at this
altitude is 70 m.
We propose to use Sentinel-2 data for model training, which is sensitive to a similar wavelength range, but
with fewer bands. S2 spatial resolution varies for each spectral band from 10 to 60 m. In order to produce a
model for HyperScout-2 images we follow an approach similar to two recent studies40,41 which demonstrate
models that show some generalisation to multiple sensors. In particular, we select the bands of Sentinel-2 that
are common to HyperScout-2 (shown in Fig. 2) and reduce the spatial resolution of Sentinel-2 images to 80 m
using bilinear interpolation. In addition, HyperScout-2 and Sat-1 are expected to have a worse signal-to-noise
ratio compared to Sentinel-2 due to its reduced size and poorer direct georeference. In order to account for this,
our models are trained with degradatations in form of Gaussian noise, channel jitter (translational offsets) and
motion blur. These degradations are implemented as data augmentation f unctions42,43.
Scientific Reports | (2021) 11:7249 | https://doi.org/10.1038/s41598-021-86650-z 3
Vol.:(0123456789)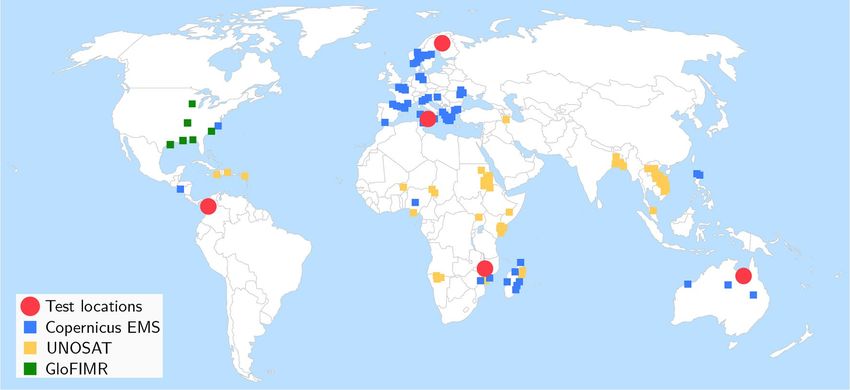
www.nature.com/scientificreports/
Figure 3. Locations of flood events contained in WorldFloods. Blue, orange and green areas denote Copernicus
EMS, UNOSAT and GloFIMR data, respectively. Red circles denote test regions. Basemap credit: http://www.
simplemaps.com.
Methods
Flood segmentation. Given a satellite image (with or without a flood), we wish to label each pixel as
water/flood or land. As always with data coming from an optical sensor, we also have to deal with the problem
of obstruction by clouds. Since we are targeting on-board processing, we choose to tackle this by adding a cloud
class to the output of the model, so that we can maintain the workflow of a single pass over the image. Our mod-
els therefore have three output classes (land, water/flood and cloud), requiring two bits of data per pixel to store.
Note our model does not distinguish water and flooded pixels; however we report segmentation results on flood
and permanent water pixels using the JRC yearly permanent water layer44.
WorldFloods dataset. The development and evaluation of flooding response systems has been constrained
so far by use of trusted, authoritative or validated datasets that are also often of limited geographical scope, with
most studies only considering a single or very few flood events33,45. It is unclear whether such models would
accurately generalise to the rest of the world due to variations in topography and land cover. To address this we
collated a new global dataset called WorldFloods, which we believe is the largest collection of its kind.
WorldFloods contains 422 flood extent maps created by photo-interpretation either manually or semi-auto-
matically, where a human validated machine-generated maps. A flood extent map is a vector layer (shapefile)
derived from a satellite image with polygons indicating which part of that image has water (in some cases it
distinguishes between flood water and permanent water and in other cases it does not); we assigned a date to
each flood extent map which corresponds with the date of acquisition of the original satellite image that was
used to derive it. Each flood extent map belongs to a flood event hence a flood event could have several flood
maps which may cover different areas of interest or different days of the same area in the same flood event; in
total the dataset covers 119 floods events that occurred between November 2015 and March 2019. We sourced
all maps from three organisations: the Copernicus Emergency Management Service (Copernicus EMS)46, the
flood portal of UNOSAT47, and the Global Flood Inundation Map Repository (GLOFIMR)48. The geographical
distribution of flood maps is shown in Fig. 3.
For each flood event we provide the raw 13-band S2 image closest in time after the event, and rasterised
reference labels (cloud, water and land) at 10 m resolution. (We explicitly avoid the term ground truth as labels
are derived manually or semi-automatically by photo-interpretation and have not been validated by ground
measurements). S2 images were downloaded from the Google Earth Engine50; S2 bands with spatial resolution
larger than 10 m were resampled to 10 m using nearest neighbours interpolation. We generated cloud masks
using s2cloudless49. The dataset contains in total more than 12 Gigapixels of labeled data which occupies
around 266 GB of disk space. Figure 4 shows an example of S2 image and derived reference labels for a flood
that occurred in Central-West Sicily in November 2018.
We manually validated the data to account for gross errors such as missing water bodies or invalid intensities.
In some cases, missing water bodies were filled using the permanent water bodies d ataset44 available from the
Google Earth Engine50 (we also use this data to differentiate flood and permanent water in the results). Never-
theless, there are still mislabeled pixels specially in narrow streams, partially inundated crop fields and in the
borders of clouds and water bodies. Some of these errors are caused by temporal misalignment, e.g., the closest
S2 image may have been acquired some days after the map was produced. This happens, as is frequently the case,
if the flood extent map was generated based on a satellite image other than S2. Figure 5 shows, on the left, the
satellites used to derive each flood map and on the right, the difference in days between the flood extent map
Scientific Reports | (2021) 11:7249 | https://doi.org/10.1038/s41598-021-86650-z 4
Vol:.(1234567890)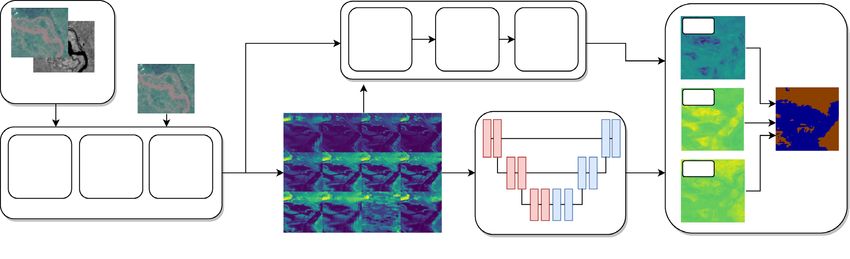
www.nature.com/scientificreports/
Figure 4. (a) Sentinel 2 RGB bands and (b) associated labelled map (land/brown, water/blue, cloud/white)
over Porto Palo (Sicily) derived from Copernicus EMS 333 activation. Cloud mask obtained automatically
with s2cloudless49. Base image and reference labels are included in the WorldFloods database and code for
plotting this images may be found in our r epository6.
(a)
(b)
Figure 5. (a) Satellite used to derive each flood map in the WorldFloods data set. ‘Other’ satellites (all optical):
GeoEye-1, PlanetScope, Earth Observing (EO)-1. (b) Difference in days between the flood map and the
Sentinel-2 image (Sentinel-2 image is always posterior in time to the flood map).
and the next S2 overpass. As we can see, most of the flood extent maps where generated from radar imagery and
most images are acquired within five days which suggests that the earliest available re-visit is used if available.
While including flood extent maps and S2 images from different days introduces label noise, this allows us
to use a much larger training set than if we were restricted to images where the flood map was generated from
S2. We were motivated by results from the authors of S EN12MS51 who trained global high resolution (10 m)
segmentation models using cloud-free S2 imagery and low resolution labels derived from MODIS (500 m),
achieving 63–65% overall accuracy despite the coarseness of the available ground truth labels. In our results
section we experimentally validate that this trade-off is justified for our dataset; that is, we achieve better seg-
mentation results on a clean test set when we include these noisy labels in our training than if we restrict the
training set to clean images.
Models trained on noisy labels in the training may appear to perform well, but it is important to ensure that
the test set provides a clean measurement of the true performance of our system. In this direction, we manually
selected test images from flood extent maps that were derived from S2 images which had no temporal misalign-
ment. In addition, we visually inspected those images and fixed minor errors to improve the quality of their
segmentation masks. To avoid data leakage, there was no spatial overlap between flood maps in the test set and
the training and validation sets. Additionally, other flood extent maps from same flood events in the test set
have also been removed from the training and validation sets. Table 1 shows the training, validation and test set
Scientific Reports | (2021) 11:7249 | https://doi.org/10.1038/s41598-021-86650-z 5
Vol.:(0123456789)www.nature.com/scientificreports/
Dataset Flood events Flood maps 256x256 patches Water pixels (%) Land pixels Cloud pixels Invalid pixels
Flood Permanent † (%) (%) (%)
Training 108 407 182,413 1.45 1.25 43.24 50.25 3.81
Validation 6 6 1132 3.14 5.19 76.72 13.27 1.68
Test 5 11 2029 20.23 1.16 59.05 16.21 3.34
Table 1. General statistics of the training, validation and test splits of the WorldFloods dataset. Since raw
images from S2 can be many megapixels in size, we tile each image into 256-pixel square patches. The training
set distribution has a higher percentage of cloudy pixels compared with the validation and test datasets; this is
because we were interested in distinguishing water/flood pixels whereas detecting clouds is a byproduct of the
model. † Permanent water obtained from the yearly water classification product of Pekel et al.44 available at the
Google Earth Engine52.
statistics; there is a strong class imbalance in the training dataset with less than 3% of pixels belonging to the
water class. From those, less than 50% are classified as permanent water in the JRC permanent water p roduct44.
The low occurrence of water pixels in the train dataset is because there is a high presence of clouds in the train-
ing data. Cloud occurrence in the validation and test sets is lower to provide more meaningful results of flood
segmentation.
Results
In order to demonstrate that a FCNN-based flood detection model can segment floods accurately and could be
deployed on Sat-1, we first train FCNN models on WorldFloods at its original resolution (10 m). We then train
models on degraded imagery, mimicking the resolution of HyperScout-2 (80 m) by resampling the S2 images
using bilinear interpolation and also by using only the overlapping bands between the sensors. Afterwards, mod-
els trained over the entire WorldFloods dataset are compared with models trained using only flood maps derived
from Sentinel-2. Finally, we verify our trained (degraded) models can be run on a Intel Movidius Myriad2 chip
and measure the processing speed; we use an Intel Neural Compute Stick v1 connected to a Raspberry Pi 3B+.
Models tested on the Intel Movidius Myriad2 chip use all available S2 bands, in comparison to the cloud detec-
tion model22 which uses three bands selected using Principle Component Analysis (PCA).
We focus on the segmentation accuracy of the water/flood class by measuring precision, recall and the inter-
section over union (IoU). Since missing flooded areas (false negatives) is more problematic than over-predicting
floods (false positives), high recall is preferred to high precision. In practice the IoU is a good compromise if
recall is sufficiently high (over 94%); with a lower recall we found that, even with a high IoU, the model misses
entire water bodies in several scenes.
As baselines, we use NDWI (S2 band 3 and 824) and a per-pixel linear model (all S2 bands) trained on World-
Floods. A range of NDWI thresholds have been suggested in the literature for flood water e xtraction24,25,53we
chose 0 for our experiments since it is the most common one. In order to set a stronger baseline, we also report
results for the threshold that maximizes the IoU in the test data providing a recall above 94% (threshold − 0.22).
This represents the best case performance for the NDWI model. In addition, in order to strengthen the baseline
results, the NDWI model assumes perfect cloud masking by using directly the s2cloudless cloud masking model.
We compare our baselines to two FCNNs: a simple CNN (SCNN) comprising four convolutional layers (0.26M
parameters) and a U-Net (7.8 M parameters)54. Although single-pixel classification methods like NDWI are com-
mon, we expect that models which can use larger contextual information, such as the extended shape of water
bodies, will perform better. Therefore we calculated the receptive field of our models to ensure that larger features
are considered during classification. Our smallest model has a receptive field of 9 × 9 pixels (700 × 700 m)
which we judged to be sufficient. Details of our SCNN and UNet architectures can be found in the supplementary
material for this paper; additionally our implementation and training code is provided in our GitLab r epository6.
Models were trained from scratch for 40 epochs using all 13 S2 bands with input patches of size 256 × 256 for
10 m data or 64 × 64 for 80 m data (2.5 km × 2.5 km). For data at 80 m resolution we also trained our models
using only the 10 overlapping bands between HyperScout-2 and S2 (see Fig. 2). In order to achieve models with
high recall we used a cross-entropy loss function that weights each class by the inverse of the observed frequency
in Table 1, combined with a Dice loss55. Augmentation was applied during training including flips and rotations,
per-channel jitter, Poisson (shot) noise and brightness/contrast adjustments. A flowchart showing the training
and dataloading process is shown in Fig. 6. Models were tested on full S2 images as described i n56.
Table 2 shows the metrics for the different models and baselines. Specifically, we show IoU and recall for
the water class (total water) as well as the recall stratified for flood and permanent water. Permanent water clas-
sification comes from the JRC permanent water l ayer52. Our three models (Linear, SCNN and UNet) all have a
recall above 94%; NDWI with the threshold at zero generalises poorly, we suspect due to water with suspended
matter. FCNN models performed best although there was only a small increase in performance between SCNN
and U-Net, despite U-Net having 30 × more parameters. The drop in performance from 10 to 80 m is around
two points for FCNN models which is acceptable taking into account that the spatial resolution is eight times
worse. There is also a significant drop in performance when only the 10 overlapping bands of HyperScout-2 and
S2 are used (bands B1 to B9) suggesting that the short-wave infrared (SWIR) bands of S2 (B10–B12) have high
predictive power for water. This is expected since water reflectance is very low in the SWIR whereas soil and
Scientific Reports | (2021) 11:7249 | https://doi.org/10.1038/s41598-021-86650-z 6
Vol:.(1234567890)www.nature.com/scientificreports/
Flood event
databases
Cloud
Permanent Segmentation
S2Cloudless
Google Earth water bodies ground truth
Engine
CEMS, GloFIMR,
UNOSAT Water
Flood Predicted
Metadata S2 Image Land
shapefile segmentation
WORLDFLOODS 13-band Sentinel 2
Segmentation Model Model prediction
image
Figure 6. Overview of the model training pipeline used in this work. Note that WorldFloods provides images
from S2, but reference flood extent maps may have been labelled from other sources, such as radar satellites.
Model IoU total water Recall total water Recall flood water Recall permanent water
NDWI (thres -0.22) 65.12 95.75 95.53 99.70
NDWI (thres 0) 39.99 44.84 42.43 86.65
10 m Linear 64.87 95.55 95.82 90.75
SCNN 71.12 94.09 93.98 95.93
U-Net 72.42 95.42 95.40 95.83
NDWI (thres -0.22) 64.10 94.76 94.57 98.15
NDWI (thres 0) 39.07 44.01 41.69 84.55
80 m Linear 60.90 95.00 94.79 98.58
SCNN 68.87 96.03 96.11 94.76
U-Net 70.22 94.78 94.85 93.50
NDWI (thres -0.22) 64.10 94.76 94.57 98.15
NDWI (thres 0) 39.07 44.01 41.69 84.55
80 m HyperScout-2
Linear 50.27 80.47 79.69 94.03
overlapping bands
SCNN 65.82 94.62 95.17 84.99
U-Net 65.43 94.59 95.17 84.44
Table 2. IoU and recall results for models trained on WorldFloods. Bold values indicate highest metric value
for each resolution and band combination.
igher57. Figure 7 shows the precision and recall for different thresholds on
vegetation reflectance is significantly h
the total water class; again, our trained models beat NDWI and larger models tend to perform better.
Figure 8 shows the results of the models trained on the WorldFloods training dataset against models trained
on clean S2–labelled data alone (Fig. 8). Results for the clean S2 labeled data have been computed by cross vali-
dation leaving one flood event out from the WorldFloods test dataset (details on this procedure and results for
each flood event can be found in the supplementary material). We found that training using all data was better
than training on S2-labelled data alone. Our hypothesis is that although reference labels from non-S2 satellites
may be noisier, when considering the dataset in aggregate, this noise becomes less significant as most pixels are
labelled correctly. This result also lends support to our argument that temporal misalignment between labels and
imagery in our dataset was not significant. Similarly, this robustness should also extend to noisy ground truth
which is semi-automatically labelled by humans.
The SCNN model was selected for testing on the Myriad 2 chip due to its similar accuracy, but lower compu-
tational footprint, compared to UNet (1 FLOPS vs 2.68 FLOPS for a 64 × 64 × 13 input). Figure 9 shows some
example images segmented using the Myriad2. This model segments a 12 MP image—approximately the size
acquired by HyperScout-2—in less than one minute, accounting for data transfer between the computer and
the accelerator development board via a USB connection. We assume that the power required to downlink data
is comparable to that of data processing (2.5 W for the Myriad2). Using a radio with a bandwidth of 10 Mbps, a
1GB image would take 13 minutes to transfer. Therefore we can reduce image transmission power consumption
by an order of magnitude at least. On a fully integrated platform like a satellite, we would expect lower latency
for data transfer and hence a slightly faster overall processing time.
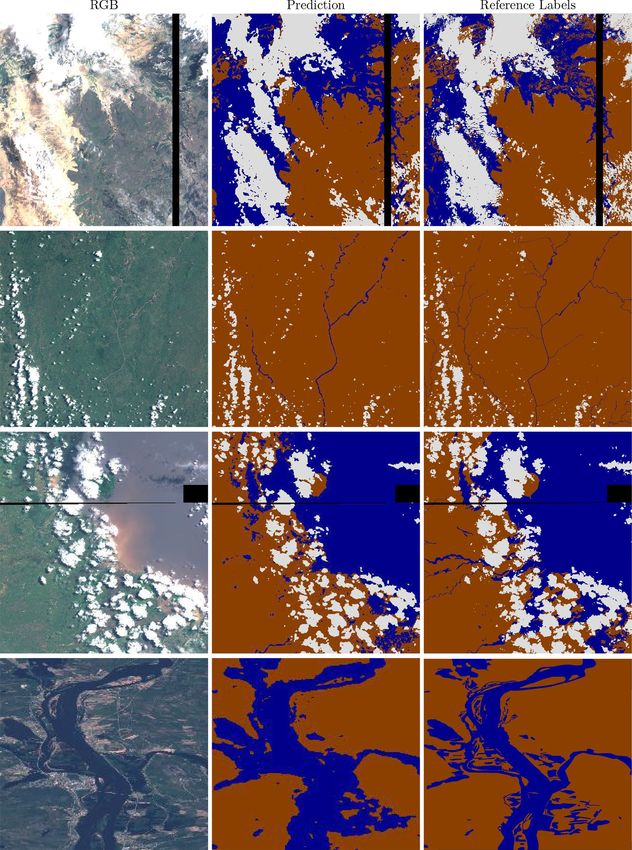
In general, our models tend to over-predict water content; a common failure mode is to identify dark regions
as water. False positives are mostly clustered in the surroundings of water bodies and in cloud shadows (see
Fig. 9). For further work we are exploring other methods to improve this, for example by adding another input
channel with elevation.
Scientific Reports | (2021) 11:7249 | https://doi.org/10.1038/s41598-021-86650-z 7
Vol.:(0123456789)www.nature.com/scientificreports/
(a) (b)
Figure 7. Precision–recall curves of different models trained on (a), the Sentinel-2 original resolution (10 m)
and (b), in the degraded resolution of HyperScout-2 (80 m). In gray 95% recall threshold.
Figure 8. Performance of models trained with all WorldFloods flood maps compared with models trained only
with flood maps derived from Sentinel-2.
Discussion and conclusions
The current proliferation of open-access satellite data complemented by imagery from commercial satellite opera-
tors has still only limited impact on assisting disaster response, primarily because of relatively low revisit times
and long delays between image acquisition and product delivery. Here we propose a technical concept study for
in-orbit flood mapping using low-cost hardware with machine learning capability to reduce the amount of data
required to be downlinked. This concept will enable the use of large cubesat constellation to reliable monitor
environmental phenomena such as flooding with high temporal resolution.
We have demonstrated that accurate flood segmentation in orbit is feasible to perform using low resolution
images and available hardware. Our models outperform standard baselines and are favourably comparable to
human annotation, while being efficiently computable with machine learning hardware on-board the current
Sat-1 technology demonstrator as well as future missions.
Recent works58,59 have shown good performance of spectral indices such as NDWI for water detection on
specific survey areas. In our experiments we see that our “best case” tuned NDWI results are also a strong base-
line. However there are still examples where a fixed threshold in an image will incorrectly retrieve buildings
and cloud shadows as water. Therefore we expect NDWI to perform well in some cases (in our dataset, Finland,
for example) and poorly in others, which is perhaps reflected in our aggregated results (see table 3 in supple-
mentary materials for the results for each flood event). Compared to previous works on flood d etection33,45, we
have reported results on a wide range of geographical areas paying special attention to data leakage60. For our
Scientific Reports | (2021) 11:7249 | https://doi.org/10.1038/s41598-021-86650-z 8
Vol:.(1234567890)www.nature.com/scientificreports/
Figure 9. Segmentation results of degraded models (SCNN 80 m) run on Myriad 2 device. Sentinel 2 imagery
and Copernicus EMS mapping products are provided as public domain. Base images and reference labels are
included in the WorldFloods database and code for plotting these images may be found in our repository6.
Colours are as follows: brown/land, blue/water, white/cloud.
application global generalisation is critical since its intended use is to automatically provide segmentation masks
instead of heavier hyper-spectral images.
Scientific Reports | (2021) 11:7249 | https://doi.org/10.1038/s41598-021-86650-z 9
Vol.:(0123456789)www.nature.com/scientificreports/
Downlinking only segmentation masks instead of complete images is not exempt from drawbacks. Firstly,
the quality of the downloaded data only depends on the accuracy of the model. In other words, an erroneous
segmentation can not be fixed on the ground since the original hyperspectral information is lost. This could be
alleviated by periodically downlinking full images to assess and improve the segmentation algorithm’s quality.
The newly gained data could be added to the training dataset or even apply domain adaptation61 to boost the
segmentation networks. Secondly, by discarding the image, we lose information that could be used for advanced
analysis. Hyperspectral information could be used to assess the presence of pollutants in the flood water. In this
case, the segmentation masks could be used to guide the retrieval of relevant pixels. Guiding the retrieval of
cloud free images is the current operational application onboard the Sat-1 satellite22.
One of the contributions of this work is the release of the WorldFloods database alongside this paper, which
we hope will serve as a useful tool to foster further research in disaster response. We are pleased to write that
this approach is being increasingly explored - while this work was being prepared for publication, several other
‘machine learning’ ready datasets for segmentation from satellite imagery have been published; Rambour et. al.62
demonstrated flood detection on time series of SAR and optical data, making their dataset publicly available,
Bonafilia et. al.63, who focus on Sentinel 1 data, but provide more detailed labels that we had available to us here
and Nemni et al.64 who has also made their dataset publicly accesible. The approach we explore here, of produc-
ing a ’machine learning ready’ dataset as well as a concrete algorithm, has also been recently explored for other
areas of disaster response65, and we hope to see this continue.
Data availability
We are releasing the WorldFloods database alongside this paper at https://tinyurl.com/worldfloods. Users of this
dataset should be aware of the varying quality of the reference labels that is pointed out in the paper; specifi-
cally some labels in the training and validation datasets have significant errors. In general the quality of the test
dataset labels are higher and test images were curated to facilitate more accurate model evaluation. We hope
to address any remaining label quality issues in future work. We provide a GitLab repository with our model
architectures, model checkpoints and training/benchmarking code at: https://gitlab.com/frontierdevelopmentl
ab/disaster-prevention/cubesatfloods.
Received: 2 August 2020; Accepted: 4 March 2021
References
1. United Nations. Global Assessment Report on Disaster Risk Reduction 2015 (United Nations International Strategy for Disaster
Reduction, 2015).
2. Centre for Research on the Epidemiology of Disasters. The human cost of weather-related disasters 1995-2015 (United Nations
Office for Disaster Risk Reduction, 2015).
3. Serpico, S. B. et al. Information extraction from remote sensing images for flood monitoring and damage evaluation. Proc. IEEE
100, 2946–2970. https://doi.org/10.1109/JPROC.2012.2198030 (2012).
4. Schumann, G.J.-P., Brakenridge, G. R., Kettner, A. J., Kashif, R. & Niebuhr, E. Assisting flood disaster response with earth observa-
tion data and products: a critical assessment. Remote Sens. 10, 1230. https://doi.org/10.3390/rs10081230 (2018).
5. United Nations. Global Assessment Report on Disaster Risk Reduction 2019 (United Nations International Strategy for Disaster
Reduction, 2019).
6. WorldFloods GitLab repository. https://gitlab.com/f rontierdevelopmentlab/disaster-prevention/c ubesatfloo ds. Accessed:
2020-12-08.
7. International Charter “Space and Major Disasters”. https://disasterscharter.org/. Accessed: 2020-06-15.
8. Havas, C. et al. E2mc: improving emergency management service practice through social media and crowdsourcing analysis in
near real time. Sensors 17, 2766 (2017).
9. Berger, M., Moreno, J., Johannessen, J. A., Levelt, P. F. & Hanssen, R. F. ESA’s Sentinel missions in support of Earth system science.
Remote Sens. Environ. 120, 84–90 (2012).
10. Drusch, M. et al. Sentinel-2: ESA’s optical high-resolution mission for GMES operational services. Remote Sens. Environ. 120,
25–36 (2012).
11. Heidt, H., Puig-Suari, J., Moore, A., Nakasuka, S. & Twiggs, R. CubeSat: A new generation of picosatellite for education and industry
low-cost space experimentation. In 14th Annual/USU Conference on Small Satellites (2000).
12. Esposito, M., Conticello, S., Pastena, M. & Domínguez, B. C. In-orbit demonstration of artificial intelligence applied to hyperspec-
tral and thermal sensing from space. In CubeSats and SmallSats for Remote Sensing III, vol. 11131, 111310C (International Society
for Optics and Photonics, 2019).
13. Manzillo, P. F. et al. Hyperspectral imaging for real time land and vegetation inspection. In The 4S Symposium (2017).
14. Estlin, T. A. et al. AEGIS Automated Science Targeting for the MER Opportunity Rover. ACM Trans. Intell. Syst. Technol.https://
doi.org/10.1145/2168752.2168764 (2012).
15. Francis, R. et al. AEGIS autonomous targeting for ChemCam on Mars Science Laboratory: deployment and results of initial science
team use. Sci. Robot.https://doi.org/10.1126/scirobotics.aan4582 (2017).
16. Griggin, M., Burke, H., Mandl, D. & Miller, J. Cloud cover detection algorithm for EO-1 Hyperion imagery. In IEEE International
Geoscience and Remote Sensing Symposium (IGARSS 2003), vol. 1, 86–89 vol.1, https://doi.org/10.1109/IGARSS.2003.1293687
(2003).
17. Doggett, T. et al. Autonomous detection of cryospheric change with hyperion on-board earth observing-1. Remote Sens. Environ.
101, 447–462. https://doi.org/10.1016/j.rse.2005.11.014 (2006).
18. Ip, F. et al. Flood detection and monitoring with the autonomous sciencecraft experiment onboard eo-1. Remote Sens. Environ.
101, 463–481. https://doi.org/10.1016/j.rse.2005.12.018 (2006).
19. LeCun, Y., Bengio, Y. & Hinton, G. Deep learning. Nature 521, 436–444 (2015).
20. Camps, A. et al. FSSCAT, the 2017 Copernicus Masters’ “ESA Sentinel Small Satellite Challenge” Winner: A Federated Polar and
Soil Moisture Tandem Mission Based on 6U Cubesats. In IEEE International Geoscience and Remote Sensing Symposium (IGARSS
2018), 8285–8287 (IEEE, 2018).
21. Esposito, M. et al. Hyperscout 2 highly integration of hyperspectral and thermal infrared technologies for a miniaturized eo imager.
In Living Planet Symposium, https://doi.org/10.13140/RG.2.2.25659.67367 (2019).
Scientific Reports | (2021) 11:7249 | https://doi.org/10.1038/s41598-021-86650-z 10
Vol:.(1234567890)www.nature.com/scientificreports/
22. Giuffrida, G. et al. Cloudscout: a deep neural network for on-board cloud detection on hyperspectral images. Remote Sens.https://
doi.org/10.3390/rs12142205 (2020).
23. Smith, S. W. The Scientist and Engineer’s Guide to Digital Signal Processing (Chapter 27) (California Technical Publishing, California,
1997).
24. McFeeters, S. K. The use of the Normalized Difference Water Index (NDWI) in the delineation of open water features. Int. J. Remote
Sens. 17, 1425–1432. https://doi.org/10.1080/01431169608948714 (1996).
25. Memon, A. A., Muhammad, S., Rahman, S. & Haq, M. Flood monitoring and damage assessment using water indices: a case study
of pakistan flood-2012. Egypt. J. Remote Sens. Space Sci. 18, 99–106. https://doi.org/10.1016/j.ejrs.2015.03.003 (2015).
26. Obserstadler, R., Hönsch, H. & Huth, D. Assessment of the mapping capabilities of ers-1 sar data for flood mapping: a case study
in germany. Hydrol. Process. 11, 1415–1425 (1997).
27. Twele, A., Cao, W., Plank, S. & Martinis, S. Sentinel-1-based flood mapping: a fully automated processing chain. Int. J. Remote
Sens. 37, 2990–3004 (2016).
28. Martinis, S. et al. Comparing four operational sar-based water and flood detection approaches. Int. J. Remote Sens. 36, 3519–3543
(2015).
29. Stringham, C. et al. The capella x-band sar constellation for rapid imaging. In IEEE International Geoscience and Remote Sensing
Symposium (IGARSS 2019), 9248–9251, https://doi.org/10.1109/IGARSS.2019.8900410 (2019).
30. Isikdogan, F., Bovik, A. C. & Passalacqua, P. Surface water mapping by deep learning. IEEE J. Select. Topics Appl. Earth Obser.
Remote Sens. 10, 4909–4918 (2017).
31. Rudner, T. et al. Multi3net: segmenting flooded buildings via fusion of multiresolution, multisensor, and multitemporal satellite
imagery. Proc. AAAI Conf. Artif. Intell. 33, 702–709 (2019).
32. Isikdogan, L. F., Bovik, A. & Passalacqua, P. Seeing through the clouds with DeepWaterMap. IEEE Geosci. Remote Sens. Lett.https://
doi.org/10.1109/LGRS.2019.2953261 (2019).
33. Wieland, M. & Martinis, S. A modular processing chain for automated flood monitoring from multi-spectral satellite data. Remote
Sens. 11, 2330. https://doi.org/10.3390/rs11192330 (2019).
34. Chen, L.-C., Zhu, Y., Papandreou, G., Schroff, F. & Adam, H. Encoder-decoder with atrous separable convolution for semantic
image segmentation. Proceedings of the European conference on computer vision (ECCV) 801–818, (2018).
35. Mandanici, E. & Bitelli, G. Preliminary comparison of sentinel-2 and landsat 8 imagery for a combined use. Remote Sens. 8, 1014
(2016).
36. Green, R. O. et al. Imaging spectroscopy and the airborne visible/infrared imaging spectrometer (AVIRIS). Remote Sens. Environ.
65, 227–248 (1998).
37. Pearlman, J. S. et al. Hyperion, a space-based imaging spectrometer. IEEE Trans. Geosci. Remote Sens. 41, 1160–1173 (2003).
38. Esposito, M. & Marchi, A. Z. In-orbit demonstration of the first hyperspectral imager for nanosatellites. In International Conference
on Space Optics-ICSO 2018, vol. 11180, 1118020 (International Society for Optics and Photonics, 2019).
39. Vane, G. et al. The airborne visible/infrared imaging spectrometer (AVIRIS). Remote Sens. Environ. 44, 127–143 (1993).
40. Wieland, M., Li, Y. & Martinis, S. Multi-sensor cloud and cloud shadow segmentation with a convolutional neural network. Remote
Sens. Environ. 230, 111203. https://doi.org/10.1016/j.rse.2019.05.022 (2019).
41. Mateo-García, G., Laparra, V., López-Puigdollers, D. & Gómez-Chova, L. Transferring deep learning models for cloud detection
between Landsat-8 and Proba-V. ISPRS J. Photogr. Remote Sens. 160, 1–17. https://doi.org/10.1016/j.isprsjprs.2019.11.024 (2020).
42. Simard, P. Y., Steinkraus, D. & Platt, J. C. Best practices for convolutional neural networks applied to visual document analysis.
Proceedings of the Seventh International Conference on Document Analysis and Recognition - 2, (2003).
43. Ding, J., Chen, B., Liu, H. & Huang, M. Convolutional neural network with data augmentation for sar target recognition. IEEE
Geosci. Remote Sens. Lett. 13, 364–368 (2016).
44. Pekel, J.-F., Cottam, A., Gorelick, N. & Belward, A. S. High-resolution mapping of global surface water and its long-term changes.
Nature 540, 418–422. https://doi.org/10.1038/nature20584 (2016).
45. Schumann, G.J.-P. The need for scientific rigour and accountability in flood mapping to better support disaster response. Hydrol.
Process. 1, (2019).
46. Copernicus Emergency Management System. https://emergency.copernicus.eu/. Accessed: 2019-09-15.
47. UNOSAT. http://floods.unosat.org/geoportal/catalog/main/home.page. Accessed: 2019-09-15.
48. Global Flood Inundation Map Repository. https://sdml.ua.edu/glofimr/. Accessed: 2019-09-15.
49. s2cloudless: Sentinel Hub’s cloud detector for Sentinel-2 imagery. https://github.com/sentinel-hub/sentinel2-cloud-detector.
Accessed: 2019-09-15.
50. Gorelick, N. et al. Google Earth Engine: Planetary-scale geospatial analysis for everyone. Remote Sens. Environ. 202, 18–27. https://
doi.org/10.1016/j.rse.2017.06.031 (2017).
51. Schmitt, M., Hughes, L. H., Qiu, C. & Zhu, X. X. SEN12MS-a curated dataset of georeferenced multi-spectral sentinel-1/2 imagery
for deep learning and data fusion. ISPRS Ann. Photogr. Remote Sens. Spat. Inf. Sci.IV–2/W7, 153–160. https://doi.org/10.5194/
isprs-annals-IV-2-W7-153-2019 (2019).
52. JRC Yearly Water Classification. https://developers.google.com/earth-engine/datasets/catalog/JRC_GSW1_1_YearlyHistory.
Accessed: 2021-01-31.
53. McFeeters, S. K. Using the normalized difference water index (NDWI) within a geographic information system to detect swimming
pools for mosquito abatement: a practical approach. Remote Sens. 5, 3544–3561. https://doi.org/10.3390/rs5073544 (2013).
54. Ronneberger, O., Fischer, P. & Brox, T. U-net: Convolutional networks for biomedical image segmentation. In International Confer-
ence on Medical Image Computing and Computer-Assisted Intervention, 234–241 (Springer, 2015).
55. Sudre, C. H., Li, W., Vercauteren, T., Ourselin, S. & Cardoso, M. J. Generalised dice overlap as a deep learning loss function for
highly unbalanced segmentations. In Deep Learning in Medical Image Analysis and Multimodal Learning for Clinical Decision
Support, 240–248 (Springer, 2017).
56. Huang, B., Reichman, D., Collins, L. M., Bradbury, K. & Malof, J. M. Tiling and Stitching Segmentation Output for Remote Sens-
ing: Basic Challenges and Recommendations. arXiv:1805.12219 [cs] (2019).
57. Jones, J. W. Improved automated detection of subpixel-scale inundation-revised dynamic surface water extent (DSWE) partial
surface water tests. Remote Sens. 11, 374. https://doi.org/10.3390/rs11040374 (2019).
58. Ahmad, S. K., Hossain, F., Eldardiry, H. & Pavelsky, T. M. A fusion approach for water area classification using visible, near infrared
and synthetic aperture radar for south asian conditions. IEEE Trans. Geosci. Remote Sens. 58, 2471–2480. https://doi.org/10.1109/
TGRS.2019.2950705 (2020).
59. Cooley, S. W., Smith, L. C., Stepan, L. & Mascaro, J. tracking dynamic northern surface water changes with high-frequency planet
CubeSat imagery. Remote Sens. 9, 1306. https://doi.org/10.3390/rs9121306 (2017).
60. Ploton, P. et al. Spatial validation reveals poor predictive performance of large-scale ecological mapping models. Nat. Commun.
11, 4540. https://doi.org/10.1038/s41467-020-18321-y (2020).
61. Mateo-Garcia, G., Laparra, V., Lopez-Puigdollers, D. & Gomez-Chova, L. Cross-sensor adversarial domain adaptation of Landsat-8
and Proba-V images for cloud detection. IEEE J. Selected Top. Appl. Earth Obser. Remote Sens.https://doi.org/10.1109/JSTARS.
2020.3031741 (2020).
62. Rambour, C. et al. Flood detection in time series of optical and sar images. Int. Arch. Photogr. Remote Sens. Spat. Inf. Sci. 43,
1343–1346 (2020).
Scientific Reports | (2021) 11:7249 | https://doi.org/10.1038/s41598-021-86650-z 11
Vol.:(0123456789)www.nature.com/scientificreports/
63. Bonafilia, D., Tellman, B., Anderson, T. & Issenberg, E. Sen1Floods11: A georeferenced dataset to train and test deep learning
flood algorithms for sentinel-1. Proceedings of the IEEE/CVF Conference on Computer Vision and Pattern Recognition Workshops
210–211, (2020).
64. Nemni, E., Bullock, J., Belabbes, S. & Bromley, L. Fully Convolutional Neural Network for Rapid Flood Segmentation in Synthetic
Aperture Radar Imagery. Remote Sens.12, 2532, https://doi.org/10.3390/rs12162532 (2020)
65. Gupta, R. et al. Creating xBD: A dataset for assessing building damage from satellite imagery. Proceedings of the IEEE Conference
on Computer Vision and Pattern Recognition Workshops 10–17, (2019).
66. Mateo-Garcia, G. et al. Flood detection on low cost orbital hardware. arXiv preprint arXiv:1910.03019 (2019).
Acknowledgements
This research was conducted at the Frontier Development Lab (FDL), Europe, 2019 led by Trillium Technolo-
gies. The authors gratefully acknowledge support from European Space Agency (ESA); Pierre-Philippe Mathieu
and the team at PhiLab at ESA ESRIN; Google LLC; Intel Corporation; Kellogg College, University of Oxford;
UNICEF representative Dohyung Kim.; James Parr, Jodie Hughes, Leo Silverberg and Sarah McGeehan from Tril-
lium Technologies and other organisations and mentors who supported FDL Europe 2019. G.M.-G. has been sup-
ported by the Spanish Ministry of Science and Innovation (Projects TEC2016-77741-R and PID2019-109026RB-
I00, ERDF). S.O. is supported by the EPSRC Grant EP/L016427/1 and The Financial Times. A.G.B. is supported
by EPSRC/MURI Grant EP/N019474/1 and by Lawrence Berkeley National Lab. J.V.M. is supported by STFC/
GCRF Grant ST/R002673/1.
Author contributions
G.M.-G., J.V.M. and L.S. equally contributed to the overall research. G.M.-G. was responsible for dataset creation
and model performance analysis; S.O., L.S. and J.V.M. developed the model training framework, L.S. also per-
formed testing on embedded hardware. D.B and A.G.B. were the main domain and machine learning supervisors
and were responsible for the conception and guidance of the project, supported by G.S. and Y.G.; they provided
advice on flooding, remote sensing and machine learning aspects; A.G.B. also contributed to the codebase. All
authors reviewed and contributed to the manuscript.
Duplicate publication statement
A short summary of some material in this paper was previously presented at the Humanitarian Aid and Disaster
Response (HADR) workshop at NeurIPS 2019 (Vancouver)66. The pre-print was peer-reviewed for inclusion in
the workshop, which is not archival and does not form part of the NeurIPS conference proceedings. This paper
provides substantially more information and addresses several aspects of the dataset that were not discussed
in the workshop paper (such as the the effects of training on S2 only, the effect of temporal misalignment and
stratification of results on flood and permanent water). We have also extensively curated the training and testing
sets and we include a more thorough discussion of the context of our work, flood mapping, and the satellite we
have targeted for deployment. Alongside this paper, we also release the WorldFloods dataset as well as the code
used to train and benchmark our models.
Competing interests
The authors declare no competing interests.
Additional information
Supplementary Information The online version contains supplementary material available at https://doi.org/
10.1038/s41598-021-86650-z.
Correspondence and requests for materials should be addressed to G.M.-G.
Reprints and permissions information is available at www.nature.com/reprints.
Publisher’s note Springer Nature remains neutral with regard to jurisdictional claims in published maps and
institutional affiliations.
Open Access This article is licensed under a Creative Commons Attribution 4.0 International
License, which permits use, sharing, adaptation, distribution and reproduction in any medium or
format, as long as you give appropriate credit to the original author(s) and the source, provide a link to the
Creative Commons licence, and indicate if changes were made. The images or other third party material in this
article are included in the article’s Creative Commons licence, unless indicated otherwise in a credit line to the
material. If material is not included in the article’s Creative Commons licence and your intended use is not
permitted by statutory regulation or exceeds the permitted use, you will need to obtain permission directly from
the copyright holder. To view a copy of this licence, visit http://creativecommons.org/licenses/by/4.0/.
© The Author(s) 2021
Scientific Reports | (2021) 11:7249 | https://doi.org/10.1038/s41598-021-86650-z 12
Vol:.(1234567890)You can also read